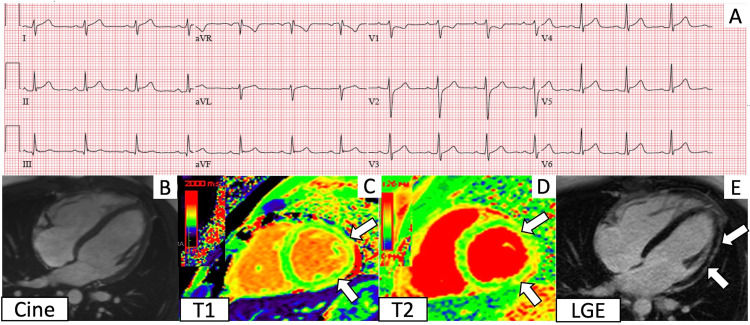
Figure 2. Electrocardiogram (ECG) and cardiac magnetic resonance imaging (CMR) findings corresponding to Case 2.
A. ECG shows diffuse ST elevations. B. 4 chamber cine. C. T1 imaging demonstrates regional elevation in the lateral wall (between the arrows). D. T2 mapping shows elevated T2 values in the lateral wall (between the arrows). E. Late gadolinium enhancement imaging shows subepicardial enhancement (between the arrows) in the same areas of T1 and T2 elevations.

