Abstract
Transposable elements or transposons are major players in genetic variability and genome evolution. Aberrant activation of long interspersed element-1 (LINE-1 or L1) retrotransposons is common in human cancers, yet their tumor-type-specific functions remain poorly characterized. We identified MPHOSPH8 (or MPP8), a component of the HUSH complex, as an acute myeloid leukemia (AML)-selective dependency by epigenetic regulator-focused CRISPR screening. While dispensable for steady-state hematopoiesis, MPP8 loss inhibits AML development by reactivating L1s to induce DNA damage response and cell cycle exit. Activation of endogenous or ectopic L1s phenocopies MPP8 loss, whereas blocking retrotransposition abrogates MPP8-deficiency-induced phenotypes. Expression of AML oncogenic mutations promotes L1 suppression and enhanced L1 silencing is associated with poor prognosis in human AML. Hence, while retrotransposons are commonly recognized for their cancer-promoting functions, we describe a tumor-suppressive role for L1 retrotransposons in myeloid leukemia.
Approximately half of the human genome is comprised of transposable elements, also known as transposons or ‘junk’ DNA. L1 retrotransposons are the only autonomously mobile transposons in humans. There are ~500,000 copies of L1s occupying 17% of the human genome, but only ~100 full-length human-specific L1Hs elements are capable of retrotransposition 1–4. The L1-encoded proteins (ORF1p and ORF2p) also mobilize non-autonomous retrotransposons, noncoding RNAs and mRNAs, leading to the generation of a third of the human genome 2,4–6. As such, L1s have been considered mostly deleterious because their activity can lead to insertional mutagenesis, chromosomal rearrangements, and genome instability that contribute to human disorders including cancer 4,6–9.
Disease-causing L1 retrotransposition was first appreciated in hemophilia A, where mutagenic L1 insertions in the Factor VIII gene were responsible for the disease 7. Recently, pan-cancer genomic analyses revealed that about half of all cancer samples contain somatic retrotransposition events, resulting in L1-associated chromosomal alterations frequently found in solid tumors such as esophageal adenocarcinoma, head-and-neck, lung and colorectal cancers 10,11. However, myeloid malignancies including myeloproliferative neoplasms (MPNs) and AML have the lowest incidences of L1 retrotransposition 10,11. The biological significance and underlying mechanisms for the tumor-type-specific roles of retrotransposons are not known.
Altered epigenetic gene regulation is a hallmark of human cancers including AML, resulting in aberrant self-renewal and blocked lineage differentiation. Dysregulated epigenetic states also create selective and targetable vulnerabilities. The identification of leukemia cell-selective dependencies provides insight into AML pathogenesis and has enabled new therapeutic strategies targeting several epigenetic regulators 12,13. These approaches rely mainly on interfering with the function of chromatin-interacting domains 14,15, underscoring the importance of understanding protein domains in cancer pathophysiology 16. However, a comprehensive survey of epigenetic dependencies of human leukemia cells by a chromatin-domain-focused functional interrogation has been lacking. In addition, epigenetic regulators control the expression of retrotransposons in human cells 17–21, but their roles in regulating tumor-type-specific L1 activity in cancer pathobiology remain largely unexplored.
Here we identified MPP8, a component of the HUSH complex, as a myeloid leukemia-selective dependency. By integrating genetic studies with orthogonal approaches in AML cells, mice and humans, we established evidence that HUSH/MPP8 is dispensable for steady-state hematopoiesis but required for AML development through epigenetic silencing of L1 retrotransposons. Thus, although retrotransposons are historically recognized as sources of genetic instability and somatic mutations to promote cancer development, we describe a tumor-suppressive function for L1 retrotransposons.
Results
HUSH/MPP8 is a dependency of myeloid leukemia
To identify essential chromatin regulators in human leukemia cells, we performed CRISPR knockout (KO) screens using a customized sgRNA library targeting epigenetic regulators (Fig. 1a). We first established leukemia cell lines with doxycycline (Dox)-inducible Cas9 expression (Extended Data Fig. 1a), and confirmed the efficacy of Cas9-mediated gene disruption using a GFP-targeting sgRNA (Extended Data Fig. 1b,c). We next designed a CRISPR library containing 3,248 sgRNAs targeting 498 conserved chromatin-interacting domains found in 266 annotated epigenetic regulators 22 and 1,800 sgRNAs for other epigenetic regulators, together with positive and negative control sgRNAs (Extended Data Fig. 1d and Supplementary Table 1). CRISPR-based negative-selection screens 23 were performed in representative human AML and acute lymphoblastic leukemia (ALL) cell lines: MOLM-13 and REH, respectively. The replicate screens were correlated (Extended Data Fig. 1e) and identified specific epigenetic regulator dependencies in AML and ALL cells (Fig. 1b,c).
Figure 1 |. CRISPR screens identify MPP8 as a vulnerability for myeloid leukemia.
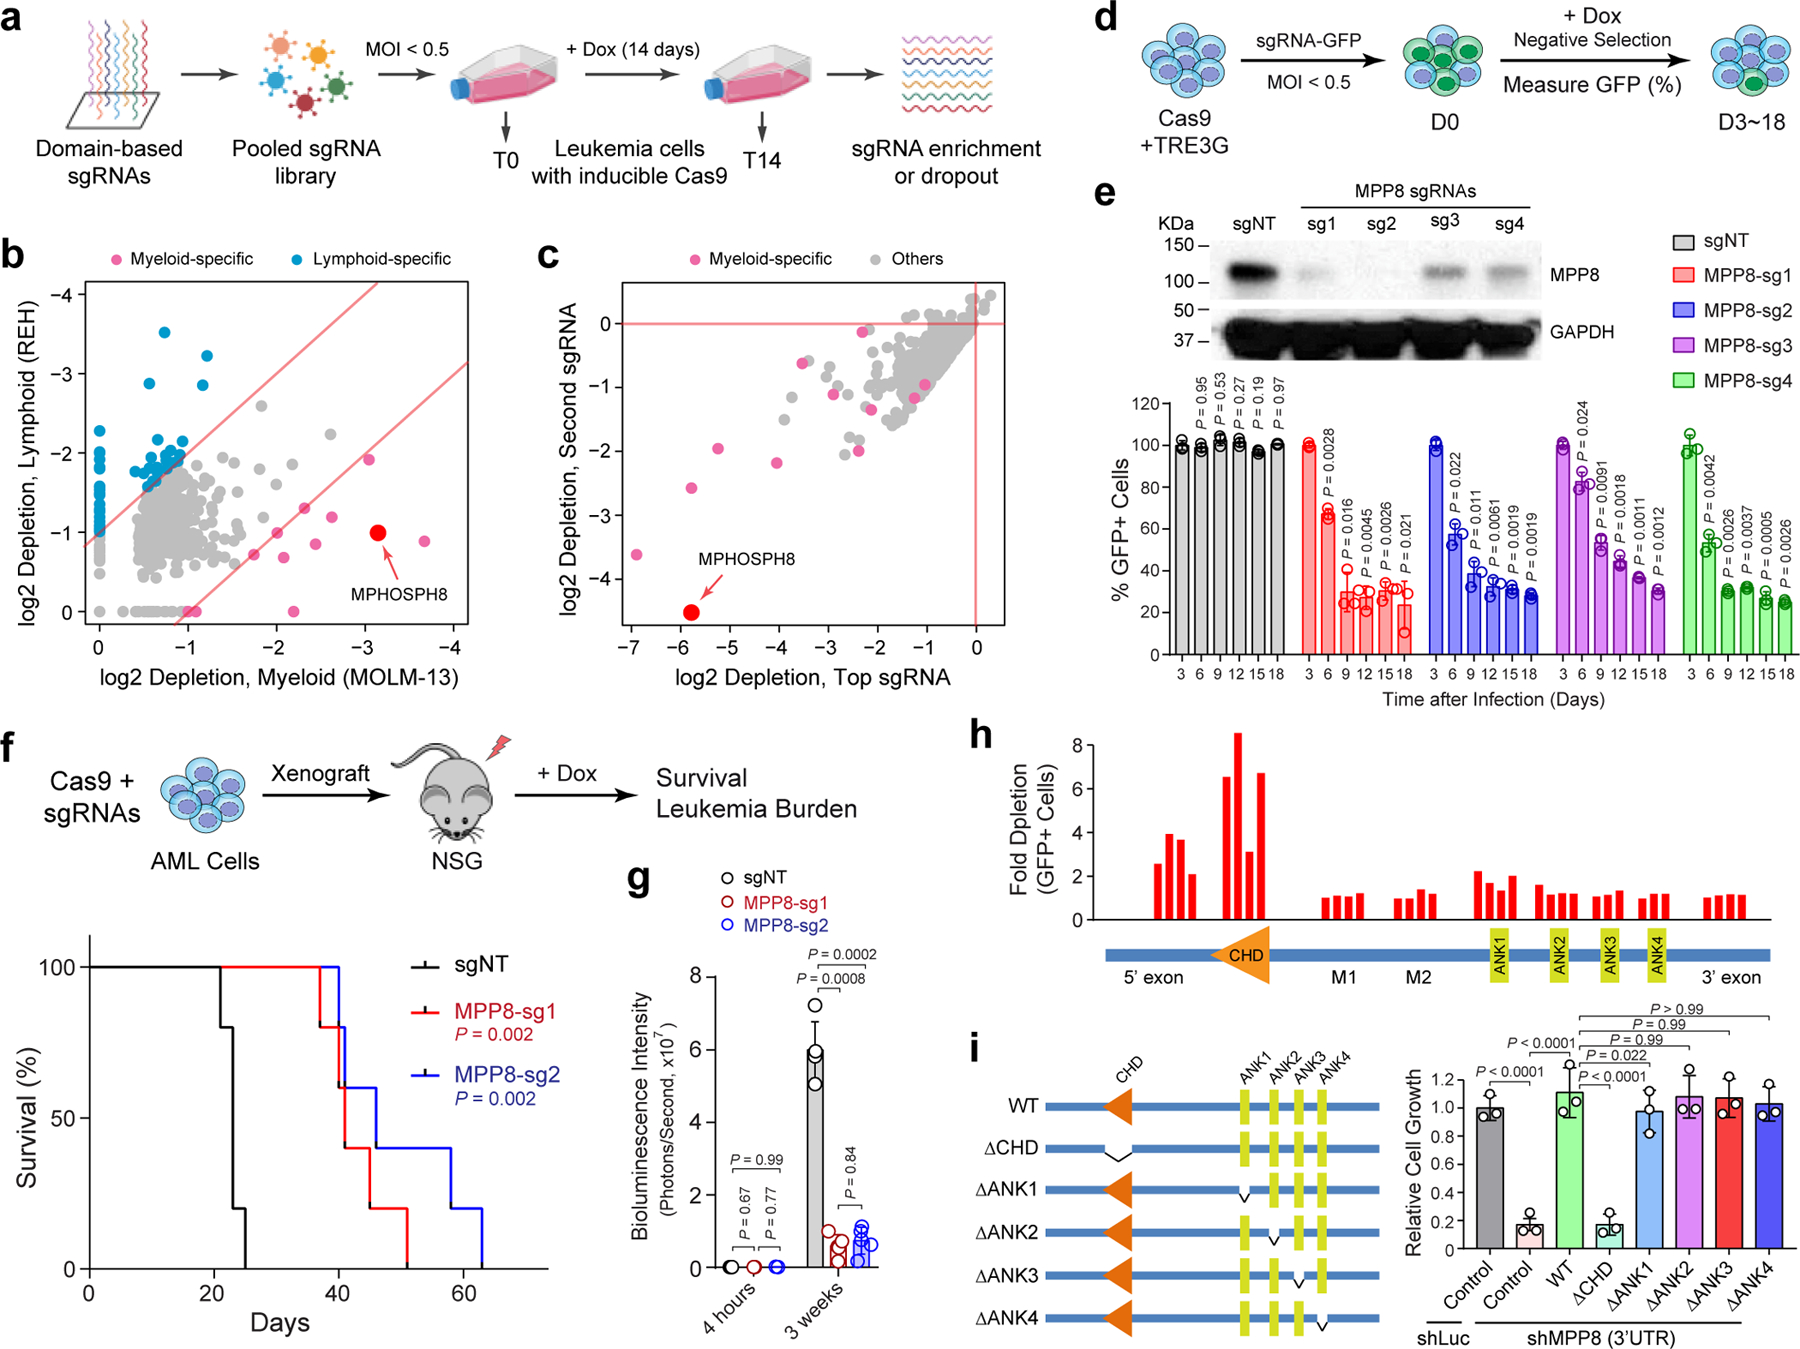
a, Schematic of the domain-focused CRISPR dependency screen. b, Scatterplot depicting the dependency genes identified by CRISPR screens in AML (MOLM-13) and ALL (REH) cells. Red and blue dots indicate myeloid- and lymphoid-specific dependency genes, respectively. x- and y-axis indicate the log2 fold depletion of sgRNA abundance between day 0 and day 14, respectively. Results are based on mean values of all sgRNAs from two independent screens. c, Scatterplot depicting the myeloid-specific dependency genes (red dots) by the top and second dropout sgRNAs between day 0 and day 14 in MOLM-13 cells. d, Schematic of the negative-selection competition assay. e, MPP8 depletion by independent sgRNAs impaired MOLM-13 cell growth relative to the non-targeting control sgRNA (sgNT). Results are mean ± SD and analyzed by a two-way ANOVA with Dunnett’s multiple comparison test. MPP8 depletion was confirmed by Western blot. f, Kaplan-Meier survival curves of NSG mice xenografted with control (sgNT) or MPP8-deficient (MPP-sg1 and MPP8-sg2) MOLM-13 cells. P values by a log-rank Mantel-Cox test. g, Quantification of leukemia burden by bioluminescent imaging 4 hours (baseline) and 3 weeks post-xenograft. Results are mean ± SD (N = 5 mice per group) and analyzed by a two-way ANOVA with Tukey’s multiple comparison test. h, CRISPR-based mutagenesis of MPP8 domains by the negative-selection competition assay in MOLM-13 cells. i, Re-introduction of WT but not CHD-deleted MPP8 rescued the cell growth defects of MPP8-depleted MOLM-13 cells. Results are mean ± SD (N = 3 independent experiments) and analyzed by a two-way ANOVA with Tukey’s test.
Of the few candidates identified as the myeloid leukemia-specific dependencies in MOLM-13 cells, we chose to focus on MPHOSPH8 (or MPP8) as it is the top ranked candidate by sgRNA depletion but not a recognized essential gene (Fig. 1b,c). MPP8 is a subunit of the HUSH complex that functions to repress L1 retrotransposons through heterochromatin formation 18,19,21. To validate the screen results, we first employed a negative-selection competition assay in leukemia cells expressing inducible Cas9 and MPP8-targeting sgRNA with a GFP reporter (sgRNA-GFP) (Fig. 1d,e). Depletion of MPP8 led to significant growth defects, as indicated by decreased % of sgRNA-GFP-expressing cells, in six of seven AML cell lines without apparent effects on three lymphoid leukemia cell lines (Supplementary Fig. 1), validating MPP8 as a myeloid leukemia-selective dependency. Moreover, MPP8-deficient MOLM-13 AML cells were impaired in leukemia development upon xenotransplantation into NOD-scid IL2Rgnull (NSG) mice, resulting in significantly decreased leukemia burden and prolonged survival (Fig. 1f, g). The moribund mice xenografted with MPP8-deficent AML cells restored MPP8 expression likely due to the outgrowth of cells that escaped Cas9-mediated editing (Extended Data Fig. 1f), indicating that loss of MPP8 is incompatible with propagation of AML cells.
MPP8 contains a conserved chromodomain (CHD), which mediates binding to histone H3 lysine 9 trimethylation (H3K9me3) for chromatin silencing, and four Ankyrin repeat domains (ANK1 to ANK4). Using an array of 34 sgRNAs targeting discrete MPP8 domains, we observed that the disruption of CHD displayed the most profound effect on leukemia cell growth (Fig. 1h). We next depleted MPP8 expression using small hairpin RNAs (shRNAs) against the coding or 3’UTR sequences (Extended Data Fig. 1g). MPP8 RNAi phenocopied Cas9-mediated MPP8 KO in MOLM-13 cells, resulting in impaired cell growth (Extended Data Fig. 1h). Importantly, re-introduction of wild-type (WT) but not CHD-deficient MPP8 rescued the growth defects of MPP8-deficient AML cells (Fig. 1i).
HUSH is required for the propagation of myeloid leukemia
HUSH complex consists of MPP8, TASOR and PPHLN1, and recruits the H3K9me3 methyltransferase SETDB1 to chromatin (Extended Data Fig. 2a) 19,21. MORC2 and ATFIP7 were also identified as critical regulators of L1 silencing 18,20. We next determined whether the other L1 regulators are also required for AML by negative-selection competition assays. Depletion of other HUSH subunits (TASOR and PPHLN1), SETDB1, MORC2 or ATFIP7 also impaired MOLM-13 cell growth (Extended Data Fig. 2b,c). TASOR or PPHLN1-depleted MOLM-13 cells were impaired in leukemia development in xenotransplanted NSG mice, resulting in significantly less tumor burden. Compared to the non-targeting (sgNT) control, TASOR or PPHLN1 depletion led to significantly decreased bioluminescence signals of the luciferase-expressing AML cells 3 weeks post-transplantation, reduced spleen size, less leukemic cells in bone marrow, peripheral blood, spleen and liver of xenotransplanted recipients, and prolonged survival (Extended Data Fig. 2d–j). Furthermore, shRNA-mediated MPP8 depletion impaired the colony-forming activity and propagation of human primary AML cells without significant effects on normal CD34+ hematopoietic stem/progenitor cells (HSPCs) upon serial plating ex vivo (Extended Data Fig. 3a,b). The dominant cellular phenotypes resulting from HUSH/MPP8 loss included induction of apoptosis, G0/G1 cell cycle arrest, and enhanced myeloid differentiation as indicated by the increased expression of the myeloid marker CD11b and genes associated with differentiated myeloid cells (Extended Data Fig. 3c–f). Together, these results highlight a critical role for the HUSH complex in the propagation of human AML cells.
MPP8 is dispensable for steady-state hematopoiesis but required for leukemia development
To address the in vivo roles, we generated MPP8 constitutive and conditional KO mice by CRISPR targeting using paired sgRNAs flanking the CHD-domain-containing exon 2 of the Mphosph8 gene (Fig. 2a). MPP8 null or conditional KO alleles were validated by genotyping PCR (Extended Data Fig. 4a–c), and loss of MPP8 expression was confirmed by Western blot analysis of bone marrow and spleen cells (Extended Data Fig. 4d,e). We first noted that the MPP8 homozygous KO (MPP8−/−) mice were born at a lower ratio (Extended Data Fig. 4f), suggesting a partial embryonic lethal phenotype. The viable MPP8−/− mice developed normally with significantly reduced body size and weight (Extended Data Fig. 4g,h).
Figure 2 |. MPP8 is dispensable for hematopoiesis but required for AML development in vivo.
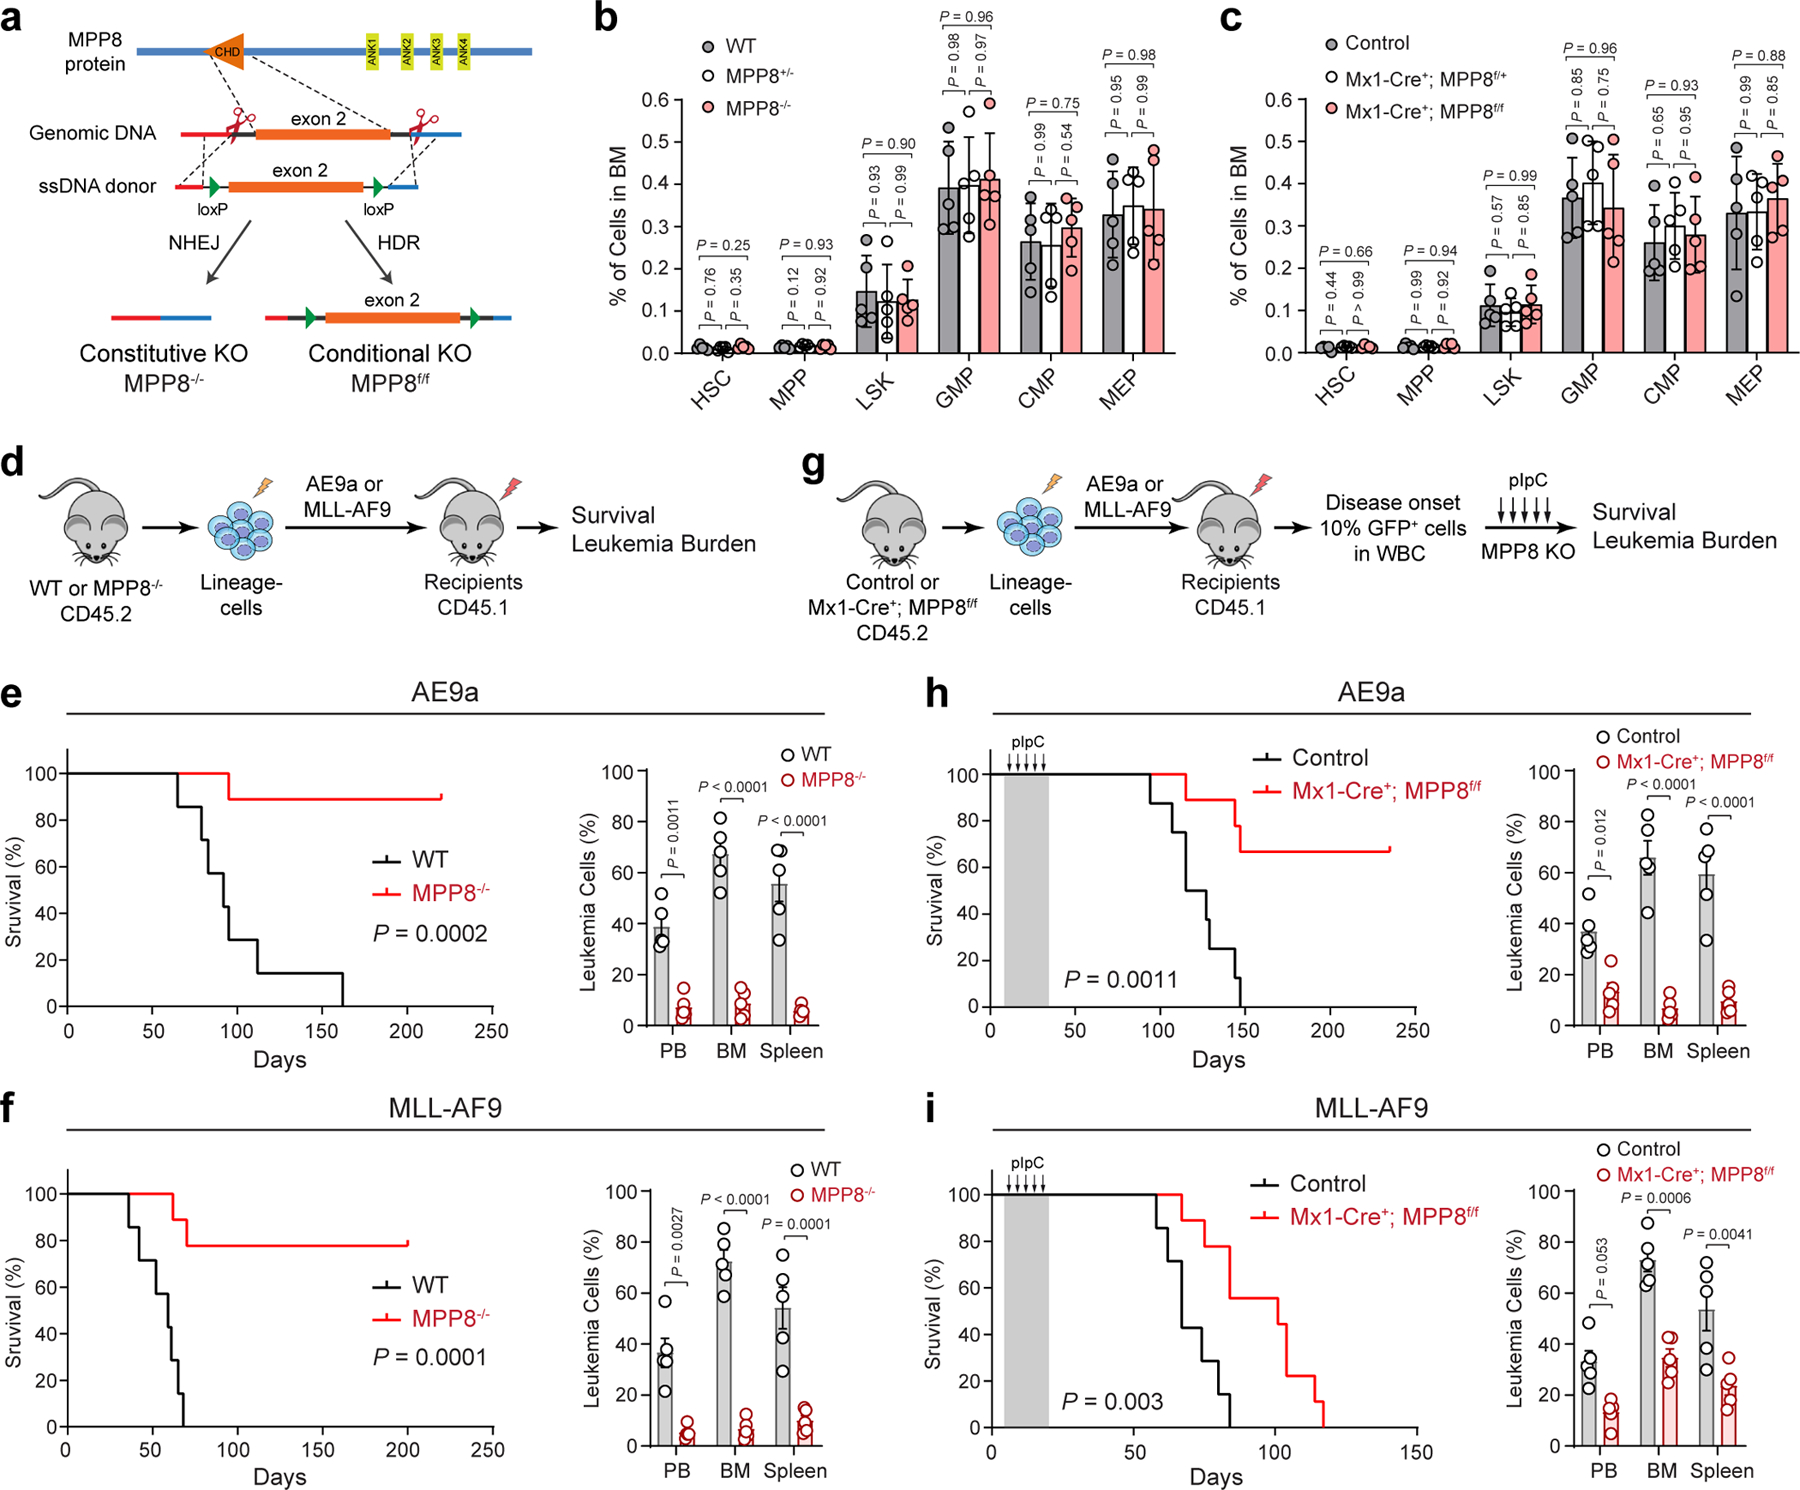
a, Schematic of the MPP8 constitutive and conditional KO mouse models. b,c, Frequencies of hematopoietic stem and progenitor cell populations in bone marrow of MPP8 constitutive heterozygous (MPP8+/−) or homozygous (MPP8−/−) KO (b), or conditional heterozygous or homozygous KO by Mx1-Cre two weeks post-pIpC (c). Results are mean ± SD (N = 5 mice per genotype) and analyzed by a two-way ANOVA with Tukey’s test. d, Schematic of the leukemia initiation experiments. e,f, Kaplan-Meier survival curves of recipient mice engrafted with cells transduced with AE9a (e) or MLL-AF9 (f). N = 7 WT and 9 MPP8−/− mice. P values by a log-rank Mantel-Cox test. Quantification of leukemia burden by % of GFP+ leukemia cells in PB, BM and spleen at day 68 (AE9a) or day 41 (MLL-AF9) post-transplantation is shown, respectively. Results are mean ± SEM (N = 5 mice per group) and analyzed by a two-way ANOVA with Bonferroni’s multiple comparison test. g, Schematic of the leukemia maintenance experiments. h,i, Kaplan-Meier survival curves of recipient mice engrafted with cells transduced with AE9a (h) or MLL-AF9 (i). N = 7 (h) or 8 (i) WT and 9 Mx1-Cre+; MPP8f/f mice. P values by a log-rank Mantel-Cox test. Leukemia burden at day 95 (AE9a) or day 62 (MLL-AF9) post-transplantation is shown. Results are mean ± SEM (N = 5 mice per group) and analyzed by a two-way ANOVA with Bonferroni’s test.
Figure 4 |. Silencing of LINE-1 retrotransposons in myeloid leukemia.
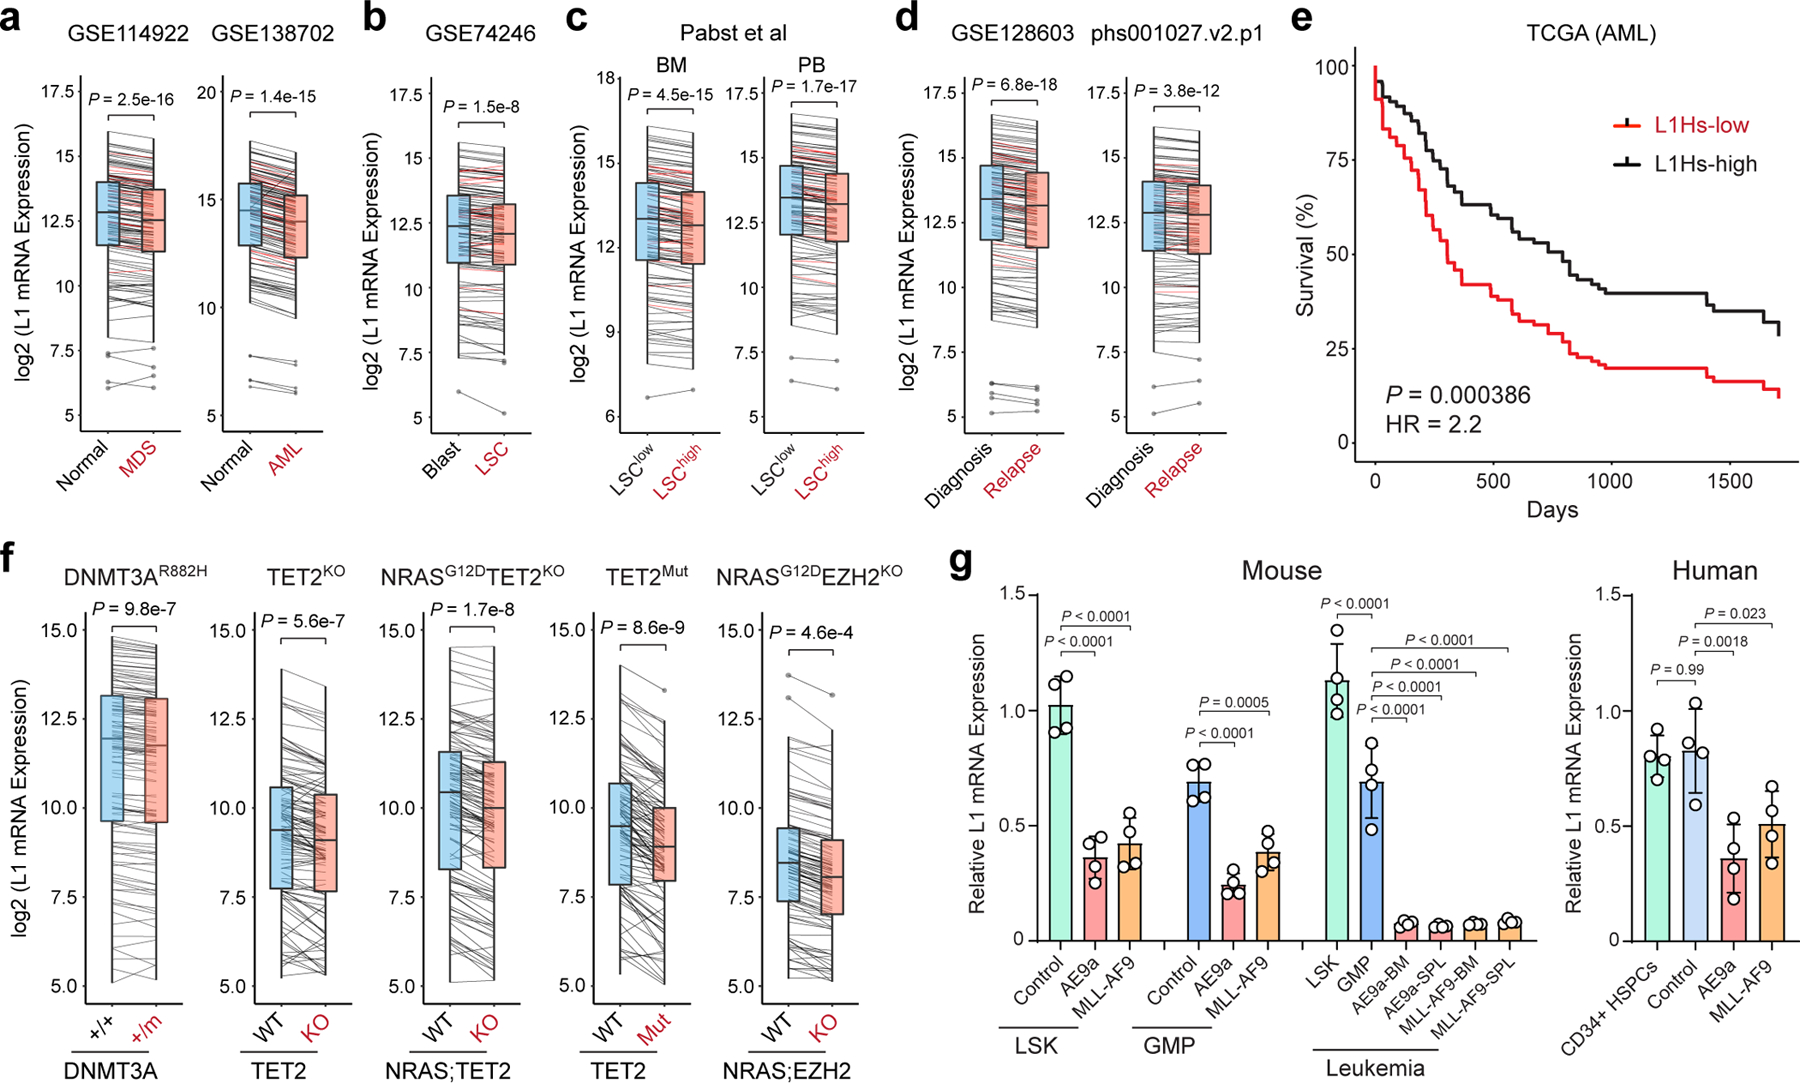
a, Expression of L1Hs (red lines) and other L1s (black lines) was downregulated in human CD34+ MDS and AML cells relative to normal CD34+ HSPCs. y-axis shows the log2 normalized mRNA expression (read counts) of annotated L1s. P value by a two-sided paired t test (N = 131 annotated L1s in 8 normal and 82 MDS, or 10 normal and 9 AML samples). Boxes show median of data and quartiles, and whiskers extend to 1.5× of interquartile range. b, Expression of L1Hs and other L1s was downregulated in human CD34+CD38− AML LSCs relative to blasts. P value by a two-sided paired t test (N = 131 L1s in 8 LSCs and 8 blasts). c, L1s were downregulated in LSChigh relative to LSClow AML samples. Samples derived from BM or PB were grouped. P values by a two-sided paired t test (N = 131 L1s in 13 LSClow and 3 LSChigh BM samples, or 5 LSClow and 3 LSChigh PB samples). d, L1s were downregulated in relapsed relative to diagnosis AML samples. P values by a two-sided paired t test (N = 131 L1s in 10 diagnosis and 10 relapse samples in GSE128603, or 19 diagnosis and 19 relapse samples in phs001027.v2.p1). e, Lower L1 expression is associated with poor survival in TCGA AML cohorts (N = 134 samples). L1Hs-high (top 50%) and L1Hs-low (bottom 50%) samples were compared. P value by a log-rank Mantel-Cox test. f, L1s were downregulated by AML oncogenes in LSK cells. P values by a paired t test (N = 2 DNMT3A+/+ and 4 DNMT3A+/m, 2 TET2 WT and 2 KO, 2 TET2 WT and 2 mutant, 3 WT and 3 NRASG12DTET2KO, or 3 WT and 4 NRASG12DEZH2KO). g, L1s were downregulated by AE9a or MLL-AF9 in LSK or GMP cells, and further downregulated in transplanted recipient mouse BM or spleen (SPL). L1s were also downregulated in human CD34+ HSPCs upon expression of AE9a or MLL-AF9 relative to empty vector (control) or un-transduced cells. Results are mean ± SD (N = 4 experiments) and analyzed by a one-way ANOVA with Dunnett’s or Tukey’s test.
To determine the requirement of MPP8 for hematopoiesis, we performed complete blood counts of peripheral blood and flow cytometry of various mature hematopoietic cell types including erythroid (Ter119+), B-lymphoid (B220+), T-lymphoid (CD3+) and myeloid (Mac1+Gr1+) cells in bone marrow and spleen of WT or MPP8−/− mice, respectively (Extended Data Fig. 5a–c). Our results revealed no overt abnormalities on the frequency of mature hematopoietic cells. The cellularity and frequency of hematopoietic stem/progenitor cell populations, including HSC, MPP, LSK, CMP, GMP, and MEP, in bone marrows of WT, MPP8+/− and MPP8−/− mice were comparable (Fig. 2b; Supplementary Fig. 2). The regenerative capability of MPP8−/− hematopoietic stem cells (HSCs) was also comparable with WT counterparts in multi-lineage reconstitution upon competitive bone marrow transplantation (Extended Data Fig. 5d). We also generated hematopoietic-selective MPP8 conditional KO using an interferon-inducible Mx1-Cre 24 and observed no significant defect in steady-state hematopoiesis (Extended Data Fig. 5e–h).
Having established the non-essential role of MPP8 for hematopoiesis, we next determined the in vivo requirement of MPP8 for leukemia development. We used two well-established murine AML models that mimic human AML containing a translocation between RUNX1 and ETO (AE9a) 25, or MLL1 and AF9 (MLL-AF9) genes 26. We introduced AE9a or MLL-AF9 into WT and MPP8−/− bone marrow lineage-negative cells by retroviruses marked with GFP and injected into lethally irradiated recipients (Fig. 2d). While WT cells transformed with AE9a or MLL-AF9 caused lethal leukemia with a median survival 98 or 65 days, MPP8-deficient cells transformed with AE9a or MLL-AF9 failed to cause lethal leukemia in 78% or 89% of mice, respectively (Fig. 2e,f), despite no difference in homing efficiency (Extended Data Fig. 5i). MPP8 loss resulted in markedly decreased leukemia burden in peripheral blood, bone marrow and spleen (Fig. 2e,f). These results strongly suggest that MPP8−/− hematopoietic cells are incapable of perpetuating myeloid leukemia in vivo.
To explore the role of MPP8 in established leukemia, we generated MPP8 conditional KO by the interferon-inducible Mx1-Cre. Un-induced control (Mx1-Cre−;MPP8f/f) or Mx1-Cre+;MPP8f/f bone marrow lineage-negative cells were transformed with AE9a or MLL-AF9, transplanted into syngeneic recipients, and administered with polyI:polyC (pIpC) to induce MPP8 deletion after confirming leukemia initiation by the presence of GFP+ leukemic cells in peripheral blood (Fig. 2g; Extended Data Fig. 5j). Mice bearing MPP8 KO (Mx1-Cre+;MPP8f/f) leukemic cells showed a marked survival advantage and less leukemia burden compared with controls (Fig. 2h,i). No significant changes in expression of the known AE9a or MLL-AF9 gene targets were noted in MPP8-depleted AML cells (Extended Data Fig. 5k). Moreover, the MLL-AF9-transformed leukemia cells displayed efficient MPP8 depletion after 2 to 4 weeks of pIpC administration, but progressively restored MPP8 expression after 6 to 8 weeks and in the moribund mice likely due to the selection of cells that escaped Cre-mediated excision (Extended Data Fig. 5l). Hence, although MPP8 is dispensable for normal hematopoiesis, inactivation of MPP8 is incompatible with the initiation or maintenance of myeloid leukemia in vivo.
MPP8 is required for the epigenetic silencing of L1 retrotransposons
To identify the underlying mechanisms, we examined MPP8-dependent gene expression by strand-specific pair-end RNA-seq in MPP8 WT and KO MOLM-13 AML cells. We adapted the optimized methods for the alignment and quantification of L1 transcripts including the evolutionarily young L1s 18,27. Nearly all annotated L1 elements were upregulated in MPP8 KO relative to WT AML cells (Fig. 3a). The evolutionarily young, primate-specific L1s including the retrotransposition-competent L1Hs subfamily were among the most upregulated L1s (Fig. 3a). GSEA also revealed a marked upregulation of the human L1 gene signature in MPP8 KO cells (Fig. 3b). To validate the transcriptomic analyses, we performed qRT-PCR using primers designed to selectively target L1 subfamilies including L1Hs, L1PA15/16, L1PB and L1M. We observed that L1Hs mRNAs were significantly upregulated upon MPP8 loss in MOLM-13 and OCI-AML3 cells, whereas other L1 subfamilies were modestly upregulated (Fig. 3c). Moreover, inactivation of other HUSH components (TASOR and PPHLN1) or SETDB1 also reactivated young L1s in AML cells (Extended Data Fig. 6a), suggesting that both the reading and writing function of HUSH-mediated H3K9me3 is required for the epigenetic silencing of L1 retrotransposons.
Figure 3 |. MPP8 loss reactivates L1 retrotransposons in myeloid leukemia.
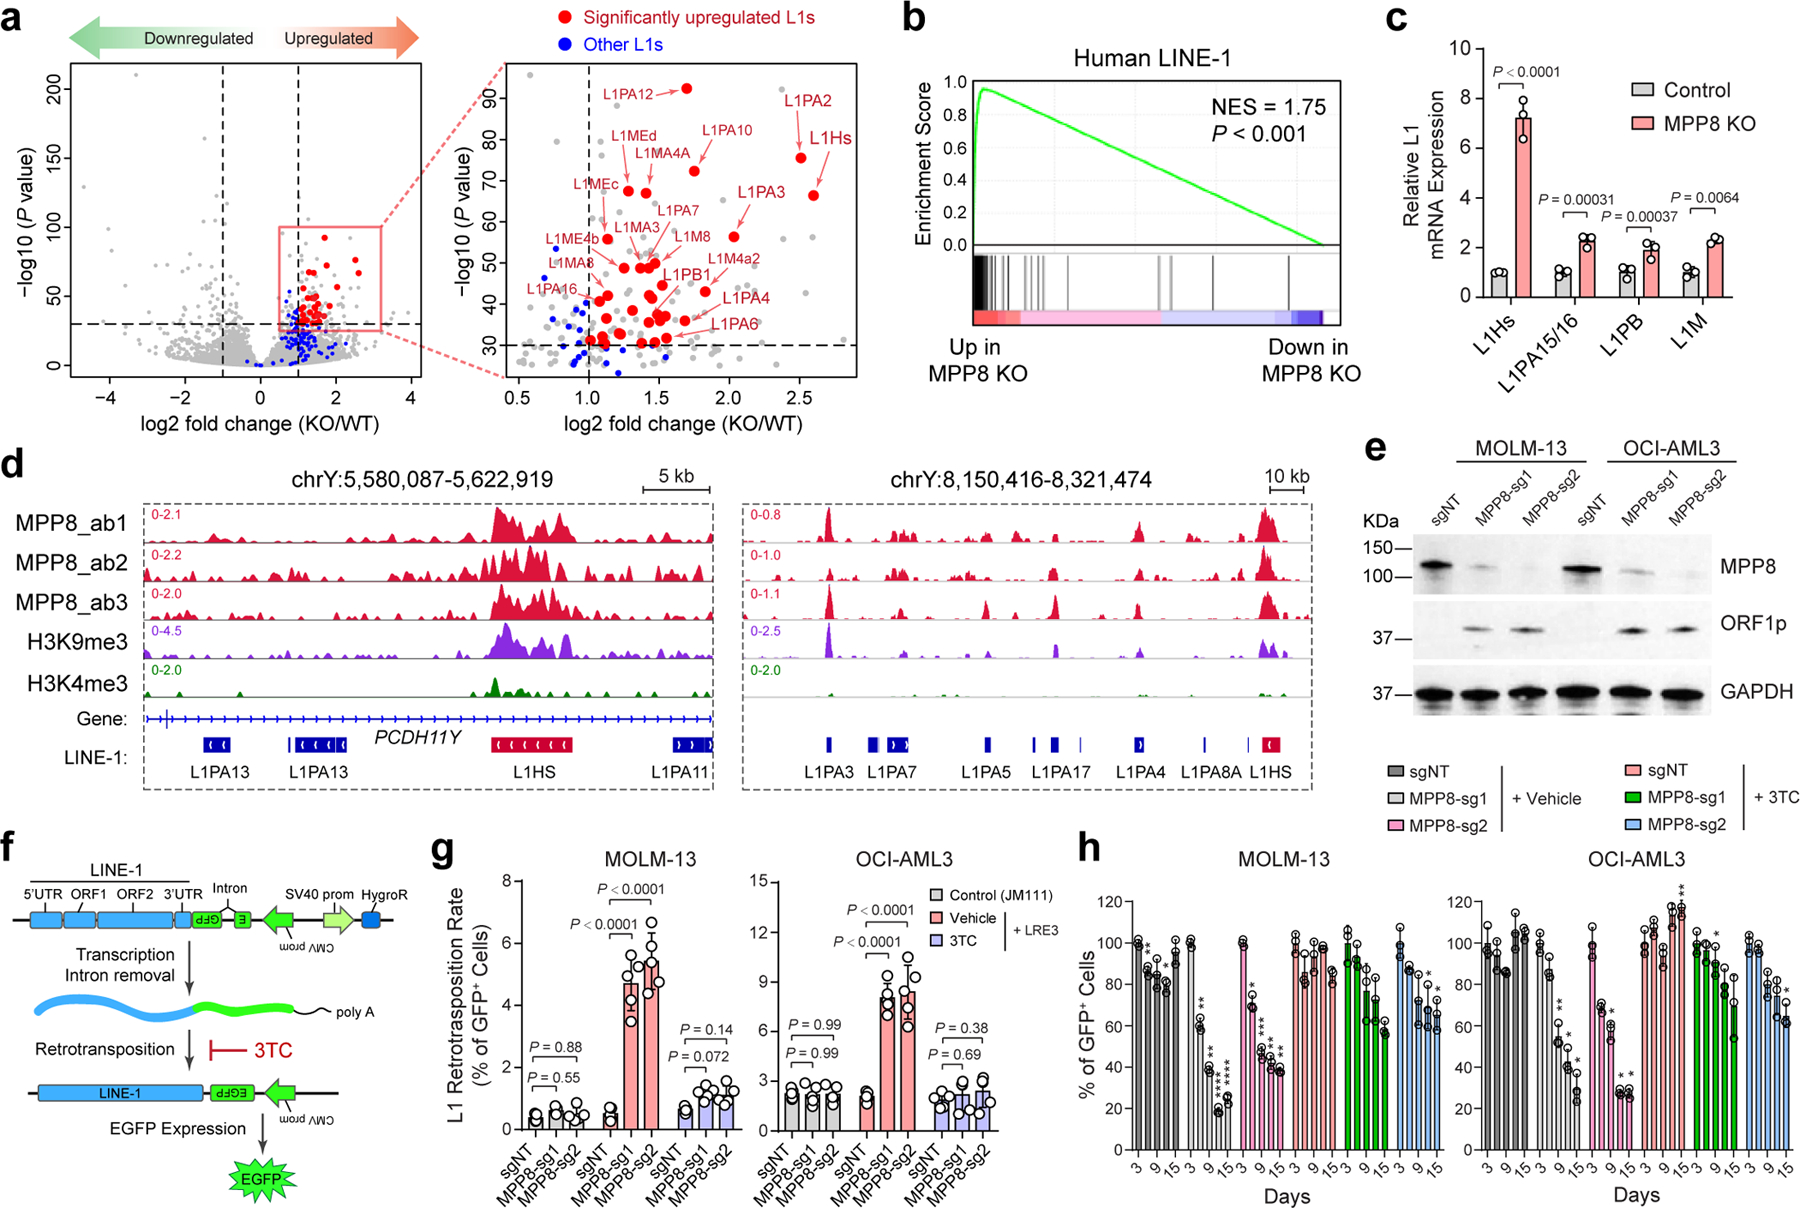
a, Scatterplots of differentially expressed genes in MPP8 KO relative to WT MOLM-13 AML cells by strand-specific pair-end RNA-seq (fold change ≥ 2 and FDR-adjusted P value ≤ 10−30 by DESeq2). A zoom-in view of the upregulated genes is shown with significantly upregulated L1s (red dots) and all other L1s (blue dots). b, Upregulation of human L1 gene signature in MPP8 KO MOLM-13 cells by GSEA. The normalized enrichment score (NES) and nominal P value based on permutation-generated null distribution are shown. c, Activation of L1Hs and other L1 subfamilies in MPP8-deficient MOLM13 cells. Results are mean ± SD (N = 3 independent experiments) and analyzed by a two-sided unpaired t test. d, Browser view of representative L1 loci with significant enrichment of MPP8 and H3K9me3 ChIP-seq signals. e, Expression of L1-encoded ORF1p was significantly upregulated in MPP8-deficient AML cells by Western blot. GAPDH was analyzed as a loading control. f, Schematic of the L1 retrotransposition reporter assay. g, L1 retrotransposition rates were increased in MPP8 KO relative to control (sgNT) AML cells, and inhibited by 10 µM of 3TC treatment after Dox-induced MPP8 KO. Results are mean ± SD (N = 5 independent experiments) and analyzed by a two-way ANOVA with Dunnett’s test. h, Inhibition of L1 retrotransposition by 3TC abrogated the cell growth defects of MPP8-deficient AML cells. Results are mean ± SD (N = 3 independent experiments) and analyzed by a two-way ANOVA with Dunnett’s test. P values are shown in Supplementary Table 7. *P < 0.05, **P < 0.01, ***P < 0.001, ****P < 0.0001.
To determine whether MPP8 directly regulates L1s, we performed MPP8 ChIP-seq using independent antibodies in MOLM-13 cells (ab1, ab2 and ab3; Fig. 3d). MPP8 ChIP-seq signals were highly enriched at L1s including full-length L1Hs (Fig. 3d; Extended Data Fig. 6b,c). MPP8 was also enriched at L1Hs-associated chromatin and MPP8 depletion reactivated young L1s in human primary AML cells (Extended Data Fig. 6d,e). Moreover, the expression of the L1-encoded ORF1p was significantly upregulated in MPP8-deficient AML cells (Fig. 3e), illustrating that some of the reactivated L1s contain intact ORFs and are capable of generating full-length L1 proteins. These results strongly suggest that MPP8 is required for the silencing of L1 retrotransposons, and its loss leads to derepression of L1 mRNA and proteins in myeloid leukemia.
These findings establish roles for HUSH/MPP8-mediated L1 silencing in leukemia cells, but do not address whether L1-mediated retrotransposition can be reactivated upon MPP8 loss. Thus, we introduced an L1 retrotransposition reporter stably into AML cells (Fig. 3f). Briefly, an EGFP reporter interrupted by an intronic sequence under the control of a CMV promoter was introduced into the 3’UTR of a full-length L1 in an antisense orientation (LRE3-EGFP). Upon L1 transcription, splicing, reverse transcription and integration into the genome, the retrotransposed and reconstituted EGFP is activated, providing a measurement of the processing of L1 RNA intermediate and subsequent de novo retrotransposition 28,29. As a negative control, we also established AML cells stably expressing the retrotransposition-defective L1RP/JM111 reporter with missense mutations in ORF1p 29. Using this assay, we observed that the retrotransposition rates in MPP8 WT MOLM-13 and OCI-AML3 cells were 0.5% and 2.0%, respectively, indicating low basal L1 activity in AML cells. By contrast, MPP8-depleted cells showed increased retrotransposition rates at 4.7~5.4% and 8.0~8.4%, respectively (Fig. 3g; Extended Data Fig. 6f). L1 reverse transcription and subsequent retrotransposition can be effectively blocked by a nucleoside reverse transcriptase inhibitor (NRTI) 3TC (or lamivudine) 30–32 (Fig. 3f,g; Extended Data Fig. 6f). Inhibiting L1 retrotransposition by 3TC abrogated the growth defects of MPP8-depleted cells (Fig. 3h), suggesting that the reactivated L1 retrotransposition is required for MPP8-deficiency-induced phenotypes in myeloid leukemia.
Expression of AML oncogenes promotes L1 suppression
To assess the generality of our findings in human myeloid malignancies, we examined L1 expression in human primary CD34+ myelodysplastic syndrome (MDS) and AML samples together with normal HSPCs. Strikingly, expression of L1s was significantly downregulated in MDS and AML samples (Fig. 4a). AML is organized in a loose hierarchy sustained by a subpopulation of self-renewing leukemia stem cells (LSCs) that give rise to a larger population of more mature leukemic blasts 33,34. The presence of LSCs has been implicated in posttreatment relapse in leukemia patients 34,35. Of note, enhanced suppression of L1s was observed in human CD34+CD38− LSCs relative to leukemic blasts (Fig. 4b), as well as in functionally validated LSChigh relative to LSClow AML cells by limiting dilution and transplantation analyses (Fig. 4c) 36. L1 expression is also lower in AML samples of relapsed patients post-hematopoietic cell transplant (HCT) and/or chemotherapy than at diagnosis 37,38 (Fig. 4d), suggesting that the activity of L1s contributes to therapy response in AML. Importantly, decreased L1Hs expression is associated with significantly worse survival in AML patients (Fig. 4e; Extended Data Fig. 6g), illustrating a potential ‘tumor-suppressive’ role for L1s in myeloid leukemia.
Given the heterogeneous nature of human myeloid malignancies, we surveyed L1 expression in hematopoietic stem/progenitor (LSK) cells isolated from genetically engineered mouse models containing common AML oncogenic lesions including DNMT3AR878H mutation 39, TET2 KO alone or together with NRASG12D 40, TET2 mutation 41, or NRASG12D with EZH2 KO 42. Notably, L1s were markedly downregulated by the expression of AML oncogenic mutations (Fig. 4f), raising the possibility that AML oncogenes may induce HUSH/MPP8-mediated L1 suppression. Consistent with this notion, the expression of HUSH components and other L1 regulators was ranked the highest in AML compared to other cancer types (Supplementary Fig. 3) 18–21,43.
To test this experimentally, we measured endogenous L1 mRNA expression in mouse hematopoietic stem/progenitor cells (LSK and GMP) and human primary CD34+ HSPCs upon short-term (72 hours) expression of the AML oncogene AE9a or MLL-AF9 ex vivo, or after long-term (2 months) expression in transplanted recipient mice. We noted that short-term AE9a or MLL-AF9 expression led to 38.5% to 64.7% downregulation of L1s, whereas long-term oncogene expression further downregulated L1s by 92.6% to 94.3% (relative to LSK; Fig. 4g). AE9a or MLL-AF9 expression also significantly downregulated L1 expression in human CD34+ HSPCs (Fig. 4g). Together, these results support a model whereby oncogene-induced transformation and propagation of AML-initiating cells require the silencing of L1 retrotransposons.
Reactivating L1 retrotransposition impairs myeloid leukemia
The dominant effect of MPP8 loss on L1 expression and retrotransposition indicates that the functional consequences of MPP8 deficiency may be mediated by L1 reactivation in leukemia cells. We tested this by activating endogenous L1s using CRISPR-mediated epigenetic modulation of L1 promoters. Due to high copy number and variation of retrotransposons, modulating endogenous L1 expression has been challenging. To this end, we first engineered an improved CRISPR-based activation (CRISPRa) system by combining the dCas9-VPR (VP64-p65AD-Rta) fusion protein 44 and the sgRNA design with MS2 hairpins, which are recognized by the MCP RNA binding domain fused to co-activators (VP64 and p65-HSF1) 45 (Fig. 5a). We next surveyed an array of 10 sgRNAs targeting L1Hs consensus promoter sequence individually and in combinations, and identified two triple-sgRNA combinations (L1-sg278 and L1-sg457) that effectively activated endogenous L1 mRNA and protein (Extended Data Fig. 7a–d). Importantly, the expression of the evolutionarily young L1s but not the other older L1 subfamilies were markedly upregulated by CRISPRa in AML cells (Fig. 5b). Using this new system, we observed that activation of endogenous L1s resulted in increased L1 retrotransposition and impaired leukemia cell growth in vitro and in xenotransplants, whereas inhibiting L1 retrotransposition by 3TC abrogated these phenotypes (Fig. 5c,d; Extended Data Fig. 7e–h).
Figure 5 |. Reactivation of L1 retrotransposition impairs AML in vitro and in vivo.
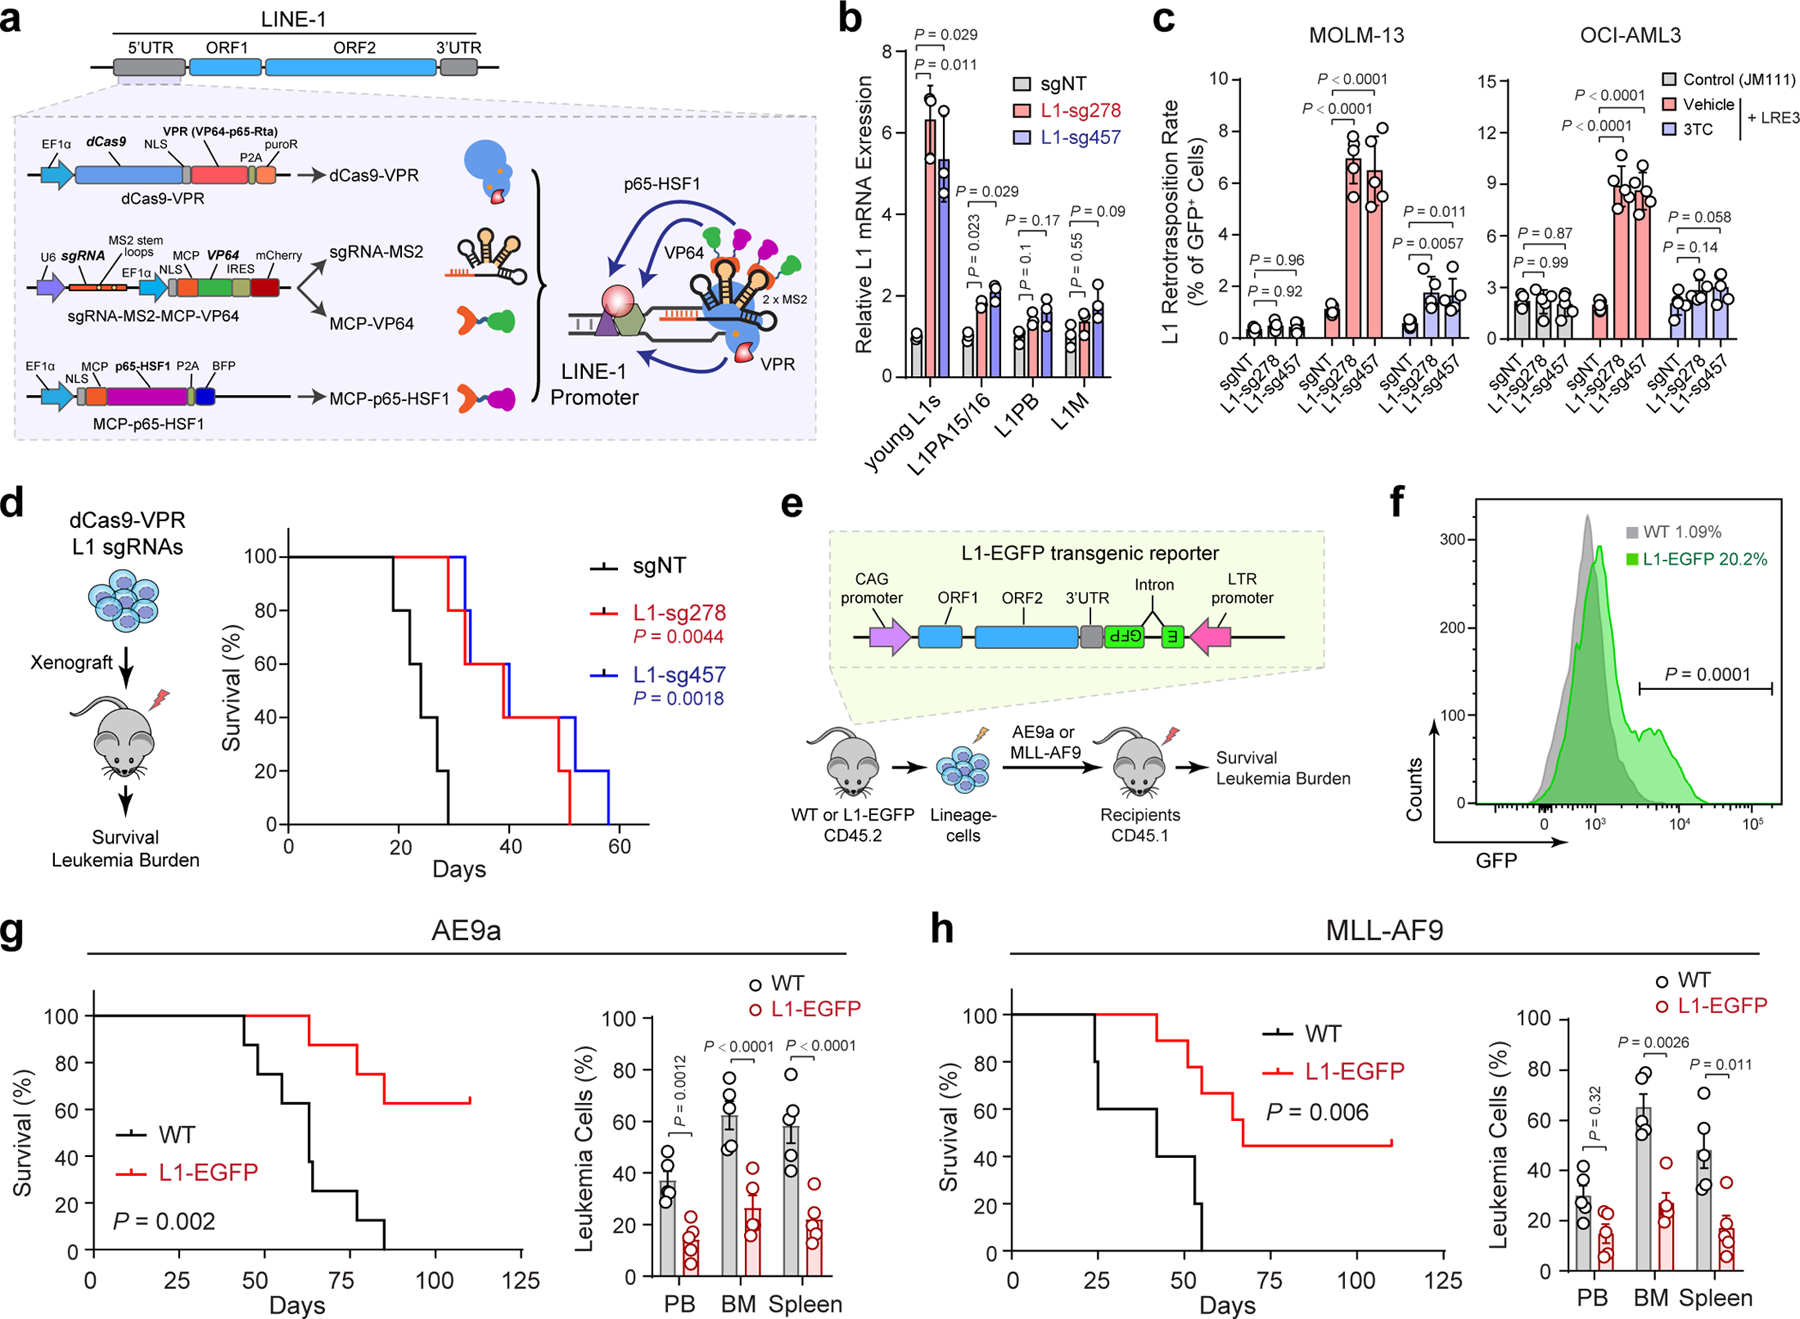
a, Schematic of CRISPR-mediated activation (CRISPRa) of endogenous L1s. sgRNAs were designed against the promoter (5’UTR) region of L1Hs. b, Expression of young L1s was upregulated in MOLM-13 cells upon CRISPRa-mediated activation by multiplexed targeting of L1 promoters with the triple-sgRNA combinations (sg278 or sg457). Results are mean ± SD (N = 3 independent experiments) and analyzed by a two-way ANOVA with Dunnett’s test. c, L1 retrotransposition rates were determined in MOLM-13 and OCI-AML3 cells upon CRISPRa-mediated L1 activation. 3TC treatment (10 µM) abrogated L1 retrotransposition. Cells stably expressing the retrotransposition-deficient JM111 reporter were analyzed as controls. Results are mean ± SD (N = 5 independent experiments) and analyzed by a two-way ANOVA with Dunnett’s test. d, Kaplan-Meier survival curves of NSG mice xenografted with control (sgNT) or L1-reactivated MOLM-13 cells. N = 5 per group. P values by a log-rank Mantel-Cox test. e, Schematic of activating L1 retrotransposition during leukemia development using the L1-EGFP transgenic mouse. f, Activated L1 retrotransposition as determined by GFP+ cells in BM lineage-negative cells of L1-EGFP mice. C57BL/6 WT mice were analyzed as controls. N = 4 WT and 4 L1-EGFP. P value by a two-sided t test. g, Kaplan-Meier survival curves of recipient mice upon transplantation of AE9a-transformed cells from WT or L1-EGFP mice. N = 8 WT and 8 L1-EGFP mice. P value by a log-rank Mantel-Cox test. Quantification of leukemia burden in PB, BM and spleen at day 60 is shown. Results are mean ± SD (N = 5 mice per genotype) and analyzed by a two-way ANOVA with Bonferroni’s test. h, Kaplan-Meier survival curves of recipient mice after transplantation of MLL-AF9-transformed cells. N = 5 WT and 9 L1-EGFP mice. P value by a log-rank Mantel-Cox test. Leukemia burden in PB, BM and spleen at day 38 post-transplantation is shown. Results are mean ± SD (N = 5 mice per genotype) and analyzed by a two-way ANOVA with Bonferroni’s test.
To determine the effect of L1 activation on leukemia development in vivo, we employed a transgenic mouse model harboring tandem copies of a full-length L1 driven by a constitutive CAG promoter together with an EGFP reporter (L1-EGFP mouse; Fig. 5e) 46,47. Notably, L1-activated lineage-negative cells from L1-EGFP mice failed to cause AE9a or MLL-AF9-induced leukemia in a subset of recipient mice, resulting in prolonged survival and markedly decreased leukemia burden in peripheral blood, bone marrow and spleen (Fig. 5f–h). Taken together, these results demonstrate that L1 reactivation in hematopoietic cells negatively affects the development of myeloid leukemia similarly as MPP8 loss, indicating that reactivated L1 retrotransposition underlies MPP8-deficiency-induced phenotypes.
L1 suppression safeguards genome stability in myeloid leukemia
The above findings highlight a regulatory pathway involving oncogene-induced and HUSH-mediated L1 suppression in AML pathogenesis. What remains to be addressed is how MPP8 loss or L1 reactivation interferes with the leukemogenic activity of AML oncogenes. A hallmark feature of AML oncogenic drivers is their ability to inhibit myeloid differentiation and promote malignant self-renewal of hematopoietic precursor cells. Maintenance of genomic stability is required for the self-renewal of cancer stem cells 33. Loss of genome integrity due to DNA damage caused by inactivation of DNA damage response proteins (e.g. ATM, ATR and BRCA1) 48 or epigenetic regulators (e.g. MLL4 and LSD1) 48–52 promotes differentiation of AML-initiating cells. L1 retrotransposition is a major source of genomic instability by creating double-strand DNA breaks 53,54, which activate the phosphorylation of histone H2A.X (γH2A.X) and the cyclin-dependent kinase inhibitor p21 (or CDKN1A) to regulate G1-S checkpoint in response to DNA damage.
To this end, we examined the formation of γH2A.X-marked genomic loci and p21 expression in AML cells. Compared to the negative control (sgNT), MPP8 depletion or L1 reactivation significantly increased γH2A.X foci in MOLM-13 and OCI-AML3 cells, which were abrogated by 3TC-mediated inhibition of L1 retrotransposition (Fig. 6a–d). Similarly, MPP8 depletion or L1 reactivation upregulated p21, whereas 3TC-mediated inhibition of retrotransposition blunted L1-induced DNA damage (Fig. 6e,f). Significant increases in γH2A.X and p21 were also noted in MLL-AF9-transformed leukemia cells in vivo upon MPP8 deletion or L1 activation (Fig. 6g,h), suggesting that L1 activity induces DNA damage in AML.
Figure 6 |. MPP8 suppresses L1s to safeguard genome stability in myeloid leukemia.
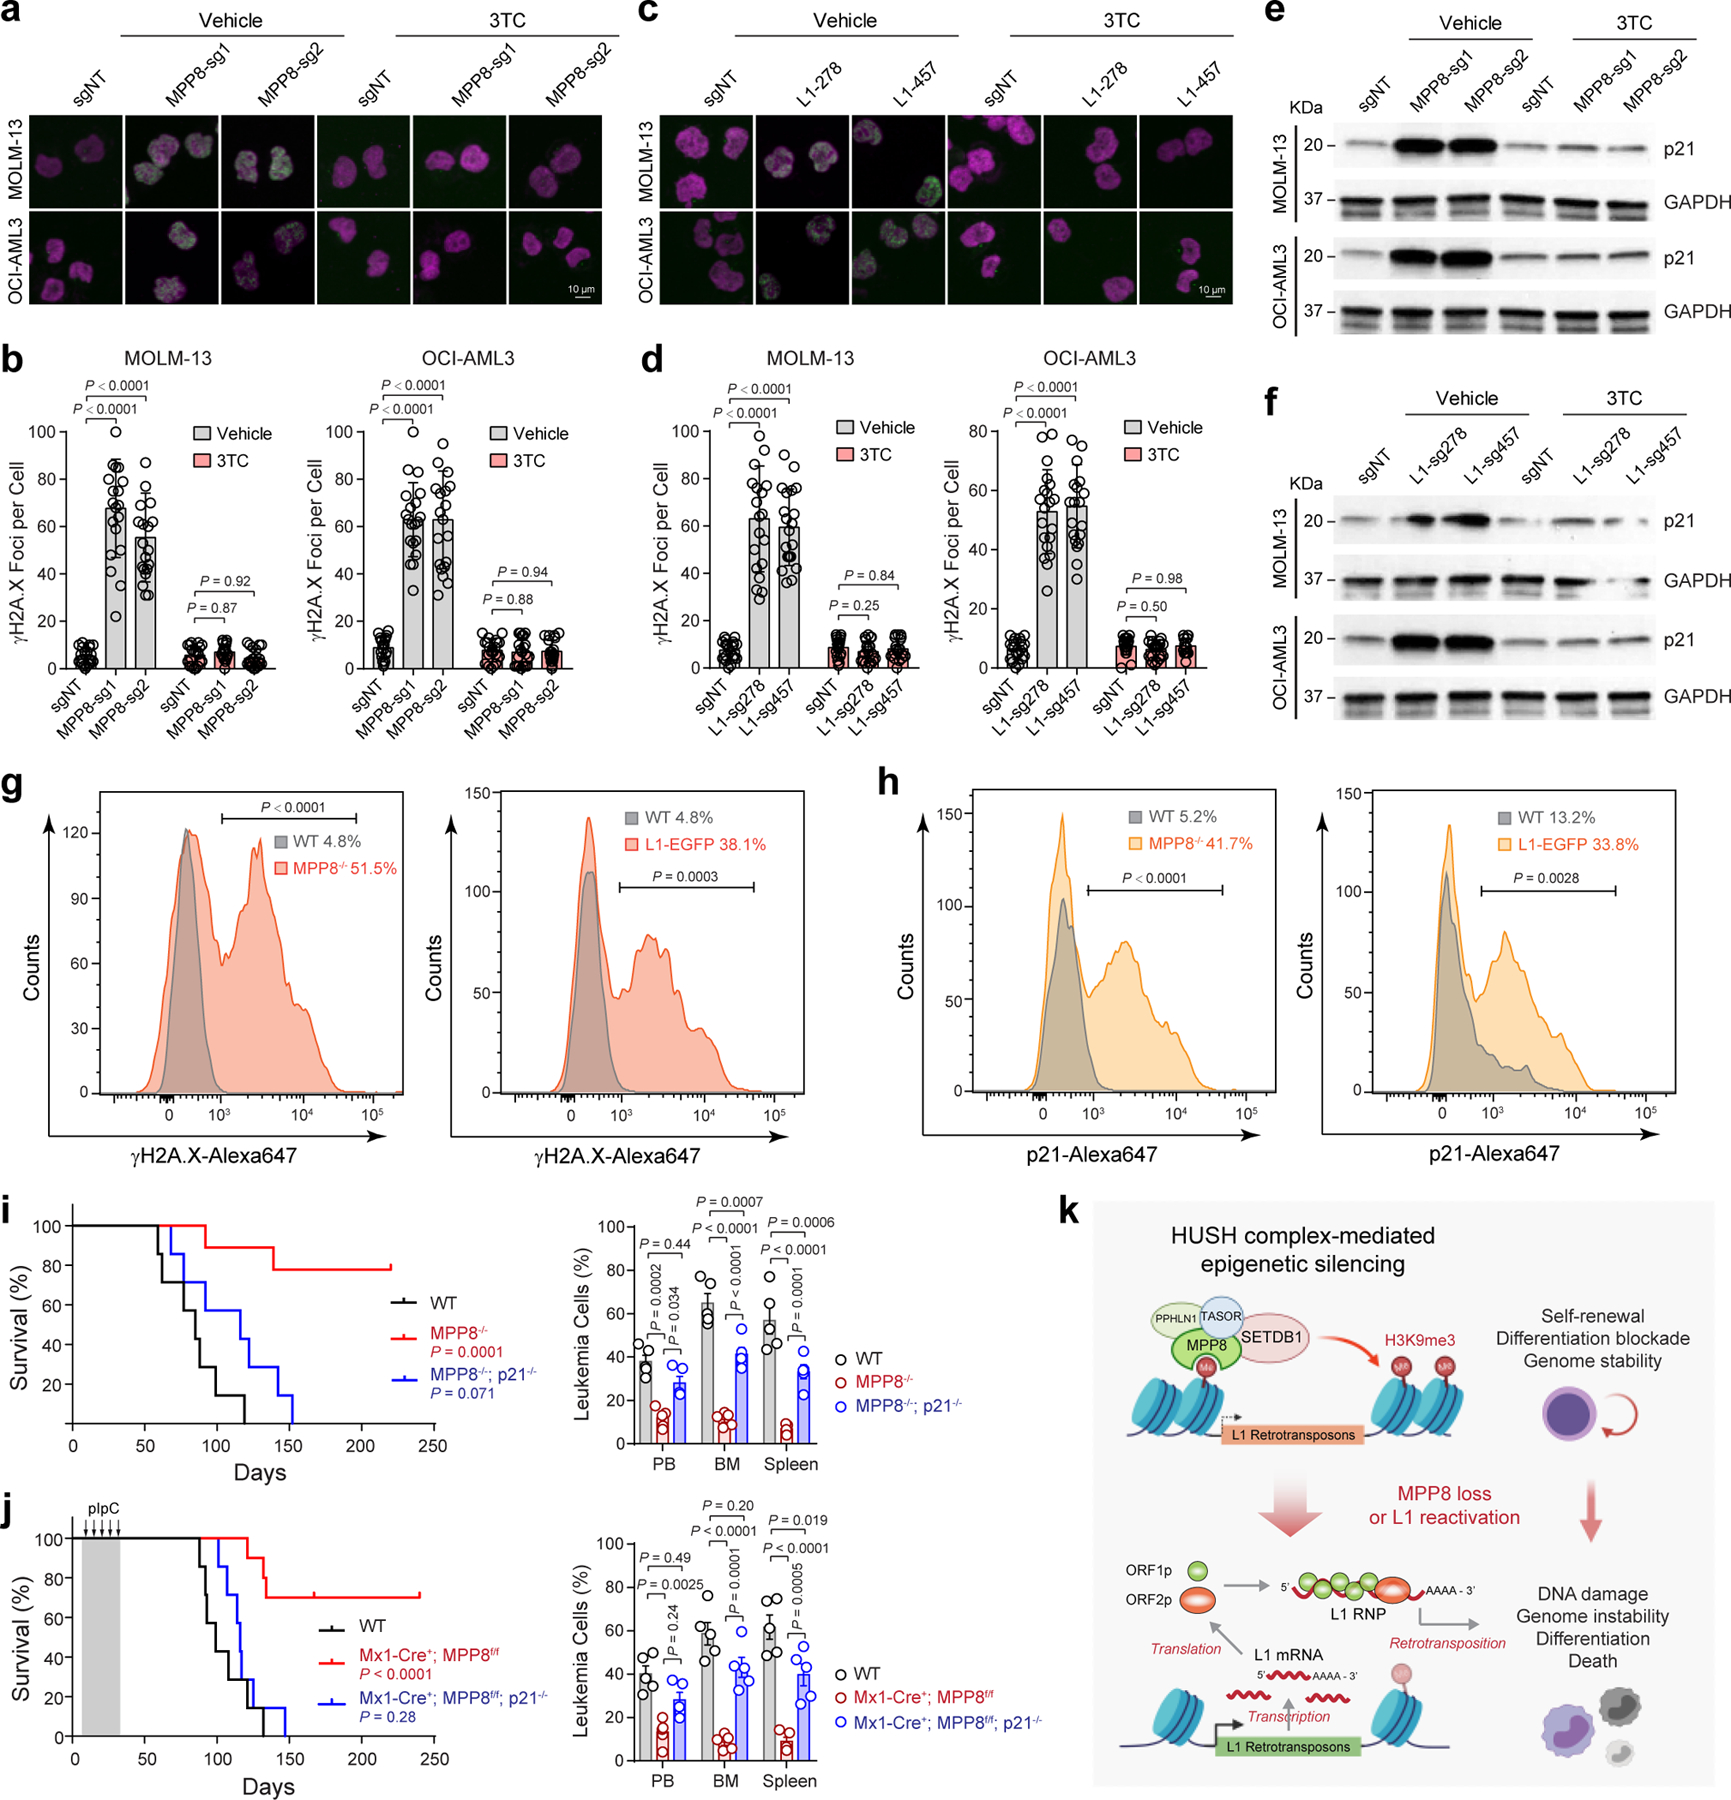
a, MPP8 loss increased γH2A.X foci (green) relative to control (sgNT) in AML cells, whereas 3TC treatment (10 µM for 3 days) abrogated the DNA damage response. b, Quantification of γH2A.X foci in control and MPP8-deficient AML cells with vehicle or 10 µM of 3TC. Results are mean ± SD (N = 20 cells over 3 independent experiments) and analyzed by a two-way ANOVA with Dunnett’s test. c, L1 reactivation increased γH2A.X foci in AML cells, which were abrogated by 3TC treatment (10 µM for 3 days). d, Quantification of γH2A.X in control and L1-reactivated AML cells. Results are mean ± SD (N = 20 cells over 3 experiments) and analyzed by a two-way ANOVA with Dunnett’s test. e, MPP8 loss increased p21 expression in MOLM-13 and OCI-AML3 cells 3 days after Dox-induced MPP8 KO. f, L1 reactivation increased p21 expression in AML cells 3 days after transduction of sgRNAs. g, Quantification of γH2A.X by intracellular staining of MLL-AF9-transformed AML cells. The mean % of γH2A.X-positive cells from 3 independent mice is shown. P values by a two-sided t test. h, Quantification of p21 by intracellular staining. The mean % of p21-positive cells from 3 independent mice is shown. P values by a two-sided t test. i, Kaplan-Meier survival curves of recipient mice after transplantation of AE9a-transformed BM lineage-negative cells from WT (N = 7), MPP8−/− (N = 9), or MPP8−/−p21−/− (N = 7) mice. P values by a log-rank Mantel-Cox test. Leukemia burden in PB, BM and spleen at day 60 post-transplantation is shown. Results are mean ± SEM (N = 5 mice) and analyzed by a two-way ANOVA with Tukey’s test. j, Kaplan-Meier survival curves of recipients engrafted with AE9a-transformed AML cells. N = 7, 10, and 7 WT, Mx1-Cre+;MPP8f/f, and Mx1-Cre+;MPP8f/f;p21−/− mice, respectively. P values by a log-rank Mantel-Cox test. Leukemia burden at day 90 is shown. Results are mean ± SEM (N = 5 mice) and analyzed by a two-way ANOVA with Tukey’s test. k, Schematic of the working model.
Myeloid leukemia cells are sensitive to DNA-damage-induced cell cycle exit, differentiation and growth inhibition 48–52, which may account for MPP8-deficiency-induced phenotypes. We reasoned that blocking DNA damage checkpoint pathways, such as inactivation of the cell cycle inhibitor p21, may counteract L1 retrotransposition-induced phenotypes in AML. To test this, we performed negative-selection competition assays using MPP8-deficient or L1-reactivated MOLM-13 or OCI-AML3 cells with or without p21 KO (Extended Data Fig. 8a,b). While KO of p21 alone had no apparent effect on leukemia cell growth, combining MPP8 depletion (or L1 reactivation) with p21 KO rescued the cell growth defects in vitro (Extended Data Fig. 8c,d) and in xenotransplants, resulting in less leukemia burden and prolonged survival (Extended Data Fig. 9a–f). We next generated p21 and MPP8 constitutive or conditional (by Mx1-Cre) double KO mice, respectively (Extended Data Fig. 9g,h). While MPP8 KO alone impaired the initiation and maintenance of AE9a-induced AML (Fig. 2d–i) and p21 KO alone had no effect 48, combined p21 and MPP8 KO restored AE9a-induced leukemia development in vivo (Fig. 6i,j). Similar results were seen in the MLL-AF9 model (Extended Data Fig. 9g–j), illustrating that the DNA damage pathways and cell cycle exit through p21 are required for L1-induced phenotypes in myeloid leukemia.
Given that p21 is an established target of p53 activity linking DNA damage to cell cycle arrest 55, we determined whether p53 is also required for L1-induced phenotypes. Similar to p21, L1 reactivation by MPP8 KO or CRISPRa significantly increased p53 expression, which was abrogated by 3TC in MOLM-13 and OCI-AML3 cells (Extended Data Fig. 10a,b). We next generated p53 single KO and p53/MPP8 combined KO human AML cells. While MPP8 KO alone impaired AML cell growth and p53 KO alone had no significant effect, combining MPP8 and p53 KO largely rescued the MPP8-deficiency-induced cell growth defects (Extended Data Fig. 10c,d). Similarly, we generated p53 KO AML cells with or without CRISPRa-mediated L1 activation, and observed that p53 KO abrogated L1 activation-induced AML growth defects (Extended Data Fig. 10e). Finally, we determined the effect of p53 depletion in vivo using MPP8 constitutive or conditional (by Mx1-Cre) KO mouse models, respectively. While MPP8 KO alone impaired the initiation and maintenance of AE9a or MLL-AF9-induced AML (Fig. 2d–i), p53 depletion largely restored leukemia development of MPP8-deficient cells, resulting in significantly shortened survival and increased leukemic burden of the transplanted recipients (Extended Data Fig. 10f–l).
Taken together, these studies indicate that HUSH-mediated suppression of L1 retrotransposons functions to safeguard genome stability to enforce AML oncogene-induced differentiation blockade and aberrant self-renewal, establishing a ‘tumor-suppressive’ function for retrotransposons in myeloid leukemia (Fig. 6k).
Discussion
The role of retrotransposons in human cancer has been historically underappreciated. Through CRISPR screens of human chromatin regulators, we found that the methyl-H3K9-binding protein MPP8, a component of the HUSH complex, is selectively required for the survival of AML cells. HUSH mediates the epigenetic silencing of L1 retrotransposons 18,19, but its role in human cancer remained elusive. We observed that inactivation of MPP8 impaired AML cell proliferation in vitro, in xenotransplantation and in vivo, establishing MPP8 as a newly recognized epigenetic dependency in myeloid leukemia. While dispensable for steady-state hematopoiesis, MPP8 loss inhibited AML development by reactivating L1 retrotransposition. These results support the model that the epigenetic silencing of L1 retrotransposons by HUSH/MPP8 is critical for the propagation of myeloid leukemia.
Due to high copy number and variability, it remains challenging to modulate L1 expression and assess the functional impact of L1 retrotransposition 1–3. In this study, we employed orthogonal assays to perturb L1 expression and/or activity, including retrotransposition reporter assays, CRISPRa-mediated L1 activation, transgenic L1-EGFP reporter mice, and pharmacological inhibition of L1 retrotransposition, for both loss- and gain-of-function studies of retrotransposons in leukemia biology. We found that activation of endogenous or ectopic L1s impaired AML propagation, whereas blocking L1 retrotransposition abrogated L1 reactivation-induced phenotypes. Importantly, L1 activation-induced cellular effects required p53 and p21-mediated DNA damage response, illustrating a critical role for retrotransposon suppression in safeguarding genome integrity to enforce oncogene-induced differentiation blockade. It is important to note that L1 retrotransposition may also create selective dependencies on other DNA damage repair pathways, such as Fanconi anemia proteins, or DNA replication machinery in p53-deficient tumor cells 56. Although we did not observe significant differences in L1Hs expression between p53 WT and mutant AML samples in the TCGA cohorts, p53 may also regulate L1 expression and/or activity in other cellular contexts 57,58. These findings provide new insights into how genomic transposable elements functionally modulate DNA damage pathways to control genome stability and oncogene-induced differentiation blockage.
By integrating genetic studies with orthogonal approaches to modulate L1 activity in AML models, our work identifies a molecular link between L1 retrotransposition, DNA damage, and oncogene-induced differentiation blockade required for leukemogenesis. These findings not only establish the molecular basis for the suppressed retrotransposon activity in myeloid malignancies 10,11, but also provide a mechanistic explanation for the unusual sensitivity of myeloid leukemia cells to DNA damage-induced differentiation 48–52. In addition, the transcription and/or reverse transcription of L1 mRNA may induce a type I interferon response through the cytosolic DNA and/or dsRNA-sensing pathways, resulting in the activation of interferon-α/β (IFN-α/β)-mediated inflammation 59–62. Activated interferon signaling promotes the cycling and differentiation of myeloid leukemia cells and has been exploited therapeutically 63,64. Thus, it is plausible that L1 activation may modulate immune responses and/or immunosurveillance, whereas suppression of retrotransposon activity may be advantageous for leukemia-initiating cells during aging and/or clonal evolution of myeloid malignancies 59,65,66.
This function for L1 retrotransposons may provide new prognostic biomarkers or therapeutic targets, especially in high-risk therapy-resistant myeloid leukemia. Since normal hematopoiesis and HSCs are minimally affected by loss of MPP8, modulating L1 retrotransposition may be exploited to sensitize leukemia-initiating cells to the effectiveness of standard genotoxic treatment. In addition, novel strategies to leverage L1 retrotransposition alone or in combination with other agents, including chemotherapy and immunomodulatory agents, may synergize the anti-leukemia activity. Further work on developing more specific agents for HUSH inhibition and/or L1 modulation will pave the way for future translational applications. Hence, while L1s are commonly recognized by their cancer-promoting roles as important sources of somatic mutations, we describe a tumor-suppressive function for retrotransposons in destabilizing oncogene-induced differentiation blockade in myeloid leukemia, whose intervention may lead to improved anti-leukemia therapies.
Methods
Mice
MPHOSPH8 (or MPP8) constitutive and conditional KO mice were generated by the Easi-CRISPR-based targeting 67. Briefly, sgRNAs flanking the exon 2 of Mphosph8 gene were selected by cross-referencing the CHOPCHOP toolbox (http://chopchop.cbu.uib.no/) 68 and gRNA checker (https://www.idtdna.com/site/order/designtool/index/CRISPR_SEQUENCE). CRISPR/Cas9 crRNAs and the Megamer® ssDNA fragment as the homology-directed repair (HDR) template were obtained from Integrated DNA Technologies. After microinjection into mouse zygotes, the founder animals were screened for the KO allele or the targeted flox allele by genotyping PCR, and confirmed by Sanger sequencing. The ORFeus L1-EGFP transgenic reporter mouse strain was generated as previously reported 46,47. Briefly, the transgenic mouse harbors a tandem-arrayed L1 ORFeus retrotransposon under a constitutive CAG promoter, together with an EGFP reporter gene with an interrupting intron in an antisense orientation. The expression of EGFP is contingent upon the successful completion of transgenic L1 transcription, RNA splicing, translation of L1 proteins, target-primed reverse transcription, and integration of the spliced EGFP cassette. The p21f/f conditional KO mouse was obtained from the Jackson Laboratory (Stock No: 016565). All mice were maintained on the C57BL/6 background. Both male and female mice were used unless otherwise specified. All mice were housed in the Animal Resource Center at the University of Texas Southwestern Medical Center (UTSW). Mouse housing condition is 12-hour light-dark cycle, 75 Fahrenheit and 35% humidity. All animal protocols were approved by UTSW Institutional Animal Care and Use Committee (IACUC).
Cells and cell culture
Human leukemia cell lines MOLM-13, OCI-AML3, NB4, U937, THP-1, MKPL-1, REH, Jurkat, and Raji were cultured in RPMI-1640 medium containing 10% fetal bovine serum (FBS) and 1% penicillin-streptomycin. Human AML cell line MV4–11 was cultured in IMDM containing 20% FBS and 1% penicillin-streptomycin. All cultures were incubated at 37°C in 5% CO2. Human primary AML samples were obtained from the biorepository under the protocol reviewed and approved by the Institutional Review Board at UTSW (IRB STU 122013–023). Samples were frozen in fetal bovine serum (FBS) with 10% DMSO and stored in liquid nitrogen. Human primary CD34+ HSPCs were obtained from the CCEH hematopoietic cell processing and repository at the Fred Hutchinson Cancer Research Center. No cell line used in this study was found in the database of commonly misidentified cell lines that is maintained by the International Cell Line Authentication Committee and the NCBI BioSample. All cell lines were tested for Mycoplasma contamination.
Plasmids
To generate the inducible lentiviral vector containing Cas9 and mCherry, the IRES-MCS-PGK-puro cassette from the pLVX-TRE3G-IRES-MCS-PGK-puro vector (Clontech, #631362) was replaced by IRES-mCherry to generate the pLVX-TRE3G-IRES-mCherry vector. Then the eSpCas9 1.1 sequence (Addgene, #71814) was cloned to the BamHI and NotI sites of the pLVX-TRE3G-IRES-mCherry vector using the In-Fusion HD cloning kit (Takara). To generate the lentiviral sgRNA vector with GFP (zsGreen1) and puromycin, the LentiGuide-Puro vector (Addgene, #52963) was digested with MluI, and the IRES-zsGreen1 cassette from the pLVX-EF1α-IRES-zsGreen1 vector (Clontech, #631982) was inserted by In-Fusion cloning. The pSFFV-Tet-On-3G-BFP vector was obtained from Dr. Bo Huang at UCSF 69. The sequence of the luciferase gene was amplified from the pGL4.24 vector (Promega, #E842A) and cloned into the pLVX-EF1α-IRES-zsGreen1 vector for xenograft experiments. All shRNAs were cloned into the pTRIPZ lentiviral inducible vector (Horizon Discovery). For overexpression studies, MPP8 ORF (Transomic Technologies, #BC003542) or domain-deletion mutants were cloned into the pCAG-HA-3XFLAG-IRES-GFP vector modified from the pCDH-EF1α-MCS-IRES-GFP (System Biosciences, #CD530A-2). For CRISPRa-based activation of endogenous L1s, the Lenti-sgRNA-MS2-EF1a-MCP-VP64-IRES-mCherry vector were generated as previously described 70. The puromycin resistance cassette from the lentiMPH v2 vector (Addgene, #89308) was replaced by BFP to generate the Lenti-MCP-p65-HSF1-P2A-BFP vector. The lenti-EF1a-dCas9-VPR-Puro vector was obtained from Addgene (Addgene, #99373). For L1 retrotransposition and reporter assays, the puromycin cassette from the LRE3-EGFP vector (obtained from Dr. John Abrams at UTSW) was replaced by a hygromycin resistance cassette to generate the LRE3-EGFP-HygroR vector. The vector was further engineered by replacing two Arg residues at 261–262 with Ala in ORF1p to generate the retrotransposition-deficient L1RP/JM111 reporter vector. The GFP reporter in the MIG-R1-MLL-AF9 (Addgene, #71443) and MIG-R1-AE9a (Addgene, #12433) vectors was replaced by BFP for the transplantation experiments in which cells contained GFP expression. For p21 KO in human leukemia cells, sgRNAs were cloned into the pX458 vector (Addgene, #48138). For p53 KO in human leukemia cells, sgRNAs were cloned into LentiGuide-Puro vector (Addgene, #52963). For p53 knockdown in transplant experiments, the previously validated shRNA against luciferase (negative control) or murine p53 71 were cloned into the pMLS-SV40-EGFP vector (Addgene, #46919).
Design and cloning of sgRNAs
sgRNAs were designed to minimize off-targets based on publicly available filtering tools (https://zlab.bio/guide-design-resources). Oligonucleotides were synthesized and annealed in the following reaction: 10 μM of each sense and antisense oligonucleotide, T4 ligation buffer (1×), and 5U of T4 polynucleotide kinase (NEB) with the cycling parameters of 37°C for 30 min; 95°C for 5 min and then ramp down to 25°C at 5°C/min. The annealed oligonucleotides were cloned into the sgRNA vectors using a Golden Gate Assembly strategy including: 100 ng of circular sgRNA vector plasmid, 0.2 μM annealed oligonucleotides, NEB buffer 2 (1×), 20U of BbsI or BsmBI, 0.2 mM ATP, 0.1 mg/ml BSA, and 750U of T4 DNA ligase (NEB) with the cycling parameters of 20 cycles at 37°C for 5 min, 20°C for 5 min, followed by 80°C incubation for 20 min. Lentiviruses containing sgRNAs were packaged in HEK293T cells. Specifically, 2 µg of psPAX2, 1 µg of pMD2.G and 5 µg sgRNA vectors were transfected into HEK293T cells seeded in a 10-cm Petri dish. Lentiviruses were harvested by collecting the supernatant 48–72 h post-transfection, followed by precipitation using PEG-it (System Biosciences) following the manufacturer’s protocol.
Generation of CRISPR screen and CRISPR activation cell lines
To generate inducible Cas9-expressing cell lines for CRISPR-based negative selection screens, human leukemia cells were transduced with lentiviruses expressing Cas9-IRES-mCherry and Tet-On-3G-rtTA trans-activator with BFP. Cells were treated with 500 ng/ml doxycycline for 3 days, and mCherry and BFP double positive cells were sorted by flow cytometry. For CRISPR activation experiments, cells were transduced with lentiviruses expressing dCas9-VPR and selected with puromycin. Then the cells were transduced with Lenti-MCP-p65-HSF1-P2A-BFP lentiviruses and sorted for BFP+ cells. For xenograft experiments, cells were further transduced with lentiviruses expressing the luciferase and GFP reporter genes.
CRISPR screen
Domain targeting sgRNAs were designed based on publicly available filtering tools (https://zlab.bio/guide-design-resources). Six to ten individual sgRNAs were designed for each annotated protein domains. Positive control sgRNAs targeting known essential genes and/or leukemia-associated genes, and negative control sgRNAs targeting non-essential genes and/or non-targeting sgRNAs were selected from the GeCKO CRISPR libraries 23. In total, 3,248 sgRNAs targeting 498 evolutionarily conserved chromatin-interacting domains found in 266 annotated human epigenetic regulators 22 and 1,800 sgRNAs targeting the 5’ exon of the other 311 epigenetic regulators, together with 44 positive (239 sgRNAs) and 287 negative controls (390 sgRNAs) (total 5,677 sgRNAs; Supplementary Table 1). DNA oligonucleotide synthesis was performed on a programmable microarray using a B3 Synthesizer (CustomArray). Full-length oligonucleotides (96 nt) were amplified for 15 cycles by PCR using Phusion® High-Fidelity DNA Polymerase (referred to as PCR1). PCR2 was performed to remove barcodes and replace with LentiGuide-puro vector homology sequences. The amplified sequences were purified for the Gibson assembly reaction. The sgRNA vectors were digested by BsmBI (NEB), dephosphorylated and purified. Gibson assembly was performed to generate the sgRNA library following manufacturer’s protocol. Briefly, 1 μl of the Gibson Assembly reaction was added to 25 µl E.cloni® 10G ELITE electro competent cells (Lucigen, #60052–4) and electroporated using Bio-Rad MicroPulser. The transformation was plated onto pre-warmed 24.5 cm2 bioassay plates with ampicillin. The colonies were counted to calculate the library coverage (>200×). All colonies were collected, and maxiprep was performed to isolate the sgRNA library. Lentiviruses were produced as previously described 72. To perform high-throughput pooled sgRNA screening, the inducible Cas9-expressing cells were transduced with lentiviruses containing the sgRNA library at MOI < 0.5. Two days after transductions, cells were selected with 0.5 µg/ml puromycin for 3 days, and then cultured in fresh medium for 48 hours. Cells were expanded to get enough coverage of sgRNAs (> 500×) and genomic DNA (gDNA) were extracted as the starting time point (T0). The remaining cells were cultured in medium with doxycycline (500 ng/ml) at a density between 500,000 and 1,000,000 cells/ml to maintain the library coverage of at least 1,000 cells per sgRNA. Genomic DNA was harvested from all samples at day 14 (T14), and the sgRNA-containing regions were amplified by PCR. All the primers are listed in Supplementary Table 2. Two replicate experiments of each CRISPR screen were performed. Amplicon sequencing was performed on an Illumina NextSeq500 sequencer. sgRNA sequences were extracted from fastq files and aligned to the sgRNA sequences of the CRISPR screen library. Reads of each sgRNA were counted and normalized to the total read counts for each sample. Pearson correlations between replicates were calculated using the log2 transformed sgRNA counts. The counts of each sgRNA were then counted from sgRNA sequences with MAGeCK ‘count’ function 73. P values and log2 fold-changes of each sgRNA or gene between the end (T14) and starting time points (T0) were conducted by MAGeCK ‘test’ function with the parameter of “--gene-lfc-method alpha mean” (Supplementary Table 3).
RNA isolation and qRT-PCR analysis
Total RNA was isolated using RNeasy Plus Mini kit or RNeasy Plus Micro kit (Qiagen) and reverse-transcribed using iScript cDNA Synthesis kit (Bio-Rad) following the manufacturer’s protocols. Quantitative RT-PCR (qRT-PCR) was performed in triplicate with the iQ SYBR Green Supermix (Bio-Rad) using CFX384 Touch Real-Time PCR Detection System (Bio-Rad). PCR amplification parameters were 95°C (3 min) and 45 cycles of 95°C (15 sec), 60°C (30 sec), and 72°C (30 sec). Primer sequences are listed in Supplementary Table 2.
RNA-seq and data analysis
RNA-seq library was prepared using the NEBNext Ultra II directional RNA library prep kit with the NEBNext Poly(A) mRNA magnetic isolation module (New England Biolabs). We followed the recommended guidelines for retrotransposon analysis 27 with modifications. Specifically, sequencing reads were aligned to human (hg38) reference genome by STAR 2.5.2b 74 with the following parameters: --runThreadN 4 --outSAMtype BAM SortedByCoordinate --runMode alignReads --outFilterMultimapNmax 1000 --outSAMmultNmax 1 --outFilterMismatchNmax 3 --outMultimapperOrder Random --winAnchorMultimapNmax 1000 --alignEndsType EndToEnd --alignIntronMax 1 --alignMatesGapMax 350. For quantification of repetitive elements, we reported weighted number of hits and randomly one position to quantify repetitive elements using featureCounts 75 random alignments with the following parameters: featureCounts -M -F SAF -T 1 -s 2 -p -a rmsk.SAF -o outfeatureCounts.txt Input.bam. Read counts of each repeat family were calculated by the summation of individual read counts from the same repeat family. Differentially expressed genes were identified by DESeq2 76. Then gene and repeat counts were concatenated and differentially expressed genes or repetitive elements were identified by DESeq2 76. All genomic datasets generated in this study or downloaded from public databases are listed in Supplementary Table 4. The differentially expressed genes between MPP8 WT and KO MOLM-13 cells (fold change ≥ 2, FDR-adjusted P value ≤ 1 × 10⁻³⁰) are listed in Supplementary Table 5. GSEA was performed as previously described 77 using L1 signature annotated by RepeatMasker.
Mutagenesis and rescue experiments
MPP8 domain mutants were generated by overlapping PCR reactions to delete individual domains of MPP8 cDNA, followed by verification using Sanger sequencing. MOLM-13 stable cells expressing inducible shRNAs against MPP8 3’UTR (sh3 and sh4) were generated, transduced with the wild-type or domain mutant MPP8 cDNA with the N-terminal HA-FLAG tag, and sorted by flow cytometry. Protein expression was confirmed by Western blotting using the anti-HA antibody (Cell Signaling Technology, #3724P). Doxycycline (500 ng/ml) was added to the cells to induce shRNA expression and knockdown of the endogenous MPP8, and relative cell growth was determined by % of cells expressing GFP or mCherry at different time points and normalized to wild-type MPP8-expressing cells (control).
Nucleofection and colony-forming assays
Primary human CD34+ HSPCs were obtained from the CCEH hematopoietic cell processing and and processing core at the Fred Hutchinson Cancer Research Center. Cells were first expanded in StemSpan SFEM serum-free medium supplemented with StemSpan CC100 cytokine cocktails (StemCell Technologies) for 4 days, and electroporated with expression vector containing a GFP reporter using the Human CD34+ Cell Nucleofector kit (Lonza, VPA-1003). GFP+ cells were sorted for expression analysis 48 hours after nucleofection. For colony-forming assays, the cells were transduced with shRNA lentiviruses and selected with puromycin (0.5 µg/ml) for 24 hours, and 500 cells were plated in MethoCult media (StemCell Technologies, #H4434) following the manufacturer’s protocols. To generate p21 KO cells, cells were electroporated by Amaxa Nucleofector Kit C (Lonza, VACA-1004). Single-cell-derived KO clones were isolated by limiting dilution assay and genotyped by PCR.
Bone marrow transplantation and leukemia development
Recipient mice (CD45.1) were irradiated using an XRAD 320 X-ray irradiator (Precision X-Ray Inc.) with two doses of 540 rad (total 1,080 rad) delivered at least 3 hours apart. Cells were injected into the tail vein of anesthetized recipients. After transplantation, mice were maintained on antibiotic water for 4 weeks. Blood was obtained from recipient mice every 4 weeks. Red blood cells were lysed with ammonium-chloride-potassium buffer (NH4Cl 8,024 mg/l, KHCO3 1,001 mg/l, EDTA.Na2·2H2O 3.722 mg/l). The remaining cells were stained with antibodies against CD45.2, CD45.1, B220, Mac1, CD3, and Gr1 and analyzed by flow cytometry. For MLL-AF9 and AE9a leukemia experiments, bone marrow lineage-negative cells from donor mice (CD45.2) were magnetically isolated and stimulated in Prime-XV Mouse Hematopoietic Cell Medium (Irvine Scientific) supplemented with 50 μmol/l β-Mercaptoethanol, 1% FBS, 50 ng/ml stem cell factor (SCF) and 50 ng/ml TPO overnight. After two rounds of spin infections with MLL-AF9 or AE9a retroviruses with a GFP or BFP reporter within 48 hours, approximately 5 × 10⁵ GFP+, BFP+ or GFP+BFP+ cells together with 5 × 10⁴ supporting cells (healthy bone marrow cells from CD45.1 cells) were injected into the tail vein of recipient mice irradiated with two doses of 540 rad (total 1,080 rad) delivered at least 3 hours apart. Survival of the mice was monitored daily. For the homing assay of leukemia cells, BM cells were isolated 16 hours following tail vein injection and the frequency of donor-derived cells was identified by flow cytometry for GFP or BFP expression. In the leukemia maintenance experiment, cells from conditional KO mice were transduced with MLL-AF9 or AE9a retroviruses and injected into irradiated recipient mice (CD45.1). Mice with successful and comparable engraftment of leukemia cells were then administrated with pIpC (5 injections at 20 mg/kg, GE Healthcare, #27473201) to induce the deletion of MPP8 gene. Peripheral blood was isolated and GFP or BFP positive cells were examined in white blood cells by flow cytometry.
Xenograft experiments
Eight to ten-week-old female NOD-scid IL2Rgnull (NSG) mice were sub-lethally irradiated (2.5 Gy) half day before the transplantation. Leukemia cells (1 × 10⁶/mice) were resuspended in PBS (200 µl/mice) and intravenously transplanted. In vivo bioluminescence imaging was performed 4 hours post-transplant to ensure successful cell transfer. Mouse survival was monitored daily. Leukemia burden were monitored 21 days after the transplantation by flow cytometry. Briefly, following intraperitoneal injection of 150 mg/kg D-luciferin (Gold Biotechnology, #LUCK-1G), mice were imaged, and bioluminescence intensity was quantitated using Living Image 3.2 acquisition and analysis software (Caliper Life Sciences). Total flux values were determined by regions of interest (ROI) of identical size over each mouse and were presented in photons (p)/second (s).
Retrotransposition assays
Cells stably expressing inducible Cas9 or dCas9-VPR activation system were electroporated by Amaxa Nucleofector Kit C (Lonza, VACA-1004) with the LRE3-EGFP-HygR or L1RP/JM111 reporter vector. Cells were selected with hygromycin at 200 µg/ml for 14 days. Hygromycin-resistant cells were then transduced with lentiviruses expressing sgRNAs to knockout MPP8 or activate endogenous L1 expression. The transduced cells were selected by puromycin (0.5 µg/ml, Sigma-Aldrich #P9620) or sorting of mCherry+ cells by flow cytometry. GFP expression was detected by flow cytometry 5 days after treatment of doxycycline (500 ng/ml, Sigma-Aldrich #D9891) to knockout MPP8. In the L1 activation assays, GFP was detected 48 hours after cell sorting. There are baseline GFP signals in the retrotransposition-deficient L1RP/JM111 reporter likely due to autofluorescent cells detected by flow cytometry.
ChIP and ChIP-seq analysis
ChIP was performed as described previously 42 using antibodies for MPP8 (ab1: Proteintech, #16796–1-AP; ab2: Bethyl Laboratories, #A303–051A; ab3: Bethyl Laboratories, #A303–052A) or H3K9me3 (Abcam, #ab8898) in MOLM-13 cells. ChIP-qPCR was performed as described previously 78 using primers listed in Supplementary Table 2. ChIP-seq libraries were generated using the NEBNext Ultra II DNA library prep kit following the manufacturer’s protocol (NEB), and sequenced on an Illumina NextSeq500 system using the 75bp single-end or pair-end high output sequencing kit. ChIP-seq raw reads were aligned to the human genome assembly (GENCODE Version hg19) using Bowtie2 79 with the default parameters. ChIP-seq peaks were identified using MACS2 callpeak function with parameters of --broad --nomodel --nolambda --max-gap 500 --min-length 500 80. Visualization tracks were generated with deepTools bamCoverage function with human genome effective size and parameters of --normalizeUsing RPGC --extendReads 200 81. BigWig files were plotted in WashU Epigenome Browser.
Cell growth assays
Cell proliferation was determined using the PrestoBlue Cell Viability Reagent (Invitrogen). Briefly, 5,000 cells/well were seeded in triplicate into 96-well plates. After different days of culture, 10 μl of PrestoBlue reagents were added to wells with cells or medium (blank), and relative absorption values at 570 and 600 nm were determined after 1 h incubation at 37°C.
Negative-selection competition assay
Negative-selection competition assay was performed to investigate the functional roles of gene- of-interest on leukemia cell proliferation. Briefly, sgRNAs were cloned into the LentiGuide-Puro-IRES-zsGreen1 or Lenti-sgRNA-MS2-EF1a-MCP-VP64-IRES-mCherry vectors, and lentiviruses were produced to transduce target cells. Cells were analyzed for GFP (zsGreen1) or mCherry expression 3 days after transduction as the base line by flow cytometry. In KO experiments, cells were treated by 500 ng/ml of doxycycline from day 3. The % of cells expressing GFP or mCherry was examined by flow cytometry at different time points and normalized to day 3.
Western blot analysis
Western blot was performed as described 42 using antibodies against MPP8 (Proteintech, #16796–1-AP), ORF1p (Millipore-Sigma, #MABC1152), p21 (Cell Signaling Technology, #2947), p53 (Cell Signaling Technology, #2524), β-actin (Cell Signaling Technology, #4970), and GAPDH (Santa Cruz Technologies, sc-25778) with 1:1,000 dilutions. Briefly, whole cell lysates were prepared, separated on a SDS-PAGE gel, and transferred to Amersham™ Hybond™ P 0.45 PVDF blots (GE Healthcare, #10600023). The blots were incubated with primary antibodies with 5% non-fat milk in TBS/T (20 mM Tris-HCl, pH7.5, 150 mM NaCl, 0.1% Tween-20) at 4°C overnight with shaking. After washing 3 times with TBS/T, the blots were incubated with secondary antibodies with 5% non-fat milk in TBS/T for 1 h at room temperature. The blots were then washed 3 times with TBS/T and developed using Plus-ECL (PerkinElmer #NEL104001EA).
Flow cytometry and MACS cell separation
Flow cytometry analyses were performed as previously described 42. Briefly, BM cells were obtained by flushing femurs and tibias with a 25G needle or by crushing femurs, tibias, and pelvic bones with a mortar in Ca2+- and Mg2+-free Hank’s buffered salt solution (Gibco) supplemented with 2% heat-inactivated bovine serum (Gibco). Spleens and were dissociated by crushing followed by trituration. All cell suspensions were filtered through a 70-μm cell strainer. Cell numbers were determined with a Vi-CELL Cell Viability Analyzer (Beckman Coulter). For flow cytometric analysis and isolation, cells were incubated with combinations of antibodies listed in Supplementary Table 6. Lineage markers for HSCs and progenitors were CD2, CD3, CD5, CD8, B220, Gr1, and Ter119. Antibody staining was performed at 4°C for 30 minutes, or, when CD34 was included in the cocktail, on ice for 90 minutes. Biotinylated antibodies were visualized by incubation with PE/Cy7-conjugated streptavidin at 4°C for 30 minutes. DAPI (4,6-diamidino-2-phenylindole; 2 μg/ml in PBS) or propidium iodide (1 μg/ml) were used to exclude dead cells during flow cytometry. For isolation of c-Kit+ or lineage-negative cell populations, cells were stained with c-Kit-APC780 or lineage-Biotin antibodies followed by microbeads conjugated anti-APC or anti-Biotin secondary antibodies. Cells were then enriched or depleted by autoMACS magnetic separator (Miltenyi Biotec) or manual separation using LS Columns (Miltenyi Biotec). Analysis and cell sorting were performed using a FACSAria or FACSCanto flow cytometer (BD Biosciences). Data were analyzed using FACSDiva (BD Biosciences).
Phenotypic analysis of hematopoiesis
Phenotypic analysis of hematopoiesis was performed as previously described 42. Briefly, blood was collected from facial vein and complete blood counts (CBC) were performed on a HEMAVET HV950 (Drew Scientific) according to the manufacturer’s protocol. The hematopoietic stem/progenitor cell populations in mouse bone marrow were analyzed as previously described 42, including HSC (Lin−Sca1+Kit+CD150+CD48−), MPP (Lin−Sca1+Kit+CD150−CD48−), LSK (Lin−Sca1+Kit+), CMP (Lin−Sca1−Kit+CD34+CD16/32−), GMP (Lin−Sca1−Kit+CD34+CD16/32+), and MEP (Lin−Sca1−Kit+CD34−CD16/32−). For flow cytometric analysis, cells were incubated with combinations of fluorophore-conjugated antibodies. Lineage markers for HSCs and progenitors were CD2, CD3, CD5, CD8, B220, Gr1 and Ter119. Antibody staining was performed at 4°C for 30 min or on ice for 90 min. Biotinylated antibodies were visualized by incubation with PE/Cy7-conjugated streptavidin at 4°C for 30 min. DAPI (4,6-diamidino-2-phenylindole; 2 μg/ml in PBS) was used to exclude dead cells. Analysis or sorting was performed using a FACSAria or FACSCanto flow cytometer (BD Biosciences). Data were analyzed using FACSDiva (BD Biosciences). The following antibodies were used for flow cytometry: PerCP/Cy5.5 anti-mouse B220 (Biolegend, Cat# 103236), PE anti-mouse CD150 (Biolegend, Cat# 115903), BV510 anti-mouse CD16/32 (Biolegend, Cat# 101333), Alexa Fluor 700 anti-mouse CD3 (Biolegend, Cat# 100216), Biotin anti-mouse CD34 (eBioscience, Cat# 13-0341-85), PE anti-mouse CD43 (eBioscience, Cat# 12-0431-83), Alexa Fluor 700 anti-mouse CD48 (Biolegend, Cat# 103426), FITC anti-mouse CD71 (BD Biosciences, Cat# 553266), APC anti-mouse c-Kit (Biolegend, Cat# 105811), PE/Cy7 anti-mouse Gr1 (Biolegend, Cat# 108415), APC anti-mouse IgM (Biolegend, Cat# 406509), APC-eFluor 780 anti-mouse Mac1 (eBioscience, Cat# 47-0112-82), PerCP/Cy5.5 anti-mouse Sca-1 (Biolegend, Cat# 108123), BV510 anti-mouse Ter119 (Biolegend, Cat# 116237), FITC anti-mouse CD2 (eBioscience, 11-0021-81), FITC anti-mouse CD3 (Biolegend, Cat# 100204), FITC anti-mouse CD5 (Biolegend, Cat# 100606), FITC anti-mouse CD8a (Biolegend, Cat# 100706), FITC anti-mouse B220 (eBioscience, 11-0452-85), FITC anti-mouse Gr-1 (Biolegend, Cat# 108406), FITC anti-mouse Ter119 (Biolegend, Cat# 116206), PE/Cy7 Streptavidin (Biolegend, Cat# 405206). All antibodies were used at 1:200 to 1:400 dilutions following manufacturers’ instructions.
Immunofluorescence, cytospin, and intracellular staining
Cytospin preparations from leukemia cells were stained with May-Grunwald-Giemsa as described previously 42. For immunofluorescence analysis, cells were centrifuged to slides and fixed in 4% paraformaldehyde at room temperature for 10 min. Cells were then blocked with blocking buffer (0.25% Triton X-100 10% goat serum in PBS) at room temperature for 1 hour. Then the cells were incubated with primary antibodies diluted in blocking buffer at 4°C overnight. On the second day, slides were washed with PBS and then incubated with secondary antibodies diluted in blocking buffer at room temperature for 1 hour. Nuclei (purple) were stained with TO-PRO-3 (Thermo Fisher Scientific, #T3605) diluted in PBS, washed with PBS, and mounted with fluoro-gel mounting medium. Cells were imaged using a Zeiss LSM780 Inverted confocal microscope and analyzed using ImageJ software. The phospho-Histone H2A.X (Ser139) antibody (Cell Signaling Technology, #2577) and Alexa Fluor 488 goat anti-rabbit IgG(H+L) antibody (Thermal Fisher Scientific, #A11034) were used. For intracellular staining, cells were fixed in 4% paraformaldehyde at room temperature for 10 min, followed by incubation in permeabilization buffer (0.5% Saponin 0.5% BSA) for 10 min at room temperature. Cells were stained with antibodies in permeabilization buffer for 1 hour at room temperature. After washed with permeabilization buffer, cells were analyzed with flow cytometry. Alexa Fluor®647-conjugated anti-H2A.X Phospho (Ser139) (BioLegend, #613407) and Alexa Fluor®647-conjugated anti-p21 antibody (Abcam, #ab237265) were used. All antibodies were used at 1:200 dilutions.
Statistics and reproducibility
Statistical details including N, mean, and statistical significance values are indicated in the text, figure legends, or methods. Error bars in the experiments represent SEM or SD from either independent experiments or independent samples. All statistical analyses were performed using GraphPad Prism, and the detailed information about statistical methods is specified in figure legends or methods. The numbers of independent experiments or biological replicate samples and P values (*P < 0.05, **P < 0.01, ***P < 0.001, ****P < 0.0001, n.s. not significant) are provided in individual figures. P < 0.05 was considered statistically significant. Panels in Figures 3e, 5f, 6a, c, e, f, g, h, and Extended Data Figures 1f, 4b–e, 5l, 7d, 8b, 10a–c show a representative image or flow cytometry of at least three independent experiments or biological replicate samples with similar results.
Extended Data
Extended Data Figure 1 |. Design and validation of epigenetic regulator-focused CRISPR screens.
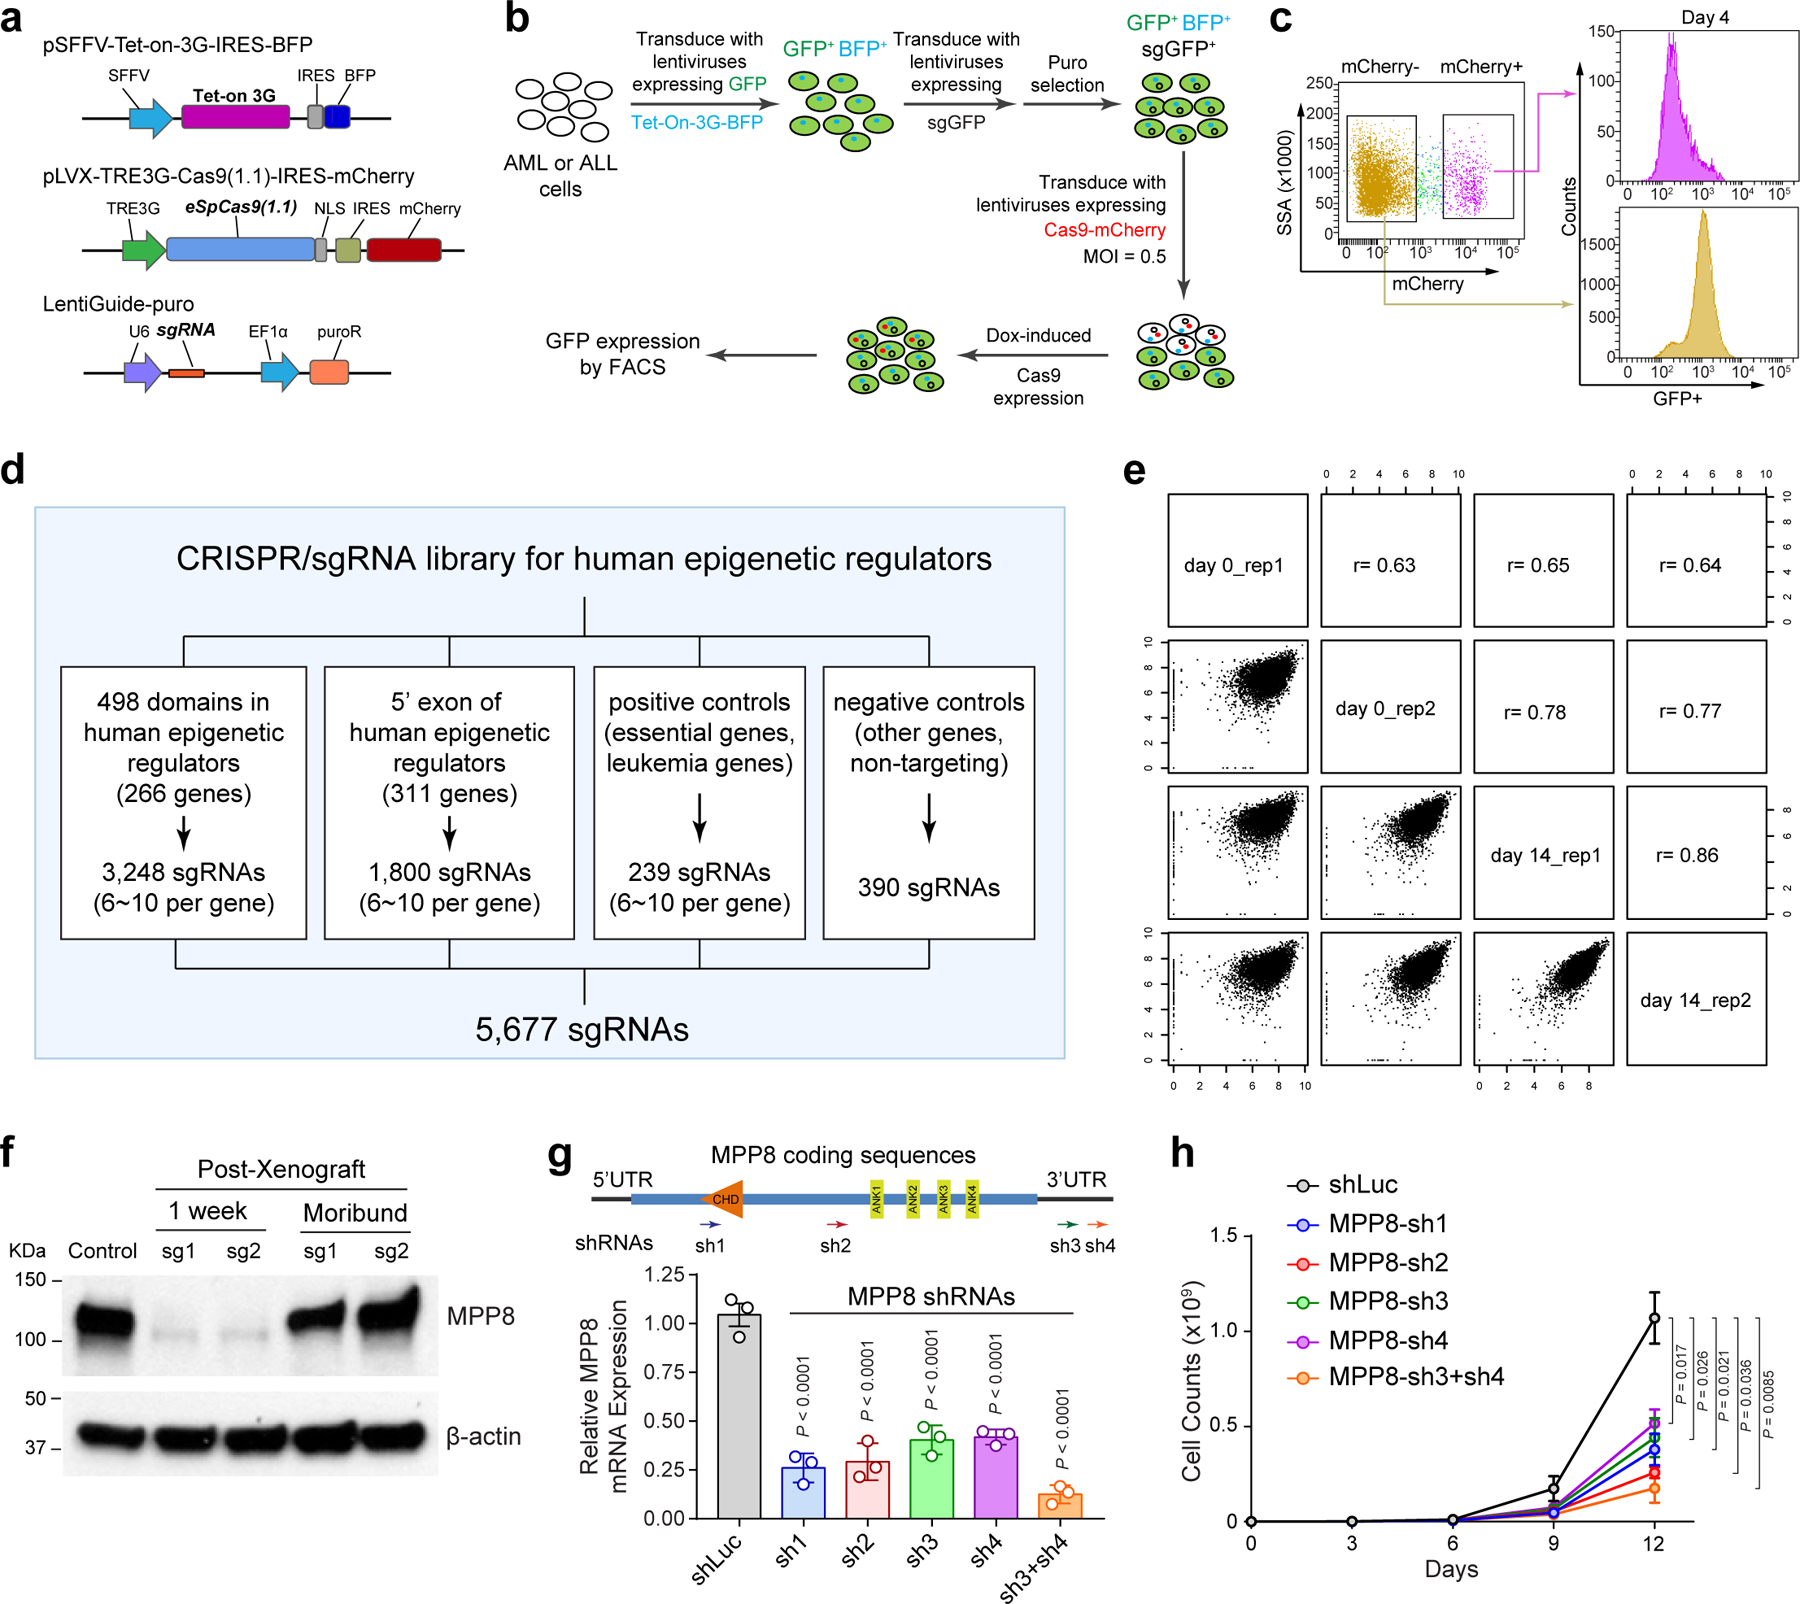
a, Schematic of the CRISPR screen system containing a TET-on-3G trans-activator, a tetracycline (TRE3G)-inducible Cas9 with an mCherry reporter, and the sgRNA. b, Schematic of the experiments to validate the inducible CRISPR screen system by targeting the stably expressed GFP reporter gene in MOLM-13 cells. c, Dox-induced expression of Cas9 and GFP-targeting sgRNAs in mCherry+ cells significantly decreased GFP expression compared to Cas9-negative (mCherry−) cells after 4 days of doxycycline treatment. d, Schematic of the customized sgRNA library containing 3,248 sgRNAs targeting 498 conserved chromatin-interacting domains in 266 annotated human epigenetic regulators and 1,800 sgRNAs targeting the 5’ exon of the other epigenetic regulators, together with 239 positive and 390 negative control sgRNAs. e, Comparisons of replicate experiments of CRISPR screens in MOLM-13 cells. The x- and y-axis of each graph represent the normalized sgRNA counts at day0 and day14. Spearman correlation value is shown for each comparison. f, MPP8 expression was determined by Western blot in MOLM-13 cells before xenograft (control), one week after Dox-induced MPP8 KO in xenografted NSG mice, and in the moribund mice (6-week post-xenograft) by independent MPP8-targeting sgRNAs (sg1 and sg2). g, Depletion of MPP8 by RNAi-mediated knockdown using shRNAs against the coding or 3’UTR sequences. shRNA against the luciferase gene (shLuc) was used as a negative control. Schematic of the MPP8 gene and the positions of shRNAs (sh1 to sh4) are shown. Results are mean ± SD (N = 3 independent experiments) and analyzed by a one-way ANOVA with Dunnett’s test. h, Growth curves of MOLM-13 AML cells after doxycycline-induced expression of MPP8-targeting shRNAs. Results are mean ± SD (N = 3 independent experiments) and analyzed by a two-way ANOVA with Tukey’s test.
Extended Data Figure 2 |. HUSH components and other L1 regulators are required for myeloid leukemia cells.
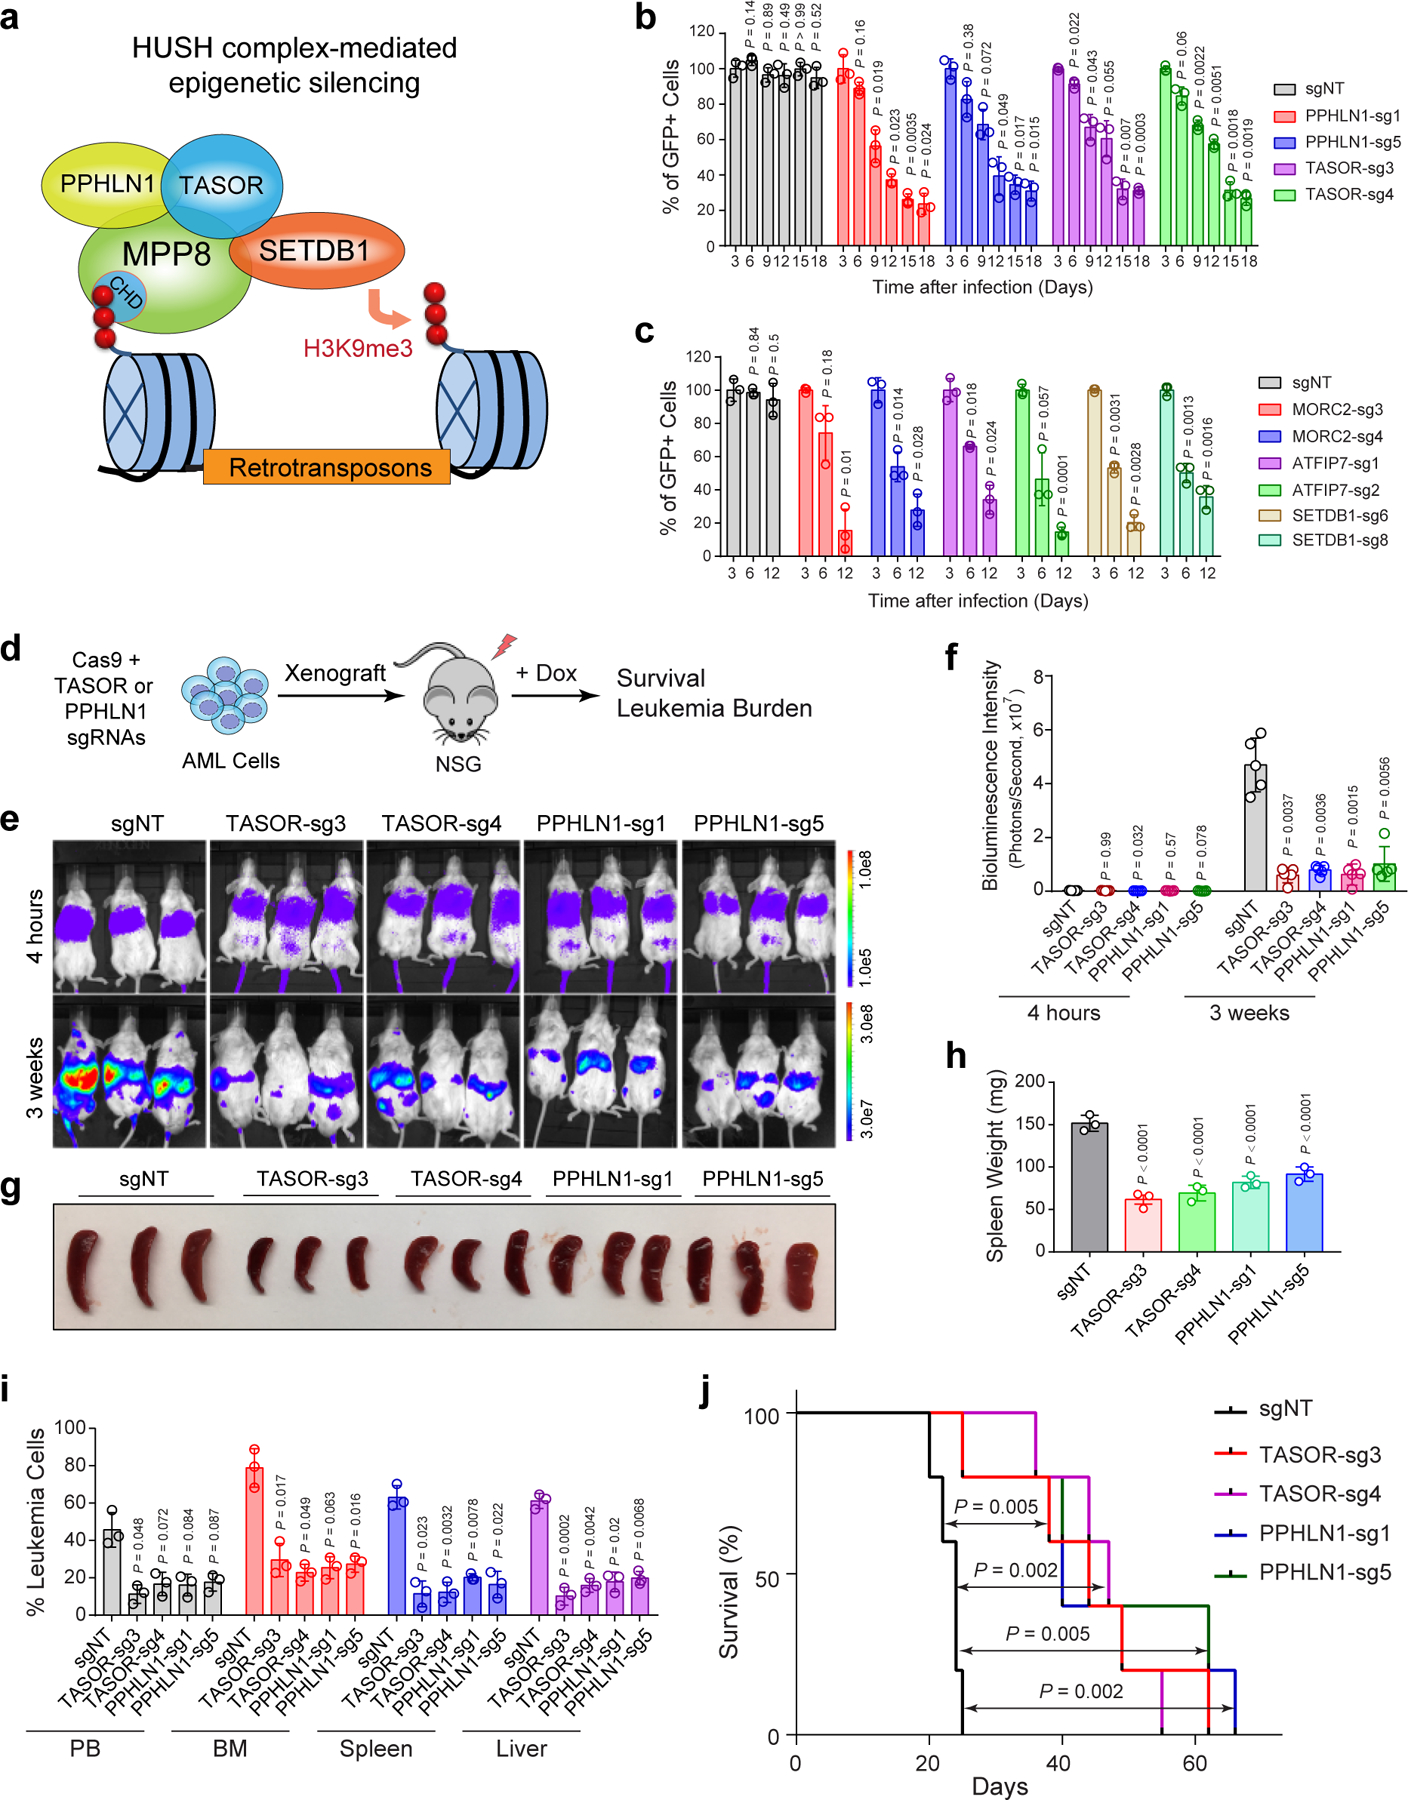
a, Schematic of the HUSH complex in epigenetic silencing of retrotransposons. b, Depletion of HUSH proteins (PPHLN1 and TASOR) impaired MOLM-13 cell growth by the negative-selection competition assays. Results are mean ± SD (N = 3 independent experiments) and analyzed by a two-way ANOVA with Dunnett’s test. c, Depletion of other L1 regulators (MORC2, ATPIP7 and SETDB1) impaired MOLM-13 cell growth. Results are mean ± SD (N = 3 independent experiments) and analyzed by a two-way ANOVA with Dunnett’s test. d, Schematic of the xenotransplantation assay. e, Depletion of HUSH proteins (TASOR or PPHLN1) impaired MOLM-13 cell growth in NSG mice. Bioluminescence intensity is shown at 4 hours and 3 weeks post-transplantation. f, Quantification of bioluminescent imaging. Results are mean ± SD (N = 5 mice per group) and analyzed by a two-way ANOVA with Dunnett’s test. g, Representative image is shown for spleens of the xenografted NSG mice 3 weeks post-transplantation. h, Quantification of spleen weight 3 weeks post-transplantation. Results are mean ± SD (N = 3 mice per genotype) and analyzed by a one-way ANOVA with Dunnett’s test. i, Quantification of leukemia burden in PB, BM, spleen and liver of the xenografted NSG mice 3 weeks post-transplantation. Results are mean ± SD (N = 3 mice per group) and analyzed by a two-way ANOVA with Dunnett’s test. j, Kaplan-Meier survival curves of NSG mice xenografted with MOLM-13 cells transduced with control (sgNT) or sgRNAs against TASOR or PPHLN1. N = 5 mice per group. P values by a log-rank Mantel-Cox test.
Extended Data Figure 3 |. Cellular phenotypes of MPP8-deficient myeloid leukemia cells.
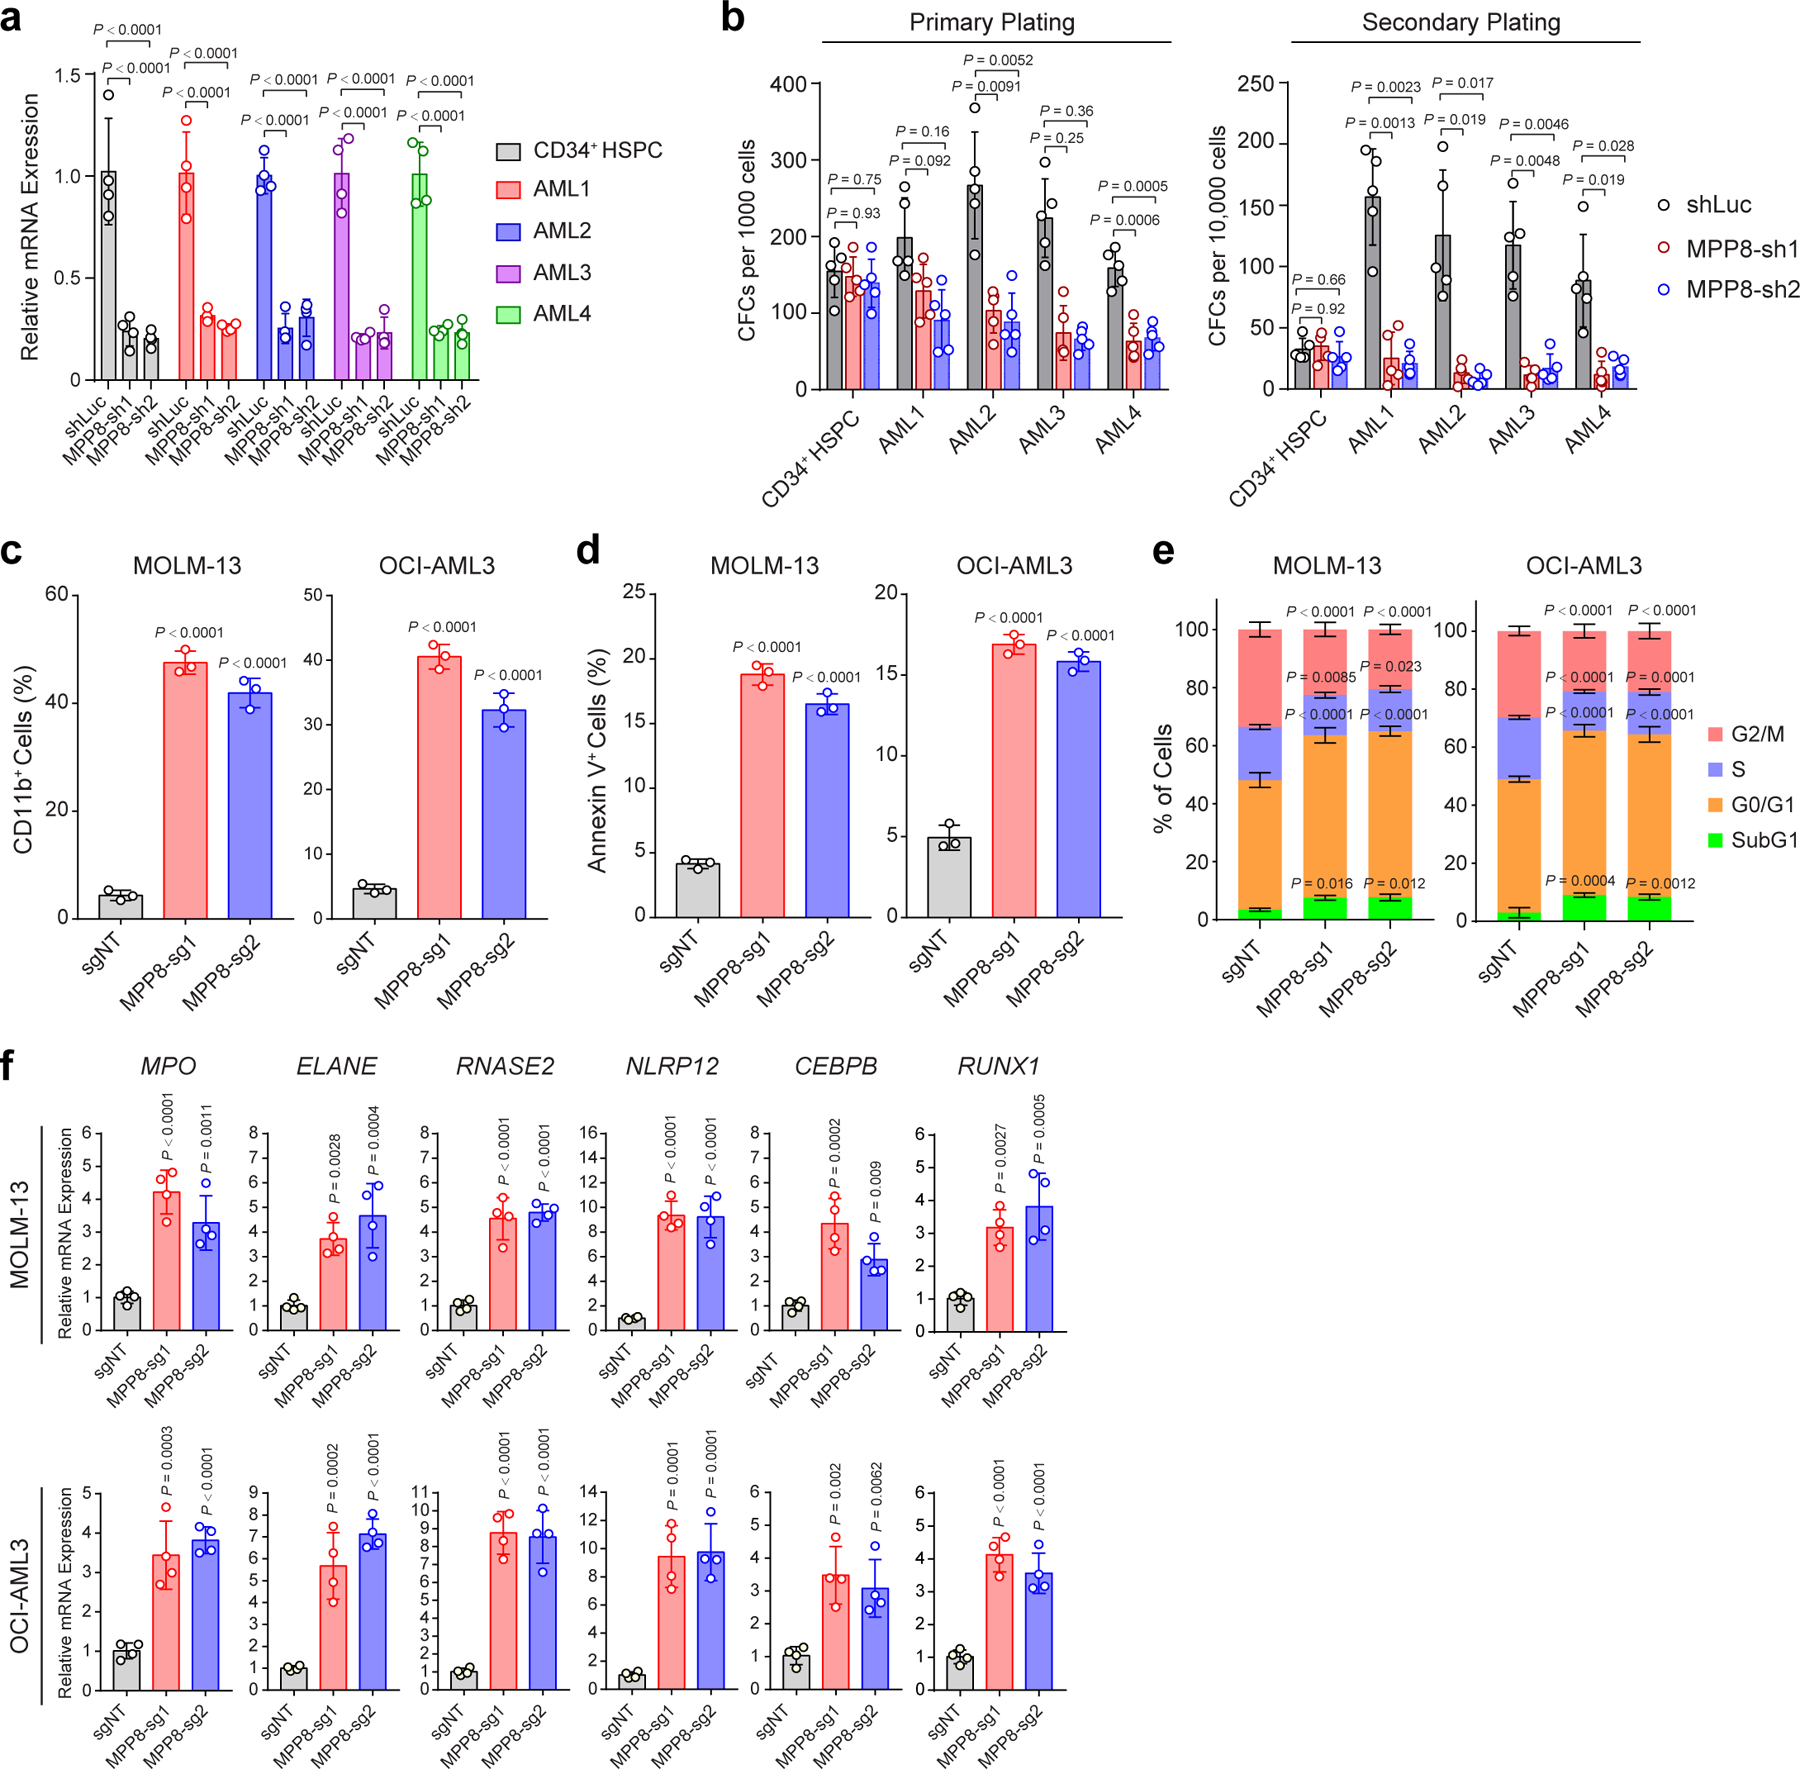
a, Validation of shRNA-mediated MPP8 depletion by qRT-PCR in human normal CD34+ HSPCs (control) and four independent primary AML samples (AML1 to AML4). Cells transduced with shLuc were analyzed as controls. Results are mean ± SD (N = 4 independent experiments) and analyzed by a two-way ANOVA with Tukey’s test. b, MPP8 depletion impaired the colony-forming activity of AML cells but not normal CD34+ HSPCs in serial plating assays. Results are mean ± SD (N = 5 experiments) and analyzed by a two-way ANOVA with Tukey’s test. c, MPP8 depletion significantly increased CD11b expression in MOLM-13 and OCI-AML3 cells. Cells were analyzed after 10 days of Dox-induced MPP8 KO. Results are mean ± SD (N = 3 experiments) and analyzed by a two-way ANOVA with Dunnett’s test. d, MPP8 depletion increased apoptosis (Annexin V+) in MOLM-13 and OCI-AML3 cells after 10 days of Dox-induced MPP8 KO. Results are mean ± SD (N = 3 experiments) and analyzed by a two-way ANOVA with Dunnett’s test. e, MPP8 depletion led to a G0/G1 cell cycle arrest after 10 days of Dox-induced MPP8 KO. Results are mean ± SD (N = 3 experiments) and analyzed by a two-way ANOVA with Dunnett’s test. f, Expression of myeloid differentiation genes were upregulated in MPP8-deficient MOLM-13 cells after 10 days of Dox-induced MPP8 KO. Results are mean ± SD (N = 4 experiments) and analyzed by a one-way ANOVA with Dunnett’s test.
Extended Data Figure 4 |. Generation of MPP8 constitutive and conditional KO mouse models.
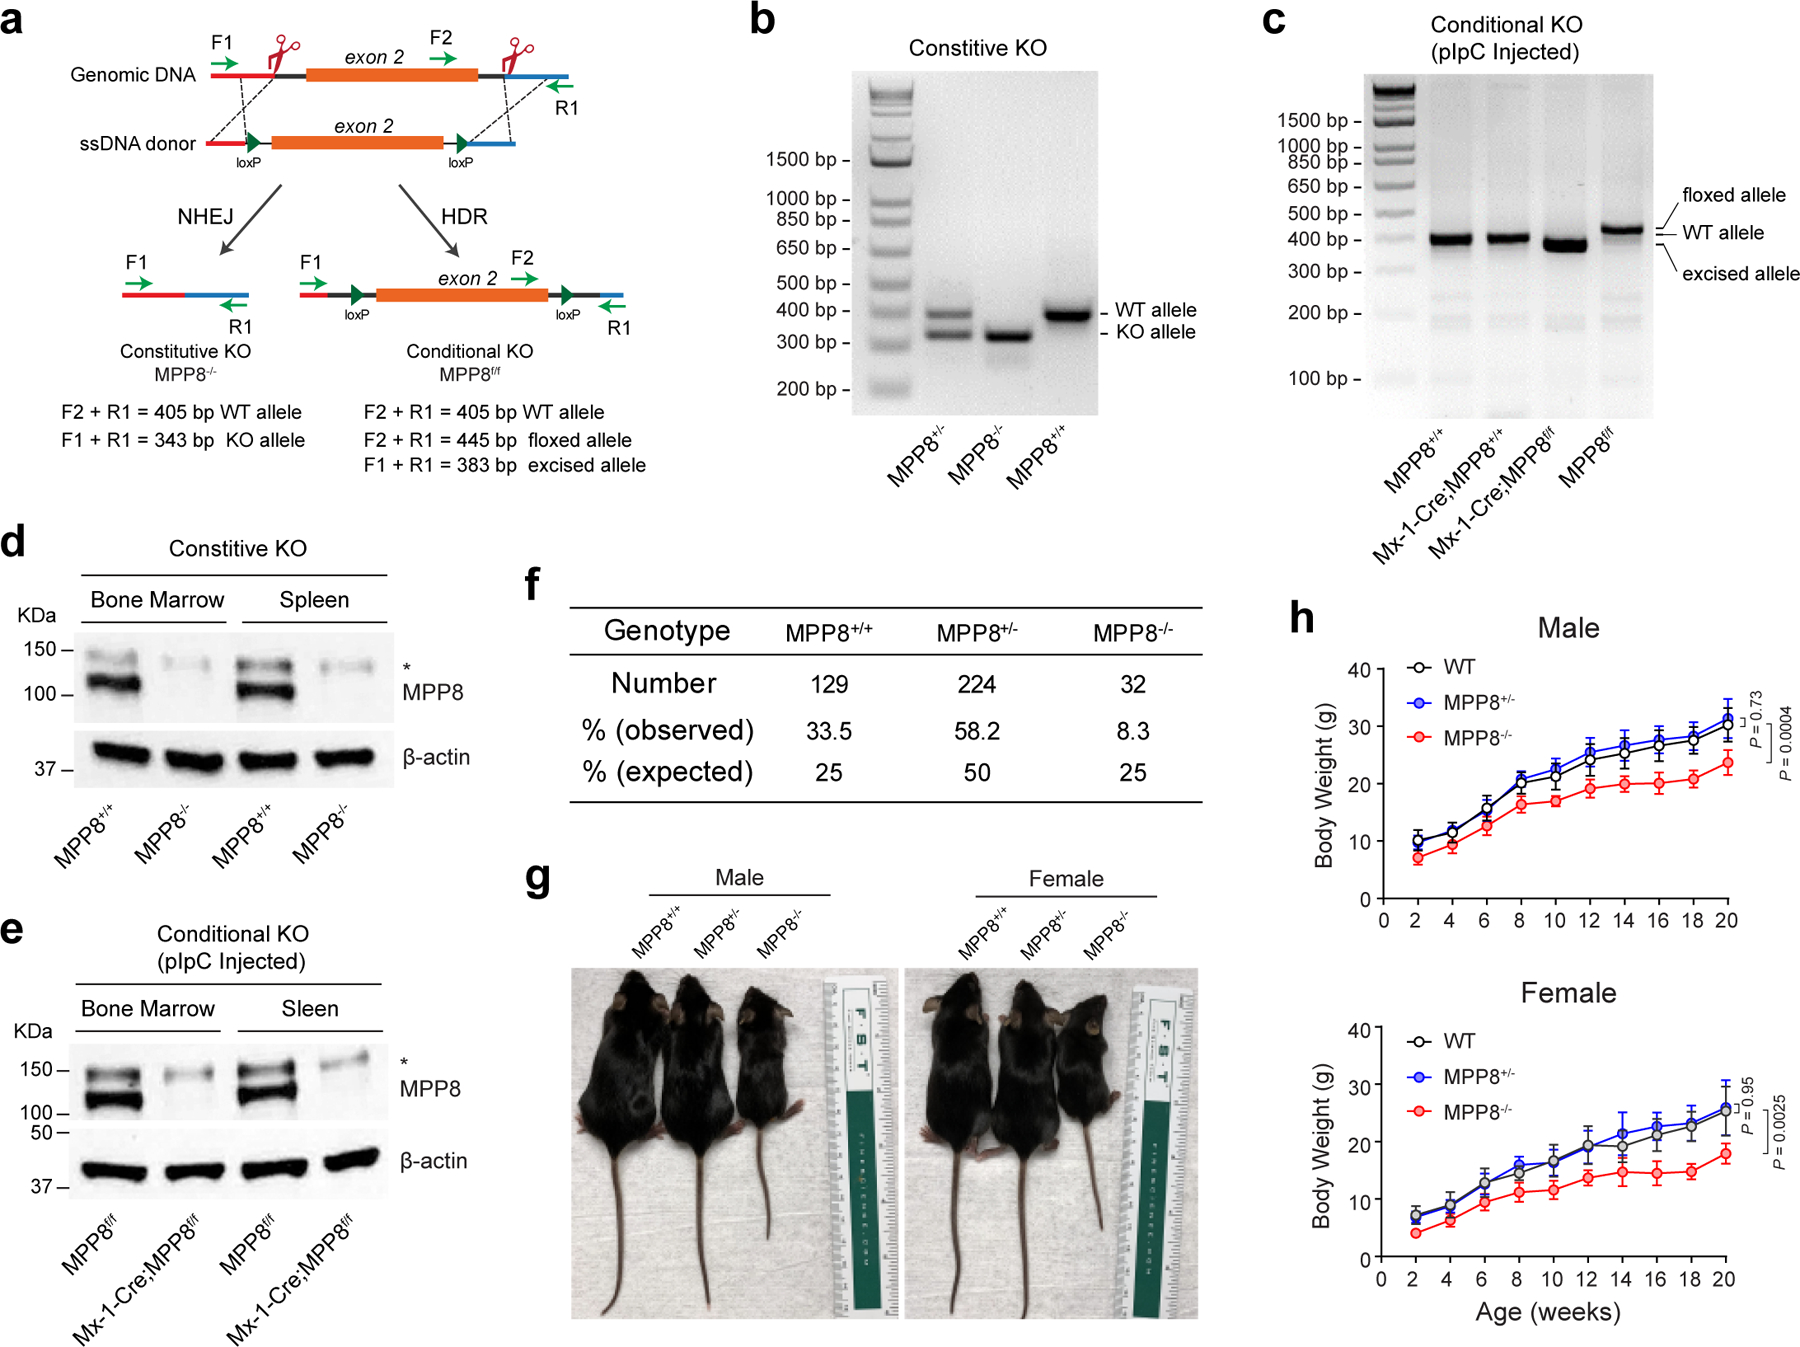
a, Schematic of the design and genotyping strategies of the MPP8 constitutive and conditional KO mouse models. The locations and sizes of the genotyping primers and PCR products are shown, respectively. b, Representative genotyping results are shown for the MPP8 constitutive heterozygous and homozygous KO mice. c, Representative genotyping results are shown for the MPP8 conditional heterozygous and homozygous KO mice (by Mx1-Cre) 2 weeks after pIpC-induced MPP8 deletion. Genomic DNA from lineage-negative bone marrow cells were analyzed. d, Validation of MPP8 KO by Western blot analysis of bone marrow and spleen cells in MPP8 WT and homozygous constitutive KO mice. The non-specific signal (*) was also observed by the MPP8 antibody. e, Validation of pIpC-induced MPP8 KO by Western blot of bone marrow and spleen cells in MPP8 conditional WT and homozygous KO mice (by Mx1-Cre) 2 weeks after pIpC-induced MPP8 deletion. f, Birth ratios are shown for MPP8 WT, heterozygous and homozygous constitutive KO mice from the breeding of MPP8 heterozygous KO mice. g, Representative images are shown for male and female mice with the indicated genotypes at 6-weeks old. h, Growth curves (body weight) of male or female mice of the indicated genotypes up to 20 weeks. Results are mean ± SD (N = 8 independent male or female mice per genotype) and analyzed by a two-way ANOVA with Dunnett’s test.
Extended Data Figure 5 |. MPP8 loss has no detectable effect on steady-state hematopoiesis.
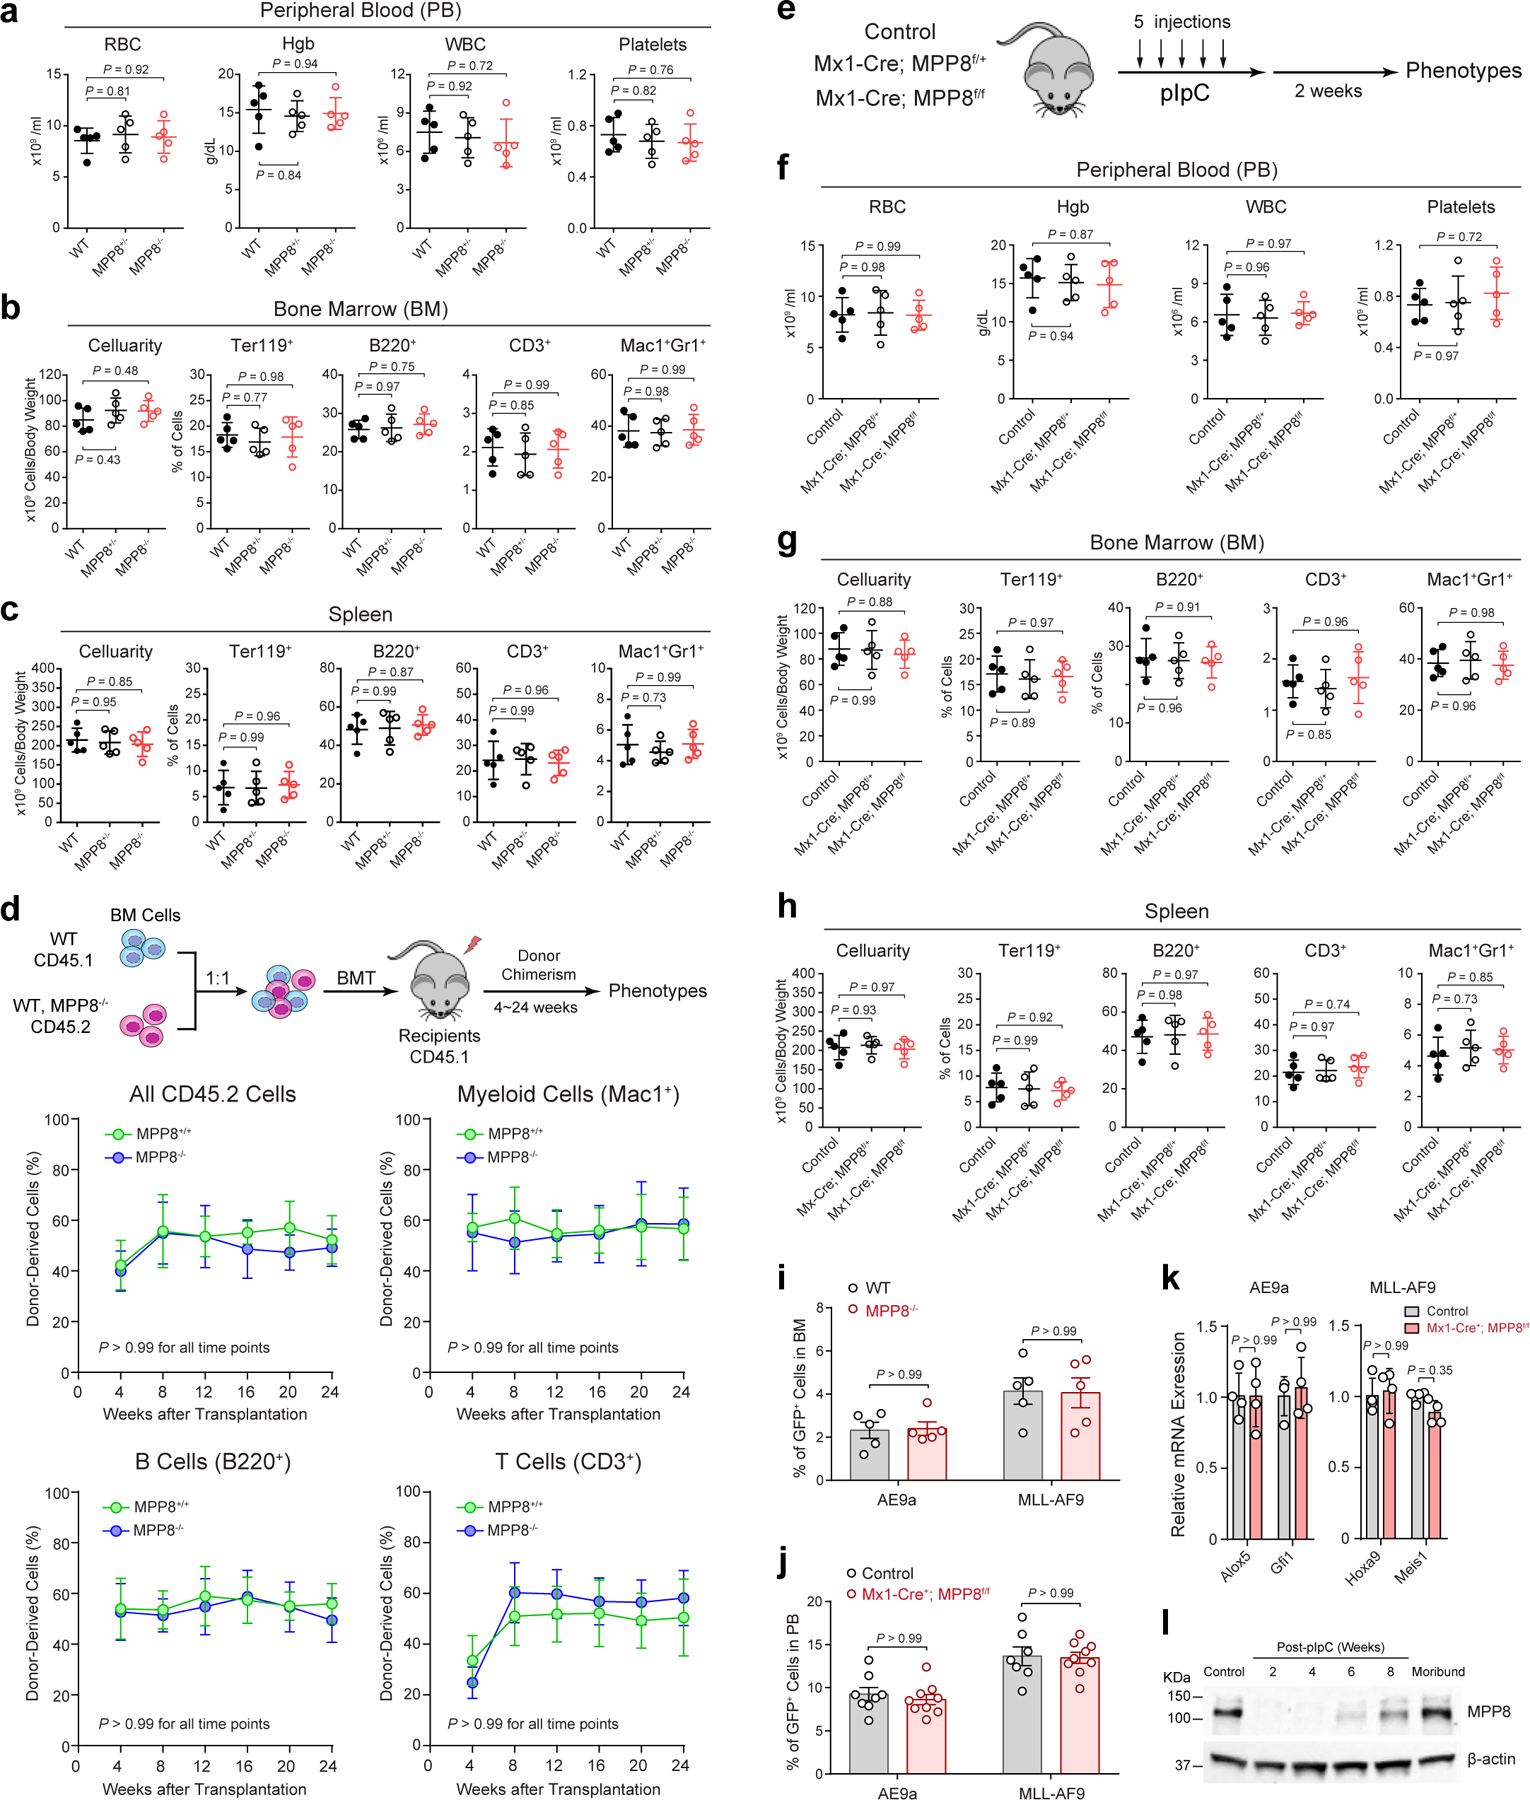
a, Complete blood counts (CBC) of PB red blood cells (RBC), hemoglobin (Hgb), white blood cells (WBC) and platelets in mice at 10-weeks old. N = 5 mice. b, Frequencies of BM erythroid (Ter119+), B-lymphoid (B220+), T-lymphoid (CD3+) and myeloid (Mac1+Gr1+) cells in mice at 8-weeks old. N = 5 mice. c, Cellularity and frequencies of spleen cell populations at 10-weeks old. N = 5 mice. d, Frequencies of donor-derived CD45.2+, myeloid (Mac1+), B (B220+) and T (CD3+) cells at 4 to 24 weeks after BMT. N = 5 mice. e, Schematic of experimental approach. f, CBC of PB RBC, Hgb, WBC and platelets. N = 5 mice. g, Cellularity and frequencies of BM cell populations. N = 5 mice. h, Cellularity and frequencies of spleen cell populations. N = 5 mice. i, Homing of AE9a or MLL-AF9-transformed cells in recipient BM. Results are shown for the % of GFP+ leukemia cells 16 hours after tail vein injection. N = 5 mice. j, MPP8 KO by Mx1-Cre had no effect on leukemia engraftment before pIpC administration in PB 4 weeks after tail vein injection. N = 8 control and 9 Mx1-Cre+;MPP8f/f mice (for AE9a), or N = 7 control and 9 Mx1-Cre+;MPP8f/f (for MLL-AF9). k, Expression of known AE9a and MLL-AF9 gene targets in AE9a or MLL-AF9-transformed BM cells, respectively. N = 4 experiments. l, Expression of MPP8 protein in MLL-AF9-transformed cells 2 to 8 weeks after pIpC-induced MPP8 deletion in recipients or the moribund mouse (12 weeks post-pIpC). Cells before transplantation were analyzed as the control. For a, b, c, f, g, h, results are mean ± SD and analyzed by a one-way ANOVA with Tukey’s test. For d, i, j, k, l, results are mean ± SD and analyzed by a two-way ANOVA with Bonferroni’s test.
Extended Data Figure 6 |. Expression and regulation of L1 retrotransposons in myeloid leukemia.
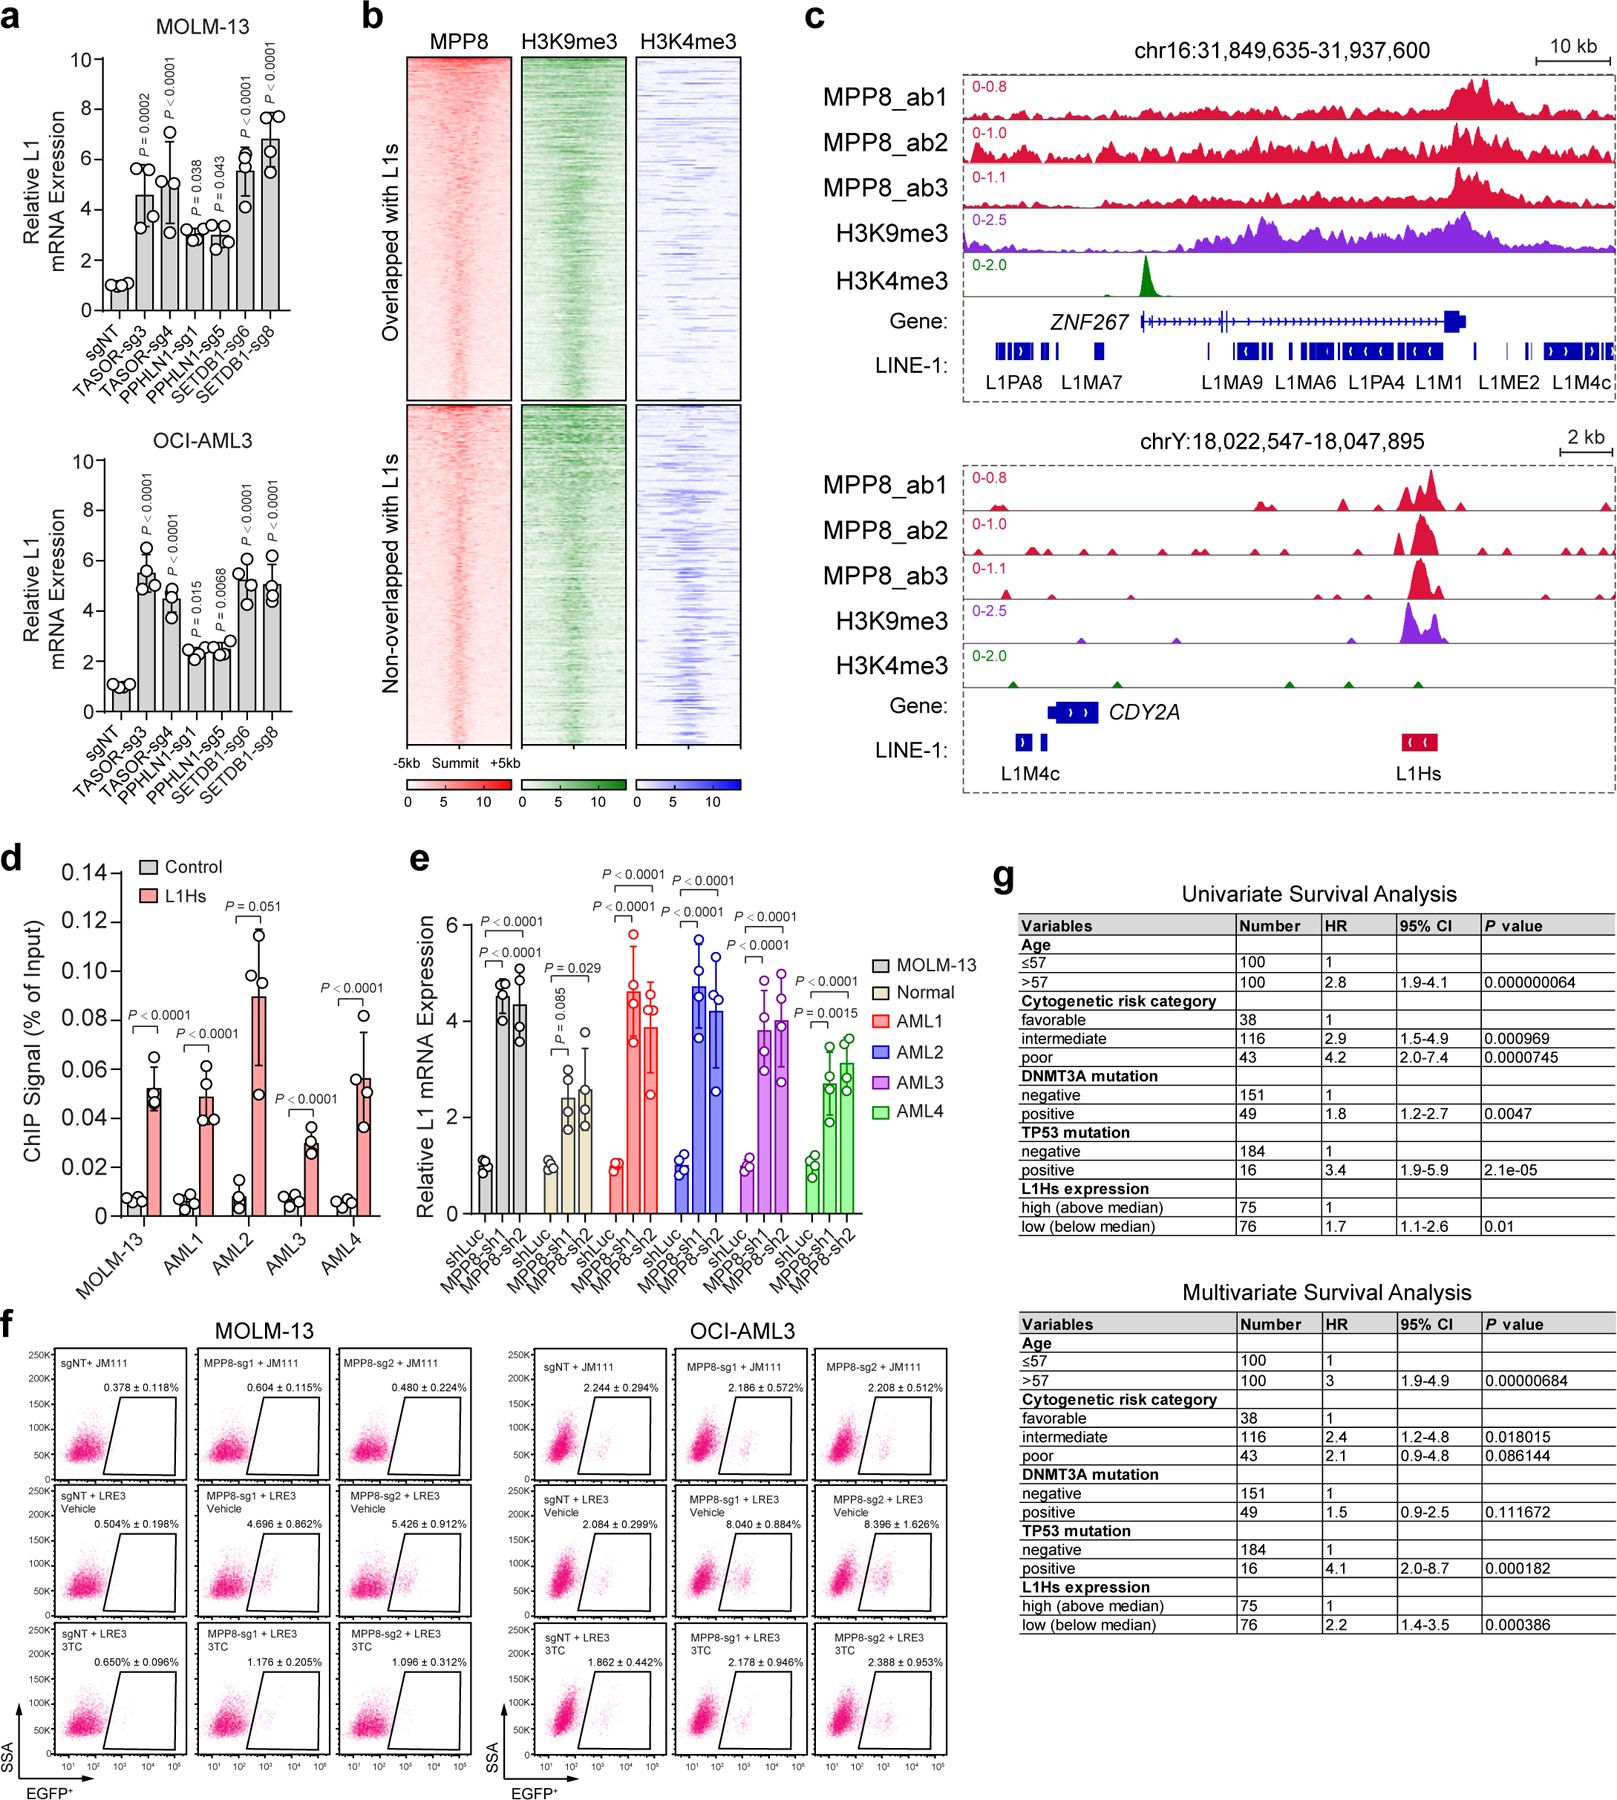
a, Expression of young L1s was significantly upregulated upon depletion of other HUSH components or SETDB1. Results are mean ± SD (N = 4 experiments) and analyzed by a one-way ANOVA with Dunnett’s test. b, Heatmap depicting the genome-wide co-localization between MPP8 and H3K9me3, but not H3K4me3, ChIP-seq signals in MOLM-13 cells. MPP8 occupied genome regions (N = 6,292 peaks) were ranked according to the normalized MPP8 ChIP-seq intensities, and the regions upstream (−5kb) and downstream (+5kb) of the ChIP-seq peak summit are shown. Independent ChIP-seq experiments were merged for the heatmap illustration. c, Browser view of representative loci showing enrichment of MPP8 and H3K9me3 ChIP-seq signals at L1s. d, Validation of MPP8 chromatin occupancy at L1Hs in MOLM-13 cells and four independent primary AML samples (AML1 to AML4). Primers for the β-actin locus was analyzed as the negative control. Results are mean ± SD (N = 4 experiments) and analyzed by a two-way ANOVA with Bonferroni’s test. e, Depletion of MPP8 reactivated L1s in MOLM-13 cells, human normal CD34+ HSPCs and primary AML samples. Fold changes of L1 expression were calculated in MPP8-depleted versus shLuc-transduced cells. Results are mean ± SD (N = 4 experiments) and analyzed by a two-way ANOVA with Dunnett’s test. f, MPP8 KO in AML cells increased L1 retrotransposition, which were inhibited by 10 µM of 3TC. Representative flow cytometry graphs are shown for control (sgNT) or MPP8 KO (MPP8-sg1 and MPP8-sg2) cells harboring the LRE3-EGFP retrotransposition reporter or the retrotransposition-deficient JM111 control, respectively. g, Lower L1Hs expression is associated with poor survival in AML patients. Univariate and multivariate Cox regression analyses were performed using the AML samples from the TCGA cohort (N = 134 samples). L1Hs-high (top 50%) and L1Hs-low (bottom 50%) samples were compared. P values by the two-sided Wald test.
Extended Data Figure 7 |. Reactivation of L1 retrotransposition impairs myeloid leukemia.
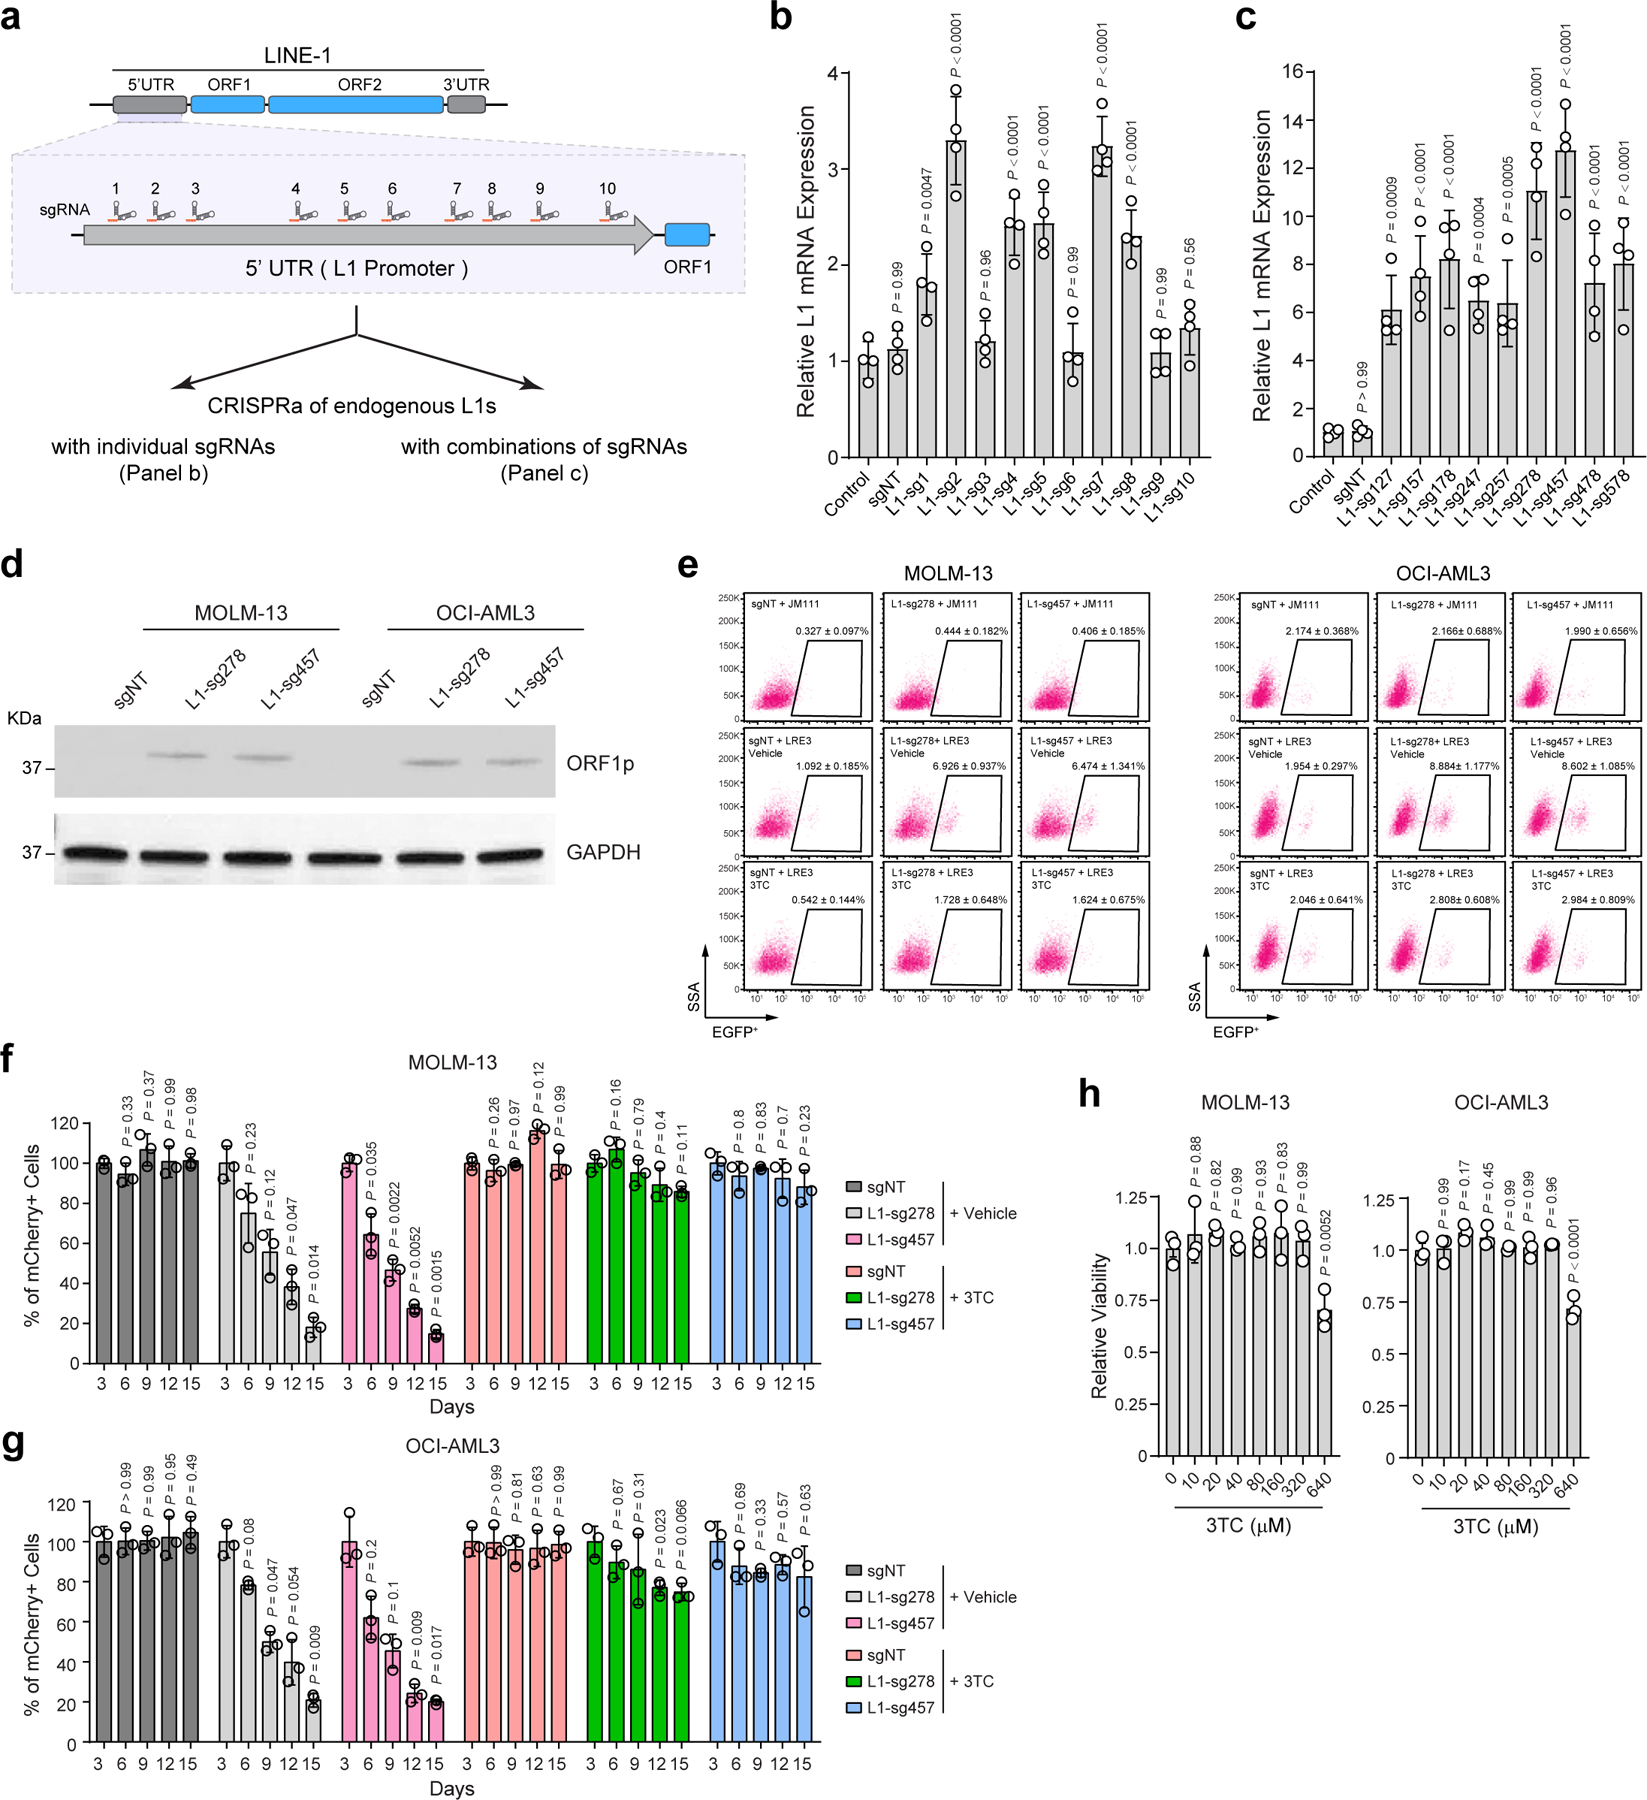
a, Schematic of 10 sgRNAs against the 5’UTR promoter sequences of the full-length L1Hs. b, CRISPRa-mediated activation of endogenous L1s in MOLM-13 cells using L1-promoter-targeting sgRNAs individually. Relative L1 expression was determined by qRT-PCR in non-transduced cells (control) and cells expressing non-targeting (sgNT) or L1-promoter-targeting sgRNAs (L1-sg1 to L1-sg10). Results are mean ± SD (N = 4 independent experiments) and analyzed by a one-way ANOVA with Dunnett’s test. c, CRISPRa of endogenous L1s in MOLM-13 cells using combinations of multiple L1-promoter-targeting sgRNAs. Results are mean ± SD (N = 4 independent experiments) and analyzed by a one-way ANOVA with Dunnett’s test. d, CRISPRa-mediated activation of endogenous L1s increased the expression of L1-encoded ORF1p in MOLM-13 and OCI-AML3 cells by Western blot. GAPDH was analyzed as a loading control. e, CRISPRa of endogenous L1s increased L1 retrotransposition in MOLM-13 and OCI-AML3 cells. Representative flow cytometry graphs are shown for control (sgNT) or L1 activated (L1-sg278 and L1-sg457) cells harboring the LRE3-EGFP or JM111 control, respectively. f, Activation of L1 retrotransposition impaired MOLM-13 cell growth by the negative-selection competition assay. Treatment with 3TC (10 µM) abrogated L1 retrotransposition-induced cell growth defects. Results are mean ± SD (N = 3 independent experiments) and analyzed by a two-way ANOVA with Dunnett’s test. g, Activation of L1 retrotransposition impaired OCI-AML3 cell growth, whereas 3TC treatment (10 µM) abrogated L1 retrotransposition-induced defects. Results are mean ± SD (N = 3 independent experiments) and analyzed by a two-way ANOVA with Dunnett’s test. h, 3TC treatment had no significant effect on AML cell viability as determined by treating MOLM-13 and OCI-AML3 cells with escalating doses (0 to 640 µM) of 3TC for 5 days. Results are mean ± SD (N = 3 independent experiments) and analyzed by a one-way ANOVA with Dunnett’s test.
Extended Data Figure 8 |. p21 KO abrogates MPP8 KO or L1 reactivation-induced phenotypes in AML cells in vitro.
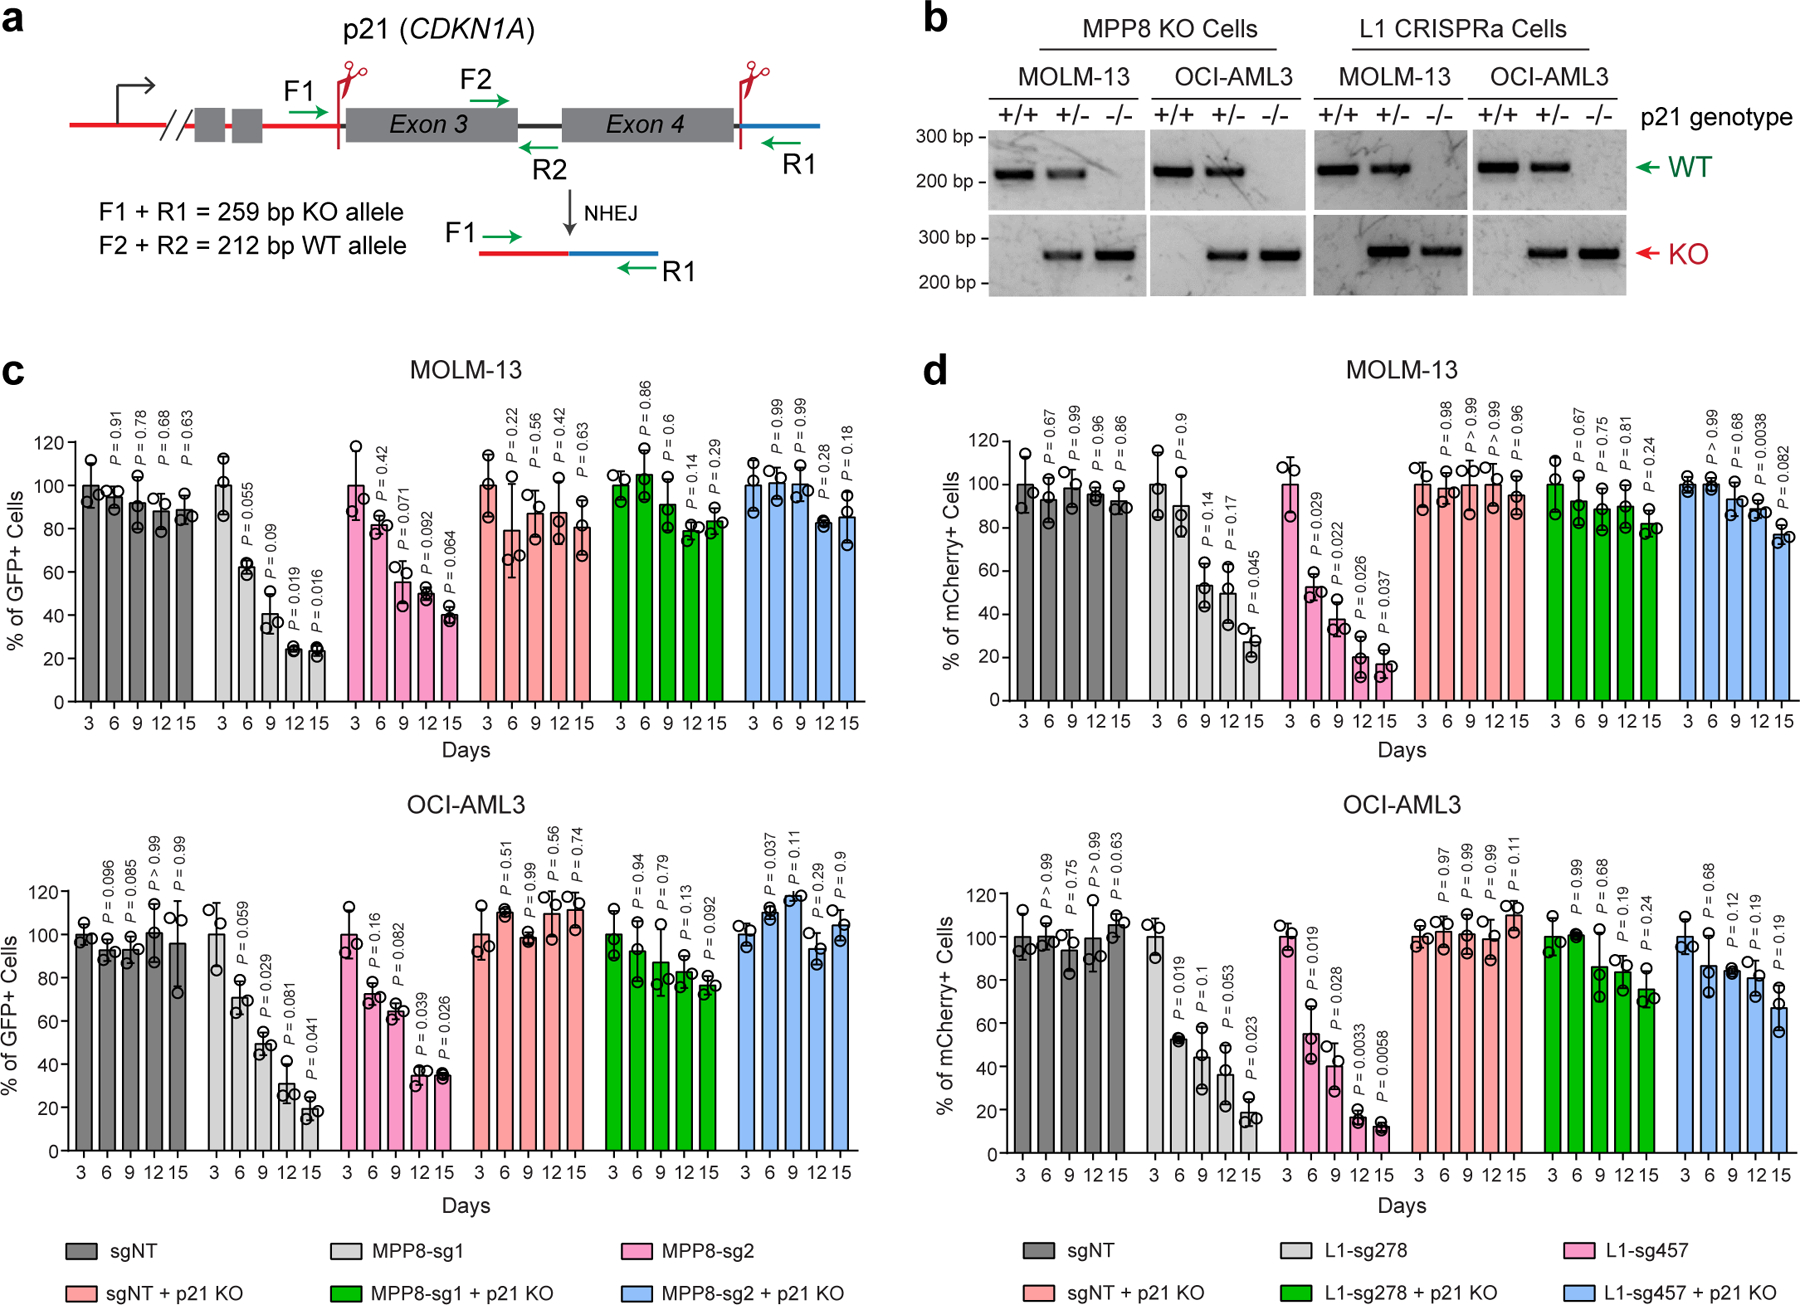
a, Schematic of CRISPR-mediated KO of p21 (CDKN1A) gene in human leukemia cells. The positions of sgRNAs and genotyping primers (F1, F2, R1 and R2) for WT or KO alleles are indicated. b, Representative genotyping results are shown for p21 KO in MOLM-13 and OCI-AML3 cells with MPP8 KO or CRISPRa (for L1 reactivation). c, p21 KO abrogated MPP8-deficiency-induced cell growth defects by the negative-selection competition assays in MOLM-13 and OCI-AML3 cells. Results are mean ± SD (N = 3 independent experiments) and analyzed by a two-way ANOVA with Dunnett’s test. d, p21 KO abrogated L1-reactivation-induced cell growth defects by the negative-selection competition assays in AML cells. Results are mean ± SD (N = 3 independent experiments) and analyzed by a two-way ANOVA with Dunnett’s test.
Extended Data Figure 9 |. p21 KO abrogates MPP8 KO or L1 reactivation-induced phenotypes in AML cells in vivo.
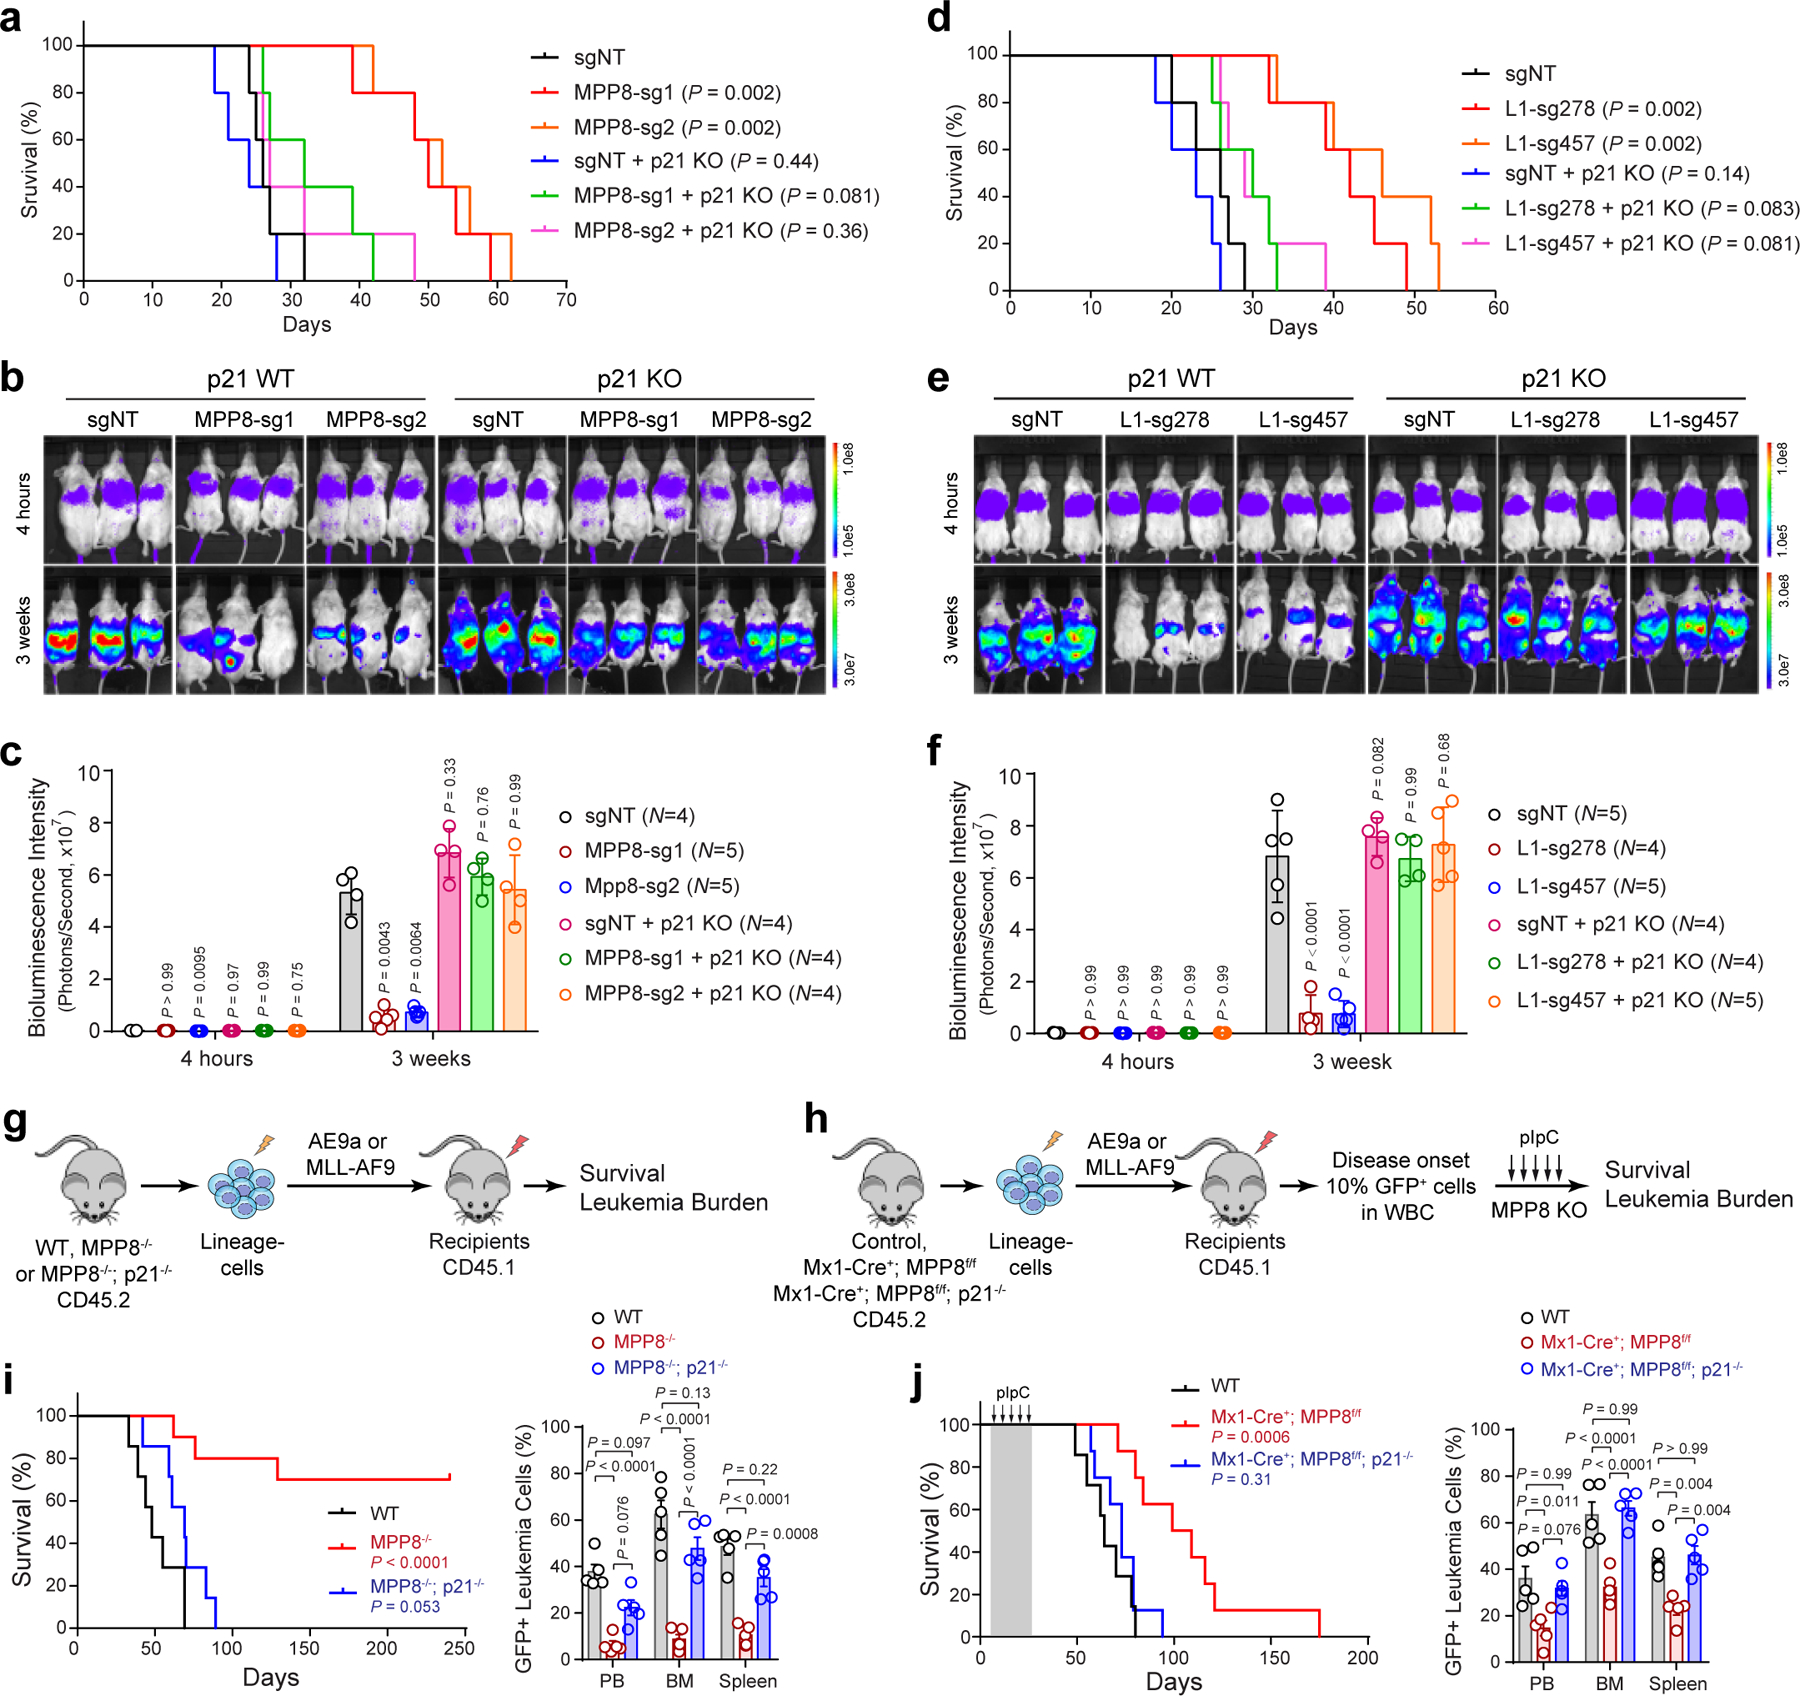
a, Survival curves of NSG mice xenografted with WT or p21 KO MOLM-13 cells transduced with control (sgNT) or MPP8-targeting sgRNAs. P values by a log-rank Mantel-Cox test. b, KO of p21 abrogated MPP8-deficiency-induced cell growth defects of MOLM-13 cells in NSG mice. Bioluminescence intensity is shown at 4 hours and 3 weeks post-transplantation. c, Quantification of bioluminescent imaging. The numbers of independent mice are indicated. Results are mean ± SD and analyzed by mixed-effects analysis with Dunnett’s test. d, Survival curves of NSG mice xenografted with WT or p21 KO MOLM-13 cells transduced with control or L1-promoter-targeting sgRNAs for CRISPRa-mediated L1 reactivation. P values by a log-rank Mantel-Cox test. e, KO of p21 abrogated L1-reactivation-induced cell growth defects of MOLM-13 cells in xenografted NSG mice. f, Quantification of bioluminescent imaging. The numbers of independent mice are indicated. Results are mean ± SD and analyzed by mixed-effects analysis with Dunnett’s test. g, Schematic of the leukemia initiation experiments. h, Schematic of the leukemia maintenance experiments. i, Survival curves of recipient mice engrafted with WT (N = 7 mice), MPP8−/− (N = 10), or MPP8−/−p21−/− (N = 7) BM lineage-negative cells transduced with MLL-AF9. P values by a log-rank Mantel-Cox test. Quantification of leukemia burden by % of GFP+ leukemia cells at day 38 post-transplantation is shown. Results are mean ± SEM and analyzed by a two-way ANOVA with Tukey’s test. j, Survival curves of recipient mice engrafted with cells of the indicated genotypes transduced with MLL-AF9 for the leukemia maintenance experiments. N = 7, 8, and 8 WT, Mx1-Cre+;MPP8f/f, and Mx1-Cre+;MPP8f/f;p21−/− mice, respectively. P values by a log-rank Mantel-Cox test. Quantification of leukemia burden at day 60 post-transplantation is shown. Results are mean ± SEM and analyzed by a two-way ANOVA with Tukey’s test.
Extended Data Figure 10 |. p53 is required for MPP8 KO or L1 reactivation-induced phenotypes in AML cells.
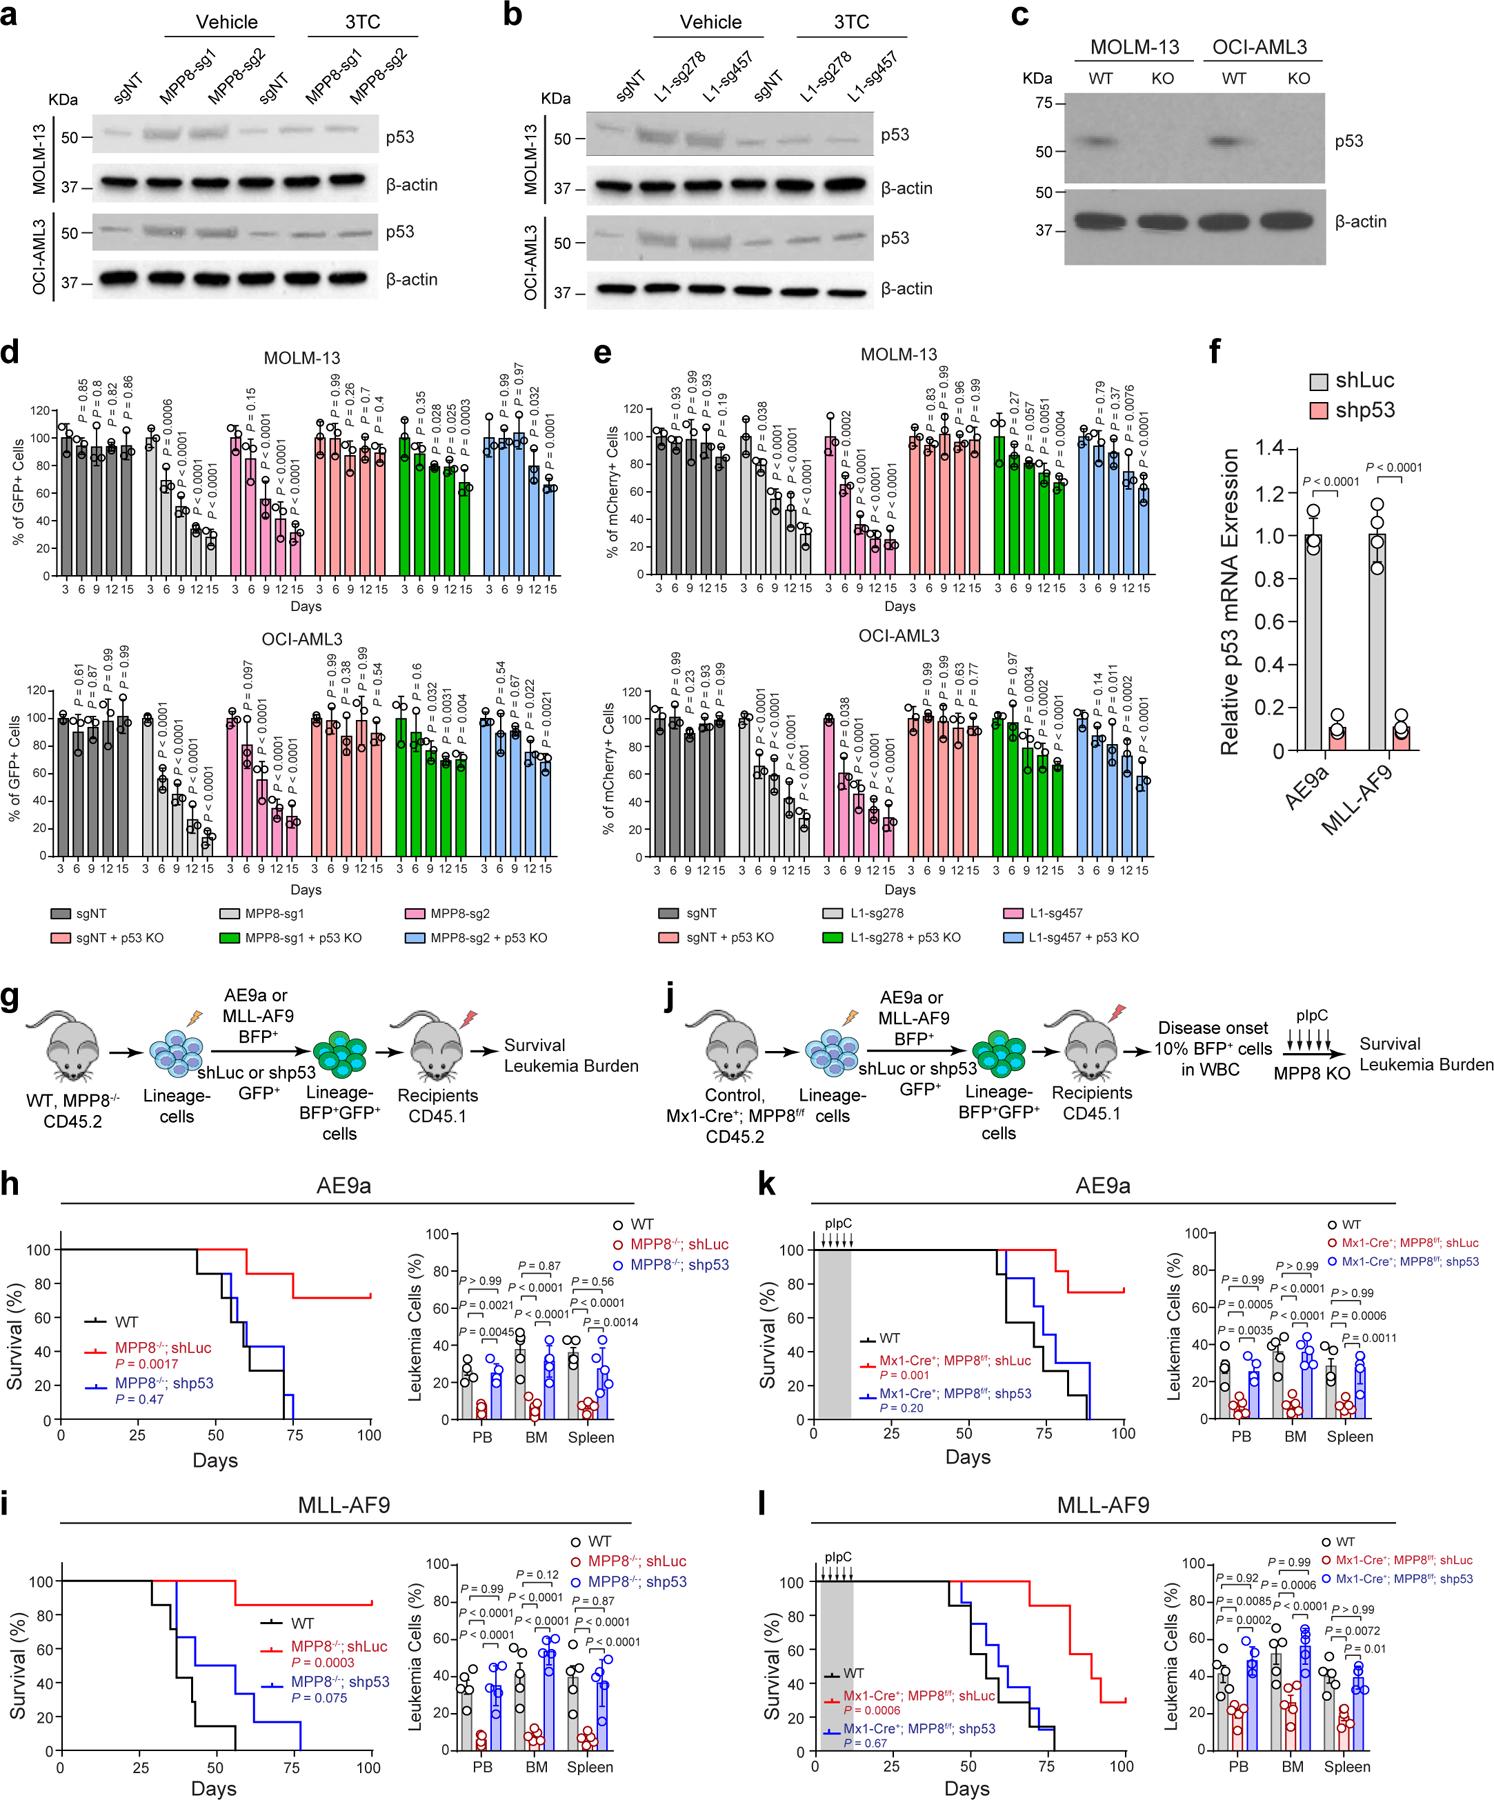
a, MPP8 loss increased p53 expression in AML cells. b, L1 reactivation increased p53 expression in AML cells. c, Validation of p53 KO by Western blot. d, p53 KO blunted MPP8-deficiency-induced cell growth defects. Results are mean ± SD (N = 3 experiments) and analyzed by a two-way ANOVA with Dunnett’s test. e, p53 KO blunted L1-reactivation-induced cell growth defects. Results are mean ± SD (N = 3 independent experiments) and analyzed by a two-way ANOVA with Dunnett’s test. f, Validation of p53 depletion in AE9a or MLL-AF9-transformed BM cells. Results are mean ± SD (N = 4 experiments) and analyzed by a two-way ANOVA with Bonferroni’s test. g, Schematic of the leukemia initiation experiments. h, Survival curves of recipients engrafted with AE9a-transformed WT or MPP8−/− cells with control (shLuc) or p53 depletion. N = 7 mice. P values by a log-rank Mantel-Cox test. Quantification of leukemia burden at day 50 post-transplantation (N = 5 mice) is shown. i, Survival curves of recipients engrafted with MLL-AF9-transformed WT or MPP8−/− cells with or without p53 depletion. N = 7, 7, and 6 mice for WT, MPP8−/−;shLuc, and MPP8−/−;shp53, respectively. Quantification of leukemia burden at day 37 (N = 5 mice) is shown. j, Schematic of the leukemia maintenance experiments. k, Survival curves of recipients engrafted with AE9a-transformed cells. N = 7, 8, and 6 mice for WT, Mx1-Cre+;MPP8f/f;shLuc, and Mx1-Cre+;MPP8f/f;shp53, respectively. Quantification of leukemia burden at day 62 (N = 5 mice) is shown. l, Survival curves of recipients engrafted with MLL-AF9-transformed cells. N = 7, 7, and 8 mice for WT, Mx1-Cre+;MPP8f/f;shLuc, and Mx1-Cre+;MPP8f/f;shp53, respectively. Quantification of leukemia burden at day 47 (N = 5 mice) is shown. For h, i, k and l, results are mean ± SD and analyzed by a two-way ANOVA with Tukey’s test.
Supplementary Material
Acknowledgments
We are grateful to S.J. Morrison, R.J. DeBerardinis, H. Zhu, M. Agathokleous, and S. Chung at UTSW for discussion, G.G. Wang at the University of North Carolina at Chapel Hill for the OCI-AML3 cell line, J. Wysocka at Stanford University for assistance with RNA-seq and ChIP-seq pipelines, and other Xu laboratory members for technical support. Y.L. was supported by the Cancer Prevention and Research Institute of Texas (CPRIT) training grant (RP160157). A.W. was supported by NIH Cancer Biology Training Grant T32CA124334. W.A. was supported by NIH grants (R21OD017965 and R15GM131263) and the Markl Faculty Scholar Fund. J.X. is a Scholar of The Leukemia & Lymphoma Society (LLS) and an American Society of Hematology (ASH) Scholar. This work was supported by the NIH grants R01CA230631 and R01DK111430 (to J.X.), R01CA248736 (to C.C.Z.), R01GM115682 and R01CA222579 (to J.M.A.), by the CPRIT grants (RR140025, RP180504, RP180826 and RP190417 to J.X.; RP170086 to J.M.A.), by the Leukemia Texas Foundation research award, and by the Welch Foundation grant I-1942 (to J.X.).
Footnotes
Competing Interests Statement
The authors declare no competing interests
Code availability
RNA-seq analyses were conducted using STAR2.5.2b, DESeq2, and featureCounts1.6.2. ChIP-seq analyses were conducted using Bowtie2.1.0 and MACS2. Counting and normalization of sgRNAs were performed using MAGeCK. Code for analyses using other indicated software is available from the websites of the corresponding software.
Data availability
All raw and processed RNA-seq and ChIP-seq data are available in the Gene Expression Omnibus (GEO): GSE150984. All other genomic datasets are listed in Supplementary Table 4. All key reagents and resources are listed in Supplementary Table 6.
References
- 1.Kazazian HH Jr. & Moran JV The impact of L1 retrotransposons on the human genome. Nat Genet 19, 19–24 (1998). [DOI] [PubMed] [Google Scholar]
- 2.Kazazian HH Jr. & Moran JV Mobile DNA in Health and Disease. N Engl J Med 377, 361–370 (2017). [DOI] [PMC free article] [PubMed] [Google Scholar]
- 3.Burns KH Transposable elements in cancer. Nat Rev Cancer 17, 415–424 (2017). [DOI] [PubMed] [Google Scholar]
- 4.Huang CR, Burns KH & Boeke JD Active transposition in genomes. Annu Rev Genet 46, 651–75 (2012). [DOI] [PMC free article] [PubMed] [Google Scholar]
- 5.Lander ES et al. Initial sequencing and analysis of the human genome. Nature 409, 860–921 (2001). [DOI] [PubMed] [Google Scholar]
- 6.Payer LM & Burns KH Transposable elements in human genetic disease. Nature Reviews Genetics 20, 760–772 (2019). [DOI] [PubMed] [Google Scholar]
- 7.Kazazian HH Jr. et al. Haemophilia A resulting from de novo insertion of L1 sequences represents a novel mechanism for mutation in man. Nature 332, 164–6 (1988). [DOI] [PubMed] [Google Scholar]
- 8.Beck CR, Garcia-Perez JL, Badge RM & Moran JV LINE-1 elements in structural variation and disease. Annu Rev Genomics Hum Genet 12, 187–215 (2011). [DOI] [PMC free article] [PubMed] [Google Scholar]
- 9.Hancks DC & Kazazian HH Jr. Roles for retrotransposon insertions in human disease. Mob DNA 7, 9 (2016). [DOI] [PMC free article] [PubMed] [Google Scholar]
- 10.Rodriguez-Martin B et al. Pan-cancer analysis of whole genomes identifies driver rearrangements promoted by LINE-1 retrotransposition. Nature Genetics 52, 306–319 (2020). [DOI] [PMC free article] [PubMed] [Google Scholar]
- 11.Li Y et al. Patterns of somatic structural variation in human cancer genomes. Nature 578, 112–121 (2020). [DOI] [PMC free article] [PubMed] [Google Scholar]
- 12.Neff T & Armstrong SA Recent progress toward epigenetic therapies: the example of mixed lineage leukemia. Blood 121, 4847–53 (2013). [DOI] [PMC free article] [PubMed] [Google Scholar]
- 13.Fennell KA, Bell CC & Dawson MA Epigenetic therapies in acute myeloid leukemia: where to from here? Blood 134, 1891–1901 (2019). [DOI] [PubMed] [Google Scholar]
- 14.Shih AH, Abdel-Wahab O, Patel JP & Levine RL The role of mutations in epigenetic regulators in myeloid malignancies. Nat Rev Cancer 12, 599–612 (2012). [DOI] [PubMed] [Google Scholar]
- 15.Dawson MA The cancer epigenome: Concepts, challenges, and therapeutic opportunities. Science 355, 1147–1152 (2017). [DOI] [PubMed] [Google Scholar]
- 16.Shi J et al. Discovery of cancer drug targets by CRISPR-Cas9 screening of protein domains. Nat Biotechnol 33, 661–7 (2015). [DOI] [PMC free article] [PubMed] [Google Scholar]
- 17.Garcia-Perez JL et al. Epigenetic silencing of engineered L1 retrotransposition events in human embryonic carcinoma cells. Nature 466, 769–73 (2010). [DOI] [PMC free article] [PubMed] [Google Scholar]
- 18.Liu N et al. Selective silencing of euchromatic L1s revealed by genome-wide screens for L1 regulators. Nature 553, 228–232 (2018). [DOI] [PMC free article] [PubMed] [Google Scholar]
- 19.Tchasovnikarova IA et al. GENE SILENCING. Epigenetic silencing by the HUSH complex mediates position-effect variegation in human cells. Science 348, 1481–1485 (2015). [DOI] [PMC free article] [PubMed] [Google Scholar]
- 20.Timms RT, Tchasovnikarova IA, Antrobus R, Dougan G & Lehner PJ ATF7IP-Mediated Stabilization of the Histone Methyltransferase SETDB1 Is Essential for Heterochromatin Formation by the HUSH Complex. Cell Rep 17, 653–659 (2016). [DOI] [PMC free article] [PubMed] [Google Scholar]
- 21.Timms RT, Tchasovnikarova IA & Lehner PJ Position-effect variegation revisited: HUSHing up heterochromatin in human cells. Bioessays 38, 333–43 (2016). [DOI] [PubMed] [Google Scholar]
- 22.Arrowsmith CH, Bountra C, Fish PV, Lee K & Schapira M Epigenetic protein families: a new frontier for drug discovery. Nat Rev Drug Discov 11, 384–400 (2012). [DOI] [PubMed] [Google Scholar]
- 23.Shalem O et al. Genome-scale CRISPR-Cas9 knockout screening in human cells. Science 343, 84–87 (2014). [DOI] [PMC free article] [PubMed] [Google Scholar]
- 24.Kuhn R, Schwenk F, Aguet M & Rajewsky K Inducible gene targeting in mice. Science 269, 1427–9 (1995). [DOI] [PubMed] [Google Scholar]
- 25.Rhoades KL et al. Analysis of the role of AML1-ETO in leukemogenesis, using an inducible transgenic mouse model. Blood 96, 2108–15 (2000). [PubMed] [Google Scholar]
- 26.Krivtsov AV et al. Transformation from committed progenitor to leukaemia stem cell initiated by MLL-AF9. Nature 442, 818–22 (2006). [DOI] [PubMed] [Google Scholar]
- 27.Teissandier A, Servant N, Barillot E & Bourc’his D Tools and best practices for retrotransposon analysis using high-throughput sequencing data. Mobile DNA 10, 52 (2019). [DOI] [PMC free article] [PubMed] [Google Scholar]
- 28.Moran JV et al. High frequency retrotransposition in cultured mammalian cells. Cell 87, 917–27 (1996). [DOI] [PubMed] [Google Scholar]
- 29.Ostertag EM, Prak ET, DeBerardinis RJ, Moran JV & Kazazian HH Jr. Determination of L1 retrotransposition kinetics in cultured cells. Nucleic Acids Res 28, 1418–23 (2000). [DOI] [PMC free article] [PubMed] [Google Scholar]
- 30.Painter GR, Almond MR, Mao S & Liotta DC Biochemical and mechanistic basis for the activity of nucleoside analogue inhibitors of HIV reverse transcriptase. Curr Top Med Chem 4, 1035–44 (2004). [DOI] [PubMed] [Google Scholar]
- 31.Jones RB et al. Nucleoside analogue reverse transcriptase inhibitors differentially inhibit human LINE-1 retrotransposition. PLoS One 3, e1547 (2008). [DOI] [PMC free article] [PubMed] [Google Scholar]
- 32.Dai L, Huang Q & Boeke JD Effect of reverse transcriptase inhibitors on LINE-1 and Ty1 reverse transcriptase activities and on LINE-1 retrotransposition. BMC Biochem 12, 18 (2011). [DOI] [PMC free article] [PubMed] [Google Scholar]
- 33.Magee JA, Piskounova E & Morrison SJ Cancer stem cells: impact, heterogeneity, and uncertainty. Cancer Cell 21, 283–96 (2012). [DOI] [PMC free article] [PubMed] [Google Scholar]
- 34.Thomas D & Majeti R Biology and relevance of human acute myeloid leukemia stem cells. Blood 129, 1577–1585 (2017). [DOI] [PMC free article] [PubMed] [Google Scholar]
- 35.Pandolfi A, Barreyro L & Steidl U Concise review: preleukemic stem cells: molecular biology and clinical implications of the precursors to leukemia stem cells. Stem Cells Transl Med 2, 143–50 (2013). [DOI] [PMC free article] [PubMed] [Google Scholar]
- 36.Pabst C et al. GPR56 identifies primary human acute myeloid leukemia cells with high repopulating potential in vivo. Blood 127, 2018–27 (2016). [DOI] [PubMed] [Google Scholar]
- 37.Li S et al. Distinct evolution and dynamics of epigenetic and genetic heterogeneity in acute myeloid leukemia. Nature Medicine 22, 792–9 (2016). [DOI] [PMC free article] [PubMed] [Google Scholar]
- 38.Cocciardi S et al. Clonal evolution patterns in acute myeloid leukemia with NPM1 mutation. Nature Communications 10, 2031 (2019). [DOI] [PMC free article] [PubMed] [Google Scholar]
- 39.Guryanova OA et al. DNMT3A mutations promote anthracycline resistance in acute myeloid leukemia via impaired nucleosome remodeling. Nature Medicine 22, 1488–1495 (2016). [DOI] [PMC free article] [PubMed] [Google Scholar]
- 40.Kunimoto H et al. Cooperative Epigenetic Remodeling by TET2 Loss and NRAS Mutation Drives Myeloid Transformation and MEK Inhibitor Sensitivity. Cancer Cell 33, 44–59.e8 (2018). [DOI] [PMC free article] [PubMed] [Google Scholar]
- 41.Ito K et al. Non-catalytic Roles of Tet2 Are Essential to Regulate Hematopoietic Stem and Progenitor Cell Homeostasis. Cell Rep 28, 2480–2490.e4 (2019). [DOI] [PMC free article] [PubMed] [Google Scholar]
- 42.Gu Z et al. Loss of EZH2 Reprograms BCAA Metabolism to Drive Leukemic Transformation. Cancer Discovery 9, 1228–1247 (2019). [DOI] [PMC free article] [PubMed] [Google Scholar]
- 43.Zhu Y, Wang GZ, Cingoz O & Goff SP NP220 mediates silencing of unintegrated retroviral DNA. Nature 564, 278–282 (2018). [DOI] [PMC free article] [PubMed] [Google Scholar]
- 44.Chavez A et al. Highly efficient Cas9-mediated transcriptional programming. Nature Methods 12, 326–8 (2015). [DOI] [PMC free article] [PubMed] [Google Scholar]
- 45.Konermann S et al. Genome-scale transcriptional activation by an engineered CRISPR-Cas9 complex. Nature 517, 583–8 (2015). [DOI] [PMC free article] [PubMed] [Google Scholar]
- 46.An W et al. Active retrotransposition by a synthetic L1 element in mice. Proc Natl Acad Sci U S A 103, 18662–7 (2006). [DOI] [PMC free article] [PubMed] [Google Scholar]
- 47.Rosser JM & An W Repeat-induced gene silencing of L1 transgenes is correlated with differential promoter methylation. Gene 456, 15–23 (2010). [DOI] [PMC free article] [PubMed] [Google Scholar]
- 48.Santos MA et al. DNA-damage-induced differentiation of leukaemic cells as an anti-cancer barrier. Nature 514, 107–11 (2014). [DOI] [PMC free article] [PubMed] [Google Scholar]
- 49.Scoumanne A & Chen X The lysine-specific demethylase 1 is required for cell proliferation in both p53-dependent and -independent manners. J Biol Chem 282, 15471–5 (2007). [DOI] [PubMed] [Google Scholar]
- 50.Mosammaparast N et al. The histone demethylase LSD1/KDM1A promotes the DNA damage response. J Cell Biol 203, 457–70 (2013). [DOI] [PMC free article] [PubMed] [Google Scholar]
- 51.Schenk T et al. Inhibition of the LSD1 (KDM1A) demethylase reactivates the all-trans-retinoic acid differentiation pathway in acute myeloid leukemia. Nat Med 18, 605–11 (2012). [DOI] [PMC free article] [PubMed] [Google Scholar]
- 52.Harris WJ et al. The histone demethylase KDM1A sustains the oncogenic potential of MLL-AF9 leukemia stem cells. Cancer Cell 21, 473–87 (2012). [DOI] [PubMed] [Google Scholar]
- 53.Gasior SL, Wakeman TP, Xu B & Deininger PL The human LINE-1 retrotransposon creates DNA double-strand breaks. J Mol Biol 357, 1383–93 (2006). [DOI] [PMC free article] [PubMed] [Google Scholar]
- 54.Belgnaoui SM, Gosden RG, Semmes OJ & Haoudi A Human LINE-1 retrotransposon induces DNA damage and apoptosis in cancer cells. Cancer Cell Int 6, 13 (2006). [DOI] [PMC free article] [PubMed] [Google Scholar]
- 55.Vousden KH & Lane DP p53 in health and disease. Nat Rev Mol Cell Biol 8, 275–83 (2007). [DOI] [PubMed] [Google Scholar]
- 56.Ardeljan D et al. Cell fitness screens reveal a conflict between LINE-1 retrotransposition and DNA replication. Nat Struct Mol Biol 27, 168–178 (2020). [DOI] [PMC free article] [PubMed] [Google Scholar]
- 57.Wylie A et al. p53 genes function to restrain mobile elements. Genes Dev 30, 64–77 (2016). [DOI] [PMC free article] [PubMed] [Google Scholar]
- 58.Tiwari B et al. p53 directly represses human LINE1 transposons. Genes Dev (2020). [DOI] [PMC free article] [PubMed]
- 59.De Cecco M et al. L1 drives IFN in senescent cells and promotes age-associated inflammation. Nature 566, 73–78 (2019). [DOI] [PMC free article] [PubMed] [Google Scholar]
- 60.Simon M et al. LINE1 Derepression in Aged Wild-Type and SIRT6-Deficient Mice Drives Inflammation. Cell Metab 29, 871–885.e5 (2019). [DOI] [PMC free article] [PubMed] [Google Scholar]
- 61.Chen Q, Sun L & Chen ZJ Regulation and function of the cGAS-STING pathway of cytosolic DNA sensing. Nat Immunol 17, 1142–9 (2016). [DOI] [PubMed] [Google Scholar]
- 62.Hur S Double-Stranded RNA Sensors and Modulators in Innate Immunity. Annu Rev Immunol 37, 349–375 (2019). [DOI] [PMC free article] [PubMed] [Google Scholar]
- 63.Pietras EM Inflammation: a key regulator of hematopoietic stem cell fate in health and disease. Blood 130, 1693–1698 (2017). [DOI] [PMC free article] [PubMed] [Google Scholar]
- 64.Anguille S et al. Interferon-alpha in acute myeloid leukemia: an old drug revisited. Leukemia 25, 739–48 (2011). [DOI] [PubMed] [Google Scholar]
- 65.Bowman RL, Busque L & Levine RL Clonal Hematopoiesis and Evolution to Hematopoietic Malignancies. Cell Stem Cell 22, 157–170 (2018). [DOI] [PMC free article] [PubMed] [Google Scholar]
- 66.Jaiswal S & Ebert BL Clonal hematopoiesis in human aging and disease. Science 366(2019). [DOI] [PMC free article] [PubMed] [Google Scholar]
Methods-only References
- 67.Miura H, Quadros RM & Gurumurthy CB Easi-CRISPR for creating knock-in and conditional knockout mouse models using long ssDNA donors. Nature Protocols 13, 195–215 (2018). [DOI] [PMC free article] [PubMed] [Google Scholar]
- 68.Labun K et al. CHOPCHOP v3: expanding the CRISPR web toolbox beyond genome editing. Nucleic Acids Res 47, W171–w174 (2019). [DOI] [PMC free article] [PubMed] [Google Scholar]
- 69.Chen B et al. Dynamic imaging of genomic loci in living human cells by an optimized CRISPR/Cas system. Cell 155, 1479–91 (2013). [DOI] [PMC free article] [PubMed] [Google Scholar]
- 70.Li K et al. Interrogation of enhancer function by enhancer-targeting CRISPR epigenetic editing. Nat Commun 11, 485 (2020). [DOI] [PMC free article] [PubMed] [Google Scholar]
- 71.Premsrirut PK et al. A rapid and scalable system for studying gene function in mice using conditional RNA interference. Cell 145, 145–58 (2011). [DOI] [PMC free article] [PubMed] [Google Scholar]
- 72.Li K et al. Noncoding Variants Connect Enhancer Dysregulation with Nuclear Receptor Signaling in Hematopoietic Malignancies. Cancer Discovery 10, 724–745 (2020). [DOI] [PMC free article] [PubMed] [Google Scholar]
- 73.Li W et al. MAGeCK enables robust identification of essential genes from genome-scale CRISPR/Cas9 knockout screens. Genome Biol 15, 554 (2014). [DOI] [PMC free article] [PubMed] [Google Scholar]
- 74.Trapnell C, Pachter L & Salzberg SL TopHat: discovering splice junctions with RNA-Seq. Bioinformatics 25, 1105–11 (2009). [DOI] [PMC free article] [PubMed] [Google Scholar]
- 75.Liao Y, Smyth GK & Shi W featureCounts: an efficient general purpose program for assigning sequence reads to genomic features. Bioinformatics 30, 923–30 (2014). [DOI] [PubMed] [Google Scholar]
- 76.Love MI, Huber W & Anders S Moderated estimation of fold change and dispersion for RNA-seq data with DESeq2. Genome Biol 15, 550 (2014). [DOI] [PMC free article] [PubMed] [Google Scholar]
- 77.Subramanian A et al. Gene set enrichment analysis: a knowledge-based approach for interpreting genome-wide expression profiles. Proc Natl Acad Sci U S A 102, 15545–50 (2005). [DOI] [PMC free article] [PubMed] [Google Scholar]
- 78.Liu X et al. In Situ Capture of Chromatin Interactions by Biotinylated dCas9. Cell 170, 1028–1043.e19 (2017). [DOI] [PMC free article] [PubMed] [Google Scholar]
- 79.Langmead B, Trapnell C, Pop M & Salzberg SL Ultrafast and memory-efficient alignment of short DNA sequences to the human genome. Genome Biol 10, R25 (2009). [DOI] [PMC free article] [PubMed] [Google Scholar]
- 80.Zhang Y et al. Model-based analysis of ChIP-Seq (MACS). Genome Biol 9, R137 (2008). [DOI] [PMC free article] [PubMed] [Google Scholar]
- 81.Ramirez F et al. deepTools2: a next generation web server for deep-sequencing data analysis. Nucleic Acids Res 44, W160–5 (2016). [DOI] [PMC free article] [PubMed] [Google Scholar]
Associated Data
This section collects any data citations, data availability statements, or supplementary materials included in this article.
Supplementary Materials
Data Availability Statement
All raw and processed RNA-seq and ChIP-seq data are available in the Gene Expression Omnibus (GEO): GSE150984. All other genomic datasets are listed in Supplementary Table 4. All key reagents and resources are listed in Supplementary Table 6.


