

Abstract
Objective:
To obtain insights into mechanisms mediating changes in cortical excitability induced by cathodal transcranial direct current stimulation (tDCS).
Methods:
Neocortical slices were exposed to direct current stimulation (DCS) delivered through Ag/AgCl electrodes over a range of current orientations, magnitudes, and durations. DCS-induced cortical plasticity and its receptor dependency were measured as the change in layer II/III field excitatory postsynaptic potentials by a multielectrode array, both with and without neurotransmitter receptor blockers or allosteric modulators. In vivo, tDCS was delivered to intact mice scalp via surface electrodes. Molecular consequences of DCS in vitro or tDCS in vivo were tested by immunoblot of protein extracted from stimulated slices or the neocortex harvested from stimulated intact mice.
Results:
Cathodal DCS in vitro induces a long-term depression (DCS-LTD) of excitatory synaptic strength in both human and mouse neocortical slices. DCS-LTD is abolished with an mGluR5 negative allosteric modulator, mechanistic target of rapamycin (mTOR) inhibitor, and inhibitor of protein synthesis. However, DCS-LTD persists despite either γ-aminobutyric acid type A receptor or N-methyl-D-aspartate receptor inhibition. An mGluR5-positive allosteric modulator, in contrast, transformed transient synaptic depression resultant from brief DCS application into durable DCS-LTD.
Interpretation:
We identify a novel molecular pathway by which tDCS modulates cortical excitability, and indicate a capacity for synergistic interaction between tDCS and pharmacologic mGluR5 facilitation. The findings support exploration of cathodal tDCS as a treatment of neurologic conditions characterized by aberrant regional cortical excitability referable to mGluR5-mTOR signaling.
Transcranial direct current stimulation (tDCS) is a neuromodulatory technique in which low-amplitude direct current is conducted to the brain via scalp electrodes. tDCS has been intensively investigated in clinical applications, such as stroke rehabilitation1 and treatment of schizophrenia,2 major depression,3 chronic or neuropathic pain,4,5 and epilepsy.6–9 The mechanisms by which tDCS modulates cortical excitability are incompletely understood, and a variety of parameters influence tDCS effects, including current polarity, duration, and intensity. Nonetheless, tDCS aftereffects are predictable; largely, tDCS leads to increased cortical excitability under the anode and reduced cortical excitability under the cathode.10,11 Notably, tDCS engages a form of cortical plasticity in which cortical excitability substantially outlasts the stimulation period by >60 minutes11,12 and thus resembles classical forms of synaptic plasticity such as long-term potentiation (LTP) and long-term depression (LTD).13
Human studies in vivo suggest several mechanisms underlying polarity-specific tDCS-mediated cortical plasticity. For instance, LTP-like change in human motor cortex induced by anodal tDCS depends on N-methyl-D-aspartate receptor (NMDAR) activation14–16 and suppression of γ-aminobutyric acidergic (GABAergic) neurotransmission, which jointly facilitate the potentiating effect of anodal tDCS.17,18 In humans, NMDARs are also implicated in LTD-like phenomena that follow cathodal tDCS.16
Intact animal tDCS and in vitro brain slice DCS (note that “transcranial [t]” is not relevant in vitro) studies are critical to gain mechanistic insights into the neurobiological substrates of tDCS. For example, 2 recent studies in mouse cortical slices supported an NMDAR contribution to DCS-mediated LTP and LTD.19,20 Nonetheless, in addition to NMDAR-dependent LTD, there is another distinct form of LTD that results from activation of metabotropic glutamate receptors (mGluRs) in many brain regions21 including neocortex.22 Abnormal mGluR-mediated LTD (mGluR-LTD) is also reported in prevalent neurologic conditions.21 However, mGluR contribution to tDCS-mediated plasticity is unknown.
Here we demonstrate an LTD-like effect induced by cathodal DCS (DCS-LTD) in mouse primary motor cortex (M1) slices, and replicate this phenomenon in human cortical slices, putatively bridging animal DCS models with human tDCS. We also find that neocortical DCS-LTD is critically dependent on the orientation of the direct current (DC) vector relative to the interrogated neuronal pathways and requires mGluR5 activation. We further implicate signaling through the mechanistic target of rapamycin (mTOR) pathway as an essential DCS-LTD mechanism downstream of mGluR5 in vitro and in vivo.
Materials and Methods
Animals
We used 3- to 5-week-old male mice (C57BL/6J; Jackson Laboratory, Bar Harbor, ME). All procedures were carried out in accordance with guidelines set by Boston Children’s Hospital Institutional Animal Care and Use Committee.
Drugs
NMDAR antagonist D-(–)-2-amino-5-phosphonopentanoic acid (D-AP5, Cat#-0106), GABA type A receptor (GABAAR) antagonist bicuculline (BIC; Cat#-0130), and positive mGluR5 allosteric modulator 3-cyano-N-(1,3-diphenyl-1H-pyrazol-5-yl)benzamide (CDPPB, Cat#-3235) were purchased from Tocris Bioscience (Minneapolis, MN). Negative mGluR5 allosteric modulator 2-chloro-4-([2,5-dimethyl-1-(4-[trifluoromethoxy]-phenyl)-1H-imidazol-4-yl]ethynyl)pyridine (CTEP,23 Cat#-B1633) was purchased from ApexBio Technology (Boston, MA), and mTOR inhibitor rapamycin (Cat#-R-5000) was purchased from LC Laboratories (Woburn, MA). Protein synthesis inhibitor cycloheximide (CHX, Cat#-01810) was purchased from Sigma (St Louis, MO).
The half-maximal inhibitory concentration of D-AP5 to inhibit NMDAR-mediated LTD is 0.45μM,24 and we used 50μM D-AP5.22,25 We used 25μM BIC, at which concentration it reliably blocks GABAARs.26
Slice Preparation
Mice were anesthetized with isoflurane (NDC 10019-360-40; Baxter Healthcare Corporation, Deerfield, IL) and decapitated. Brains were removed and sectioned in ice-cold treatment artificial cerebrospinal fluid (tACSF) containing (in millimolars): NaCl 124, KCl 3, NaH2PO4 1.25, NaHCO3 26, CaCl2 2, MgSO4 2, and glucose 10 (pH 7.4, bubbled with 95% O2 and 5% CO2 mixture). Coronal slices measuring 350μm were cut by vibratome (Leica VT1000P; Leica Microsystems, Buffalo Grove, IL) and transferred to oxygenated tACSF for 90 minutes at 30°C before recording. Slices were then transferred to the MED64 chamber (MED-P5155; AutoMate Scientific, Berkeley, CA) with oxygenated recording ACSF (rACSF) containing (in millimolars): NaCl 124, KCl 3, NaH2PO4 1.25, NaHCO3 26, CaCl2 2, MgSO4 1, and glucose 10 (pH 7.4) at 30°C.
Human Tissue
Surgical removal of the epileptogenic zone of patients (1–14 years) with focal cortical dysplasia, although not availing completely normal human cortical tissue, nevertheless provides an opportunity to study the effect of tDCS in human cortex in vitro. Human cortical tissues were either from temporal lobe, insular cortex, or occipital lobe. Tissue was transferred into oxygenated ice-cold tACSF in the operating room. The protocols to prepare and record from human cortical slices were identical to those described above. All patients and families provided consent prior to epilepsy surgery, and postoperative tissue analysis was approved under Boston Children’s Hospital Institutional Review Board Protocol 09-02-0043.
Electrophysiology
Field excitatory postsynaptic potentials (fEPSPs) were recorded by a multielectrode array system with an MED-P5155 probe.22 After incubation, an M1 slice was positioned in the center of an MED64 probe to fully cover the 8 × 8 electrode array (Fig 1A). The slice was perfused with oxygenated rACSF (2ml/min) by peristaltic pump (Minipuls 3; Gilson, Middleton, WI). Absent baseline drift was confirmed by pilot 2-hour recordings without fEPSP slope change (n = 3 mice, 4 slices).
FIGURE 1:
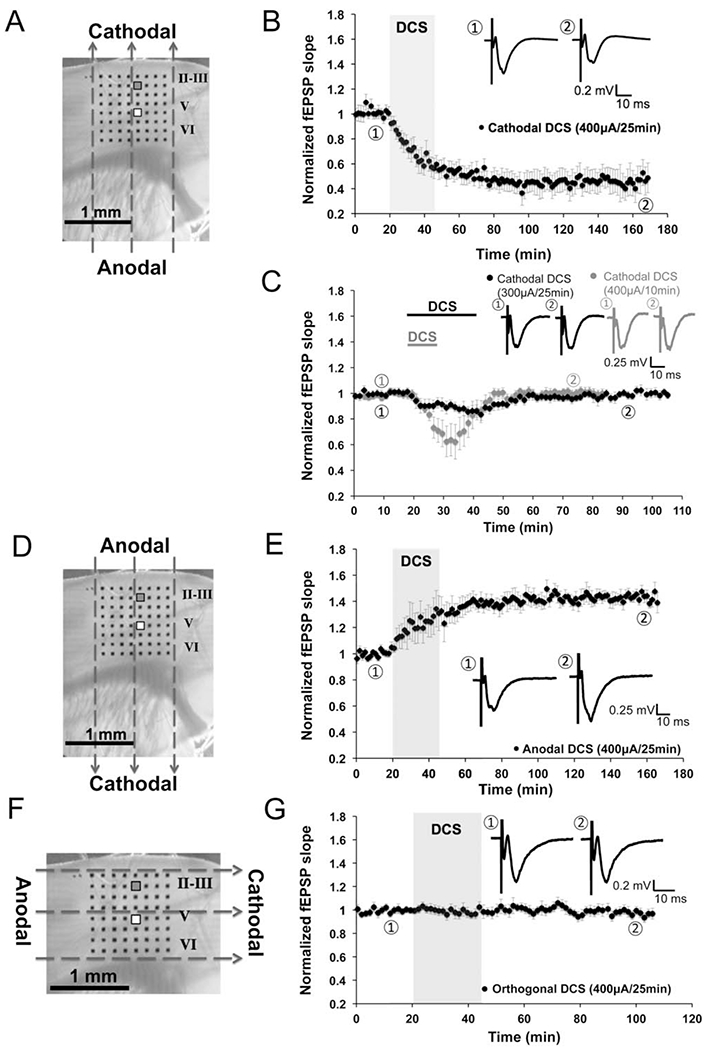
Vector- and polarity-dependent long-term depression (LTD) induced by cathodal direct current stimulation (DCS) in mouse M1 slices. (A, D, and F) Orientation of the direct current fields parallel (A, D) or orthogonal (F) to the M1 fibers (layer V to II/III projections): cathodal (A), anodal (D), and orthogonal DCS (F). The 8 × 8 electrode array (black dots in A, D, and F) fully covered the M1 area. We stimulated at layer V and recorded from layer II/III. Stimulating electrode is marked white (white square), and recording electrode is marked gray (gray square). Dashed arrows in A, D, and F indicate the electrical field orientation. Scale bars are 1mm in A, D, and F. (B) An LTD effect was induced by cathodal DCS at 400μA for 25 minutes (45.2 ± 0.7% of baseline; n = 8 mice, 9 slices; p < 0.001). Transparent gray rectangle indicates DCS duration in this and subsequent electrophysiology figures. Representative field excitatory postsynaptic potential (fEPSP) traces were taken at times indicated by numerals in this and subsequent electrophysiology figures. Scale bars are equal to 0.1 to 0.3mV and 10 milliseconds in this and subsequent electrophysiology figures. (C) Short-term fEPSP depression was induced by cathodal DCS at a low intensity (300μA, 25 minutes; n = 5 mice, 8 slices; black trace) or short duration (400μA for 10 minutes; n = 5 mice, 8 slices; gray trace). Black and gray bars on top of the traces indicate cathodal DCS duration. (E) Long-term potentiation was induced by anodal DCS at 400μA for 25 minutes (143.7 ± 1.4% of baseline; n = 7 mice, 9 slices; p < 0.001). (G) No fEPSP change followed orthogonal DCS at 400μA for 25 minutes (96.9 ± 1.0% of baseline; n = 7 mice, 8 slices; p > 0.05).
Data were collected by system software (Mobius 0.4.2). fEPSPs were induced in mouse or human neocortical slices by single pulses (0.2 milliseconds) delivered at 0.033Hz through 1 planar microelectrode referred to system ground as described previously.22 For mouse slices, fEPSPs were recorded from layer II/III by stimulating the vertical pathway (layer V to II/III; see Fig 1).20 The postsynaptic locus of the fEPSPs signal was confirmed by signal latency and morphology27 and a robust fEPSP slope reduction (21.3 ± 4.0% of control; n = 5; p < 0.001) after 30-minute incubation with 0.3mM Cd2+, a Ca2+ channel blocker.28
An input–output curve was generated per slice. Pulse stimulus intensity (usually 50–55μA) sufficient to induce 50% maximum fEPSP slope was used in all experiments. fEPSP slope was chosen to monitor synaptic responses, as fEPSP amplitude is frequently contaminated by the population spike.29 A stable fEPSP slope (varying by <5%) for at least 15 minutes was required as baseline before DCS. If fEPSP baseline stability did not meet criteria after recording for 1 hour, then the slice was rejected. This occurred in approximately 1 of 5 slices. Data were filtered at 1Hz to 10kHz, and digitized at 20kHz.
Drugs were introduced into the recording chamber >20 minutes prior to DCS. With the exception of BIC and CHX, all baselines were stable in drug conditions, and input–output curves were obtained before drug application. As baselines required stabilization in BIC and CHX conditions, the input–output curve and pulse stimulus selection were obtained in the presence of these agents.
Paired-Pulse Facilitation
Paired pulses were delivered with 30-millisecond interpulse intervals. Paired-pulse facilitation (PPF) was measured by comparing the first and second fEPSP slopes in layer II/III evoked by layer V stimulation in an M1 slice. The degree of facilitation was determined as the PPF ratio (second slope/first slope) before, during (15–20 min after DCS on), and after (30–35 minutes after DCS off) DCS (400μA, 25 minutes).
DCS In Vitro and In Vivo
In vitro DCS was delivered via 2 Ag/AgCl electrodes (1mm diameter, 3mm length; EP1; WPI, Sarasota, FL) connected to a constant-current stimulus isolator (A365R; WPI) as previously described.30 DCS electrodes were half-submerged in rACSF and positioned external to the M1 slice in 1 of 2 configurations such that the DC field oriented either parallel (see Fig 1A, D) or orthogonal (see Fig 1F) to the layer V to II/III projection. For “anodal DCS” the positive DC electrode was positioned proximal to the cortical pial surface, and for “cathodal DCS” the negative DC electrode was positioned proximal to the cortical pial surface. DCS intensity was either 300μA (8.18 ± 0. 95mV/mm; mean ± standard deviation [SD]) or 400μA (10.18 ± 1.39mV/mm; mean ± SD), and the DCS duration was either 10 or 25 minutes.
Cathodal tDCS (1mA, 25 minutes) in live mice was delivered under urethane (2g/kg, intraperitoneal [i.p.]; Cat#-U2500, Sigma) anesthesia via an Ag/AgCl scalp electrode (6mm diameter, Cat#-SPIDER100626; Rhythmlink International, Columbia, SC) connecting to the same constant-current stimulator as for in vitro DCS. In vivo tDCS methods were otherwise as reported previously.7 Mouse scalp was shaved and gently rubbed using NuPrep skin Prep Gel (Cardinal Health, Dublin, OH) to lower skin impedance. The active (cathodal) electrode was filled with conductive gel (Ten20; Weaver and Company, Aurora, CO). The edge of the active (cathodal) electrode was secured to the dorsal scalp at midline between the eyes by a minute amount of glue (Krazy Glue; Elmer’s Products, Westerville, OH). The reference anode was a saline-soaked (0.9% NaCl) sponge (1.5 × 1.5cm) connected to the ventral torso. After the mouse was anesthetized (~20 minutes after urethane injection), cathodal tDCS (1mA) was administrated for 25 minutes under anesthesia. No current was delivered during sham tDCS.
For pharmacologic studies the same tDCS protocol was applied as above, except that mice received a single rapamycin dose (18mg/kg, i.p.; dissolved in 0.25% polyethylene glycol-400 and 0.25% Tween-80), CTEP (8.7mg/kg, oral gavage; dissolved in 0.9% NaCl [wt/vol] and 0.3% Tween-80 [vol/vol]), or vehicle 1 hour before i.p. injection of urethane (2g/kg) for anesthesia.
Immunoblot
To measure DCS-mediated phospho-S6 ribosomal protein:S6 (p-S6:S6) changes in vitro, we collected M1 slices at 0, 15, 30, and 60 minutes after DCS (400μA, 25 minutes). To measure DCS-mediated p-S6:S6 changes in vivo, we collected brains, dissected neocortex, and isolated the region corresponding to M1 60 minutes after tDCS (1mA, 25 minutes). Tissues were snap frozen in liquid nitrogen and stored at −80°C until used.
Frozen M1 samples were incubated in 100 to 200μl of lysis buffer (30mM Tris-HCl, pH 7.5, 15mM MgCl2, 0.8% Nonidet P-40, 2mM ethyleneglycoltetraacetic acid), freshly supplemented with Complete ethylenediaminetetraacetic acid-free protease inhibitor mini tabs and PhosStop phosphatase inhibitor (1 tab per 10ml of buffer each; Roche, Basel, Switzerland) on ice for 5 minutes. Each sample was homogenized by trituration through an insulin syringe (4–6 passages), and the homogenate was incubated for another 5 minutes on ice. Samples were centrifuged at 16,000 × g for 10 minutes at 4°C. Supernatants were recovered to a fresh tube. Samples were normalized after measuring protein concentration with Bradford reagent. Normalized total protein was added to Laemmli sample buffer, boiled for 5 minutes, and placed on ice prior to sodium dodecyl sulfate–polyacrylamide gel electrophoresis on 4 to 20% gradient gels (Bio-Rad, Hercules, CA). Primary antibodies (all from Cell Signaling Technology, Danvers, MA) included: S6 ribosomal protein (Cat#-2317), phospho-S6 ribosomal protein (Ser240/244; Cat#-5364), MAPK (Erk1/2; Cat#-4695), and phospho-MAPK (Erk1/2; Thr202/Tyr204; Cat#-9101) antibodies.
Data Analysis and Statistics
Electrophysiological data were analyzed offline by the MED64 Mobius software. To detect LTD/LTP after DCS, fEPSP slope values 1 hour (55–65 minutes) after DCS were normalized and expressed as fold change relative to averaged baseline (0–10 minutes). To quantify transient fEPSP change during DCS, values within 0 to 5 minutes after DCS were normalized and expressed as a fold change of averaged baseline. To quantify fEPSP baseline change after drug exposure, values within 20 to 25 minutes (D-AP5, CTEP, rapamycin, and CDPPB) or 35 to 40 minutes (BIC and CHX) of drug application were normalized and expressed as a fold change of averaged baseline.
Statistics were performed using the number of mice as n value, with data from 1 to 3 slices per mouse for electrophysiology experiments and 1 slice per mouse for Western blot. For DCS work in human cortical slices, we use the number of slices as n value, with 1 to 2 slices per individual. Statistical significance between >2 groups was determined by 1-way analysis of variance, followed by appropriate post hoc test using Prism (GraphPad, La Jolla, CA) software. Paired and unpaired t test, as necessary, was used to compare two means. Differences with p < 0.05 were considered statistically significant. Unless otherwise indicated, experimental data are presented as mean ± standard error.
Results
DCS induces vector- and polarity-specific LTD and LTP that is dependent on current amplitude and duration
Duration- and intensity-dependent fEPSP depression was induced by cathodal DCS, with the cathode over the pial surface, the anode beneath the subcortical white matter, and the electrical field oriented parallel to the vertical M1 fibers (layer V to II/III pathway; see Fig 1A). Cathodal DCS over M1 slices for 25 minutes at 400μA resulted in reliable LTD (DCS-LTD; see Fig 1B). The fEPSP slope decreased immediately after DCS onset and continued to decrease slightly after DCS cessation for about 30 minutes before stabilizing. Similar to classic in vitro LTD, DCS-LTD lasted for at least 2 hours after DCS.
Whereas the fEPSP slope was significantly reduced to 45.2 ± 0.7% of baseline (1 hour after DCS; n = 8; p < 0.001) by 400μA cathodal DCS for 25 minutes (see Fig 1B), no change in fEPSP was induced by cathodal DCS at intensities <300μA. Only a transient depression was observed after 300μA cathodal DCS for 25 minutes (87.9 ± 0.6% of baseline; n = 5; p < 0.001; see Fig 1C). The depression started immediately after DCS onset but returned to baseline 20 minutes after DCS.
In addition to the response of DCS-LTD to changes in current amplitude, we observed similar sensitivity of DCS-LTD to current duration. Specifically, only transient fEPSP depression (65.2 ± 1.5% of baseline) was seen after 400μA cathodal DCS for 10 minutes (n = 5; p < 0.001; see Fig 1C, gray trace). Under these conditions, fEPSP depression also started right after DCS onset but returned to baseline 20 minutes after DCS (400μA, 10 minutes).
Reversing DCS polarity while maintaining current orientation along the vertical neocortical pathways with the anode over the pial surface (see Fig 1D) produced an opposite effect to that of cathodal DCS. Specifically, LTP of layer V to layer II/III connections was induced by anodal DCS (400μA, 25 minutes) parallel to the vertical M1 fibers (see Fig 1E). This potentiation was evident immediately after DCS onset and lasted for at least 2 hours after DCS. The fEPSP slope increased to 143.7 ± 1.4% of baseline (1 hour after DCS offset; n = 7; p < 0.001) induced by anodal DCS. The DCS-LTP with this electrode orientation was consistent with what has been reported previously in M1 slices.20
To test the contribution of electrical field orientation to the DCS-LTD phenomenon, we also measured the effect of DCS (400μA, 25 minutes) applied orthogonally to M1 fibers (layer V to II/III; see Fig 1F). No change in the fEPSP slope (n = 7) followed orthogonal DCS (neither anodal nor cathodal; see Fig 1G).
These data demonstrate that DCS modulation of cortical excitability is dependent on DCS duration, intensity, and orientation. Although novel in vitro, these results are consistent with published in vivo results from humans and animals.10,11,19,30
Cathodal DCS Results in DCS-LTD in Human Neocortical Slices
We further tested the effect of cathodal DCS on cortical slices of human brain extracted during epilepsy surgery. Baseline fEPSP recordings from human brain slices were stable (n = 4 slices, 3 individuals). Similar to results in mouse M1 slices, cathodal DCS (400μA, 25 minutes) robustly elicited an LTD-like response in human cortex in vitro (Fig 2); the fEPSP slope 1 hour after DCS decreased to 76.0 ± 1.1% of baseline (n = 8 slices, 4 individuals; p < 0.001). If reanalyzed with n as number of individuals, rather than slices, the fEPSP slope is nevertheless reduced (75.9 ± 0.9% of baseline; n = 4 individuals, 8 slices; p < 0.001) 1 hour after DCS. These results demonstrate that cathodal DCS induces LTD in both human and mouse cortex in vitro.
FIGURE 2:
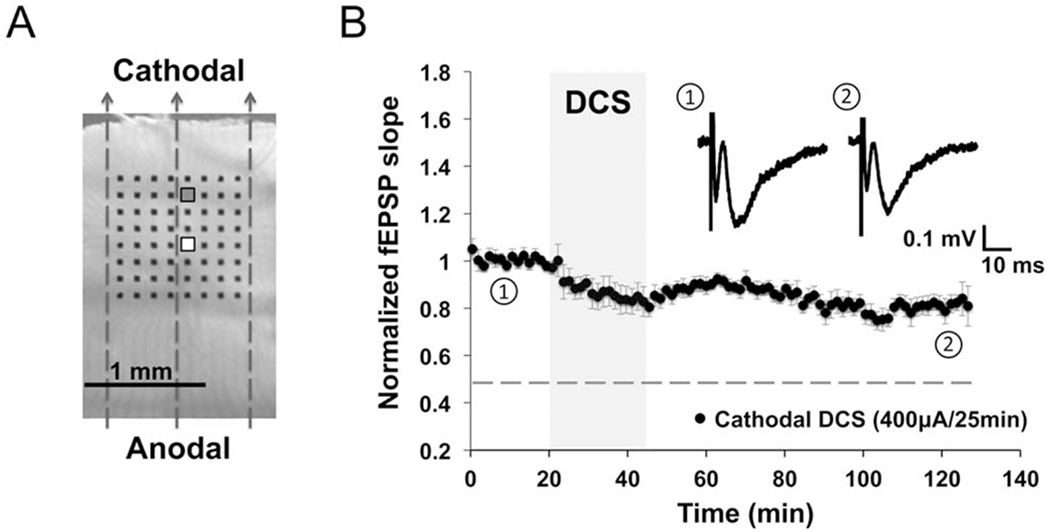
Direct current stimulation-induced long-term depression (DCS-LTD) in human cortical slices. (A) Human cortical slice photograph shows electrode array placement and the orientation of direct current field (indicated by dashed arrows). Stimulating electrode is marked white (white square), and recording electrode is marked gray (gray square). (B) DCS-LTD was induced by applying cathodal DCS (400μA, 25 minutes) to human cortical slices (76.0 ± 1.1% of baseline; n = 8 slices, 4 individuals; p < 0.001). The dotted line in this and subsequent electrophysiology figures indicates the magnitude of normal DCS-LTD in mouse M1. fEPSP = field excitatory postsynaptic potential.
Cathodal DCS Does Not Change the PPF Ratio
We next tested whether DCS-LTD could be attributed to a presynaptic process. We found no difference in the PPF ratio measured before, during, or after cathodal DCS (400μA, 25 minutes; n = 6; Fig 3). These data suggest that presynaptic vesicular glutamate release is not modulated by cathodal DCS in M1 slices.
FIGURE 3:
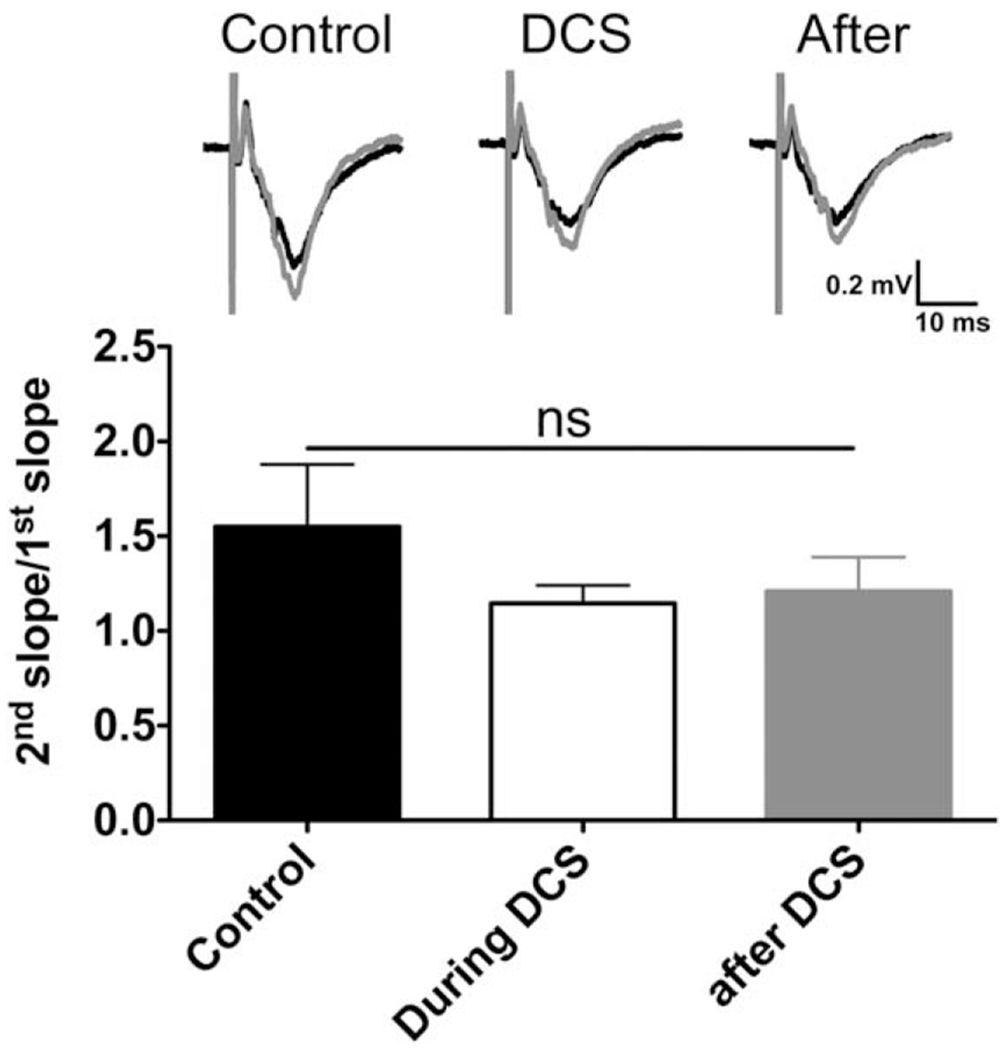
Paired-pulse facilitation (PPF) induced in mouse M1 slices is not affected by cathodal direct current stimulation (DCS). There was no change of the PPF ratio (2nd slope/1st slope) before (1.5 ± 0.3), during (1.1 ± 0.1), and after (1.2 ± 0.2) cathodal DCS (400μA, 25 minutes; n = 6 mice, 12 slices; F2,15 = 0.95, ns = p > 0.05 by 1-way analysis of variance). Representative field excitatory postsynaptic potential (fEPSP) traces induced by paired pulses (30-millisecond interpulse interval) during each phase are shown; black traces indicate the first fEPSP, and gray traces indicate the second fEPSP.
NMDAR and GABAAR Antagonists Attenuate but Do Not Completely Block DCS-LTD
As suggested by human pharmacologic studies, durable tDCS modulation of cortical excitability involves NMDAR activation.14–16,31 To assess the NMDAR role in DCS-LTD, cortical slices were treated with the competitive NMDAR antagonist D-AP5. DCS-LTD was partially preserved in the presence of D-AP5. The fEPSP slopes (1 hour alter DCS) were 84.3 ± 0.7% of baseline (n = 5; p < 0.001) when slices were exposed to 50μM D-AP5 before and during DCS (Fig 4A, D). However, DCS-LTD magnitude was attenuated by D-AP5 relative to the control: ~16% reduction from baseline with D-AP5 versus ~55% reduction from baseline without D-AP5 (p < 0.001; see Fig 4D).
FIGURE 4:
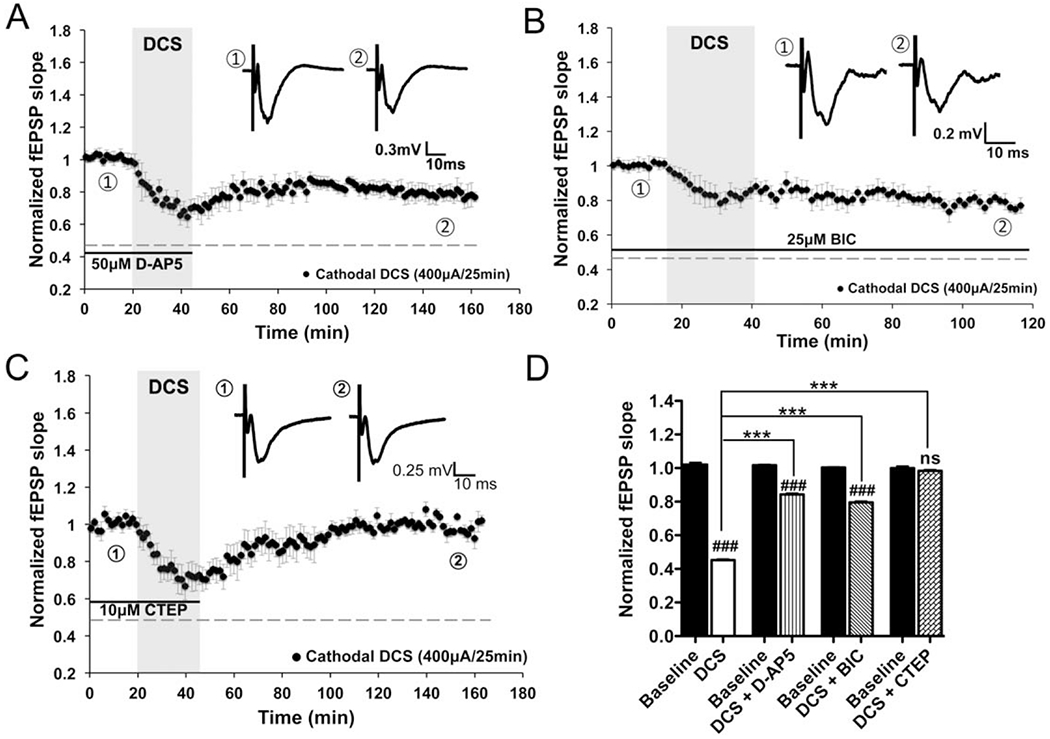
Direct current stimulation-induced long-term depression (DCS-LTD) depends on metabotropic glutamate receptor 5 (mGluR5) activation in mouse M1 slices. (A, B) DCS-LTD effect can be elicited by cathodal DCS with treatment by either 50μM D-(–)-2-amino-5-phosphonopentanoic acid (D-AP5; slopes were decreased to 84.3 ± 0.7% of baseline; n = 5 mice, 7 slices; p < 0.001) or 25μM bicuculline (BIC; 79.6 ± 0.7% of baseline; n = 5 mice, 6 slices; p < 0.001), antagonists of N-methyl-D-aspartate receptor and γ-aminobutyric acid type A receptor, respectively. (C) Bath application of mGluR5 negative allosteric modulator (2-chloro-4-[(2,5-dimethyl-1-[4-(trifluoromethoxy)phenyl]-1H-imidazol-4-yl)ethynyl]pyridine [CTEP], 10μM) completely abolished DCS-LTD in M1 slices (98.3 ± 0.7% of baseline; n = 7 mice, 10 slices; p > 0.05). Black bars under the traces in A–C indicate timing of drug exposure. (D) Statistical analysis of DCS-LTD changes on specific drug conditions (F7,56 = 423.2, p < 0.001); 1-way analysis of variance (ANOVA) post-test between each treatment and its baseline, ### = p < 0.001 and ns = p > 0.05; 1-way ANOVA post-test between 2 means as indicated in the graph, ***p < 0.001. fEPSP = field excitatory postsynaptic potential.
Furthermore, we find that DCS-LTD is preserved after GABAAR blockade, although the LTD magnitude is partially reduced. When incubated with BIC, fEPSP slopes 1 hour after DCS were 79.6 ± 0.7% of baseline (n = 5; p < 0.001; see Fig 4B, D). However, DCS-LTD magnitude was attenuated by BIC relative to the control: ~20% reduction from baseline with BIC versus ~55% reduction from baseline without BIC (p < 0.001; see Fig 4D).
These results show that both NMDAR and GABAAR contribute to DCS-LTD in M1 slices. However, neither D-AP5 nor BIC completely blocked DCS-LTD, suggesting that other mechanisms are involved.
Pharmacologic Modulation of mGluR5 Regulates DCS-LTD
Given that DCS-LTD was preserved despite NMDAR and GABAAR blockade, we tested the mGluR5 contribution to DCS-LTD by bath application of mGluR5 negative allosteric modulator (NAM) CTEP. CTEP (10μM) completely blocked DCS-LTD; the fEPSP slopes 1 hour after DCS did not differ from baseline (n = 7; see Fig 4C, D). These data indicate that mGluR5 activation is essential for DCS-LTD in M1 slices. Notably, in contrast to DCS-LTD, which is abolished by CTEP, DCS-LTP induced by anodal DCS (400μA, 25 minutes) persisted despite CTEP (10μM) administration; fEPSP slopes 1 hour after anodal DCS were 132.0 ± 0.8% of baseline (n = 7; p < 0.001 as compared to baseline).
To confirm mGluR5 involvement, we tested the effect of an mGluR5 positive allosteric modulator (PAM) CDPPB on the transient depression induced by 10-min DCS. After CDPPB (10μM) pretreatment, the transient depression by short DCS (Fig 5A, gray trace; similar to Fig 1C, gray trace) was significantly enhanced to durable DCS-LTD (see Fig 5A, black trace; slopes decreased to 83.3 ± 0.4% of baseline 1 hour after DCS; n = 4; p < 0.001; see Fig 5B).
FIGURE 5:
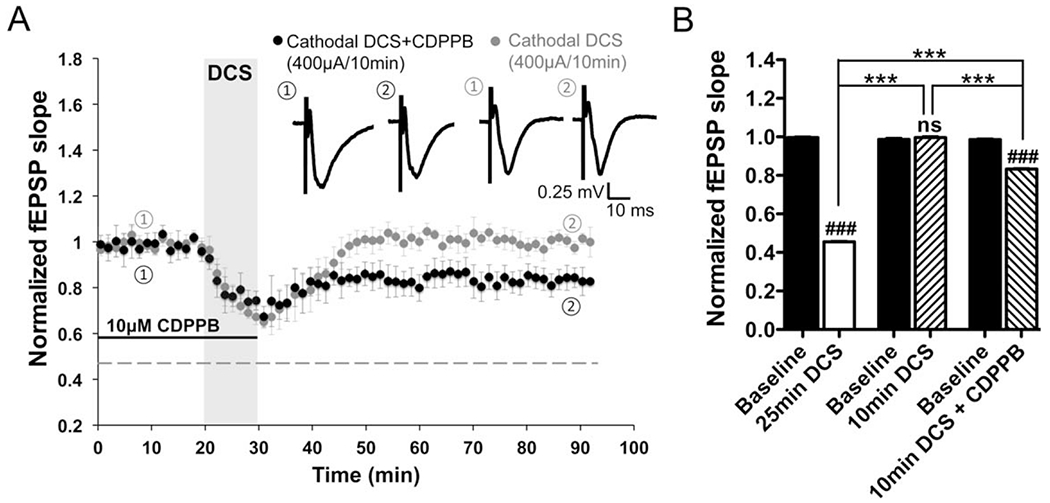
Metabotropic glutamate receptor 5 (mGluR5) positive allosteric modulator (PAM) promotes direct current stimulation-induced long-term depression (DCS-LTD) in mouse M1 slices. (A) Short-term depression induced by 10-minute 400μA cathodal DCS (99.6 ± 0.7% of baseline 1 hour after DCS; n = 5 mice, 5 slices; p > 0.05) was enhanced to DCS-LTD (83.3 ± 0.4% of baseline 1 hour after DCS; n = 4 mice, 9 slices; p < 0.001) by exposure of M1 slices to an mGluR5 PAM (3-cyano-N-[1,3-diphenyl-1H-pyrazol-5-yl]benzamide [CDPPB], 10μM). (B) Statistic analysis of the aftereffects induced by cathodal DCS (400μA, 10 minutes) with and without CDPPB compared to normal DCS-LTD (F5,42 = 1317, p < 0.001); 1-way analysis of variance (ANOVA) post-test between each treatment and its respective baseline, ### = p < 0.001 and ns = p > 0.05; 1-way ANOVA post-test between 2 means as indicated in the graph, ***p < 0.001. fEPSP = field excitatory postsynaptic potential.
mTOR Activation Is Required for mGluR5-Dependent DCS-LTD In Vitro and In Vivo
mGluRs activation is coupled to protein synthesis via the mTOR signaling pathway.25,32–34 Therefore, we tested whether the mTOR inhibitor rapamycin (60nM) blocks mGluR5-dependent DCS-LTD. We found that DCS-LTD was blocked by rapamycin; the fEPSP slopes 1 hour after DCS did not differ from baseline (n = 7; Fig 6A, C). DCS-LTD was also abolished by treatment with the protein synthesis inhibitor CHX (80μM) in M1 slices; the fEPSP slopes 1 hour after DCS did not differ from baseline (n = 4; see Fig 6B, C). These data indicate that DCS-LTD requires protein synthesis and mTOR signaling.
FIGURE 6:
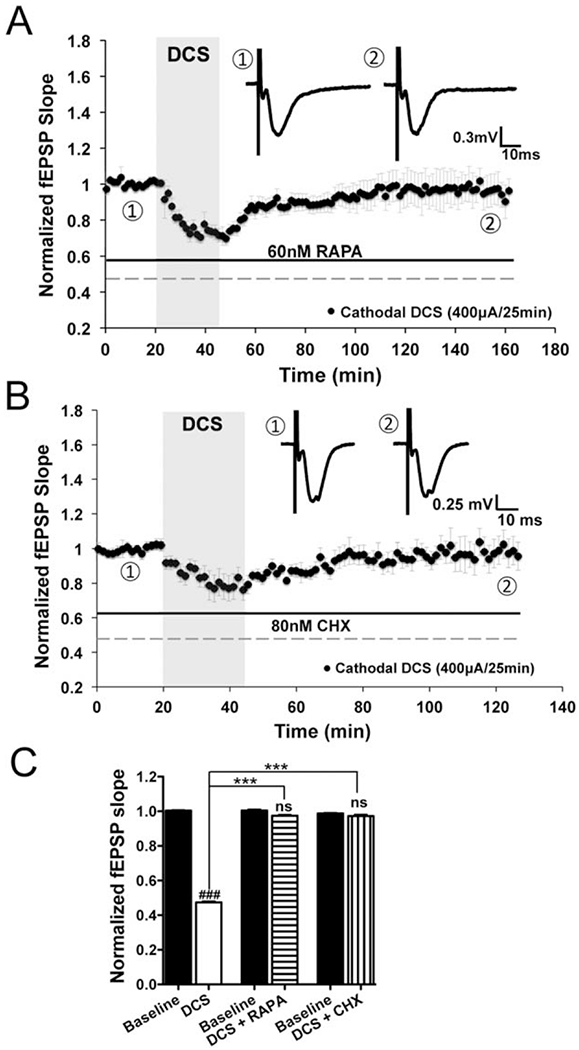
Direct current stimulation-induced long-term depression (DCS-LTD) depends on mechanistic target of rapamycin (mTOR) pathway activation and protein synthesis in mouse M1 slices. (A) Rapamycin (RAPA; 60nM), an inhibitor of mTOR, blocks DCS-LTD (97.5 ± 0.6% of baseline; n = 7 mice, 12 slices; p > 0.05). (B) Similar to rapamycin, a global protein synthesis inhibitor, cycloheximide (CHX; 80nM), also blocks DCS-LTD (97.2 ± 1.0% of baseline; n = 4 mice, 5 slices; p > 0.05). (C) Statistical analysis of field excitatory postsynaptic potential (fEPSP) changes that follow cathodal DCS with and without rapamycin or cycloheximide (F5,42 = 928.8, p < 0.001); 1-way analysis of variance (ANOVA) post-test between each treatment and its respective baseline, ### = p < 0.001 and ns = p > 0.05; 1-way ANOVA post-test between 2 means as indicated in the graph, ***p < 0.001.
Individual drug effects on baseline fEPSPs were tested (Fig 7). Baselines were stable in the D-AP5, BIC, CTEP, CDPPB, and rapamycin conditions, although BIC (see Fig 7B) and CHX (see Fig 7F) induced a transient baseline change, lasting for ~35 minutes after drug introduction. In all instances, DCS was delivered in the setting of stable baselines.
FIGURE 7:
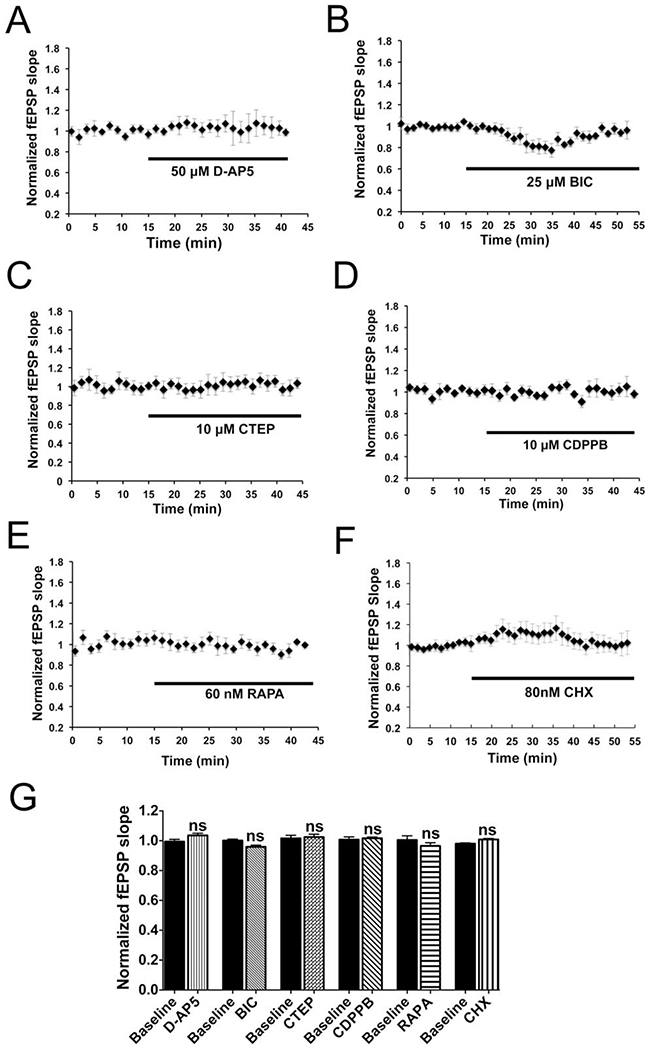
Baseline field excitatory postsynaptic potentials (fEPSPs) in drug settings. (A, C–E) No change of baseline slopes was observed in mouse M1 slices by bath application of D-(–)-2-amino-5-phosphonopentanoic acid (D-AP5; 50μM; 103.6 ± 1.4% of baseline; n = 3 mice, 6 slices; p > 0.05), 2-chloro-4-([2,5-dimethyl-1-(4-[trifluoromethoxy]phenyl)-1H-imidazol-4-yl]ethynyl)pyridine (CTEP; 10μM; 102.5 ± 1.8% of baseline; n = 4 mice, 7 slices; p > 0.05), 3-cyano-N-(1,3-diphenyl-1H-pyrazol-5-yl)benzamide (CDPPB; 10μM; 101.7 ± 0.8% of baseline; n = 3 mice, 3 slices; p > 0.05), or rapamycin (RAPA, 60nM; 96.5 ± 2.1% of baseline; n = 5 mice, 5 slices; p > 0.05) up to 20 to 25 minutes. (B, F) Application of 25μM bicuculline (BIC) or 80nM cycloheximide (CHX) transiently changed the baseline fEPSP slopes, which returned to their baselines within ~35 minutes of drug application (BIC: 95.9 ± 1.1% of baseline; n = 3 mice, 5 slices; p > 0.05; CHX: 100.9 ± 0.6% of baseline; n = 4 mice, 5 slices; p > 0.05). (G) Statistical analysis of drug effects on the baseline fEPSP 20 to 25 minutes (D-AP5, CTEP, RAPA, CDPPB) or 35 to 40 minutes (BIC, CHX) after drug introduction into the recording chamber (F11,48 = 1.99, p > 0.05); 1-way analysis of variance post-test between each treatment and its baseline, ns = p > 0.05.
mTOR activation leads to phosphorylation of p70 ribosomal S6 kinase and the latter then phosphorylates ribosomal protein S6, among other substrates,35–37 and mGluR-LTD positively correlates with S6 phosphorylation via mTOR signaling, which influences protein synthesis in mGluR-LTD maintenance.33,37 We therefore measured mTOR pathway activity by quantifying ratios of phosphorylated S6 (p-S6) to total S6 in M1 slices harvested 0, 15, 30, and 60 minutes after DCS (400μA, 25 minutes). As control, M1 slices were collected without DCS treatment. Interestingly, p-S6 concentration gradually increased following DCS offset (Fig 8A, B) and reached significance 60 minutes after DCS (213.0 ± 26.9% of control; n = 4; p < 0.05; see Fig 8B). No significant change was detected in total S6 at the same time points after DCS.
FIGURE 8:
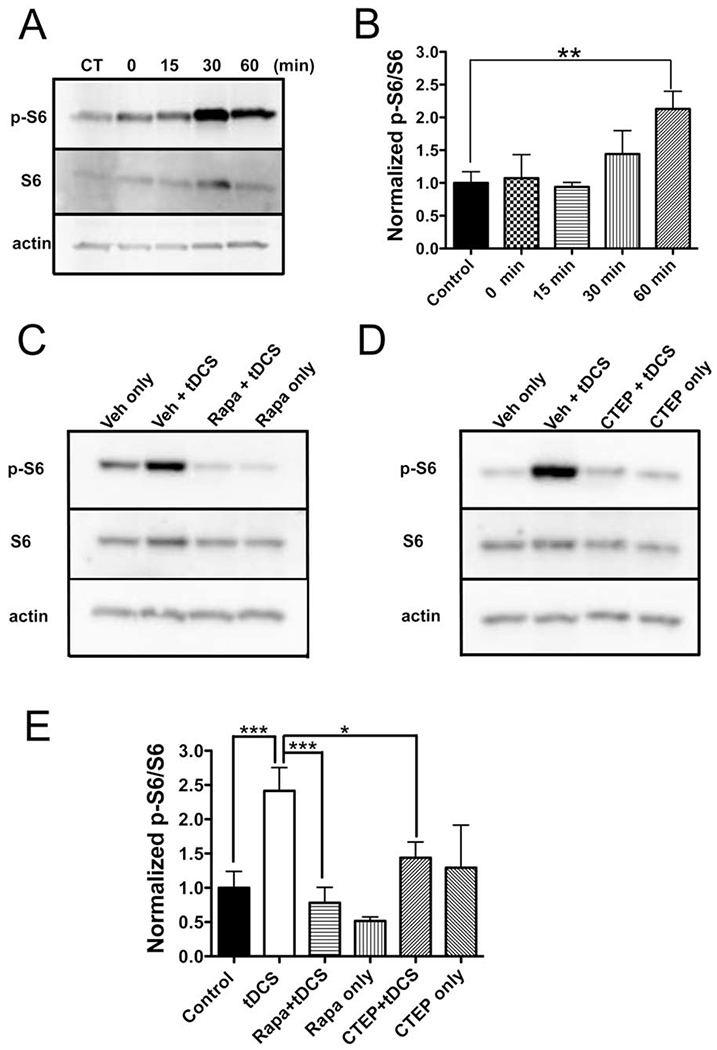
Cathodal direct current stimulation (DCS) increases phosphorylated (p) ribosomal protein S6 via metabotropic glutamate receptor 5 and mechanistic target of rapamycin activation in mouse neocortex. (A) p-S6 in mouse M1 slices was measured 0, 15, 30, and 60 minutes after cathodal DCS (400μA, 25 minutes) by immunoblot, and a time-dependent increase of p-S6 was found. Actin was used as loading reference. Control slices (CT) were collected without DCS treatment. Total S6, normalized to actin, was unchanged (F4,15 = 0.85, p = 0.52 by 1-way analysis of variance [ANOVA]). (B) Statistical analysis of normalized p-S6:S6 ratio from M1 slices collected at different time points (F4,15 = 3.35, p < 0.05 by 1-way ANOVA). The normalized p-S6:S6 ratio is significantly increased 60 minutes after DCS (213.0 ± 26.9% of control; n = 4 mice, 4 slices; **p < 0.01 by 1-way ANOVA post-test). (C, D) p-S6 and S6 levels in M1 collected 1 hour after in vivo cathodal transcranial DCS (tDCS; 1mA, 25 minutes) with or without pretreatment with rapamycin (Rapa; C) or 2-chloro-4-([2,5-dimethyl-1-(4-[trifluoromethoxy]phenyl)-1H-imidazol-4-yl]ethynyl)pyridine (CTEP; D). p-S6 increases in the vehicle (Veh) + tDCS condition, and is otherwise stable. Total S6, normalized to actin, was unchanged (F5,24 = 1.29, p = 0.30 by 1-way ANOVA). (E) Statistical analysis of normalized p-S6:S6 ratio from M1 tissues of in vivo tDCS work (F5,40 = 4.76, p < 0.01). Normalized p-S6:S6 is increased (227.8 ± 32.0% of control) after cathodal tDCS (control [±vehicle]: n = 9 mice, tDCS [±vehicle]: n = 9 mice; ***p < 0.001). This increase is abolished by either rapamycin (73.7 ± 21.2% of control; n = 6 mice; p > 0.05 as compared to the control; ***p < 0.001 as compared to tDCS group) or CTEP pretreatment (135.8 ± 21.7% of control; n = 6 mice; p > 0.05 as compared to the control; *p < 0.05 as compared to tDCS group). Rapamycin (48.7 ± 5.4% of control; n = 3 mice; p > 0.05) or CTEP (122.0 ± 58.6% of control; n = 3 mice; p > 0.05) exposure without tDCS did not significantly affect the p-S6:S6 relative to the control group. ***p < 0.001 and *p < 0.05 by 1-way ANOVA post-test.
Next, we asked whether increased p-S6 could also be detected in the neocortex after in vivo cathodal tDCS. As in Figure 8C and D, p-S6 increased in M1 tissue 1 hour after tDCS (1mA, 25 minutes), and the p-S6:S6 ratio increased to 227.8 ± 32.0% of control (control [± vehicle], n = 9; tDCS [±vehicle], n = 9; p < 0.01; see Fig 8E). Supporting that the increase in ratio was resultant from p-S6 gain rather than S6 loss, total S6 did not change after in vivo tDCS.
To verify that the p-S6 increase is a downstream effect of mTOR activation, we pretreated mice with a single injection of rapamycin (18mg/kg, i.p.) 1 hour before urethane injection (2g/kg, i.p.). We applied tDCS under anesthesia (~20 minutes for mice being fully anesthetized after urethane injection) and collected M1 tissue 1 hour after tDCS. Pretreatment of mice with rapamycin abolished tDCS-induced increase in the p-S6:S6 ratio. The p-S6:S6 ratio of rapamycin-treated mice exposed to sham tDCS did not significantly differ from control (see Fig 8C, E).
We next tested whether CTEP interfered with cathodal tDCS-induced mTOR pathway activation in vivo. CTEP pretreatment (8.7mg/kg, per os) abrogated the p-S6 increase (n = 6; see Fig 8D, E). Similar to the tDCS+CTEP condition, the p-S6:S6 ratio of mice exposed to CTEP and sham tDCS did not differ from control.
Finally, we tested the involvement of extracellular signal-regulated kinase (ERK 1/2) signaling pathway in DCS-LTD.33 However, no significant change of p-MAPK:MAPK (mitogen-activated protein kinases, originally called ERK) ratio was detected in M1 tissue of tDCS-treated mice (n = 6) as compared to the sham tDCS control (n = 4).
Together these data strongly suggest that cathodal DCS-induced mTOR pathway activity requires mGluR5 activation. These biochemical results are consistent with our electrophysiological studies showing that CTEP/rapamycin blocks DCS-LTD in vitro (see Figs 4C, 6A). Thus, both in vitro and in vivo studies indicate that cathodal DCS elicits LTD via the mGluR5-mTOR pathway.
Discussion
We have identified a previously unrecognized mechanism of long-term depression of cortical excitability induced by cathodal constant electrical current in the neocortex, which depends on the activation of mGluR5-mTOR pathway and downstream protein synthesis.
DCS-LTP, induced by anodal DCS, has been characterized in mouse M1 slices.20 Here we describe a novel DCS-LTD effect on neocortical excitability when the stimulation polarity is reversed to the cathodal montage. As is relevant to desired pathway-specific neuromodulation by tDCS in humans, we show that DCS-LTD in M1 slices occurs only when the DC field orientation is parallel to the interrogated fiber projections, which is consistent with our past recordings from isolated hippocampal slices,30 and also published mouse thalamocingulate slice data.19 In addition to polarity and DC vector orientation, we also demonstrate that intracortical DCS-LTD depends on stimulation duration and amplitude, which complements previous findings in vivo and in vitro.10,11,19,30 However, we acknowledge that calibration to current rather than to electrical field strength is a limitation of the in vitro components of our experiments. We also recognize that scaling preclinical in vivo and in vitro DC protocols with respect to stimulus amplitude and locality to human tDCS studies may be difficult, and is another study limitation.
As the number of tDCS studies in humans expands,10,11,14–16,38 so do in vitro rodent brain slice studies that demonstrate modulation of brain excitability by DCS.19,20,30 Now, we present the first human in vitro brain slice data showing a strong similarity between DCS effects in mouse and human slices, suggesting that DCS-LTD is not species-specific. With results that link mouse and human in vitro DCS phenomena, we hope to support the translational value of rodent in vitro DCS research and the potential of rodent work to inform clinical tDCS applications in humans. One limitation of the present human work is that tissues were derived from patients with epilepsy, and were inconsistent with respect to brain regions. Nevertheless, the resultant DCS-LTD in human brain was qualitatively similar to DCS-LTD measured in mouse M1 slices.
We discovered an mGluR5-dependent mechanism underlying DCS-LTD. Notably, while confirming previously suggested GABAaR and NMDAR contributions to (t)DCS aftereffect,14–20,31 we found that neither GABAaR nor NMDAR blockade abolished DCS-LTD. In contrast, an mGluR5 NAM (CTEP) completely abolished DCS-LTD. Furthermore, an mGluR5 PAM (CDPPB) facilitated cathodal DCS efficacy such that a stimulus of insufficient duration to produce DCS-LTD resulted in robust and lasting depression of cortical excitability after CDPPB pretreatment. These data led us to hypothesize that DCS-LTD shares essential features (eg, dependence on mTOR activation and downstream protein synthesis) with conventional mGluR-LTD. The latter can be reliably induced by group I mGluR agonists or by paired-pulse low-frequency stimulation in diverse brain regions,21,22,25 which is particularly relevant to clinical embodiments of tDCS, which may be applied to a range of cortical targets. We anticipate follow-up experiments to test whether pharmacological mGluR5 modulation also affects DCS-LTD in human neocortical slices.
Given the postsynaptic locus of group I mGluRs, our data indicate that cathodal DCS triggers a postsynaptic signaling pathway to induce LTD. This is confirmed by our finding that no significant PPF change was induced by cathodal DCS (see Fig 3).mTOR-dependent translational regulation has been well described as an essential mechanism of mGluR-LTD.21,32,33 Our finding that rapamycin inhibited DCS-LTD similarly supports a critical role for mTOR activation in DCS-LTD. Further support for this conclusion comes from increased phosphorylation of S6 after DCS-LTD. Moreover, we find that protein synthesis inhibition by CHX blocks DCS-LTD. Thus, we conclude that DCS-LTD and classic protein synthesis-dependent mGluR-LTD share common mechanisms.21
Given that NMDAR blockade attenuates (but does not abolish) DCS-LTD, we propose that NMDAR activation contributes to the DCS-LTD phenomenon via a mechanism shared with the mGluR5-mTOR signaling pathway, rather than via a separate pathway. We base this hypothesis on our results showing that rapamycin completely blocks DCS-LTD, thus indicating that the signaling pathways engaged by either NMDARs or mGluR5 activation are both upstream of mTOR activation. Our finding that ERK/MAPK pathway is not involved in DCS-LTD also supports a common (mTOR-mediated) mechanism rather than multiple parallel processes leading to DCS-LTD. One possibility is that NMDAR activation facilitates mGluR5-mediated LTD after DCS. This is consistent with growing evidence that NMDAR and mGluR5 are closely associated signaling partners involved in synaptic plasticity.39,40,41
Our finding that DCS-LTD is attenuated by BIC suggests that enhancement of GABAergic inhibition by cathodal DCS also contributes to DCS-LTD. In this regard, published results show that mGluR5 activation increases GABA release in vivo42 and GABAAR-mediated postsynaptic currents in vitro.43 Thus, GABAAR activation might be a downstream effect of mGluR5 activation by cathodal DCS. Taken together, our results show that the mGluR5-mTOR pathway is necessary and sufficient for DCS-LTD, whereas the NMDAR and GABAAR pathways, although contributory, are not sufficient for DCS-LTD. However, the interaction between mGluR5-mTOR and NMDAR/GABAAR mechanisms will require further study.
In the clinical arena, impaired mGluR-LTD or mTOR signaling contributes to the pathophysiology of neurological diseases such as Parkinson disease,21 drug addiction,21 Phelan-McDermid syndrome,44 and Rett syndrome.45 Complementing these data are results indicating that augmented mGluR5 signaling restores synaptic function in some disease models.44,46 In our experiments, we find that mGluR5-dependent LTD can be induced by cathodal DCS in cortex, which suggests a therapeutic potential for cathodal DCS in neuropsychiatric disorders characterized by impaired mGluR5 signaling and/or mGluR5-dependent synaptic plasticity. Moreover, our finding that the mGluR5 PAM (CDPPB) transforms a transient depressive effect of DCS application into LTD suggests that combining appropriate pharmacotherapy with tDCS will enhance tDCS therapeutic efficacy. Notably, CDPPB alone did not change baseline fEPSPs (see Fig 7D), which indicates a synergistic rather than additive interaction between DCS and pharmacologic mGluR5 modulation. Prior studies show that tDCS combined with pharmacotherapy is more effective than tDCS alone in the treatment of depressed patients44,46,47 and suppressing epileptic seizures in rats,7 and our data add a mechanistic insight that may further the development of logical drug-tDCS combinations.
Our findings also underscore the importance of carefully selecting neurologic disorders whose pathophysiology is a correct match for tDCS. In disorders with already pathologically enhanced mGluR5 and/or mTOR activity—such as Fragile X21,48 or certain forms of epilepsy49,50—cathodal tDCS may not be appropriate. In these and similar instances, the benefit of focal reduction in cortical excitability by cathodal tDCS will have to be considered in the context of the molecular mechanisms and cellular consequences of this intervention. In short, continued research will have to address how to optimally select patients for tDCS and to combine tDCS and pharmacotherapy.
Acknowledgment
This work was supported by the Boston Children’s Hospital Translational Research Program (A.R., M.S.); US Department of Defense (W81XWH-13-1-0118, A.R.); NIH (K08 HD071026, J.O.L.); Repository Core for Neurological Disorders, Department of Neurology, Boston Children’s Hospital; NIH Intellectual and Developmental Disabilities Research Centers (P30HD018655); Authors otherwise received support from: NIH National Institute of Neurological Disorders and Stroke (R01NS088583, A.R.); NIH National Institute of Mental Health (R01100186, A.R., A.P-L.); Smith Family Foundation (A.R.); Assimon Family Foundation (A.R.); Sage Pharmaceuticals (A.R.); Eisai Pharmaceuticals (A.R.); Massachusetts Life Sciences (A.R.); Neuroelectrics (A.R.); Brainsway (A.R.); Sidney R. Baer Jr Foundation (A.P-L.); NIH (R21 NS082870, R01 HD069776, R01 NS073601, R21 MH099196, R21 NS085491, R21 HD07616, A.P-L.); Harvard Catalyst|Harvard Clinical and Translational Science Center (NIH National Center for Research Resources and National Center for Advancing Translational Sciences, UL1 RR025758, A.P.-L.); Autism Speaks (M.S., A.R.) and Nancy Lurie Marks Family Foundation (M.S.).
We thank M. Trujillo, M. Levin, M. Meyer, R. Gersner, S. Dhamne, and E. Chadwick for technical assistance.
Footnotes
Potential Conflicts of Interest
Nothing to report.
References
- 1.Elsner B, Kugler J, Pohl M, et al. Transcranial direct current stimulation (tDCS) for improving function and activities of daily living in patients after stroke. Cochrane Database Syst Rev 2013;11: CD009645. [DOI] [PubMed] [Google Scholar]
- 2.Agarwal SM, Shivakumar V, Bose A, et al. Transcranial direct current stimulation in schizophrenia. Clin Psychopharmacol Neurosci 2013;11:118–125. [DOI] [PMC free article] [PubMed] [Google Scholar]
- 3.Nitsche MA, Boggio PS, Fregni F, et al. Treatment of depression with transcranial direct current stimulation (tDCS): a review. Exp Neurol 2009;219:14–19. [DOI] [PubMed] [Google Scholar]
- 4.Ngernyam N, Jensen MP, Auvichayapat N, et al. Transcranial direct current stimulation in neuropathic pain. J Pain Relief 2013; Suppl 3. [DOI] [PMC free article] [PubMed] [Google Scholar]
- 5.Plow EB, Pascual-Leone A, Machado A. Brain stimulation in the treatment of chronic neuropathic and non-cancerous pain. J Pain 2012;13:411–424. [DOI] [PMC free article] [PubMed] [Google Scholar]
- 6.Auvichayapat N, Rotenberg A, Gersner R, et al. Transcranial direct current stimulation for treatment of refractory childhood focal epilepsy. Brain Stimul 2013;6:696–700. [DOI] [PubMed] [Google Scholar]
- 7.Dhamne SC, Ekstein D, Zhuo Z, et al. Acute seizure suppression by transcranial direct current stimulation in rats. Ann Clin Transl Neurol 2015;2:843–856. [DOI] [PMC free article] [PubMed] [Google Scholar]
- 8.Nitsche MA, Paulus W. Noninvasive brain stimulation protocols in the treatment of epilepsy: current state and perspectives. Neurotherapeutics 2009;6:244–250. [DOI] [PMC free article] [PubMed] [Google Scholar]
- 9.Rotenberg A. Epilepsy. Handb Clin Neurol 2013;116:491–497. [DOI] [PubMed] [Google Scholar]
- 10.Nitsche MA, Paulus W. Excitability changes induced in the human motor cortex by weak transcranial direct current stimulation. J Physiol 2000;527(pt 3):633–639. [DOI] [PMC free article] [PubMed] [Google Scholar]
- 11.Nitsche MA, Paulus W. Sustained excitability elevations induced by transcranial DC motor cortex stimulation in humans. Neurology 2001;57:1899–1901. [DOI] [PubMed] [Google Scholar]
- 12.Nitsche MA, Liebetanz D, Antal A, et al. Modulation of cortical excitability by weak direct current stimulation—technical, safety and functional aspects. Suppl Clin Neurophysiol 2003;56:255–276. [DOI] [PubMed] [Google Scholar]
- 13.Malenka RC, Bear MF. LTP and LTD: an embarrassment of riches. Neuron 2004;44:5–21. [DOI] [PubMed] [Google Scholar]
- 14.Liebetanz D, Nitsche MA, Tergau F, et al. Pharmacological approach to the mechanisms of transcranial DC-stimulation-induced after-effects of human motor cortex excitability. Brain 2002;125:2238–2247. [DOI] [PubMed] [Google Scholar]
- 15.Monte-Silva K, Kuo MF, Hessenthaler S, et al. Induction of late LTP-like plasticity in the human motor cortex by repeated non-invasive brain stimulation. Brain Stimul 2013;6:424–432. [DOI] [PubMed] [Google Scholar]
- 16.Nitsche MA, Fricke K, Henschke U, et al. Pharmacological modulation of cortical excitability shifts induced by transcranial direct current stimulation in humans. J Physiol 2003;553:293–301. [DOI] [PMC free article] [PubMed] [Google Scholar]
- 17.Nitsche MA, Liebetanz D, Schlitterlau A, et al. GABAergic modulation of DC stimulation-induced motor cortex excitability shifts in humans. Eur J Neurosci 2004;19:2720–2726. [DOI] [PubMed] [Google Scholar]
- 18.Stagg CJ, Best JG, Stephenson MC, et al. Polarity-sensitive modulation of cortical neurotransmitters by transcranial stimulation. J Neurosci 2009;29:5202–5206. [DOI] [PMC free article] [PubMed] [Google Scholar]
- 19.Chang WP, Lu HC, Shyu BC. Treatment with direct-current stimulation against cingulate seizure-like activity induced by 4-aminopyridine and bicuculline in an in vitro mouse model. Exp Neurol 2015;265:180–192. [DOI] [PubMed] [Google Scholar]
- 20.Fritsch B, Reis J, Martinowich K, et al. Direct current stimulation promotes BDNF-dependent synaptic plasticity: potential implications for motor learning. Neuron 2010;66:198–204. [DOI] [PMC free article] [PubMed] [Google Scholar]
- 21.Luscher C, Huber KM. Group 1 mGluR-dependent synaptic long-term depression: mechanisms and implications for circuitry and disease. Neuron 2010;65:445–459. [DOI] [PMC free article] [PubMed] [Google Scholar]
- 22.Liu MG, Koga K, Guo YY, et al. Long-term depression of synaptic transmission in the adult mouse insular cortex in vitro. Eur J Neurosci 2013;38:3128–3145. [DOI] [PubMed] [Google Scholar]
- 23.Lindemann L, Jaeschke G, Michalon A, et al. CTEP: a novel, potent, long-acting, and orally bioavailable metabotropic glutamate receptor 5 inhibitor. J Pharmacol Exp Ther 2011;339:474–486. [DOI] [PubMed] [Google Scholar]
- 24.Hrabetova S, Serrano P, Blace N, et al. Distinct NMDA receptor subpopulations contribute to long-term potentiation and long-term depression induction. J Neurosci 2000;20:RC81. [DOI] [PMC free article] [PubMed] [Google Scholar]
- 25.Huber KM, Kayser MS, Bear MF. Role for rapid dendritic protein synthesis in hippocampal mGluR-dependent long-term depresssion. Science 2000;288:1254–1257. [DOI] [PubMed] [Google Scholar]
- 26.Bikson M, Inoue M, Akiyama H, et al. Effects of uniform extracellular DC electric fields on excitability in rat hippocampal slices in vitro.J Physiol 2004;557:175–190. [DOI] [PMC free article] [PubMed] [Google Scholar]
- 27.Castro-Alamancos MA, Donoghue JP, Connors BW. Different forms of synaptic plasticity in somatosensory and motor areas of the neocortex. J Neurosci 1995;15:5324–5333. [DOI] [PMC free article] [PubMed] [Google Scholar]
- 28.Wu LG, Saggau P. Presynaptic calcium is increased during normal synaptic transmission and paired-pulse facilitation, but not in long-term potentiation in area CA1 of hippocampus. J Neurosci 1994;14:645–654. [DOI] [PMC free article] [PubMed] [Google Scholar]
- 29.Bortolotto ZA, Anderson WW, Isaac JT, et al. Synaptic plasticity in the hippocampal slice preparation. Curr Protoc Neurosci 2001; Chapter 6:Unit 6.13. [DOI] [PubMed] [Google Scholar]
- 30.Kabakov AY, Muller PA, Pascual-Leone A, et al. Contribution of axonal orientation to pathway-dependent modulation of excitatory transmission by direct current stimulation in isolated rat hippocampus. J Neurophysiol 2012;107:1881–1889. [DOI] [PMC free article] [PubMed] [Google Scholar]
- 31.Nitsche MA, Jaussi W, Liebetanz D, et al. Consolidation of human motor cortical neuroplasticity by D-cycloserine. Neuropsychophar-macology 2004;29:1573–1578. [DOI] [PubMed] [Google Scholar]
- 32.Hou L, Klann E. Activation of the phosphoinositide 3-kinase-Akt-mammalian target of rapamycin signaling pathway is required for metabotropic glutamate receptor-dependent long-term depresssion. J Neurosci 2004;24:6352–6361. [DOI] [PMC free article] [PubMed] [Google Scholar]
- 33.Page G, Khidir FA, Pain S, et al. Group I metabotropic glutamate receptors activate the p70S6 kinase via both mammalian target of rapamycin (mTOR) and extracellular signal-regulated kinase (ERK 1/2) signaling pathways in rat striatal and hippocampal synaptoneurosomes. Neurochem Int 2006;49:413–421. [DOI] [PubMed] [Google Scholar]
- 34.Lipton JO, Sahin M. The neurology of mTOR. Neuron 2014;84: 275–291. [DOI] [PMC free article] [PubMed] [Google Scholar]
- 35.Dufner A, Thomas G. Ribosomal S6 kinase signaling and the control of translation. Exp Cell Res 1999;253:100–109. [DOI] [PubMed] [Google Scholar]
- 36.Gingras AC, Raught B, Sonenberg N. Regulation of translation initiation by FRAP/mTOR. Genes Dev 2001;15:807–826. [DOI] [PubMed] [Google Scholar]
- 37.Antion MD, Hou L, Wong H, et al. mGluR-dependent long-term depression is associated with increased phosphorylation of S6 and synthesis of elongation factor 1A but remains expressed in S6K-deficient mice. Mol Cell Biol 2008;28:2996–3007. [DOI] [PMC free article] [PubMed] [Google Scholar]
- 38.Santarnecchi E, Brem A-K, Levenbaum E, et al. Enhancing cognition using transcranial electrical stimulation. Curr Opin Behav Sci 2015;4:171–178. [Google Scholar]
- 39.Alagarsamy S, Marino MJ, Rouse ST, et al. Activation of NMDA receptors reverses desensitization of mGluR5 in native and recombinant systems. Nat Neurosci 1999;2:234–240. [DOI] [PubMed] [Google Scholar]
- 40.Alagarsamy S, Saugstad J, Warren L, et al. NMDA-induced potentiation of mGluR5 is mediated by activation of protein phosphatase 2B/calcineurin. Neuropharmacology 2005;49(suppl 1):135–145. [DOI] [PMC free article] [PubMed] [Google Scholar]
- 41.Bertaso F, Roussignol G, Worley P, et al. Homer1a-dependent crosstalk between NMDA and metabotropic glutamate receptors in mouse neurons. PLoS One 2010;5:e9755. [DOI] [PMC free article] [PubMed] [Google Scholar]
- 42.de Novellis V, Marabese I, Palazzo E, et al. Group I metabotropic glutamate receptors modulate glutamate and gamma-aminobutyric acid release in the periaqueductal grey of rats. Eur J Pharmacol 2003;462:73–81. [DOI] [PubMed] [Google Scholar]
- 43.Hoffpauir BK, Gleason EL. Activation of mGluR5 modulates GABA(A) receptor function in retinal amacrine cells. J Neurophysiol 2002;88:1766–1776. [DOI] [PubMed] [Google Scholar]
- 44.Verpelli C, Dvoretskova E, Vicidomini C, et al. Importance of Shank3 protein in regulating metabotropic glutamate receptor 5 (mGluR5) expression and signaling at synapses. J Biol Chem 2011;286:34839–34850. [DOI] [PMC free article] [PubMed] [Google Scholar]
- 45.Ricciardi S, Boggio EM, Grosso S, et al. Reduced AKT/mTOR signaling and protein synthesis dysregulation in a Rett syndrome animal model. Hum Mol Genet 2011;20:1182–1196. [DOI] [PubMed] [Google Scholar]
- 46.Auerbach BD, Osterweil EK, Bear MF. Mutations causing syndromic autism define an axis of synaptic pathophysiology. Nature 2011;480:63–68. [DOI] [PMC free article] [PubMed] [Google Scholar]
- 47.Brunoni AR, Junior RF, Kemp AH, et al. Differential improvement in depressive symptoms for tDCS alone and combined with phar-macotherapy: an exploratory analysis from the Sertraline vs. Electrical Current Therapy for Treating Depression Clinical Study. Int J Neuropsychopharmacol 2014;17:53–61. [DOI] [PubMed] [Google Scholar]
- 48.Bear MF, Huber KM, Warren ST. The mGluR theory of fragile X mental retardation. Trends Neurosci 2004;27:370–377. [DOI] [PubMed] [Google Scholar]
- 49.Meng XF, Yu JT, Song JH, et al. Role of the mTOR signaling pathway in epilepsy. J Neurol Sci 2013;332:4–15. [DOI] [PubMed] [Google Scholar]
- 50.Lasarge CL, Danzer SC. Mechanisms regulating neuronal excitability and seizure development following mTOR pathway hyperactivation. Front Mol Neurosci 2014;7:18. [DOI] [PMC free article] [PubMed] [Google Scholar]