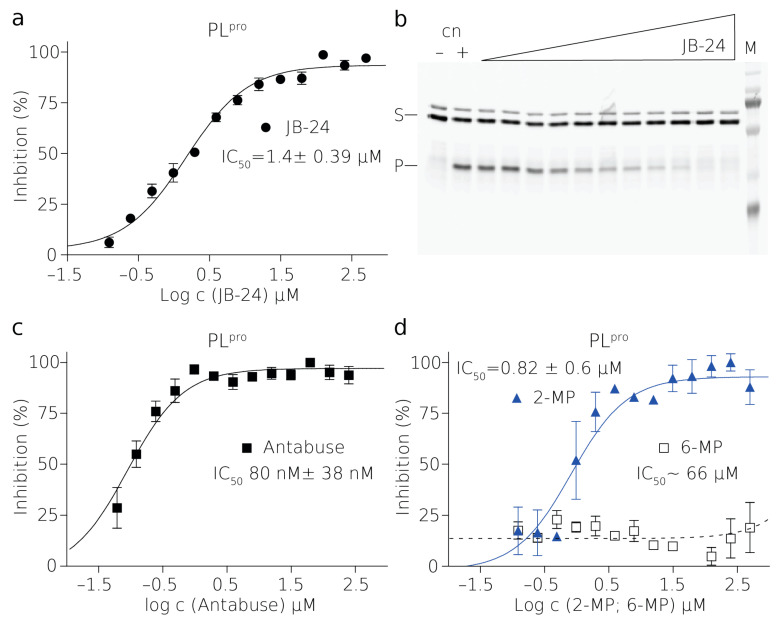
Figure 3.
Inhibition of SARS-CoV2 PLpro by small molecules. Curves derived from the FRET inhibition assays of (a) JB24, (c) Antabuse, and (d) 2-MP and 6-MP. Each curve is derived from three experiments. (b) SDS-PAGE gel from one of the titrations with JB24 where (M) is a marker, (+) is a positive control reaction in which there was no inhibitor present, (–) is a negative control reaction where there was no enzyme present, (S) is the substrate, and (P) is the product. The illustrative evaluations of the SDS-PAGE gels resolving the reaction progress and more details are shown in Figure S6.

