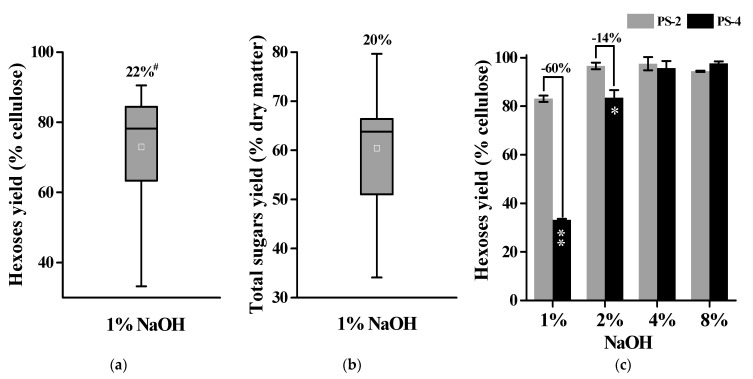
Figure 3.
Variation of biomass enzymatic saccharification among 11 total banana samples after alkali pretreatments (n = 11). (a) Hexoses yields released from enzymatic hydrolysis after 1% NaOH pretreatment; (b) total sugar yields (hexoses and pentoses) released from both enzymatic hydrolysis and 1% NaOH pretreatment; (c) hexoses yields released from enzymatic hydrolysis after four concentrations of NaOH pretreatments with two banana samples; # As coefficient of variation. * and ** indicate significant differences between PS-2 and PS-4 by t-test at p < 0.05 and p < 0.01 (n ± 3). Minus sign percentage was calculated by subtraction between PS-2 and PS-4 values divided by PS-2. Data as mean SD (n ± 3).

