Abstract
Electrodynamic therapy (EDT) has recently emerged as a potential external field responsive approach for tumor treatment. While it presents a number of clear superiorities, EDT inherits the intrinsic challenges of current reactive oxygen species (ROS) based therapeutic treatments owing to the complex tumor microenvironment, including glutathione (GSH) overexpression, acidity and others. Herein for the first time, iron oxide nanoparticles are decorated using platinum nanocrystals (Fe3O4@Pt NPs) to integrate the current EDT with chemodynamic phenomenon and GSH depletion. Fe3O4@Pt NPs can effectively induce ROS generation based on the catalytic reaction on the surface of Pt nanoparticles triggered by electric field (E), and meanwhile it may catalyze intracellular H2O2 into ROS via Fenton reaction. In addition, Fe3+ ions released from Fe3O4@Pt NPs under the acidic condition in tumor cells consume GSH in a rapid fashion, inhibiting ROS clearance to enhance its antitumor efficacy. As a result, considerable in vitro and in vivo tumor inhibition phenomena are observed. This study has demonstrated an alternative concept of combinational therapeutic modality with superior efficacy.
Supplementary Information
The online version contains supplementary material available at 10.1186/s12951-021-00957-7.
Keywords: Electrodynamic therapy, Chemodynamic therapy, GSH depletion, Fe3O4@Pt
Background
Reactive oxygen species (ROS), containing hydroxyl radical (·OH), superoxide (O2·−), singlet oxygen (1O2) and hydrogen peroxide (H2O2), widely exist in living organisms [1–3]. It plays a crucial role in physiological functions, which can modulate proteins, produce hormones, regulate cell signaling, mediate inflammation, and eliminate pathogens. However, excessive intracellular ROS induces the damage of proteins, lipids and DNA with no specificallity [4, 5], and thus cancer therapies based on ROS have been extenstively explored in the past years [6–10]. Recently, an emerged ROS-based cancer therapy, called as electrodynamic therapy (EDT) has attracted wide attention. The potential mechanism of EDT is to ultilize the catalytic reaction at the surface of platinum nanoparticles under an electric field to produce toxic ROS [11]. Several strategies have been explored to enhance the therapeutic efficacy of EDT. Porous platinum incorporated with GOx was designed and synthesized for oxygen-inductive starvation/EDT synergistic cancer therapy [12]. Porous platinum and its hybrids have been developed as drug delivery systems of anticancer drug for combinational chemotherapy and EDT [13, 14]. EDT offers some superiority comparing to current “dynamic” cancer therapies, including controllable ROS generation by electric field, independence to O2 and H2O2, and low side effect [13, 14]. Nonetheless, EDT also inherits the intrinsic shortcomings of ROS-based therapies, especially restrains from the complicated tumor microenvironment (TME).
Tumor microenvironment refers to the surrouding microenvironment where tumor cells are located and it play a influencial role to the occurrence, growth and metastasis of tumors [15, 16]. A groundswell of studies has been carried out to regulate diverse characteristics of TME such as acidity, hypoxia, overexpressed hydrogen peroxide (H2O2), and others. Glutathione (GSH), which is often upregulated in TME, serves as one of antioxidants in protecting cancer cells from oxidative damage by free radicals [17–23]. Therefore, the efficacy of ROS-based treatments is significantly hindered. Several strategies have been develpoed to reduce GSH content in TME. One strategy is to use a type of inhibitor of γ-glutamylcysteine synthetase, l-buthionine sulfoximine (BSO), to suppress the GSH production from the source [18, 24]. Another is to oxidize the GSH to glutathione disulfide (GSSG) by certain oxidizers [23, 25, 26]. In addition, glutathione peroxidase (GSH-Px) are able to catalyze the reduction of H2O2 with GSH as reductant [27]. In this process, GSH can be consumed and converted into GSSG by the oxidation of H2O2 [28], favoring current ROS-based therapies.
On the other hand, TME can also be ultilized as a portal for specific and effective treatment for tumors. Chemodynamic therapy (CDT), which exploits the TME features including acidity and overexpressed H2O2, is another ROS-based cancer therapy [29–31]. In the acidic TME with no external stimulus, the toxic ·OH can be produced in an in situ manner by catalyzing H2O2 via Fenton or Fenton-like reactions [32–35]. While CDT shows smart characteristics in utilizing the physiological conditions of TME, the lacking in the control of its ROS induction and thus therapeutic outcomes hinders its potential clinical translation. The armour of EDT with chemodynamic phenomenon and GSH depletion is therefore considered as a highly potential approach to amplify the advantages of two ROS-based methodologies by utilizing both internal and external stimulus. However, this ambitious integration in one therapeutic platform has yet been attempted, to the best of our knowledge.
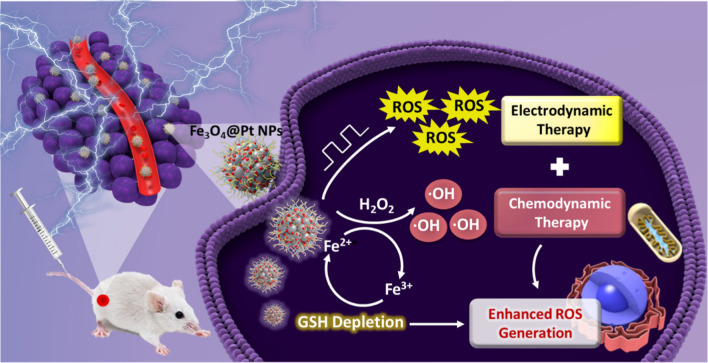
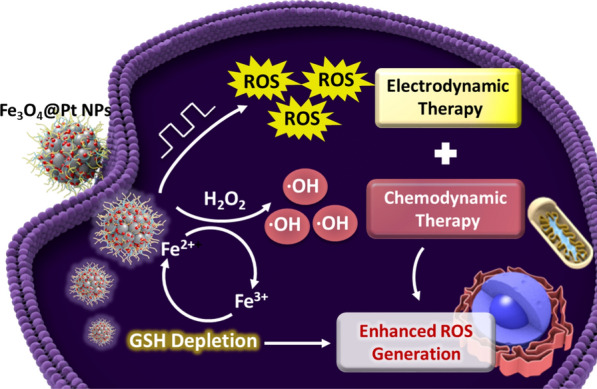
Here for this purpose, iron oxide nanoparticles (Fe3O4 NPs) are synthesized and decorated with platinum nanocrystals at the surface (Fe3O4@Pt NPs). After reaching the tumor site as demonstrated in Fig. 1, the platinum nanoparticles (Pt NPs) disassembled from Fe3O4@Pt serve as an electro-sensitizer to generate ROS under an electric field. Meanwhile, Fe3O4 NPs release Fe2+ under the acidic condition and catalyze H2O2 to produce toxic ·OH through Fenton reaction. In addition, the released-Fe3+ deplete GSH effectively through redox reaction to inhibit potential ROS clearance, and generate more Fe2+ to facilitate the ·OH induction. In consequence, both in vitro and in vivo studies indicate Fe3O4@Pt NPs have enabled significant antitumor effect comparing to each of solo therapeutic modality. The study is therefore anticipated to offer a distinctive concept in designing multi-stimulus responsive systems for potential tumor treatments.
Fig.1.
Schematic illustration of Fe3O4@Pt NPs for synergistic electrodynamic/chemodynamic tumor therapy with GSH depletion
Materials and methods
Chemical and reagents
Ferric chloride hexahydrate (FeCl3·6H2O), ethylene glycol (EG), diethylene glycol (DEG), sodium acetate (CH3COONa, NaOAc), polyvinylpyrrolidone (PVP, K-30), sodium borohydride (NaBH4) and ethanol were all purchased from Sinopharm Chemical Reagent Co., Ltd. 3-aminopropyltriethoxysilane (APTES), polyacrylic acid (PAA, MW ≈ 1800, 50%), Amino group terminated poly (ethylene glycol) (PEG-NH2, 5 K) and potassium hexachloroplatinate (K2PtCl6) was purchased from Aladdin. All chemicals were not further purified before use.
Synthesis of and modification of Fe3O4 NPs
According to a previous study [36], Fe3O4 NPs were prepared by solvent thermal method. 2 mmol FeCl3·6H2O was added into a mix solution of 6 mL ED and 14 mL DEG and the solution was stirred magnetically at room temperature for 30 min. Then, 2 g PVP was put into above mixture and the solutions were stirred magnetically at 125 ℃ for 1 h. After that, 1.5 g NaOAc was added. Another 0.5 h later, the solutions were poured into a 50 mL stainless-steel autoclave with Teflon lining and heated for 12 h at 200 ℃. Finally, Fe3O4 NPs were obtained by centrifugation and washed with ethanol and water for three times. To obtain amino modified Fe3O4 NPs, 10 mg Fe3O4 NPs were dispersed in 5 mL ethanol and then a stable solution was obtained by ultrasound. Next, 150 μL APTES was put into the solution. After stirring magnetically at 50 ℃ for 24 h, excess APTES was removed by magnetic separation and washed by ethanol.
Synthesis and modification of Fe3O4@Pt NPs
The obtained 10 mg Fe3O4-NH2 NPs were put into 10 mL DI water and 25 mg K2PtCl6 was added. After ultrasonication for 1 h, 35 mg NaBH4 was put into 5 mL ice-cold water to obtain the solution and then it was added into above solution dropwisely. After ultrasonication for 1 h, the Fe3O4@Pt NPs were separated by magnet from the solution and washed several times by DI water. The obtained Fe3O4@Pt NPs were put into 10 mL DI water to get the solution by ultrasound and then 250 μL PAA solution was added. Next, NaOH was used to adjust the pH of solution to 8.0. After stirring overnight, the nanoparticles were separated by magnet and washed by DI water to remove excessive PAA. Subsequently, products were put into 8 mL DI water. 5 mg EDC and 10 mg mPEG-NH2 were added into solution, and purified by magnetic separation after 24 h. The final sample was washed by DI water for three times and collected for further use.
Fenton reaction activity and Michaelis–Menten kinetics studies
The activity of Fenton reaction of Fe3O4 NPs was measured by 3,3ʹ,5,5ʹ-tetramethylbenzidine (TMB) via the chromogenic reaction (λ = 652 nm). Phosphate buffer solution (pH = 6) was prepared as the reaction buffer, and 100 mM H2O2 was added. The steady-state kinetic catalytic activities of 200 μg/mL Fe3O4 NPs were investigated by monitoring the absorbance variation at 652 nm upon addition of a series H2O2 concentration (10, 20, 50, 80, 100 mM). The rate of absorbance variation was used to calculate the change velocity of TMB concentration by the Beer–Lambert law (A = εlc, where ε = 39 000 M−1 cm−1, l = 10 mm). The H2O2 concentrations were used as an abscissa, and the rates of change in TMB concentration were used as an ordinate to build scatter diagram. It could be fitted by the Michaelis–Menten equation, known as Eq. (1)
| 1 |
where is the velocity, is the maximal velocity, is the substrate concentration, and is the Michaelis–Menten constant.
Through a feasible deformation, the original Michaelis–Menten equation could be converted to Eq. (2)
| 2 |
Electro-catalytic activity studies
The catalytic reaction activity driven by electric field was investigated by methylene blue (MB) via the degradation reaction. The equipments were similar to the previuous study [2]. Typically, MB (2.5 × 10⁻⁵ M) and Fe3O4@Pt NPs (200 μg/mL for Fe3O4) in 2 mL PBS was added into 24-well plate. The square wave AC electric field (10 mHz, 10 mA) was chosen following previous studies [2]. At different point-in-time, 50 μL of solution was sucked out and diluted to 200 μL by PBS. The absorption spectrum of MB were examined by UV–vis spectroscopy. Similarly, the MB degradation at different concentration (50 to 300 μg/mL) of Fe3O4@Pt NPs was studied.
Depletion of GSH
The GSH depletion was examined by 5, 5ʹ-dithiobis-(2-nitrobenzoic acid) (DTNB). Fe3O4 NPs solutions (2 mg/mL) was added with GSH (1 mM) and put in the shaker at 37 ℃. At different points of time, 500 µL mL solution was centrifuged to remove Fe3O4 NPs. And 2.5 mL PBS, and 50 µL DTNB (10 mM) were added into the supernatant. The absorption spectrum was obtained by UV–vis spectroscopy.
Releasing of Fe2+
The consumption of Fe2+ was examined by 1,10-phenanthroline. Fe3O4 NPs was incubated with or without GSH (10 mM) under buffer solution with different pH (7.4 or 6.0) in the shaker at 37 ℃. At different points of time, 1 mL of supernatant was collected by centrifugation and 1 mL of 1,10-phenanthroline (2 mg/mL) was added into the supernatant and the absorption spectrum was investigated.
Cell viability assay
1 × 10⁴ 7702 cells were seeded into one well of 96-well plate and cultured for 12 h at 37 ℃. Consequently, different concentrations Fe3O4@Pt NPs were added into cells.
For CDT treatment, 4T1 cells were plated as above. The pH of medium was adjusted to 6 by HCl to simulate the acidic TME. Then, the medium (pH = 6) containing Fe3O4@Pt NPs at varied concentrations of 6, 12, 25, 50, 100, 200 μg/mL for Fe3O4 containing 100 μM H2O2.
For EDT treatment, 1 × 10⁵ 4T1 cells were seeded into one well of 24-well plates. After incubated with Fe3O4@Pt NPs at varied concentrations of 6, 12, 25, 50, 100, 200 μg/mL for Fe3O4 for 4 h, the cells were conducted by square wave AC electric field (10 mHz, 5 mA) for 10 min.
For combinational therapy, 4T1 cells were cultured with Fe3O4@Pt NPs at varied concentrations of 6, 12, 25, 50, 100, 200 μg/mL for Fe3O4 containing 100 μM H2O2 for 4 h, then conducted by square wave AC electric field (10 mHz, 5 mA) for 10 min.
For studying enhanced EDT of the GSH depletion by Fe3+, 4T1 cells were cultured with Pt NPs or Pt NPs plus Fe3+ at varied concentrations of 6, 12, 25, 50, 100, 200 μg/mL for Pt NPs for 4 h, conducted by square wave AC electric field (10 mHz, 5 mA) for 10 min.
All the cell viabilities were measured by CCK-8 assay by a microplate reader after another 24 h.
Intracellular ROS generation
4T1 cells were treated with Fe3O4@Pt (200 μg/mL), Fe3O4@Pt plus H2O2 (100 μM), Pt plus electric field (5 mA, 10 min), Fe3O4@Pt plus electric field, Fe3O4@Pt plus H2O2 and electric field for 4 h. Then, before EDT treatment, cells were treated by DCFH-DA probe for 30 min. After another 1 h, the green fluorescence by DCFH was measured by the fluorescence microscopy.
Intracellular GSH variation
4 × 10⁵ 4T1 cells were seeded into one well of 6-well plates. After treated with different samples for 12 h, the cells were centrifugated, washed three times by PBS and lysed by Triton-X-100 lysis buffer. The supernatants were collected by centrifugation and then 50 μL supernatants was sucked out and added with DTNB solution (50 μL, 400 μM). The GSH level was evaluated by absorption of DTNB at 412 nm using microplate reader after cultured for 30 min.
In vivo study
All animal experiments were performed in accordance with the guidelines of the animal ethics committee of the Biological Resource Centre of the Agency for Science, Technology and Research, Zhejiang University. The Female BALB/c mice were bared with 4T1 tumors for in vivo study. The initial tumor volume was ~ 400 mm3. All the mice were divided to six groups: (1) PBS; (2) E; (3) Pt (4 mg/mL, 200 μL); (4) Fe3O4@Pt (4 mg/mL for Fe3O4, 200 μL); (5) Pt (4 mg/mL, 200 μL) + E; (6) Fe3O4@Pt (4 mg/mL for Fe3O4, 200 μL) + E. After intravenous injected with different samples for 24 h, group 2, 5 and 6 mices were conducted by the square wave AC field (10 mHz, 5 mA, 5 min). The tumor lengths, widths and the body weights were measured every 2 days. The tumor volumes were able to be calculated by the equation (volume = width2 × length /2).
The tumors from different groups were sucked out after 24 h. The tumors were sliced for H&E staining, fluorescent TUNEL staining and Ki67 staining and observed by a confocal microscopy.
Statistical analysis
Data are expressed as mean ± standard deviation. Statistical significance was evaluated using the Student t-test to compare the results between two groups. P values < 0.05 were considered statistically significant (NS, no significance, *p < 0.05, **p < 0.01, ***p < 0.001).
Results and discussion
Synthesis of Fe3O4@Pt NPs
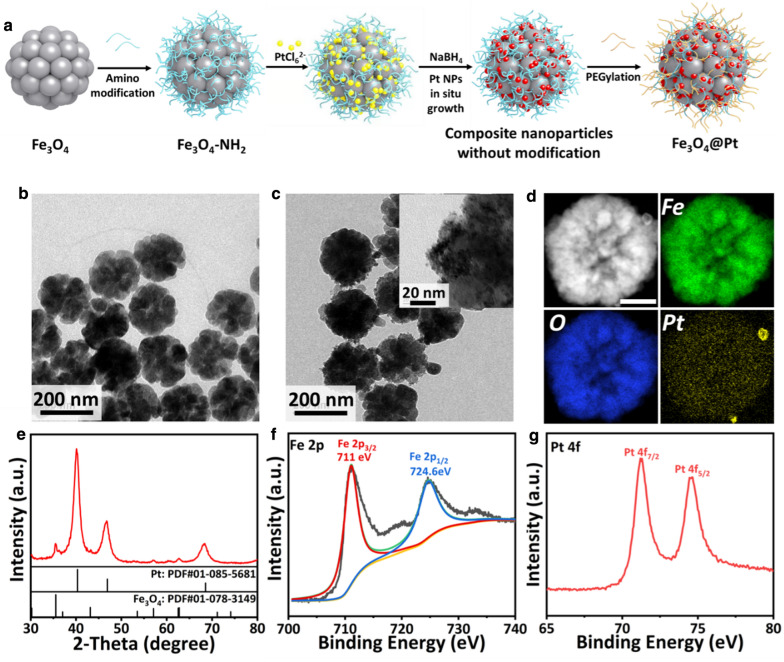
Fe3O4 NPs were synthesized and modified with amino groups before the in situ growth of Pt NPs on the surface. Fe3O4@Pt NPs were modified with polyethylene glycol (PEG) to enhance its stability (Fig. 2a). The as-prepared Fe3O4 NPs are well dispersed and uniform with a size of ~ 200 nm (Fig. 2b and Additional file 1: Fig. S1). Presenting as clusters assembled by small iron oxide crystals, Fe3O4 NPs exhibit a rough surface morphology, favoring the subsequent growth and loading of Pt nanoparticles. The peaks in X-Ray photoelectron spectrum (XPS) of Fe3O4 are attributed to Fe 2p3/2 and Fe 2p1/2, as expected (Additional file 1: Fig. S2). Subsequently, K2PtCl6 was used as Pt sources and the NaBH4 was used as the reductant for the incorporation of Pt NPs. As shown in the TEM images, Pt nanocrystals are anchored at the surface of Fe3O4 NPs in a uniform manner (Fig. 2c). The elemental mapping of Fe3O4@Pt nanoparticles confirms that Pt element with high content presents across the nanoparticles in addition to Fe and O (Fig. 2d). The diffraction peaks exhibited in the XRD pattern are attributed to monoclinic Fe3O4 (PDF#01-078-3149) and cubic Pt (PDF#01-085-5681) (Fig. 2e). The doublet peaks in XPS of Fe3O4@Pt NPs match Fe 2p3/2, Fe 2p1/2 and Pt0 4f7/2, Pt0 4f5/2, respectively (Fig. 2f, g), demonstrating the co-existence of Fe3O4 and Pt in the nanocomposites. The hydrodynamic diameter of Fe3O4@Pt NPs is ~ 300 nm, as examined by dynamic light scattering (DLS) (Additional file 1: Fig. S3). The varied zeta potential of nanoparticles, during the synthesis and surface modification formation, indicates that Fe3O4@Pt NPs are successfully modified with PEG groups at its surface (Additional file 1: Fig. S4). As a result, Fe3O4@Pt NPs maintain stably dispersed in water, PBS and RPMI-1640 and FBS solution for 12 h, indicating its excellent solubility and stability for following in vitro and in vivo assessments (Additional file 1: Fig. S5a, b).
Fig. 2.
Synthesis and characterization of Fe3O4@Pt NPs. a Schematic illustration of synthesis procedure. TEM images of b as-prepared Fe3O4 NPs and c Fe3O4@Pt NPs. d Electron diffraction pattern and e XRD pattern of Fe3O4@Pt NPs. The surface valence status of f Fe and g Pt elements of Fe3O4@Pt NPs examined by the X-Ray photoelectron spectroscopy
Fenton activity and electrodynamic properties
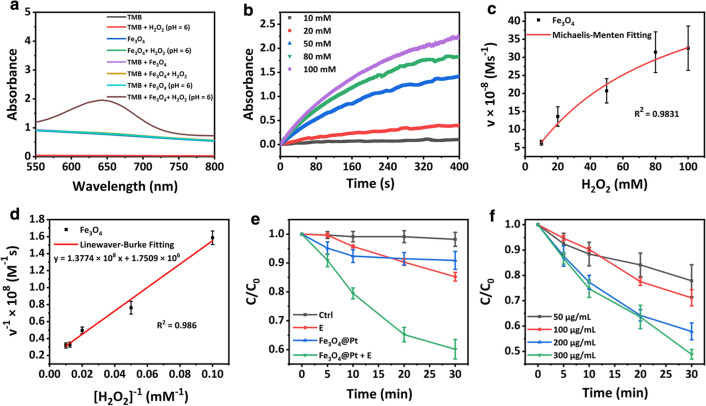
In order to avoid the uncertainty in ROS evaluation induced by oxygen generated from Pt nanocrystals, the ·OH production of Fe3O4 NPs was examined to reveal the Fenton activity of Fe3O4@Pt NPs using 3,3′,5,5′-tetramethylbenzidine (TMB). As shown in Fig. 3a, in the TMB-H2O2 mixture solution with pH of 6, Fe3O4 NPs could effectively oxidate TMB to blue-colored TMB (oxTMB) which presents characteristic absorption peak at 652 nm, confirming the ·OH generation. To evaluate the catalytic activity, the catalytic kinetics was examined in a solution containing Fe3O4 NPs, TMB, and H2O2 at varied concentrations (10, 20, 50, 80, and 100 mM) in buffer solution (pH = 6). The findings show that higher H2O2 concentration induces more rapid increase of absorbance at 652 nm, implying accelerated ·OH generation (Fig. 3b).
Fig. 3.
a UV–vis absorption spectra of the catalyzed oxidation of TMB (oxTMB) catalyzed by Fe3O4 NPs with 100 mM H2O2 under the reaction buffer (pH = 6). b Time-dependent absorbance changes at 652 nm as a result of the catalyzed oxidation of TMB at different H2O2 concentrations (10, 20, 50, 80, 100 × 10−3 M). c Michaelis–Menten kinetic analysis and d Lineweaver–Burk plotting for Fe3O4 with H2O2 as substrate. The steady-state catalytic rate (v) was calculated from the initial slopes of absorbance versus time plots in panel b. e Degradation rates of MB under different conditions ([Fe3O4@Pt]: 200 µg/mL for Fe3O4, AC output current: 10 mA, [MB]: 2.5 × 10⁻⁵ M). f Degradation rates of MB in the presence of Fe3O4@Pt NPs with different concentrations under electric field
Therefore, the inverse of H2O2 concentrations were used as an abscissa, and the inverse of the TMB concentrations-changing rates were used as an ordinate to make scatter diagram (Fig. 3c). The relationship could be fitted by Lineweaver–Burk plot, and and values are calculated to be 78.67 mM and 5.711 × 10⁻⁷ Ms−1, respectively (Fig. 2d).
The catalytic activity of Fe3O4@Pt NPs under square wave AC field was evaluated by the degradation assessment of MB under the neutral condition and without H2O2 [37]. The AC electric field was chosen to avoid the pH variation at the surrounding of electrodes. As shown in Fig. 3e and Additional file 1: Fig. S6a–d, the MB absorbance at 664 nm decreases effectively in the solution containing Fe3O4@Pt NPs (200 μg/mL) under electric field, while the absorption does not decrease in the control, Fe3O4@Pt NPs and AC electric field groups, as expected. The MB degradation triggered by Fe3O4@Pt NPs under electric field was further examined with varied particle concentrations (50, 100, 200, 300 μg/mL). The MB degradation is highly dependent to the particle concentration (Fig. 3f and Additional file 1: Fig. S7a–e). The velocity of MB degradation is significantly promoted as the increase of particle concentration. However, the addition of H2O2 does not induce clear influence on the MB degradation driven by Pt nanocrystals under electric field (Additional file 1: Fig. S8a–c).
Synergistic promotion of ROS induction
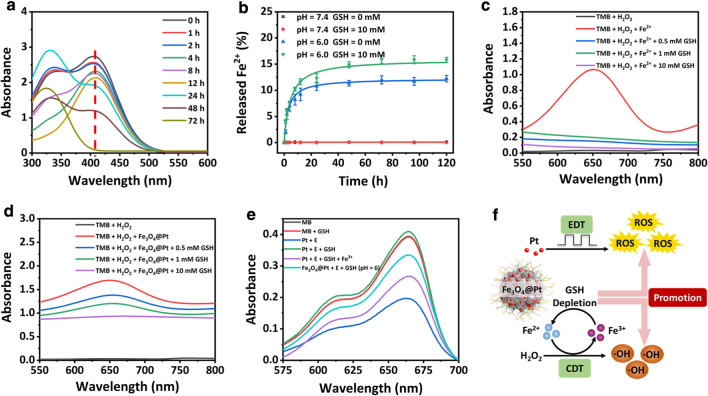
It is known that the overexpressed GSH in tumor cells hinders the therapeutic efficacy of ROS-based cancer treatments. In this study, the functionality of Fe3O4@Pt NPs in the GSH depletion was explored. The nanoparticles were incubated in the solution containing excessive GSH, and the residual GSH was examined at different time points using a sulphydryl (-SH) indicator (DTNB). With the prolonged incubation time, the absorption peak at 412 nm decreases accordingly, demonstrating effective GSH depletion by the particles (Fig. 4a). To uncover the mechanism of GSH depletion by Fe3O4@Pt NPs, the releasing of Fe2+ ions from the core of Fe3O4@Pt NPs (Fe3O4) after incubation in GSH solution was examined by the UV–vis absorbance of 1,10-phenanthroline at 511 nm based on the standard curve of 1,10-phenanthroline solutions (Fig. 4b and Additional file 1: Fig. S9a, b). The release of Fe2+ can hardly be observed in the neutral environment. In contrast, more rapid release of Fe2+ is induced during incubation under an acidic condition (pH = 6), as expected. An accelerated increase in Fe2+ release was observed after the addition of 10 mM GSH, indicating that its reaction with GSH induces the effective transformation of Fe3+ to Fe2+. The TMB absorbance of ·OH induced by Fe2+ is significantly weakened in the presence of GSH, indicating that GSH eliminates the ·OH formed (Fig. 4c). In another words, the Fe3O4 core of Fe3O4@Pt NPs may effectively consume GSH, favoring the ·OH induction as well as the efficacy of CDT.
Fig. 4.
a UV–vis spectra of GSH solutions containing Fe3O4@Pt NPs with DTNB as the trapping agent of sulphydryl (-SH). b Release profiles of Fe2+ ions from Fe3O4@Pt NPs with 10 mM GSH. c UV–vis absorbance of TMB by Fe2+-mediated Fenton-like reaction in the presence or absence of GSH. d The UV–vis absorbance of TMB by Fe3O4@Pt NPs mediated Fenton-like reaction in the presence or absence of GSH. e MB degradation by Pt NPs and Fe3O4@Pt NPs-mediated EDT in the presence or absence of GSH and Fe3+. f Schematic illustration for the mechanism of ROS generation by Fe3O4@Pt NPs
Meanwhile, the effect of Fe3+ mediated GSH depletion on the efficacy of EDT by Pt NPs was explored. As shown in Fig. 4e, Pt NPs effectively weaken the absorbance and degrade the MB solution under the electric field, while no clear degradation is induced in the presence of GSH (0.5 mM). However, after the addition of Fe3+, the MB degradation recovers effectively, indicating the effective comsumption of GSH by Fe3+. In addition, at the acid condition, Fe3O4@Pt NPs induce the recovery of MB degradation, indicating the it can deplete GSH by releasing Fe3+ in the acid environment. The findings suggest that Fe3O4@Pt NPs can enable enhanced EDT efficacy in the solution containing GSH.
In summary, the mechanism of the synergistic promotion in ROS induction achieved by Fe3O4@Pt NPs becomes clear (Fig. 4f). Despite the known facts of ROS induction from Pt-mediated EDT phenomenon and ·OH production from Fenton reaction by Fe3O4 core, the byproduct Fe3+ effectively consumes GSH contained in the solution. The GSH depletion achieved enables two crucial consequences. One is to supply extra Fe2+ due to the reaction of GSH consumption by Fe3+, favoring the ·OH production of CDT. Another is that the overall presence of ROS generated by both EDT and CDT phenomena is promoted, by a large magnitude, owing to the avoided ROS elimination by GSH. Therefore, Fe3O4@Pt NPs synthesized here have played multiple roles as excellent electrodynamic agent, Fenton agent for CDT and an effective GSH quencher, paving the way to its potential antitumor properties.
In vitro anti-tumor properties
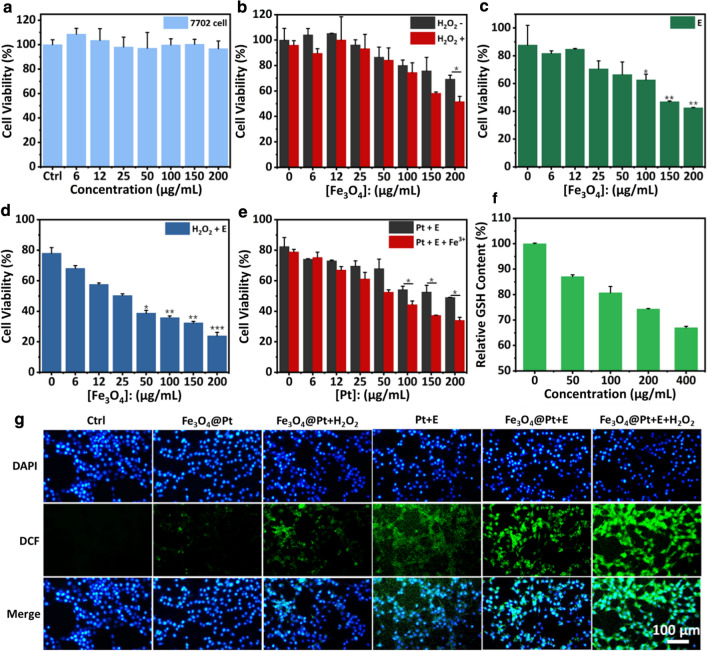
The cytotoxicity of Fe3O4@Pt nanoparticles was examined using 7702 cells by CCK-8. Fe3O4@Pt NPs at varied concentrations of 6, 12, 25, 50, 100, 200 μg/mL for Fe3O4 did not induce clear negative effect to cells after 24 h (Fig. 5a). In addition, 4T1 tumor cells were treated with Fe3O4@Pt NPs at varied concentrations of 6, 12, 25, 50, 100, 200 μg/mL for Fe3O4 with or without 100 μM H2O2 (pH = 6) for 24 h. It was observed that the cell killing efficacy was dependent on the concentration of Fe3O4@Pt NPs, as expected (Fig. 5b). When adding extra H2O2, an enhanced inhibition to cell variability occured due to the promoted ·OH production. Further, Fe3O4@Pt NPs at varied concentrations of 6, 12, 25, 50, 100, 200 μg/mL for Fe3O4 were incubated under the agitation by a square-wave electric field (5 mA) for 10 min. The cell variability was remarkably suppressed with increased particle concentration under the electric field owing to the enhanced EDT effect (Fig. 5c). The combined effect of CDT and EDT triggered by Fe3O4@Pt was further explored. As shown in Fig. 5d, Fe3O4@Pt NPs (200 μg/mL for Fe3O4) with 100 μM H2O2 (pH = 6) under AC electric field (5 mA, 10 min) induced distinctive inhibition to cell variability, higher than that from Fe3O4@Pt NPs under electric field or Fe3O4@Pt NPs with 100 μM H2O2 (pH = 6) but no electric field, indicating the enhanced in vitro antitumor effect of the combined CDT and EDT.
Fig. 5.
In vitro cell culture study. a Viabilities of 7702 cells with different concentrations of Fe3O4@Pt NPs. b Viabilities of 4T1 cells with different concentrations of Fe3O4@Pt NPs in the presence and absence of 100 μM H2O2. c Viability of 4T1 cells incubated with Fe3O4@Pt NPs under the electric field (5 mA, 10 min). d Viability of 4T1 cells incubated with Fe3O4@Pt NPs under the electric field (5 mA, 10 min) with 100 μM H2O2. e Viability of 4T1 cells incubated with Pt NPs at different concentrations under the electric field (5 mA, 10 min) in the presence and absence of Fe3+. f Relative intracellular GSH in 4T1 cells incubated with different concentration of Fe3O4@Pt NPs. g Intracellular ROS presence after different treatments using DCFH-DA as the ROS probe. (*p < 0.05, **p < 0.01 and ***p < 0.001 analyzed by Student’s t-test)
To reveal the favoring effect of CDT agent (Fe3O4) to the EDT efficacy induced by Pt nanocrystals, Pt NPs were incubated with tumor cells in absence and presence of Fe3+ and agitated by AC electric field for 10 min. It is clear that the addition of Fe3+ promoted the inhibition effect to cell variability under the AC electric field (Fig. 5e). The findings indicate that the intracellular GSH can be effectively consumed by Fe3+ and this may promote ROS presence induced by electrodynamic phenomenon of Pt NPs. The intracellular GSH level after being incubated with Fe3O4@Pt NPs at varied concentrations of 50, 100, 200, 400 μg/mL for Fe3O4 was quantitatively measured by the method of Ellman’s reagent (Fig. 5f). As expected, GSH content within cells decreased with the increased concentration of Fe3O4@Pt NPs, indicating the effective GSH consumption by the particles. In addition, the intracellular GSH levels after different treatments were investigated (Additional file 1: Fig. S10). The content of GSH in tumor cells treated with Fe3O4@Pt with electric field presented in the lowest magnitude comparing to other groups.
To uncover the in vitro antitumor mechanism of Fe3O4@Pt NPs, the intracellular ROS levels were examined using DCFH-DA probe, which show green fluorescence in the presence of ROS. Single treatments, including Fe3O4@Pt NPs, Fe3O4@Pt NPs plus H2O2, and Pt NPs under electric field, induced certain fluorescence. Notably, cells treated with Fe3O4@Pt NPs under electric field presented conspicuous green fluorescence, indicating considerably promoted ROS content. The supply of extra H2O2 during cell incubation may further improve intracellular ROS due to the enhanced Fenton reactions, as expected (Fig. 5g). Overall, Fe3O4@Pt NPs, presenting multiple tailored properties, can effectively enable promoted synergistic antitumor effect of CDT and EDT with GSH depletion.
In vivo study
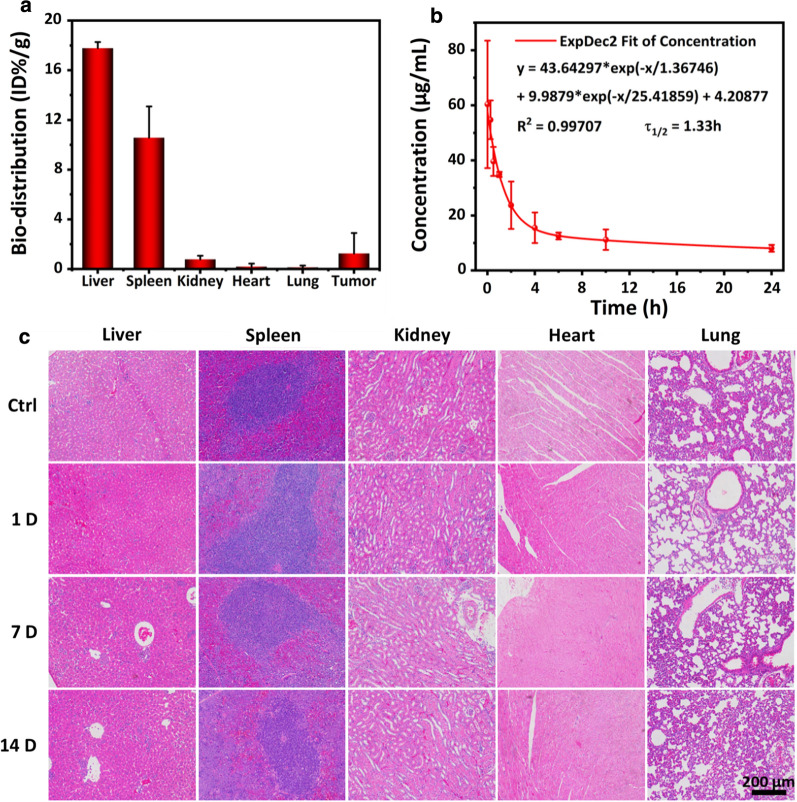
To evaluate the biodistribution and biosafety, mice bearing 4T1 tumors were intravenously (i.v.) injected with Fe3O4@Pt NPs. The major organs were harvested after 24 h. The biodistribution study was carried out by examining the Pt content using ICP-OES (Fig. 6a). The accumulated content of Pt in the tumors reached ~ 1.25% of the injection dose. This Pt enrichment at the tumor site indicates the effective tumor accumulation of Fe3O4@Pt NPs after intravenous injection attributing to enhanced permeability and retention (EPR) effect. It is noteworthy that the accumulated content of Pt at the tumor site (~ 1.25%) is of consierably high magnitude for intravenous administration, as a variety of current nanoparticles reported reach by as low as ~ 0.7% [38]. In addition, in the blood-circulation experiment, a circulating half-life of ~ 1.33 h in blood stream was observed (Fig. 6b). The in vivo toxicity potential of Fe3O4@Pt NPs was assessed by histopathological analysis (Fig. 6c), and no apparent variation was observed in histopathological staining images of heart, lung, liver, spleen or kidney in 1, 7 and 14 days of the experimental period, comparing to the control group. Overall, the findings indicate that the synthesized Fe3O4@Pt NPs do not present apparent in vivo toxicity.
Fig. 6.
In vivo biodistribution and biosafety of Fe3O4@Pt NPs. a The biodistribution of Pt (% injected dose (ID) of Pt per gram of tissues) in main organs and tumor after intravenous administrations of Fe3O4@Pt NPs for 24 h; b The blood circulation curve of intravenously injected Fe3O4@Pt NPs. The half-time (τ1/2) is calculated to be ~ 1.33 h. c H&E staining of mice major organs (liver, spleen, kidney, heart and lung), to examine the histological variations after intravenous injection at 1, 7, and 14 days
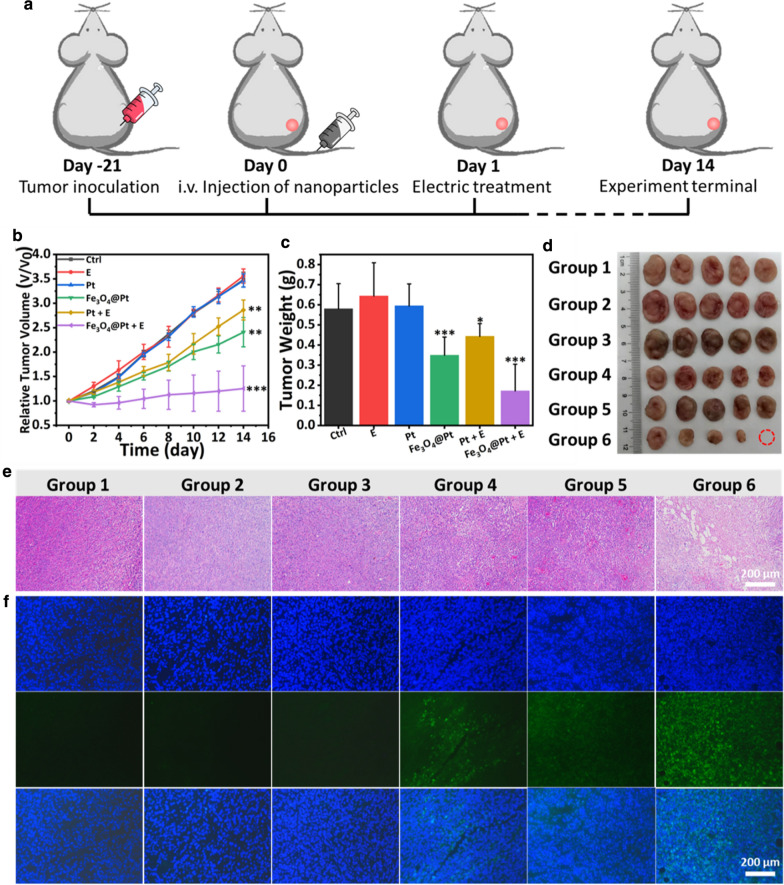
Subsequently, the in vivo antitumor properties of the particles were revealed. The treatment protocol of animal experiments is illustrated in Fig. 7a. The experimental groups included the control (PBS) (Group 1), E (Group 2), Pt NPs (Group 3), Fe3O4@Pt NPs (Group 4), Pt NPs injection + E (Group 5) and Fe3O4@Pt NPs + E (Group 6). 200 μL Fe3O4@Pt NPs solution (4 mg/mL for Fe3O4), and E was maintained as the square-wave AC (5 mA, 10 mHz, 5 min).
Fig. 7.
In vivo antitumor properties. a Schematic illustration of treatment procedures by Fe3O4@Pt in 4T1 tumor model. b Relative tumor volumes in mice after different treatment. c The average tumor weights and d digital photographs of tumors collected at day 14 from different groups of mice. e Microscopic images of H&E stained tumor slices after different treatments. f Microscopic images of immunofluorescence TUNEL-stained tumor slices. (*p < 0.05, **p < 0.01 and ***p < 0.001 analyzed by Student’s t-test)
The tumor length and width were recorded every 2 days by digital capliper. According to the equation, tumor volume was calculated and normalized to its initial size. As revealed in Fig. 7b, Group 2 and 3 showed negligible suppression to tumors, while Group 4 and 5 presented partially suppressed tumor growth. In addition, the tumor growth in Group 6 combining EDT and CDT exhibited the most significant tumor suppression in all the groups. The mice body weight were measured every two days (Additional file 1: Fig. S11). There were no apparent changes in body weight of mice, indicating negligible system toxicity of nanoparticles. After 14 days, tumors of all groups were collected, weighted and imaged (Fig. 7c, d). The tumor weight and volume from Group 6 were remarkablely inferior to that of other groups.
As shown in the H&E images, Group 6 exhibited the more dramatic cellular damage than the other groups (Fig. 7e). As shown in TUNEL fluorescence images, the samples of Group 1, 2 and 3 showed no clear apoptotic signals. Group 4 and 5 showed weak green signals. In contrast, Group 6 induced the significant apoptotic signals (Fig. 7f).
Conclusions
In this study, we have designed and constructed a combinational EDT and CDT platform based on Fe3O4@Pt NPs for the first time. The particles do not only catalyze H2O2 to generate ·OH at acidic TME by Fenton reaction, but also show intrinsic ROS generation properties based on the catalytic reaction of Pt NPs triggered by the electric field. In particular, Fe3O4@Pt NPs can effectively deplete intracellular GSH by releasing Fe3+ in acidic TME, inhibiting the intrinsic ROS elimination of tumor cells. Both in vitro and in vivo studies show significant antitumor phenomena owing to the combinational effects of CDT, EDT and GSH depletion. This new therapeutic system appears to be highly effective in treating tumors with relatively large sizes (~ 400 mm3 at the initial state). This study has therefore offered a potential concept with distinctive functioning mechanism, and inspired future explorations in developing synergistic tumor therapeutic approaches with high efficacy.
Supplementary Information
Additional file 1: Figure S1. Scanning electron microscopy image of as-prepared Fe3O4 nanoparticles. Figure S2. X-Ray photoelectron spectrum of Fe3O4 nanoparticles. Figure S3. Size distribution of Fe3O4@Pt NPs. Figure S4. Zeta potentials of Fe3O4@Pt NPs during the synthesis and surface modification by PEG. Figure S5. (a) Optical photographs of Fe3O4@Pt nanoparticles dispersed in water, phosphate buffered saline (PBS), RPMI-1640 cell culture and fetal bovine serum (FBS) for 12 h. (b) Size distribution of Fe3O4@Pt nanoparticles dispersed in water, PBS and RPMI-1640. Figure S6. UV–vis absorption spectra of MB solutions degraded under different conditions ([Fe3O4]: 200 µg/mL, AC output current: 10 mA,10 mHz, [MB]: 2.5 × 10⁻⁵ M). Figure S7. UV–vis absorption spectra of MB solutions degraded by Fe3O4@Pt with different concentrations (AC output current: 10 mA,10 mHz, [MB]: 2.5 × 10⁻⁵ M). Figure S8. (a) UV–vis absorption spectra of MB solutions degraded by Pt NPs under the 10 mHz AC field in the presence and absence of H2O2([Pt]: 200 µg/mL, output current: 10 mA, [MB]: 2.5 × 10⁻⁵ M, [H2O2]: 100 µM). (c) Degradation rates of MB in the presence of Pt NPs with or without H2O2. Figure S9. (a) UV–vis absorbance spectra of 1,10-phenanthroline solutions with different Fe2+ concentrations, and (b) the relationship between the optical absorbance at 511 nm and the concentration of 1,10-phenanthroline solutions. Figure S10. Relative intracellular GSH in 4T1 cells with different treatments. ([Fe3O4]: 200 µg/mL; electric field: square wave AC field; output current: 5 mA, time: 10 min). Figure S11. Average body weights of mice after different treatments.
Acknowledgements
Not applicable.
Authors’ contributions
TC designed the research. TC developed methods, analyzed data, organized figures, wrote the manuscript, and performed most of the experiments. QC participated in the animal experiments. ML drew the scheme. GH and XL reviewed and revised the manuscript. All authors read and approved the final manuscript.
Funding
This work was financially supported by National Natural Science Foundation of China (51672247), Provincial Key research program of Zhejiang Province (2020C04005), ‘111’ Program funded by Education Ministry of China and Sate Bureau of Foreign Experts Affairs (B16043) and Fundamental Research Funds for the Central Universities.
Availability of data and materials
All data generated or analyzed during this study are included in this published article and its additional information files.
Declarations
Ethics approval and consent to participate
All animal experiments were approved by the Animal Ethics Committee of Zhejiang University.
Consent for publication
All authors agreed to publish this manuscript.
Competing interests
The authors declare that they have no competing interests.
Footnotes
Publisher's Note
Springer Nature remains neutral with regard to jurisdictional claims in published maps and institutional affiliations.
Tong Chen and Qiang Chu comtributed equally to this work
References
- 1.Barry H. Antioxidants in human health and disease. Anna Rev Nutr. 1996;16:33–50. doi: 10.1146/annurev.nu.16.070196.000341. [DOI] [PubMed] [Google Scholar]
- 2.Wulf D. Free Radicals in the Physiological Control of cell function. Physiol Rev. 2002;82:47–95. doi: 10.1152/physrev.00018.2001. [DOI] [PubMed] [Google Scholar]
- 3.Toren F, Nikki J. Oxidants, oxidative stress and the biology of ageing. Nature. 2000;408:239–247. doi: 10.1038/35041687. [DOI] [PubMed] [Google Scholar]
- 4.Apel K, Hirt H. Reactive oxygen species: metabolism, oxidative stress, and signal transduction. Annu Rev Plant Biol. 2004;55:373–399. doi: 10.1146/annurev.arplant.55.031903.141701. [DOI] [PubMed] [Google Scholar]
- 5.Trachootham D, Alexandre J, Huang P. Targeting cancer cells by ROS-mediated mechanisms: a radical therapeutic approach. Nat Rev Drug Discov. 2009;8(7):579–591. doi: 10.1038/nrd2803. [DOI] [PubMed] [Google Scholar]
- 6.Wu M, Ding Y, Li L. Recent progress in the augmentation of reactive species with nanoplatforms for cancer therapy. Nanoscale. 2019;11(42):19658–19683. doi: 10.1039/C9NR06651A. [DOI] [PubMed] [Google Scholar]
- 7.Yang B, Chen Y, Shi J. Nanocatalytic medicine. Adv Mater. 2019;31(39):1901778. doi: 10.1002/adma.201901778. [DOI] [PubMed] [Google Scholar]
- 8.Ozben T. Oxidative stress and apoptosis: impact on cancer therapy. J Pharm Sci. 2007;96(9):2181–2196. doi: 10.1002/jps.20874. [DOI] [PubMed] [Google Scholar]
- 9.Zhou Z, Song J, Nie L, Chen X. Reactive oxygen species generating systems meeting challenges of photodynamic cancer therapy. Chem Soc Rev. 2016;45(23):6597–6626. doi: 10.1039/C6CS00271D. [DOI] [PMC free article] [PubMed] [Google Scholar]
- 10.Nogueira V, Hay N. Molecular pathways: reactive oxygen species homeostasis in cancer cells and implications for cancer therapy. Clin Cancer Res. 2013;19(16):4309–4314. doi: 10.1158/1078-0432.CCR-12-1424. [DOI] [PMC free article] [PubMed] [Google Scholar]
- 11.Gu T, Wang Y, Lu Y, Cheng L, Feng L, Zhang H, Li X, Han G, Liu Z. Platinum nanoparticles to enable electrodynamic therapy for effective cancer treatment. Adv Mater. 2019;31(14):1806803. doi: 10.1002/adma.201806803. [DOI] [PubMed] [Google Scholar]
- 12.Lu Z, Gao J, Fang C, Zhou Y, Li X, Han G. Porous Pt nanospheres incorporated with GOx to enable synergistic oxygen-inductive starvation/electrodynamic tumor therapy. Adv Sci. 2020;7(17):2001223. doi: 10.1002/advs.202001223. [DOI] [PMC free article] [PubMed] [Google Scholar]
- 13.Chen T, Gu T, Cheng L, Li X, Han G, Liu Z. Porous Pt nanoparticles loaded with doxorubicin to enable synergistic chemo-/electrodynamic therapy. Biomaterials. 2020;255:120202. doi: 10.1016/j.biomaterials.2020.120202. [DOI] [PubMed] [Google Scholar]
- 14.Gu T, Chen T, Cheng L, Li X, Han G, Liu Z. Mesoporous silica decorated with platinum nanoparticles for drug delivery and synergistic electrodynamic-chemotherapy. Nano Res. 2020;13(8):2209–2215. doi: 10.1007/s12274-020-2838-1. [DOI] [Google Scholar]
- 15.Hanahan D, Weinberg RA. Hallmarks of cancer: the next generation. Cell. 2011;144(5):646–674. doi: 10.1016/j.cell.2011.02.013. [DOI] [PubMed] [Google Scholar]
- 16.Liotta L, Kohn E. The microenvironment of the tumour-host interface. Nature. 2001;411(6835):375–379. doi: 10.1038/35077241. [DOI] [PubMed] [Google Scholar]
- 17.Huang Y, Jiang Y, Xiao Z, Shen Y, Huang L, Xu X, Wei G, Xu C, Zhao C. Three birds with one stone: a ferric pyrophosphate based nanoagent for synergetic NIR-triggered photo/chemodynamic therapy with glutathione depletion. Chem Eng J. 2020;380:122369. doi: 10.1016/j.cej.2019.122369. [DOI] [Google Scholar]
- 18.Dong Z, Feng L, Chao Y, Hao Y, Chen M, Gong F, Han X, Zhang R, Cheng L, Liu Z. Amplification of tumor oxidative stresses with liposomal fenton catalyst and glutathione inhibitor for enhanced cancer chemotherapy and radiotherapy. Nano Lett. 2019;19(2):805–815. doi: 10.1021/acs.nanolett.8b03905. [DOI] [PubMed] [Google Scholar]
- 19.Nie X, Xia L, Wang H, Chen G, Wu B, Zeng T, Hong C, Wang L, You Y. Photothermal therapy nanomaterials boosting transformation of Fe(III) into Fe(II) in tumor cells for highly improving chemodynamic therapy. ACS Appl Mater Interfaces. 2019;11(35):31735–31742. doi: 10.1021/acsami.9b11291. [DOI] [PubMed] [Google Scholar]
- 20.Du T, Zhao C, Rehman F, Lai L, Li X, Sun Y, Luo S, Jiang H, Gu N, Selke M, Wang X. In situ multimodality imaging of cancerous cells based on a selective performance of Fe2+-adsorbed zeolitic imidazolate framework-8. Adv Funct Mater. 2017;27(5):1603926. doi: 10.1002/adfm.201603926. [DOI] [Google Scholar]
- 21.Wang S, Li F, Qiao R, Hu X, Liao H, Chen L, Wu J, Wu H, Zhao M, Liu J, Chen R, Ma X, Kim D, Sun J, Davis T, Chen C, Tian J, Hyeon T, Ling D. Arginine-rich manganese silicate nanobubbles as a ferroptosis-inducing agent for tumor-targeted theranostics. ACS Nano. 2018;12(12):12380–12392. doi: 10.1021/acsnano.8b06399. [DOI] [PubMed] [Google Scholar]
- 22.Zhong X, Wang X, Cheng L, Tang Y, Zhan G, Gong F, Zhang R, Hu J, Liu Z, Yang X. GSH-depleted PtCu3 nanocages for chemodynamic—enhanced sonodynamic cancer therapy. Adv Funct Mater. 2019;30(4):1907954. doi: 10.1002/adfm.201907954. [DOI] [Google Scholar]
- 23.Gong F, Cheng L, Yang N, Betzer O, Feng L, Zhou Q, Li Y, Chen R, Popovtzer R, Liu Z. Ultrasmall oxygen-deficient bimetallic oxide MnWOX nanoparticles for depletion of endogenous GSH and enhanced sonodynamic cancer therapy. Adv Mater. 2019;31(23):1900730. doi: 10.1002/adma.201900730. [DOI] [PubMed] [Google Scholar]
- 24.Gong F, Cheng L, Yang N, Jin Q, Tian L, Wang M, Li Y, Liu Z. Bimetallic oxide MnMoOx nanorods for in vivo photoacoustic imaging of GSH and tumor-specific photothermal therapy. Nano Lett. 2018;18(9):6037–6044. doi: 10.1021/acs.nanolett.8b02933. [DOI] [PubMed] [Google Scholar]
- 25.Ju E, Dong K, Chen Z, Liu Z, Liu C, Huang Y, Wang Z, Pu F, Ren J, Qu X. Copper(II)-graphitic carbon nitride triggered synergy: improved ROS generation and reduced glutathione levels for enhanced photodynamic therapy. Angew Chem Int Ed. 2016;55(38):11467–11471. doi: 10.1002/anie.201605509. [DOI] [PubMed] [Google Scholar]
- 26.Liu C, Wang D, Zhang S, Cheng Y, Yang F, Xing Y, Xu T, Dong T, Zhang X. Biodegradable biomimic copper/manganese silicate nanospheres for chemodynamic/photodynamic synergistic therapy with simultaneous glutathione depletion and hypoxia relief. ACS Nano. 2019;13(4):4267–4277. doi: 10.1021/acsnano.8b09387. [DOI] [PubMed] [Google Scholar]
- 27.Karakoti A, Singh S, Dowding J, Seal S, Self W. Redox-active radical scavenging nanomaterials. Chem Soc Rev. 2010;39(11):4422–4432. doi: 10.1039/b919677n. [DOI] [PubMed] [Google Scholar]
- 28.Yin S, Song G, Yang Y, Zhao Y, Wang P, Zhu L, Yin X, Zhang X. Persistent Regulation of tumor microenvironment via circulating catalysis of MnFe2O4@metal-organic frameworks for enhanced photodynamic therapy. Adv Funct Mater. 2019;29(25):1901417. doi: 10.1002/adfm.201901417. [DOI] [Google Scholar]
- 29.Qian X, Zhang J, Gu Z, Chen Y. Nanocatalysts-augmented Fenton chemical reaction for nanocatalytic tumor therapy. Biomaterials. 2019;211:1–13. doi: 10.1016/j.biomaterials.2019.04.023. [DOI] [PubMed] [Google Scholar]
- 30.Tang Z, Liu Y, He M, Bu W. Chemodynamic therapy: tumour microenvironment-mediated fenton and fenton-like reactions. Angew Chem Int Ed. 2019;58(4):946–956. doi: 10.1002/anie.201805664. [DOI] [PubMed] [Google Scholar]
- 31.Dong Z, Yang Z, Hao Y, Feng L. Fabrication of H2O2-driven nanoreactors for innovative cancer treatments. Nanoscale. 2019;11(35):16164–16186. doi: 10.1039/C9NR04418C. [DOI] [PubMed] [Google Scholar]
- 32.Shen J, Rees T, Zhou Z, Yang S, Ji L, Chao H. A mitochondria-targeting magnetothermogenic nanozyme for magnet-induced synergistic cancer therapy. Biomaterials. 2020;251:120079. doi: 10.1016/j.biomaterials.2020.120079. [DOI] [PubMed] [Google Scholar]
- 33.Xiao J, Zhang G, Xue R, Chen H, Wang H, Tian G, Wang B, Yang C, Bai G, Zhang Z, Yang H, Zhong K, Zou D, Wu Z. A pH-responsive platform combining chemodynamic therapy with limotherapy for simultaneous bioimaging and synergistic cancer therapy. Biomaterials. 2019;216:119254. doi: 10.1016/j.biomaterials.2019.119254. [DOI] [PubMed] [Google Scholar]
- 34.Zhang K, Meng X, Yang Z, Dong H, Zhang X. Enhanced cancer therapy by hypoxia-responsive copper metal-organic frameworks nanosystem. Biomaterials. 2020;258:120278. doi: 10.1016/j.biomaterials.2020.120278. [DOI] [PubMed] [Google Scholar]
- 35.Dong Z, Hao Y, Li Q, Yang Z, Zhu Y, Liu Z, Feng L. Metal-polyphenol-network coated CaCO3 as pH-responsive nanocarriers to enable effective intratumoral penetration and reversal of multidrug resistance for augmented cancer treatments. Nano Res. 2020;13(11):3057–3067. doi: 10.1007/s12274-020-2972-9. [DOI] [Google Scholar]
- 36.Li Z, Wang C, Cheng L, Gong H, Yin S, Gong Q, Li Y, Liu Z. PEG-functionalized iron oxide nanoclusters loaded with chlorin e6 for targeted, NIR light induced, photodynamic therapy. Biomaterials. 2013;34(36):9160–9170. doi: 10.1016/j.biomaterials.2013.08.041. [DOI] [PubMed] [Google Scholar]
- 37.Lee J, You K, Park C. Highly photoactive, low bandgap TiO2 nanoparticles wrapped by graphene. Adv Mater. 2012;24(8):1084–1088. doi: 10.1002/adma.201104110. [DOI] [PubMed] [Google Scholar]
- 38.Wilhelm S, Tavares A, Dai Q, Ohta S, Audet J, Dvorak H, Chan W. Analysis of nanoparticle delivery to tumours. Nat Rev Mater. 2016;1(5):16014. doi: 10.1038/natrevmats.2016.14. [DOI] [Google Scholar]
Associated Data
This section collects any data citations, data availability statements, or supplementary materials included in this article.
Supplementary Materials
Additional file 1: Figure S1. Scanning electron microscopy image of as-prepared Fe3O4 nanoparticles. Figure S2. X-Ray photoelectron spectrum of Fe3O4 nanoparticles. Figure S3. Size distribution of Fe3O4@Pt NPs. Figure S4. Zeta potentials of Fe3O4@Pt NPs during the synthesis and surface modification by PEG. Figure S5. (a) Optical photographs of Fe3O4@Pt nanoparticles dispersed in water, phosphate buffered saline (PBS), RPMI-1640 cell culture and fetal bovine serum (FBS) for 12 h. (b) Size distribution of Fe3O4@Pt nanoparticles dispersed in water, PBS and RPMI-1640. Figure S6. UV–vis absorption spectra of MB solutions degraded under different conditions ([Fe3O4]: 200 µg/mL, AC output current: 10 mA,10 mHz, [MB]: 2.5 × 10⁻⁵ M). Figure S7. UV–vis absorption spectra of MB solutions degraded by Fe3O4@Pt with different concentrations (AC output current: 10 mA,10 mHz, [MB]: 2.5 × 10⁻⁵ M). Figure S8. (a) UV–vis absorption spectra of MB solutions degraded by Pt NPs under the 10 mHz AC field in the presence and absence of H2O2([Pt]: 200 µg/mL, output current: 10 mA, [MB]: 2.5 × 10⁻⁵ M, [H2O2]: 100 µM). (c) Degradation rates of MB in the presence of Pt NPs with or without H2O2. Figure S9. (a) UV–vis absorbance spectra of 1,10-phenanthroline solutions with different Fe2+ concentrations, and (b) the relationship between the optical absorbance at 511 nm and the concentration of 1,10-phenanthroline solutions. Figure S10. Relative intracellular GSH in 4T1 cells with different treatments. ([Fe3O4]: 200 µg/mL; electric field: square wave AC field; output current: 5 mA, time: 10 min). Figure S11. Average body weights of mice after different treatments.
Data Availability Statement
All data generated or analyzed during this study are included in this published article and its additional information files.


