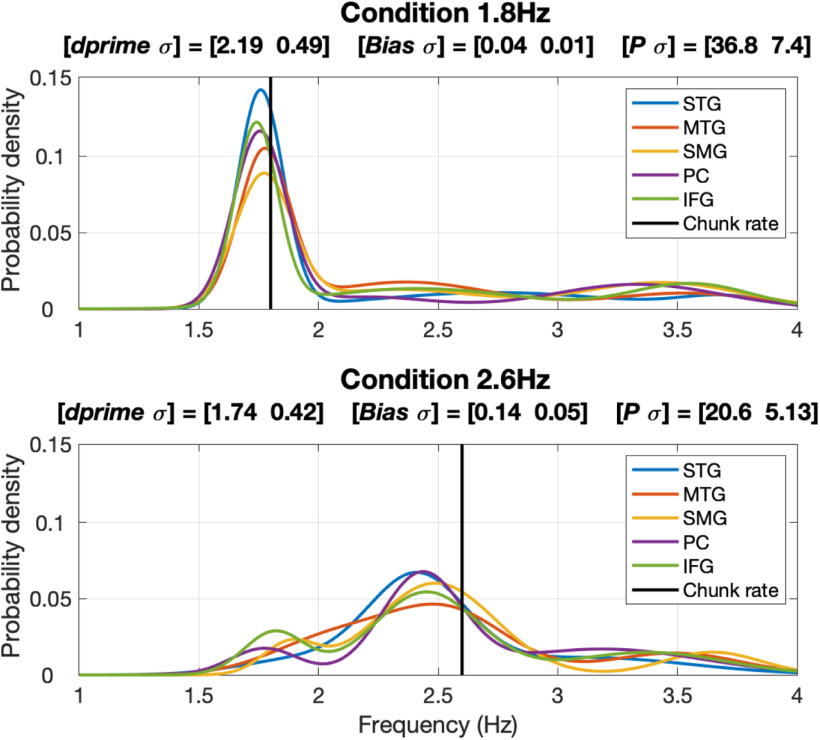
Figure 8.
Correspondence between behavioral data and electrophysiological data. Shown are the third order Gaussian Mixture Models (GMMs) of correct responses in the left hemisphere. Unlike Figure 6A, which shows the periodicity density function (PDF) scaled to P (the percentage of datapoints inside the frequency range of interest with respect to the total number of datapoints), shown here are the actual probability densities (with the ∫p(x)dx = 1). The title of each panel shows three measures: (1) [dprime σ], the behavioral performance; (2) [Bias σ], the average of the absolute difference between the mean of the prominent Gaussian component of the GMM and the driving acoustic chunk rate, and variance across the ROIs; and (3) [p σ], the average p value (defined in Fig. 6) and variance across the regions of interest (ROIs). Note the tightness of the PDFs in the 1.8-Hz condition compared with the pseudo-uniform shape of the PDFs in the 2.6-Hz condition, and the correlation between the decrease in dprime and the increase in Bias and the decrease in p.

