

Abstract
Background
Comprehensive treatment and clinical management are central to improving outcomes for people living with HIV (PLHIV). We explored trends in HIV clinical care, treatment outcomes, and chronic kidney disease (CKD) and diabetes monitoring.
Methods
We included patients ≥18 years in care at ten clinical sites in eight Asian countries. Proportions of patients on antiretroviral therapy (ART), with annual viral load, and with viral load suppression (VLS, <1000 copies/mL) were estimated by year for 2011–2016, stratified by country income level (lower-middle income [LMIC] and high-income countries [HIC]). Among those on ART in 2016 we evaluated factors associated with annual CKD and diabetes monitoring.
Results
Among 31,346 patients (67% male), the proportions of patients on ART (median ART initiation year 2011, IQR 2007–2013), with annual viral load and VLS had substantially increased by 2016 (to 94%, 42%, and 92%, respectively, in LMIC and 95%, 97%, and 93%, respectively, in HIC) with the larger increases over time seen in LMIC. Among those on ART in 2016, monitoring proportions in LMIC were 53% for CKD and 26% for diabetes compared to 83% and 59%, respectively, in HIC. Overall, a decreased odds of monitoring was observed for male gender, heterosexual HIV exposure, no viral load, and LMIC. Diabetes monitoring was also decreased in those with viral failure.
Conclusion
Our findings highlight suboptimal monitoring of viral load, CKD and diabetes in PLHIV in Asia. There is a need for affordable and scalable monitoring options to improve the joint care for HIV and non-communicable diseases.
Keywords: HIV, ART uptake, viral load suppression, kidney disease, diabetes, laboratory monitoring
Introduction
Goals in the fight against HIV have transformed over time in line with the changing epidemic and improved treatment options. Following the scale up of effective antiretroviral therapy (ART), the current focus is on ending AIDS as a public health threat [1], which entails reducing the global HIV incidence to 200,000 or less new cases a year [2]. Landmark studies have shown that ART initiation in earlier stages of HIV infection, before CD4 counts have severely deteriorated, is associated with decreased HIV-related morbidity and mortality [3–5] and that viral load suppression (VLS) through effective ART prevents HIV transmission to others [6, 7]. Ongoing virologic failure (VF) can contribute to emerging drug resistance, thereby complicating treatment options at both an individual and public health level [8, 9]. Following this evidence, key efforts are aimed at improving linkage and retention in care so that people living with HIV (PLHIV) can be started on ART as soon as possible, and achieve sustained VLS [1, 2].
The HIV care cascade has gained attention to quantify population level engagement in care and to identify gaps in care that may contribute to unfavourable health outcomes. The care cascade shows a variety of steps typically starting with the total estimated number of PLHIV in a region and with subsequent steps representing proportions of PLHIV diagnosed, linked to care, started on ART, retained in care, tested on viral load, and having achieved VLS. Virally suppressed PLHIV may still experience a range of other poor health outcomes, including non-communicable diseases (NCDs), such as chronic kidney disease (CKD) and diabetes [10, 11]. In line with this, it has been argued that VLS should not be the ultimate goal of HIV care [12] and the HIV treatment cascade should be extended to include monitoring and management of NCDs [13].
Latest HIV treatment guidelines recommend screening PLHIV for serum creatinine (S-Cr), a marker for kidney function, and blood glucose, a marker of diabetes, before ART initiation and at least annually thereafter [14]. Furthermore, the guidelines suggest assessing viral load every 3 to 4 months, although less frequent monitoring can be considered if patients have sustained VLS for two or more years [14]. Adequate laboratory monitoring of PLHIV may be particularly challenging in regions with overburdened and under resourced health systems, such as the Asia Pacific [15]. Improved knowledge on HIV-related care, including monitoring practices of viral loads and NCDs, is required to advance overall health outcomes in PLHIV. The current study investigated the extended treatment cascade in The TREAT Asia HIV Observational Database Low Intensity TransfEr (TAHOD-LITE), a multi-country clinical cohort of PLHIV in Asia which comprises treatment data on all patients in care at participating sites. We assessed proportions on ART, with annual viral load monitoring and VLS in those attending care between 2011–2016 in this cohort. We further investigated S-Cr and fasting plasma glucose (FPG) monitoring among PLHIV in our cohort in 2016, and their prevalence of CKD and diabetes.
Methods
TAHOD-LITE is a sub-study of the TREAT Asia HIV Observational Database (TAHOD), a prospective observational cohort of the International epidemiology Databases to Evaluate AIDS (IeDEA). TAHOD and TAHOD-LITE have been described in more detail elsewhere [16, 17]. The 2017 TAHOD-LITE data transfer collected data on demographics, hepatitis serology, ART history, HIV-related laboratory results, S-Cr, and FPG from all PLHIV aged ≥18 years under care at clinical sites in Cambodia (1 site), Hong Kong (1 site), India (2 sites), Indonesia (1 site), Singapore (1 site), South Korea (1 site), Taiwan (1 site), and Vietnam (2 sites). Institutional Review Board approvals were obtained at all participating sites, the data management and analysis centre (The Kirby Institute, UNSW Sydney, Australia), and the coordinating centre (TREAT Asia/amfAR, Bangkok, Thailand).
For the current study, we included adults (aged ≥18 years at enrolment) who received care at one of the participating sites anytime between January 2011 and December 2016. This timeframe was decided on as 2010 World Health Organisation (WHO) guidelines suggested phasing in of viral load testing and a scale-up of viral load testing was thus expected from 2011 onwards [18]. Proportions of patients on ART, with annual viral load monitoring, and VLS were estimated from the 1st of January to the 31st of December for each year. We excluded patients who attended a site only once and were immediately transferred out for their care at a regional clinic. For evaluation of S-Cr and FPG monitoring the study population was restricted to those patients who had attended the clinical site in 2016. To prevent underestimation of annual monitoring, we assessed laboratory testing in the last thirteen months of clinical follow-up, accounting for clinical appointments falling just outside the annual time frame or potential missed visits. We thus excluded patients who had last visited the clinic before 2016 and those who had been retained in clinical care for less than thirteen months.
Study definitions
Patients were considered to be in care for each calendar year after enrolment if there was a lack of documented death, or loss to follow up (LTFU, defined as not being seen at the clinic >12 months after their last clinic visit or reported as LTFU by clinical site). In case of death or LTFU patients were considered in care for the year in which their last clinic visit took place, but not the year thereafter. Patients were considered on ART if they were started on any regimen of ART, regardless of the number or type of antiretroviral drugs prescribed, and clinic data did not reveal discontinuation of ART. Patients were considered to have been monitored for treatment failure, kidney function and diabetes if they had received at least one viral load test, S-Cr test or FPG test during follow-up. In line with WHO guidelines [19], VLS was defined as a viral load of <1000 copies/mL. If patients had a viral load ≥1000 copies/mL, they were considered to have VF. CKD was defined as having an estimated glomerular filtration rate (eGFR) of <60 mL/min/1.73m2 based on S-Cr assessment and as calculated by the CKD-EPI equation [20]. Diabetes was defined as having a FPG ≥126 mg/dL, in accordance with guidelines of the American Diabetes Association [21].
ART use, viral load monitoring and VLS
Proportions of patients in care, on ART, with evidence of viral load monitoring and with VLS were presented by year for the period 2011 to 2016. Kaplan-Meier (K-M) curves were used to plot time to ART initiation for all newly enrolled patients who were ART naïve at baseline and were compared across calendar year of enrolment using log-rank test. In addition, K-M estimates with 95% confidence intervals (95%CI) were used to evaluate the probability of these patients starting ART by calendar year of enrolment. Proportions, K-M curves and K-M estimates were all stratified by country-income category (lower-middle-income countries [LMIC] versus high-income countries [HIC]).
Monitoring for kidney function and diabetes
We presented proportions with 95%CI of annual S-Cr and FPG monitoring and the prevalence of CKD and diabetes in those who had attended care in 2016, stratified by country-income category. Furthermore, we fit multivariable logistic regression models to estimate the associations between several covariates and having received annual monitoring for S-Cr and for FPG. Both models incorporated the following a priori chosen variables: sex, age (≤40, 41–50, or >50), HIV exposure category (i.e. through heterosexual contact, male-to-male sexual contact, through injecting drug use, or other/unknown), pre-ART CD4 count (<200, 200–349, ≥350 cells/µL, or missing), by viral load status (VLS, VF, or viral load not tested), and by country income category (LMIC or HIC). Associations were considered statistically significant at P <0.05.
Data management and statistical analyses were performed using SAS software version 9.4 (SAS Institute Inc., Cary, NC, USA) and Stata software version 14.1 (StataCorp, College Station, TX, USA).
Results
Between 2011 and 2016, a total of 32,734 patients were in care at the participating sites. We excluded 1388 patients who were documented as clinic transfers. Characteristics of the remaining 31,346 patients included in this study are outlined in Table 1. The majority of patients attended clinics in India (61%), followed by Singapore (9%), Cambodia (8%), Vietnam (7%), Indonesia (6%), Hong Kong (4%), Taiwan (2%), and South Korea (2%). Median age at clinic enrolment was 36 (IQR 30–43) years and 20,853 (67%) patients were male. Median pre-ART HIV viral load was log10 5.0 (IQR 4.5–5.6) copies/mL and median pre-ART CD4 count was 168 (IQR 63–280) cells/µL. Median ART initiation year was 2011 (IQR 2007–2013).
Table 1.
Characteristics of patients in care between 2011 and 2016 (N=31,346)
| N (%) | |
|---|---|
| Sex | |
| Female | 10493 (33.5) |
| Male | 20853 (66.5) |
| Age group at enrolment (years) | |
| ≤40 | 21355 (68.1) |
| 41–50 | 6742 (21.5) |
| >50 | 3249 (10.4) |
| HIV exposure category | |
| Heterosexual | 17698 (56.5) |
| MSM | 3226 (10.3) |
| IDU | 998 (3.2) |
| Other/unknown | 9424 (30.1) |
| Pre-ART HIV viral load (copies/mL) | |
| <400 | 209 (0.7) |
| 400–999 | 71 (0.2) |
| ≥1000 | 6094 (19.4) |
| Missing/not tested | 24972 (79.7) |
| Pre-ART CD4 count (cells/µL) | |
| ≥350 | 2892 (9.2) |
| 200–349 | 5665 (18.1) |
| <200 | 11620 (37.1) |
| Missing/not tested | 11169 (35.6) |
| ART initiation year | |
| ≤2010 | 13762 (43.9) |
| 2011 | 3150 (10) |
| 2012 | 2770 (8.8) |
| 2013 | 2520 (8) |
| 2014 | 1966 (6.3) |
| 2015 | 1794 (5.7) |
| 2016 | 1622 (5.2) |
| No ART started | 3762 (12) |
| HBV coinfection ^ | |
| No | 16804 (53.6) |
| Yes | 1402 (4.5) |
| Missing/not tested | 13140 (41.9) |
| HCV coinfection ^ | |
| No | 11643 (37.1) |
| Yes | 1433 (4.6) |
| Missing/not tested | 18270 (58.3) |
| Country income category | |
| Lower-middle | 25851 (89.0) |
| High | 5495 (11.0) |
MSM, men who have sex with men; IDU, injecting drug use; ART, antiretroviral therapy; HBV, hepatitis B; HCV, hepatitis C.
HBV and HCV coinfection based on ever having had positive HBsAg and Anti-HCV test, respectively.
ART use, viral load monitoring and VLS
Figure 1 shows the number of patients in care and the proportions of those on ART, with evidence of viral load monitoring, and with VLS. The total number of patients in care varied: 18,387 in 2011, 19,586 in 2012, 20,263 in 2013, 20,566 in 2014, 20,150 in 2015, and 19,580 in 2016, with the reduction in patient numbers after 2014 mainly caused by a decreasing rate of new enrolment in this period. For each year, the proportions of patients on ART, with evidence of viral load monitoring and with VLS were higher in HIC, however, the increase over time was substantially higher in LMIC. In LMIC, the proportion of patients in care who were on ART increased from 78% in 2011 to 94% in 2016, whereas in HIC, the proportion increased from 82% in 2011 to 96% in 2016. Although viral load monitoring among those on ART increased over time regardless of country income category, in 2016, 42% of patients had received a viral load test in LMIC (increased from 13% in 2011) versus 97% in HIC (increased from 90%). Of those who had received a viral load test in 2016, 92% had achieved VLS in LMIC (increased from 67% in 2011), while 93% had achieved VLS in HIC (increased from 89% in 2011). Among patients who did not receive a viral load test in a specific year, up to 19% became LTFU and around 1% died within that same year.
Figure 1.
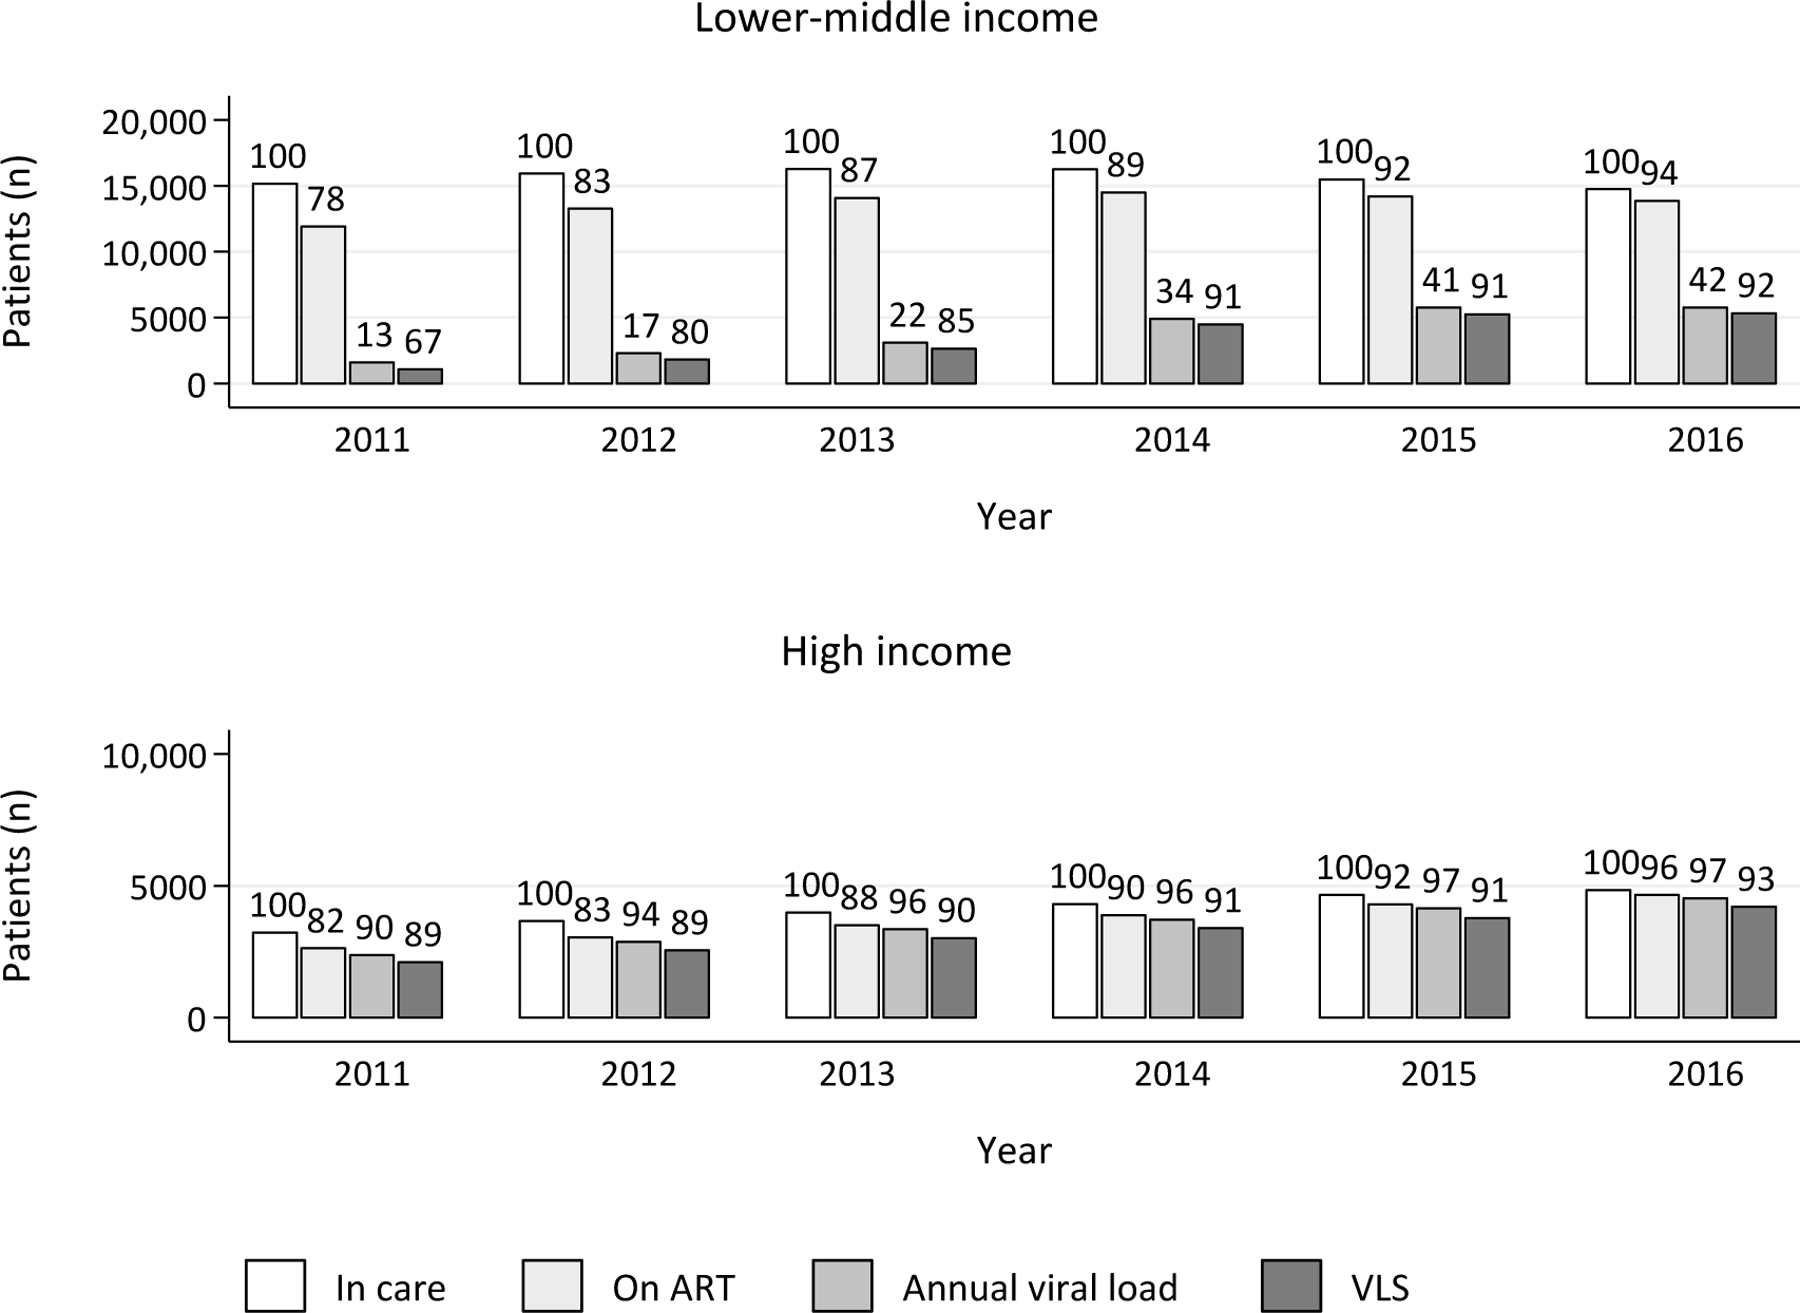
Patients in care, on ART, with annual viral load and viral load suppression from 2011 to 2016, by country income category
Note: Numbers above bars represent percentage of the previous column.
ART, antiretroviral therapy; VLS, viral load suppression (<1000 copies/mL).
Between 2011–2016, 10,382 patients were newly enrolled into care, of whom 8357 (80%) in LMIC and 2025 (20%) in HIC. The K-M curves show differences in time to ART initiation by year of clinic enrolment (log-rank p <0.001), where the curve was lowest for enrolment in 2015, in LMIC as well as HIC (Figure 2). According to K-M estimates, the probability of ART initiation within one month after enrolment increased over time. In LMIC, the probability increased from 45% (95%CI 43–48%) in 2011 to 63% (95%CI 60–66%) in 2015, whereas in HIC, the probability increased 42% (95%CI 38–47%) in 2011 to 68% (95%CI 63–72%) in 2015.
Figure 2.

Kaplan Meier curves of time to ART initiation in lower-middle-income and high-income countries, by year of enrolment
* First column represents all patients enrolled, some of whom started ART on the same day.
Monitoring for kidney function and diabetes
S-Cr and FPG monitoring was assessed in the 16,641 patients who were on ART in 2016 and who had retained in care for at least thirteen months. In LMIC, S-Cr and FPG were tested in 53% and 26% of the patients, respectively, while in HIC, the proportion of patients tested was substantially higher at 83% and 59%, respectively. The prevalence of CKD and diabetes in the patients who had been monitored for these conditions was 14% and 36%, respectively, in LMIC, compared to 8% and 17%, respectively, in HIC (Figure 3).
Figure 3.
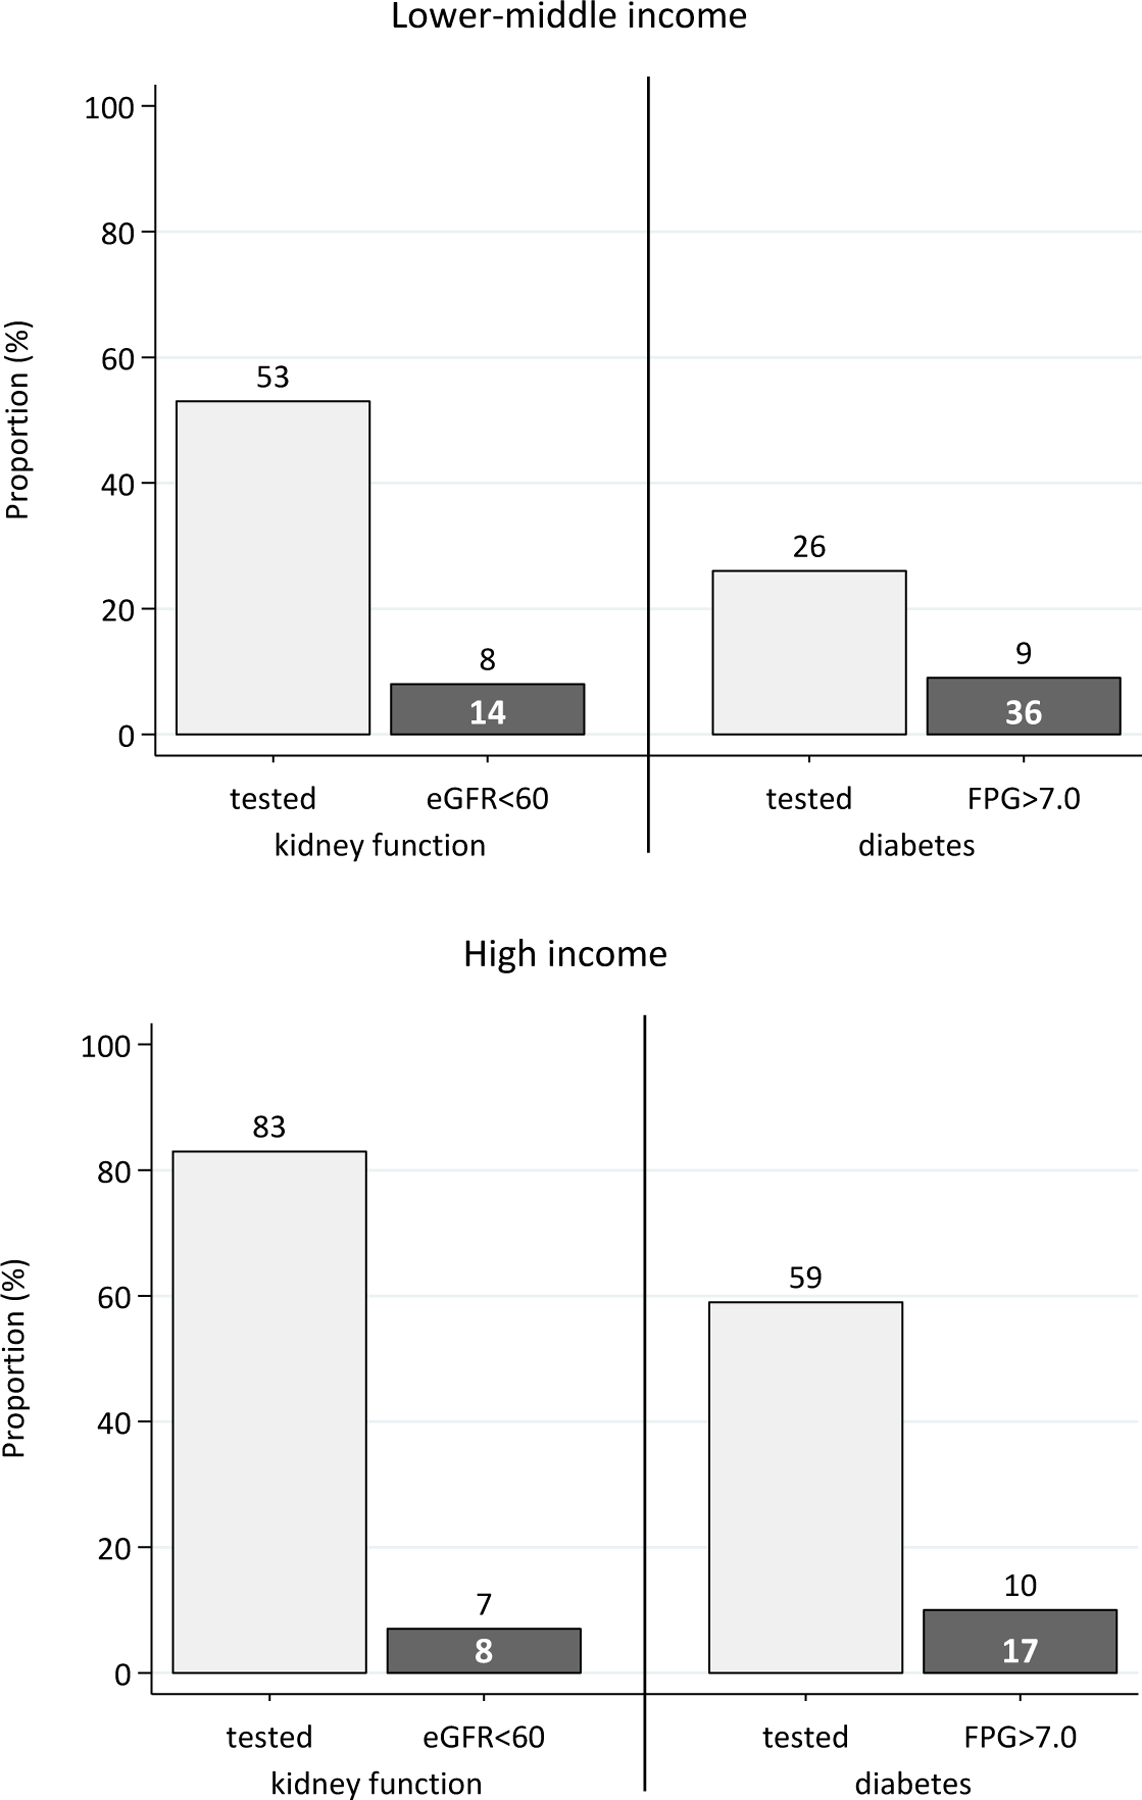
Kidney function and diabetes monitoring in patients in care in 2016, by country income.
Note: white numbers within bars represent percentage of previous column (i.e. prevalence in those tested). eGFR=estimated glomerular filtration rate (in mg/min/1.73m2); FPG=fasting plasma glucose (in mg/dL).
Table 2 shows the multivariable regression model for factors associated with S-Cr monitoring and with FPG monitoring. An increased odds of S-Cr monitoring was observed in those with HIV exposure through injecting drug use (odds ratio [OR] 6.15, 95%CI 5.01–7.54, compared to heterosexual HIV exposure) and in HIC (OR 7.13, 95%CI 6.27–8.09, compared to LMIC), while S-Cr monitoring was decreased in males (OR 0.82, 95%CI 0.76–0.89), those with a pre-ART CD4 count of 200–349 (OR 0.86, 95%CI 0.76–0.98 compared to ≥350 cells/uL), and those who did not have a viral load assessment (OR 0.88, 95%CI 0.81–0.95, compared to those with VLS). FPG monitoring was increased in those with HIV exposure through injecting drug use (OR 4.05, 95%CI 3.41–4.81) and male-to-male sex (OR 1.66, 95%CI 1.47–1.87, compared to HIV exposure through heterosexual contact), and in HIC (OR 5.06, 95%CI 4.52–5.67). FPG monitoring was decreased in males (OR 0.82, 95%CI 0.75–0.89) and those who did not have a viral load assessment (OR 0.55, 95%CI 0.51–0.60) or those who had VF (OR 0.67, 95%CI 0.58–0.77 compared to those with VLS). The proportion of patients monitored for S-CR and FPG was higher in older age groups, however, age was not independently associated with either S-Cr or FPG monitoring.
Table 2.
Multivariate analysis of having received serum creatinine and fasting plasma glucose testing among patients on ART and in care in 2016
| Serum creatinine monitoring |
Fasting plasma glucose monitoring |
||||||||
|---|---|---|---|---|---|---|---|---|---|
| N | Proportion monitored (%) | OR | 95%CI | p-value | Proportion monitored (%) | OR | 95%CI | p-value | |
| Sex | |||||||||
| Female | 5951 | 55.5 | 1.00 | - | 27.7 | 1.00 | - | ||
| Male | 12572 | 63.3 | 0.82 | 0.76–0.89 | <0.001 | 37.7 | 0.82 | 0.75–0.89 | <0.001 |
| Age group (years) | 0.560 | 0.371 | |||||||
| ≤40 | 12576 | 59.1 | 1.00 | - | 31.9 | 1.00 | - | ||
| 41–50 | 3958 | 59.7 | 0.96 | 0.89–1.04 | 0.355 | 34.1 | 1.04 | 0.96–1.13 | 0.330 |
| >50 | 1989 | 66.4 | 0.96 | 0.87–1.05 | 0.380 | 40.7 | 1.07 | 0.97–1.17 | 0.181 |
| HIV exposure category | <0.001 | <0.001 | |||||||
| Heterosexual | 10804 | 46.0 | 1.00 | - | 22.1 | 1.00 | - | ||
| MSM | 2706 | 78.8 | 1.10 | 0.95–1.26 | 0.189 | 59.5 | 1.66 | 1.47–1.87 | <0.001 |
| IDU | 720 | 82.5 | 6.15 | 5.01–7.54 | <0.001 | 48.8 | 4.05 | 3.41–4.81 | <0.001 |
| Other/unknowna | 4293 | 83.2 | - | 47.6 | - | ||||
| Pre-ART CD4 count (cells/µL) | 0.022 | 0.060 | |||||||
| ≥350 | 8209 | 63.7 | 1.00 | - | 33.3 | 1.00 | - | ||
| 200–349 | 4026 | 55.9 | 0.86 | 0.76–0.98 | 0.018 | 29.0 | 0.89 | 0.79–1.01 | 0.076 |
| <200 | 2105 | 56.1 | 0.96 | 0.86–1.07 | 0.455 | 29.2 | 0.99 | 0.88–1.11 | 0.891 |
| Missing/not testeda | 4183 | 73.3 | - | 50.8 | - | ||||
| Viral load | 0.005 | <0.001 | |||||||
| VLS | 8890 | 68.4 | 1.00 | - | 45.6 | 1.00 | - | ||
| VF | 1138 | 67.1 | 0.90 | 0.78–1.04 | 0.167 | 37.7 | 0.67 | 0.58–0.77 | <0.001 |
| Missing/not tested | 8495 | 52.1 | 0.88 | 0.81–0.95 | 0.001 | 22.5 | 0.55 | 0.51–0.60 | <0.001 |
| Country income category | |||||||||
| Lower-middle | 13870 | 53.5 | 1.00 | - | 26.2 | 1.00 | - | ||
| High | 4653 | 82.6 | 7.13 | 6.27–8.09 | <0.001 | 59.3 | 5.06 | 4.52–5.67 | <0.001 |
Notes: Age is age in year of serum creatinine or fasting plasma glucose test;
P-values for test for heterogeneity excluded other/unknown or missing/not-tested values.
OR=odds ratio; 95%CI=95% confidence interval; MSM=men who have sex with men; IDU=injecting drug use; VF=virologic failure (≥ 1000 copies/mL); VLS=viral load suppression (<1000 copies/mL).
Discussion
Our findings demonstrated improvements in treatment uptake, viral load monitoring and viral load suppression in the TAHOD-LITE cohort. Specifically, we observed that ART uptake during the period of 2011 to 2016 had increased from 78% to 94% in LMIC and from 82% to 97% in HIC. Our findings also showed higher probabilities of ART initiation within one month after clinic enrolment in later calendar years, regardless of country income. The trends of improved ART uptake are most likely attributable to the global efforts to expand ART access and to the changing HIV treatment guidelines where ART eligibility criteria have been updated with recommendations to initiate ART in PLHIV who present to care with less advanced HIV disease [19]. Furthermore, among the patients in our cohort who were on ART and received annual viral load testing, proportions of VLS increased to over 90% in both LMIC and HIC. VLS in those who have evidence of viral load monitoring may not reflect VLS in all of those on ART and, thus, caution is warranted when making inferences about progress on population-level VLS. Still, increasing proportions of VLS are apparent in other data from the region as well [22] and it is possible that this development represents advancements in clinical management of HIV.
After PLHIV have started ART, viral load testing is considered the gold standard to detect treatment failure. Routine viral load monitoring has therefore been recommended by WHO and most national HIV treatment guidelines, however, implementation of routine viral load monitoring has proven challenging for the majority of LMIC [18, 19, 23]. A lack of routine viral load monitoring was observed in LMIC in our cohort as well, although the proportion of patients with viral load monitoring did triple from 2011 to 2016. Among those without a viral load test in any year, a relatively high proportion of patients were LTFU or died (up to 20% attrition in each observed calendar year), and it maybe that some of these patients would have received a viral load test had they remained in care. Regardless, viral load testing was less than annual in at least half of the patients from LMIC in our cohort, suggesting that routine viral load monitoring in this setting remained suboptimal even in the later years of the study period. Findings from Myanmar showed that viral load testing remained suboptimal after the national implementation of routine VL monitoring in 2017, with less than 60% of patients having received a viral load test up to two years later [24]. As far as we are aware, no other data has yet been published on routine viral load monitoring after 2016 in Asia.
Monitoring for kidney function and diabetes by means of S-Cr and FPG testing had not occurred on an annual basis for many of the patients in our cohort. Among those on ART in 2016, S-Cr testing was received by 53% in LMIC and 83% in HIC, while FPG testing was received by only 26% in LMIC and 59% in HIC, in their last year of follow-up. The higher proportion of S-Cr testing compared to FPG testing may be a reflection of HIV treatment guidelines as these recommend biannual testing of kidney function, but annual testing for diabetes [14]. Moreover, wide-scale testing of kidney function may be more common than diabetes testing because of the potential nephrotoxic effects of tenofovir disoproxil fumarate (TDF) [25]. TDF is widely prescribed in the Asian region as part of the preferred first-line regimen in countries with a high HIV burden [26], while it is also the treatment of choice for chronic hepatitis B [27].
Among the patients on ART who had received monitoring, the observed prevalence of CKD and diabetes was 14% and 36%, respectively, in LMIC compared to 8% and 17%, respectively, in HIC. As the proportion of patients who had received an annual S-Cr or FPG test was relatively low, especially in LMIC, it is possible that our findings are not an accurate estimate of the prevalence of CKD and diabetes in the study population. Still, regardless of country income, the prevalence we observed for these conditions is largely in the range of what has been found in other studies from the Asian region, which have reported CKD in 7% to 20% and diabetes in 5% to 27% of PLHIV [28–34]. Furthermore, the finding that the prevalence of both of these NCDs was higher in LMIC than in HIC reflects what has been observed in the general population [35, 36].
As our cohort is observational of nature, monitoring for kidney function and diabetes is according to local standards and may be based on clinicians’ decision to perform and patient willingness to receive testing. Our findings showed that monitoring was more common in females than males. Literature from the region suggests that men have poorer health seeking behaviour [37] and women may be more willing to receive monitoring for comorbidities. Furthermore, being monitored was more common in those with HIV exposure through male-to-male sexual contact or injecting drug use. Possibly, clinicians prioritise testing key populations as they may be suspected to exhibit risk behaviours, such as illicit drug use, which put them at greater risk of developing CKD and diabetes [38–40].
Clinicians may be more likely to perform routine monitoring of NCDs in patients who are considered stable in terms of HIV disease. In our cohort, S-Cr and FPG monitoring was increased in those with VLS compared to those with VF, although the association with S-Cr monitoring did not reach statistical significance. We also observed that proportions of S-Cr and FPG monitoring were higher in those with a pre-ART CD4 count>350 cells/mL compared to those with lower CD4 counts. However, multivariate analysis showed that only those with a pre-ART CD4 of 200–349 cells/mL, but not those with a pre-ART CD4 below 200 cells/mL, were significantly less likely to receive S-Cr monitoring than those who started ART with a higher CD4 count. Literature shows that low pre-ART CD4 counts and ongoing VF are associated with poor clinical outcomes [41, 42]. It is possible that in patients who present to care with more advanced HIV disease and those who have adherence issues or treatment failure, the priority lies in improving primary HIV outcomes, such as immunological recovery and preventing or managing AIDS-related morbidity [43].
Modelling studies have estimated a growing burden of comorbid NCDs in PLHIV [44, 45]. The low proportion of patients with S-Cr and FPG monitoring in our cohort can therefore be considered a cause for concern. It is likely that a lack of resources hinders routine testing for CKD and diabetes. Supporting this notion, our findings showed that patients in LMIC in our cohort were over five times less likely to have received S-CR and FPG testing. Furthermore, testing for diabetes and kidney function was decreased in those who had not received an annual viral load test, which may imply that S-Cr and FPG monitoring is more likely in patients who have access to viral load monitoring as well. Main barriers to routine laboratory monitoring in resource-limited settings include costs of testing and associated infrastructural needs [46, 47]. Such barriers need to be addressed in order to increase access to laboratory monitoring and thereby adequately prevent and manage NCDs in addition to assessing treatment failure in PLHIV on ART.
Over the last few years, an approach of differentiated care delivery has been promoted to increase appropriate routine laboratory monitoring and improve quality of care for PLHIV [48]. The rationale behind this approach is that differentiating care provision according to individual patient needs can reduce attrition and thereby improve health outcomes [48, 49]. For example, patients who have achieved sustained VLS are considered stable on ART and care for them may be tailored by minimising follow-up visits and providing them with ART prescriptions for longer periods of time. By contrast, patients who have been identified as having issues with adherence, treatment or overall health can continue to receive more intensive care with clinic contact as needed. Apart from having the potential to improve health outcomes in those attending care, this tailored approach can also save costs and enable more effectively allocation of resources, making it a particularly useful approach for resource-limited settings with strained health systems [50]. Although differentiated care is currently mainly used in the context of viral load monitoring, expanding this approach to integrate care for NCD may improve quality of care and health outcomes of a wider scope.
Our study has several limitations that should be noted. Our findings are from ten sites in eight countries and territories and may not be representative of HIV-related care in the wider Asia-Pacific region. Related to this, over 60% of patients in our cohort were from sites in India. It should be noted that with an estimated 2.1 million PLHIV, India has the largest population of PLHIV in Asia [51] and is considered the focal point of the HIV burden in the region. Furthermore, definitions for CKD and diabetes differ across literature. Various markers have been used to diagnose the conditions and often, diagnosis is confirmed by a second assessment taken at a later point in time [21, 28–30]. We based the prevalence of CKD and diabetes on single assessments of S-Cr and FPG, respectively, because of the low number of patients with multiple assessments a year. Furthermore, it may be possible that there are different methods of monitoring kidney function and diabetes, for example urine dipstick and Hb1Ac tests. However, other markers of kidney function and diabetes were not included for data collection as S-Cr and FPG were by far the most commonly available laboratory test results in the clinics participating in TAHOD-LITE.
In summary, our study illustrates an increase in the proportion of patients on ART and a decrease in time to treatment initiation across selected clinical sites in Asia between 2011 to 2016. Concerningly, we also found critical gaps in viral load testing and monitoring of S-Cr and FPG, especially in LMIC. Due to plateauing funding for HIV care in more recent years, it may be unrealistic to expect optimal monitoring practices, especially in clinics with limited resource availability. There is a need for affordable and scalable diagnostic testing and monitoring testing options to better evaluate NCDs among people living with HIV in the Asia-Pacific region.
Acknowledgements
PS Ly and V Khol, National Center for HIV/AIDS, Dermatology & STDs, Phnom Penh, Cambodia; MP Lee, PCK Li, W Lam and YT Chan, Queen Elizabeth Hospital, Hong Kong SAR; N Kumarasamy and C Ezhilarasi, Chennai Antiviral Research and Treatment Clinical Research Site (CART CRS), VHS-Infectious Diseases Medical Centre , VHS, Chennai, India;S Pujari, K Joshi, S Gaikwad and A Chitalikar, Institute of Infectious Diseases, Pune, India;
TP Merati, DN Wirawan and F Yuliana, Faculty of Medicine Udayana University & Sanglah Hospital, Bali, Indonesia;
OT Ng, PL Lim, LS Lee and D Liang, Tan Tock Seng Hospital, Singapore; JY Choi, Na S and JM Kim, Division of Infectious Diseases, Department of Internal Medicine, Yonsei University College of Medicine, Seoul, South Korea;
YJ Chan, WW Ku and PC Wu, Taipei Veterans General Hospital, Taipei, Taiwan;
CD Do, AV Ngo and LT Nguyen, Bach Mai Hospital, Hanoi, Vietnam;
KV Nguyen, HV Bui, DTH Nguyen and DT Nguyen, National Hospital for Tropical Diseases, Hanoi, Vietnam;
AH Sohn, JL Ross and B Petersen, TREAT Asia, amfAR - The Foundation for AIDS Research, Bangkok, Thailand;
R Bijker, A Jiamsakul, D Rupasinghe and MG Law, The Kirby Institute, UNSW Sydney, Sydney, Australia.
Funding
The TREAT Asia HIV Observational Database Low-Intensity TransfEr study is an initiative of TREAT Asia, a program of amfAR, The Foundation for AIDS Research, with support from the U.S. National Institutes of Health’s National Institute of Allergy and Infectious Diseases, the Eunice Kennedy Shriver National Institute of Child Health and Human Development, the National Cancer Institute, the National Institute of Mental Health, the National Institute on Drug Abuse, the National Heart, Lung, and Blood Institute, the National Institute on Alcohol Abuse and Alcoholism, the National Institute of Diabetes and Digestive and Kidney Diseases, and the Fogarty International Center, as part of the International Epidemiology Databases to Evaluate AIDS (IeDEA; U01AI069907). The Kirby Institute is funded by the Australian Government Department of Health and Ageing, and is affiliated with the Faculty of Medicine, UNSW Sydney. The PhD of R Bijker has been supported through an Australian Government Research Training Program Scholarship. The content of this publication is solely the responsibility of the authors and does not necessarily represent the official views of any of the governments or institutions mentioned above.
Footnotes
Conflicts of interest
No conflicts of interest.
References
- 1.Joint United Nations Programme on HIV/AIDS (UNAIDS). 90–90–90: An ambitious treatment target to help end the AIDS epidemic. Geneva, Switzerland: UNAIDS, 2014. [Google Scholar]
- 2.UNAIDS. Understanding fast-track: Accelerating action to end the AIDS epidemic by 2030. Geneva, Switzerland: UNAIDS, 2018. [Google Scholar]
- 3.Floyd S, Ayles H, Schaap A, et al. Towards 90–90: Findings after two years of the HPTN 071 (PopART) cluster-randomized trial of a universal testing-and-treatment intervention in Zambia. PLoS One 2018; 13(8): e0197904. doi: 10.1371/journal.pone.0197904. [DOI] [PMC free article] [PubMed] [Google Scholar]
- 4.INSIGHT START Study Group. Initiation of Antiretroviral Therapy in Early Asymptomatic HIV Infection. N Engl J Med 2015; 373(9): 795–807. doi: 10.1056/NEJMoa1506816. [DOI] [PMC free article] [PubMed] [Google Scholar]
- 5.TEMPRANO ANRS 12136 Study Group. A Trial of Early Antiretrovirals and Isoniazid Preventive Therapy in Africa. N Engl J Med 2015; 373(9): 808–822. doi: 10.1056/NEJMoa1507198. [DOI] [PubMed] [Google Scholar]
- 6.Bavinton BR, Pinto AN, Phanuphak N, et al. Viral suppression and HIV transmission in serodiscordant male couples: an international, prospective, observational, cohort study. The Lancet HIV 2018; 5(8): e438–e447. doi: 10.1016/S2352-3018(18)30132-2 [DOI] [PubMed] [Google Scholar]
- 7.Rodger AJ, C.ambiano V, Bruun T, et al. Sexual Activity Without Condoms and Risk of HIV Transmission in Serodifferent Couples When the HIV-Positive Partner Is Using Suppressive Antiretroviral Therapy. JAMA 2016. 316(2): 171–181. doi: 10.1001/jama.2016.5148. [DOI] [PubMed] [Google Scholar]
- 8.Cihlar T, Fordyce M. Current status and prospects of HIV treatment. Curr Opin Virol 2016; 18: 50–56. doi: 10.1016/j.coviro.2016.03.004. [DOI] [PubMed] [Google Scholar]
- 9.Gupta RK, Hill A, Sawyer AW, et al. Virological monitoring and resistance to fi rst-line highly active antiretroviral therapy in adults infected with HIV-1 treated under WHO guidelines: a systematic review and meta-analysis. Lancet Infect Dis 2009; 9: 409–417. doi: 10.1016/S1473-3099(09)70136-7. [DOI] [PubMed] [Google Scholar]
- 10.Naicker S, Rahmanian S, Kopp JB. HIV and chronic kidney disease. Clin Nephrol 2015; 83(7 Suppl 1): 32–38. [DOI] [PMC free article] [PubMed] [Google Scholar]
- 11.Nduka CU, Stranges S, Kimani PK, et al. Is there sufficient evidence for a causal association between antiretroviral therapy and diabetes in HIV-infected patients? A meta-analysis. Diabetes Metab Res Rev 2017; 33(6). doi: 10.1002/dmrr.2902. [DOI] [PubMed] [Google Scholar]
- 12.Lazarus JV, Safreed-Harmon K, Barton SE, et al. Beyond viral suppression of HIV - the new quality of life frontier. BMC Med 2016; 14(1): 94. doi: 10.1186/s12916-016-0640-4. [DOI] [PMC free article] [PubMed] [Google Scholar]
- 13.Longenecker CT. Vascular disease and aging in HIV: Time to extend the treatment cascade. Vasc Med 2018; 23(5): 476–477. doi: 10.1177/1358863X18789767. [DOI] [PMC free article] [PubMed] [Google Scholar]
- 14.Panel on Antiretroviral Guidelines for Adults and Adolescents. Guidelines for the use of antiretroviral agents in adults and adolescents with HIV. Department of Health and Human Services. (Accessed 29 December 2019.) Available from https://aidsinfo.nih.gov/guidelines.
- 15.Patel P, Sabin K, Godfrey-Faussett P. Approaches to Improve the Surveillance, Monitoring, and Management of Noncommunicable Diseases in HIV-Infected Persons: Viewpoint. JMIR Public Health Surveill 2018; 4(4): e10989. doi: 10.2196/10989. [DOI] [PMC free article] [PubMed] [Google Scholar]
- 16.Bijker R, Kumarasamy N, Kiertiburanakul S, et al. Diabetes, mortality and glucose monitoring rates in the TREAT Asia HIV Observational Database Low Intensity Transfer (TAHOD-LITE) study. HIV Med 2019; 20(9): 615–623. doi: 10.1111/hiv.12779. [DOI] [PMC free article] [PubMed] [Google Scholar]
- 17.De La Mata NL, Ahn MY, Kumarasamy N, et al. A pseudo-random patient sampling method evaluated. J Clin Epidemiol 2017; 81: 129–139. doi: 10.1016/j.jclinepi.2016.09.012 [DOI] [PMC free article] [PubMed] [Google Scholar]
- 18.World Health Organization. Antiretroviral therapy for HIV infection in adults and adolescents: recommendations for a public health approach. 2010 revision. Geneva, Switzerland: World Health Organization, 2010. [PubMed] [Google Scholar]
- 19.World Health Organization. Consolidated guidelins on the use of antiretroviral drugs for treating and preventing HIV infection: recommendations for a public health approach. Second edition, 2016. Geneva, Switzerland: World Health Organization, 2016. [PubMed] [Google Scholar]
- 20.Levey AS, Stevens LA, Schmid CH, et al. A new equation to estimate glomerular filtration rate. Ann Intern Med 2009; 150: 604–612. [DOI] [PMC free article] [PubMed] [Google Scholar]
- 21.American Diabetes Association. Standards of Medical Care in Diabetes-2018 Abridged for Primary Care Providers. Clin Diabetes 2018; 36(1): 14–37. doi: 10.2337/cd17-0119 [DOI] [PMC free article] [PubMed] [Google Scholar]
- 22.Levey AS, Stevens LA, Schmid CH, et al. A new equation to estimate glomerular filtration rate. Ann Intern Med 2009; 150: 604–612. [DOI] [PMC free article] [PubMed] [Google Scholar]
- 23.Médicines sans frontières Access Campaign. Putting HIV and HCV to the test. A product guide for point-of-care CD4 and laboratory-based and point-of-care virological HIV and HCV tests. 2nd edition – July 2015. Geneva, Switzerland: Médicines sans frontières, 2015. [Google Scholar]
- 24.Thinn KK, Thekkur P, Kyaw NTT. Uptake of routine viral load testing among people living with HIV and its implementation challenges in Yangon region of Myanmar: a mixed-methods study. BMJ Open 2019; 9(12): e032678. doi: 10.1136/bmjopen-2019-032678. [DOI] [PMC free article] [PubMed] [Google Scholar]
- 25.Cooper RD, Wiebe N, Smith N, et al. Systematic review and meta-analysis: renal safety of tenofovir disoproxil fumarate in HIV-infected patients. Clin Infect Dis 2010; 51(5): 496–505. doi: 10.1086/655681. [DOI] [PubMed] [Google Scholar]
- 26.World Health Organization. Consolidated guidelins on the use of antiretroviral drugs for treating and preventing HIV infection: recommendations for a public health approach. June 2013. Geneva, Switzerland: World Health Organization, 2013. [PubMed] [Google Scholar]
- 27.Marcellin P, Wong DK, Sievert W, et al. Ten‐year efficacy and safety of tenofovir disoproxil fumarate treatment for chronic hepatitis B virus infection. Liver Int 2019; 39(10): 1868–1875. doi: 10.1111/liv.14155. [DOI] [PubMed] [Google Scholar]
- 28.Hsieh MH, Lu PL, Kuo MC, et al. Prevalence of and associated factors with chronic kidney disease in human immunodeficiency virus-infected patients in Taiwan. J Microbiol Immunol Infect 2015; 48(3): 256–262. doi: 10.1016/j.jmii.2013.08.013. [DOI] [PubMed] [Google Scholar]
- 29.Mizushima D, Nguyen DTH, Nguyen DT, et al. Tenofovir disoproxil fumarate co-administered with lopinavir/ritonavir is strongly associated with tubular damage and chronic kidney disease. J Infect Chemother 2018; 24(7): 549–554. doi: 10.1016/j.jiac.2018.03.002. [DOI] [PubMed] [Google Scholar]
- 30.Yanagisawa N, Muramatsu T, Koibuchi T, et al. Prevalence of Chronic Kidney Disease and Poor Diagnostic Accuracy of Dipstick Proteinuria in Human Immunodeficiency Virus-Infected Individuals: A Multicenter Study in Japan. Open Forum Infect Dis 2018; 5(10): ofy216. doi: 10.1093/ofid/ofy216 [DOI] [PMC free article] [PubMed] [Google Scholar]
- 31.Yang CJ, Wang HY, Chou TC, et al. Prevalence and related drug cost of comorbidities in HIV-infected patients receiving highly active antiretroviral therapy in Taiwan: A cross-sectional study. J Microbiol Immunol Infect 2019; 52(5): 720–727. doi: 10.1016/j.jmii.2019.05.011. [DOI] [PubMed] [Google Scholar]
- 32.Chhoun P, Tuot S, Harries AD, et al. High prevalence of non-communicable diseases and associated risk factors amongst adults living with HIV in Cambodia. PLoS One 2017; 12(11): e0187591. doi: 10.1371/journal.pone.0187591. [DOI] [PMC free article] [PubMed] [Google Scholar]
- 33.Hejazi N, Rajikan R, Choong CLK, et al. Metabolic abnormalities in adult HIV infected population on antiretroviral medication in Malaysia: a cross-sectional survey. BMC Public Health 2013; 13: 758. doi: 10.1186/1471-2458-13-758. [DOI] [PMC free article] [PubMed] [Google Scholar]
- 34.Kiertiburanakul S, Luengroongroj P and Sungkanuparph S. Clinical characteristics of HIV-infected patients who survive after the diagnosis of HIV infection for more than 10 years in a resource-limited setting. J Int Assoc Physicians AIDS Care 2012; 11:361–365. doi: 10.1177/1545109712449191. [DOI] [PubMed] [Google Scholar]
- 35.Mills KT, Xu Y, Zhang W, et al. A systematic analysis of worldwide population-based data on the global burden of chronic kidney disease in 2010. Kidney Int 2015;. 88(5): 950–957. doi: 10.1038/ki.2015.230. [DOI] [PMC free article] [PubMed] [Google Scholar]
- 36.Dagenais GR, Gerstein HC, Zhang X, et al. Variations in diabetes prevalence in low-, middle-, and high-income countries: results from the prospective urban and rural epidemiological study. Diabetes Care 2016; 39(5): 780–787. doi: 10.2337/dc15-2338. [DOI] [PubMed] [Google Scholar]
- 37.Tong SF, Ho C, Tan HM. Managing the aging man in Asia: a review. Int J Urol 2011; 18(1): 32–42. doi: 10.1111/j.1442-2042.2010.02652.x. [DOI] [PubMed] [Google Scholar]
- 38.Pastor A, Conn J, Maclsaac RJ, et al. Alcohol and illicit drug use in people with diabetes. Lancet Diabetes Endocrinol 2020; 8(3):239–248. doi: 10.1016/S2213-8587(19)30410-3. [DOI] [PubMed] [Google Scholar]
- 39.Pendergraft WF 3rd, Herlitz LC, Thornley-Brown D, et al. Nephrotoxic effects of common and emerging drugs of abuse. Clin J Am Soc Nephro 2014; 9(11): 1996–2005. doi: 10.2215/CJN.00360114. [DOI] [PMC free article] [PubMed] [Google Scholar]
- 40.Wei C, Guadamuz TE, Lim SH, et al. Patterns and levels of illicit drug use among men who have sex with men in Asia. Drug Alcohol Depend 2012; 120(1–3): 246–249. doi: 10.1016/j.drugalcdep.2011.07.016. [DOI] [PMC free article] [PubMed] [Google Scholar]
- 41.Nash D, Katyal M, Brinkhof MW, et al. , Long-term immunologic response to antiretroviral therapy in low-income countries: a collaborative analysis of prospective studies. AIDS 2008; 22(17): 2291–2302. doi: 10.1097/QAD.0b013e3283121ca9. [DOI] [PMC free article] [PubMed] [Google Scholar]
- 42.Strategies for Management of Antiretroviral Therapy (SMART) Study Group. Inferior clinical outcome of the CD4+ cell count-guided antiretroviral treatment interruption strategy in the SMART study: role of CD4+ Cell counts and HIV RNA levels during follow-up. J Infect Dis 2008; 197: 1145–1155. doi: 10.1086/529523. [DOI] [PubMed] [Google Scholar]
- 43.Ford N, Meintjes G, Calmy A, et al. Managing Advanced HIV Disease in a Public Health Approach. Clin Infect Dis 2018; 66(suppl_2): S106–SS110. doi: 10.1093/cid/cix1139. [DOI] [PMC free article] [PubMed] [Google Scholar]
- 44.Haacker M, Bärnighausen T, Atun R. HIV and the growing health burden from noncommunicable diseases in Botswana: modelling study. J Glob Health 2019; 9(1): 010428. doi: 10.7189/jogh.09.010428. [DOI] [PMC free article] [PubMed] [Google Scholar]
- 45.Smit M, Cassidy R, Cozzi-Lepri A, et al. Projections of non-communicable disease and health care costs among HIV-positive persons in Italy and the U.S.A.: A modelling study. PLoS One 2017; 12(10): e0186638. doi: 10.1371/journal.pone.0186638. [DOI] [PMC free article] [PubMed] [Google Scholar]
- 46.Roberts T, Cohn J, Bonner K et al. Scale-up of Routine Viral Load Testing in Resource-Poor Settings: Current and Future Implementation Challenges. Clin Infect Dis 2016; 62(8): 1043–1048. doi: 10.1093/cid/ciw001 [DOI] [PMC free article] [PubMed] [Google Scholar]
- 47.Misra A, Gopalan H, Jayawardena R, et al. Diabetes in developing countries. J Diabetes 2019; 11(7): 522–539. doi: 10.1111/1753-0407.12913 [DOI] [PubMed] [Google Scholar]
- 48.Ford N, Ball A, Baggaley R et al. The WHO public health approach to HIV treatment and care: looking back and looking ahead. Lancet Infect Dis 2018; 18(3): e76–e86. doi: 10.1016/S1473-3099(17)30482-6. [DOI] [PubMed] [Google Scholar]
- 49.Grimsrud A, Barnabas RV, Ehrenkranz P, et al. Evidence for scale up: the differentiated care research agenda. J Int AIDS Soc 2017; 20(Suppl 4): 22024. doi: 10.7448/IAS.20.5.22024. [DOI] [PMC free article] [PubMed] [Google Scholar]
- 50.Barnabas RV, Revill P, Tan N, et al. Cost-effectiveness of routine viral load monitoring in low- and middle-income countries: a systematic review. J Int AIDS Soc 2017; 20(Suppl 7). doi: 10.1002/jia2.25006. [DOI] [PMC free article] [PubMed] [Google Scholar]
- 51.UNAIDS. Country data India 2017. UNAIDS. (Accessed 22 April 2020.) Available from: https://www.unaids.org/en/regionscountries/countries/india. [Google Scholar]