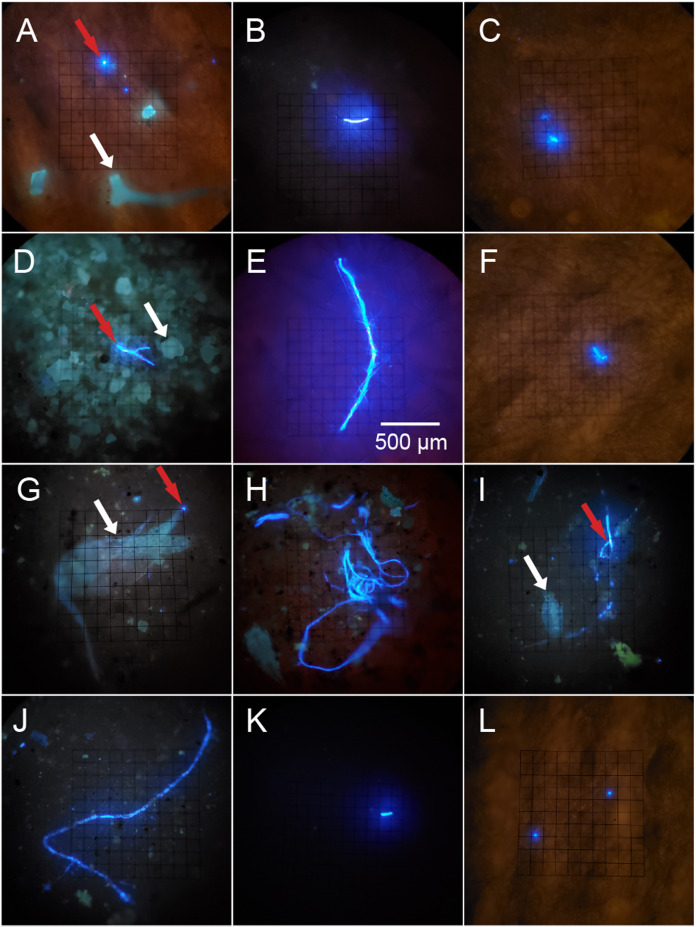
Figure 2. Potential microplastics (PMP) on the filters of sponge samples, seawater samples and blanks.
The top two rows include samples from the six sponge species: (A) A. cauliformis. (B) A. compressa. (C) C. vaginalis. (D) I. campana. (E) M. laevis. (F) N. erecta. The bottom two rows include seawater samples (G–J) as well as one MilliQ blank from the seawater study (K) and one blank from the sponge study (L). Note the dulled, blue-green autofluorescence (indicated by white arrows) of spongin fragments, sand grains and two copepods in images A, D, G and I, respectively, as it compares with the bright, electric blue autofluorescence (indicated by red arrows) of PMP. Images were taken at 100× total magnification and the scale bar shown in “E” is applicable to all images.

