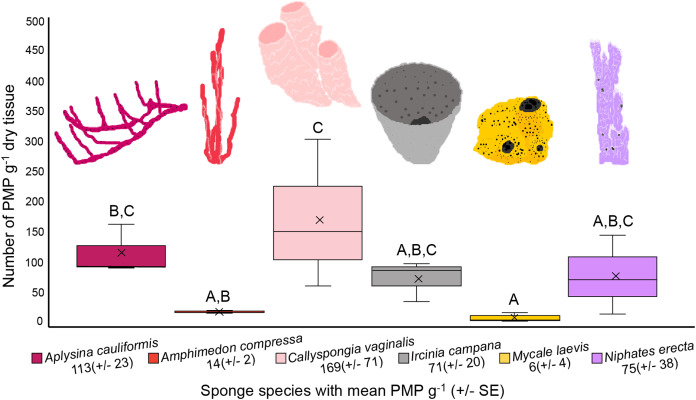
Figure 4. Number of potential microplastics (PMP) g–1 of dry sponge tissue.
Box plots (N = 3 replicates per species) are median inclusive and the “x” in each plot represents the mean. The mean number (±SE) of PMP g–1 of dry tissue for each species is listed below the sponge name. For reference, the mean number of PMP found in the seawater samples was 107 ± 25 particles L–1. Letters above each plot indicate significant pairwise difference (Tukey’s test, p < 0.05).

