

Abstract
A multiple linear regression model called MLR-3 is used for predicting the experimental n-octanol/water partition coefficient (log PN) of 22 N-sulfonamides proposed by the organizers of the SAMPL7 blind challenge. The MLR-3 method was trained with 82 molecules including drug-like sulfonamides and small organic molecules, which resembled the main functional groups present in the challenge dataset. Our model, submitted as “TFE-MLR”, presented a root-mean-square error of 0.58 and mean absolute error of 0.41 in log P units, accomplishing the highest accuracy, among empirical methods and also in all submissions based on the ranked ones. Overall, the results support the appropriateness of multiple linear regression approach MLR-3 for computing the n-octanol/water partition coefficient in sulfonamide-bearing compounds. In this context, the outstanding performance of empirical methodologies, where 75% of the ranked submissions achieved root-mean-square errors < 1 log P units, support the suitability of these strategies for obtaining accurate and fast predictions of physicochemical properties as partition coefficients of bioorganic compounds.
Supplementary Information
The online version contains supplementary material available at 10.1007/s10822-021-00409-2.
Keywords: Multiple linear regression, Empirical methods, n-Octanol/water partition coefficients, N-sulfonamides, SAMPL7 blind challenge
Introduction
The relevance of lipophilicity in the pharmaceutical sciences has been known for over a century [1]. Lipophilicity is the affinity of a molecule for a lipophilic environment. The logarithm of the n-octanol/water partition/distribution coefficient of neutral and ionizable compounds −log PN and log DpH, respectively- are the gold standards of quantitative descriptors of lipophilicity [2]. Thus, log PN has been used for predicting the ability of bioorganic compounds to cross cell membranes [3]. Nowadays, it is still being used for assessing the impact on pharmacokinetic parameters and potency [4], metabolism and excretion[5, 6], and toxicity [7] of research compounds.
To predict the log PN there are a plethora of computational methods [2] and SAMPL challenges aim to evaluate them through blind predictions of physical properties [8]. In the framework of the SAMPL6 log PN challenge, several approaches were submitted: physical models, which made their predictions from molecular conformations using quantum mechanics (QM) and molecular mechanics (MM) methods, whereas empirical methods participated using two major categories, group contribution and quantitative structure–property relationships (QSPR) methods [9].
Multiple Linear Regression (MLR) analysis is a simple algorithm widely used in chemoinformatics. This method establishes a correlation between independent variables and the dependent variable [10]. Several MLR models have been built to predict the n-octanol/water partition coefficient of bioorganic compounds, which encompasses different approaches based on calculated molecular descriptors [11], QM electronic descriptors [12], molecular holograms containing atom type information [13], volume and surface area descriptors [14, 15], hydrophobic area and chain descriptors [15]. Accordingly, there are successful cases for the prediction of log PN of organic compounds employing MLR approaches, especially for molecules within a close chemical space such as substituted aromatic drugs [15], polychlorinated diphenyl ethers [16], blocked tripeptides [17], fragment-like small molecules in the SAMPL6 log PN challenge [12], and sulfonamides [18].
Here, we report the results obtained by 3 different multiple linear regression (MLR) models to reproduce the experimental values of log PN for 22 sulfonamides in the SAMPL7 log PN blind prediction challenge. The performance of MLR models is discussed together with an analysis of the compound with the largest deviation between experimental and calculated log PN value. The method MLR-3 identified as “TFE-MLR” was the approach submitted for ranking purposes.
Methods
Dataset
The SAMPL7 blind challenge consisted of predicting the partition coefficient between water and n-octanol (log PN) of 22 N-acylsulfonamides synthesized by Ballatore Lab [19] (see Fig. 1). The set consisted of amide, oxetane, thietane, thietane-1-oxide, thietane-1,1-oxide, isoxazole and triazole N-acylsulfonamides derivatives. Most compounds in the dataset were achiral and just SM35, SM36 and SM37 had a chiral center. SMILES strings of the neutral molecules were provided by the organizers on the SAMPL7 website [20].
Fig. 1.

Structures of 22 N-sulfonamides in the SAMPL7 log PN challenge dataset
Multiple linear regression models
Taking into consideration the chemistry of the SAMPL7 dataset (see Fig. 1), a total of 87 small molecules (see Table S1 and SI TFE-MLR_trainingset.xlsx) were chosen, based on the chemical space needed for the challenge, to build multiple linear regression models for predicting the experimental log PN of 22 N-sulfonamides proposed by the organizers of the challenge [20]. The chemical space of these molecules, including drug-like sulfonamides and smaller molecules, resembled the main functional groups present in the challenge dataset and the drug-like sulfonamides (see Fig. 2).
Fig. 2.
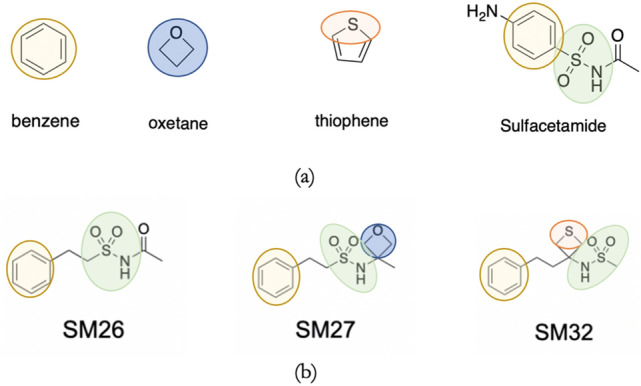
Representation of a some small molecules of the training set which resembles the main functional groups in b molecules of the SAMPL7 dataset
The SMILES codes and experimental log PN values were obtained from publicly available data in PubChem [21], DrugBank [22], and other specific sources [23–25]. These SMILES codes were transformed to sdf files using ChemmineOB package in R [26]. From the 87 molecules, five molecules were chosen randomly with the condition to be drug-like sulfonamides. This was done to mimic the nature of the blind challenge in terms of chemical space. In addition, we have sought to maintain a considerable number of observations to build up the model (~ 95%, 82 molecules) -taking into consideration the small size of our set.
For the training set, multiple linear regression models (MLR) were used to find the existing relationship between a selected number of descriptors (di) and the experimental n‑octanol/water partition coefficients (log PN,exptl.).
| 1 |
In Eq. 1, b stands for the intercept [27] and ci for the coefficients, which were estimated by regression analysis. The MLR models and the statistical analysis were done in R.
Training models used both functional group and molecular property-based descriptors (see Table 1). In the former case, a straightforward functional group count was used as a descriptor; whereas in the latter case, molecular properties related to lipophilicity [11] were generated to obtain a better description of this physicochemical property. All used descriptors were computed using the packages ChemmineR [28] and ChemmineOB [26], however, the number of occurrence of a functional group was computed employing a modified in-house function of the packages mentioned before. Intercorrelations between descriptors were analyzed (see Fig. S1) as well as individual correlations for each descriptor to the experimental log PN values for the training set (see Table 1).
Table 1.
List of descriptors used in the present study and their coefficient of determination (R2) against experimental log PN values for the training set
| Descriptor | Definition | R2 |
|---|---|---|
| 1. RNH2 | Count of primary amine groups | 0.11 |
| 2. R2NH | Count of secondary amine groups | 0.06 |
| 3. R3N | Count of tertiary amine groups | 0.15 |
| 4. ROPO3 | Count of phosphate groups | 0.00 |
| 5. ROH | Count of alcohol groups | 0.03 |
| 6. RCHO | Count of aldehyde groups | 0.00 |
| 7. RCOR | Count of ketone groups | 0.00 |
| 8. RCOOH | Count of carboxylic acid groups | 0.00 |
| 9. RCOOR | Count of ester groups | 0.06 |
| 10. ROR | Count of ether groups | 0.03 |
| 11. RSO2NR | Count of sulfonamide groups | 0.03 |
| 12. RSR | Count of thioether groups | 0.00 |
| 13. RF | Count of fluoroalkyl groups | 0.13 |
| 14. RCl | Count of chloroalkyl groups | 0.01 |
| 15. RBr | Count of bromoalkyl groups | 0.01 |
| 16. RSO2R | Count of sulfone groups | 0.00 |
| 17. C | Count of carbon atoms | 0.50 |
| 18. RINGS |
Count of rings (aliphatic and aromatic) |
0.30 |
| 19. AROMATIC | Count of aromatic rings | 0.34 |
| 20. HBA1 | Count of hydrogen bond acceptors considering acceptor sites, i.e., the sum of lone pairs on the acceptor atoms | 0.11 |
| 21. HBA2 | Count of hydrogen bond acceptors considering acceptor counts, i.e., the sum of acceptor atoms | 0.10 |
| 22. HBD | Count of hydrogen bond donor atoms | 0.02 |
| 23. PSA | Polar surface area in Å2 | 0.05 |
| 24. MR | Molar refractivity in cm3/mol | 0.41 |
For the purpose of this study, 3 different models were tested to select the approach that best reproduces experimental values of n-octanol/water partitions coefficients of neutral compounds. First, the approach labeled MLR-1, used the count of structural features represented by descriptors from 1 to 19 (see Table 1). Next, the second approach (MLR-2) added descriptors related to intramolecular interactions as hydrogen bond acceptors sites (HBA1), hydrogen bond acceptors atoms (HBA2), and hydrogen bond donor atoms (HBD), descriptors from 1 to 22 (see Table 1). Finally, the last model (MLR-3) appended two computed atomic contributions, the polar surface area (PSA) and molar refractivity (MR), descriptors from 1 to 24 (see Table 1). The performance of all approaches was compared through statistical analysis (see Table 2).
Table 2.
Statistical parameters of MLR approaches for predicting experimental log PN values for the training set (n = 82).a
| Model | R2 | RMSE | s | F | p-value | |
|---|---|---|---|---|---|---|
| MLR-1 | 0.79 | 0.73 | 0.72 | 0.83 | 12.6 | 1.02 × 10⁻¹⁴ |
| MLR-2 | 0.82 | 0.75 | 0.68 | 0.80 | 12.2 | 1.30 × 10⁻¹⁴ |
| MLR-3 | 0.84 | 0.77 | 0.64 | 0.77 | 12.3 | 9.00 × 10⁻¹⁵ |
R2, squared coefficient of determination; , adjusted squared coefficient of determination; RMSE, root-mean square error in log P units; s, residual standard error; F, Fisher ratio; p-value; statistical p value
For the test set, 5 sulfonamide-bearing drugs (see Fig. 3) were randomly chosen from the original set (see Table S1). A statistical comparison between the experimental log PN values for the test set and the forecasted value by our MLR methods, as well as other common approaches [15, 29, 30] (see Table S2) was made to further check the suitability of the 3 MLR models mentioned above (see Table 3). Besides, k-fold cross-validation with k = 5 was performed to validate the 3 models mentioned above (see Table S4).
Fig. 3.

Structures and experimental log PN of 5 biologically active sulfonamide-bearing drugs chosen as prediction set
Table 3.
Statistical parameters of the comparison between experimental and predicted log PN values for the test set using the 3 MLR approaches and other common approaches
| Method | MSEa | MUEa | RMSE | R2 |
|---|---|---|---|---|
| MLR-1 | -0.04 | 0.51 | 0.66 | 0.72 |
| MLR-2 | 0.00 | 0.31 | 0.40 | 0.90 |
| MLR-3b | 0.05 | 0.12 | 0.20 | 0.98 |
| ChemAxonc | 0.05 | 0.24 | 0.28 | 0.98 |
| VLifeMDSd | -0.73 | 0.90 | 0.97 | 0.72 |
| DataWarriore | -0.20 | 0.74 | 0.90 | 0.72 |
Supported by statistical analysis and based on predictive power in both training and test set (see Fig. 4), the quantitative structure–property relationship (QSPR) approach summited to account for predicting the SAMPL7 experimental log PN values was the method labeled MLR-3. Details of the model including the list of descriptors, their coefficients, and model parameters are listed in Table S3.
Fig. 4.
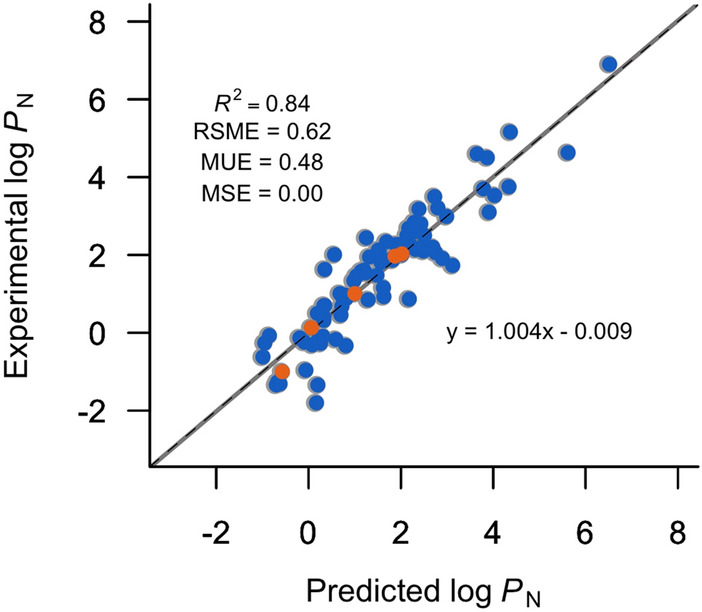
Comparison between experimental and predicted n-octanol/water log PN using the MLR-3 model for the training (blue) and test (orange) set
An additional test set, called DB40 (see SI TFE-MLR_DB40.xlsx), was built by filtering the sulfonyl moiety in the DrugBank database (1102 molecules) and after removing molecules already used in the set of 87 small molecules mentioned above. Thus, a final set of 40 approved drugs and/or drug-like molecules was tested with the MLR-3 method (see Fig. S5) to verify the applicability of the method in other biologically active sulfonyl-bearing drugs. Finally, by combining the training, test, SAMPL7, and DB40 datasets (149 molecules) and paying special attention to the worst predictions, the general performance of the MLR-3 method is also presented.
Results and discussion
The method presented in this work for predicting the log PN of 22 N-sulfonamides in the SAMPL7 challenge dataset corresponds to the “TFE-MLR” submission. The quantitative structure–property relationship (QSPR) approach was based on the multiple linear regression model called MLR-3, as further described in the methods section.
The functional group descriptors with the main individual correlations (see Table 1) were the number of carbon atoms (R2 = 0.50), number of aromatic rings (R2 = 0.34), number of aliphatic rings (R2 = 0.30), count of tertiary amine, fluoroalkyl, and primary amine groups (R2 = 0.15, R2 = 0.13, and R2 = 0.11, respectively). The presence of representative functional groups in the training set has a direct impact on the prediction of n-octanol/water partition coefficient, as this strategy has been exploited in a wide variety of formalisms, from atomic to fragmental strategies [31–33]. On the other hand, molar refractivity (R2 = 0.41), hydrogen bond acceptor site, and hydrogen bond acceptors atoms (R2 = 0.11 and R2 = 0.10, respectively) were the molecular property-based descriptors that best correlated the training model. Both descriptors have been employed to compute n-octanol/water partition coefficients in previous works [27], where molar refractivity was used as a surrogate of molecular size, whilst hydrogen bond counts reflected intermolecular interactions. For the sake of clarity, despite hydrogen bond descriptors (HBA1 and HBA2) [28] are correlated (see Fig S1), they give differentiated information (for details see Fig S2), i.e., HBA2 takes into account electron pairs on nitrogen atoms able to delocalize, whereas HBA1 does not.
We decided to submit the approach called MLR-3 because it presented the most suitable statistical parameters (see Table 2) supported by cross-validation analysis (see Table S4). In addition, a preliminary prediction of 5 biologically active sulfonamide-bearing drugs chosen as prediction set was surprisingly accurate using this model (see Fig. 3 and Table 3). In fact, our model outperforms the results obtained with common algorithms for log PN, e.g., ChemAxon [29] and DataWarrior [30], and MLR models trained with specific compounds as substituted aromatic drugs, e.g., VLifeMDS [15].
Table 4 shows the predicted log PN values for the 22 N-sulfonamides in the SAMPL7 challenge dataset. The root-mean-square error (RMSE) between fitted values using the MLR-3 model and experimental data is 0.58 log P units. As noted in Figures S3 and S4, our model has the lowest RMSE in the empirical methods category, contemplating the outstanding performance of these methods, where six out of the eight empirical ranked methods have a RMSE < 1 in log P units. The second best RMSE of the ranked submissions was Chemprop [34], which consists of message passing neural networks (MPNN) created by an MIT research group. Chemprop’s submitters used this MPNN with a processed version of the OPERA [35] log P data set. This model has been used for different prediction purposes: properties, antibiotic probability, and SARS-Cov inhibition [34]. The third lowest RMSE was GROVER (graph representation from self-supervised message passing transformer) [36], which incorporates MPNN into the transformation to give more expressive encoders and flexibility. ffsampled_deeplearning_cl1 entry also used a MPNN. This algorithm was based on a previously reported NN [37]. ClassicalGSG used NN for the prediction employing as inputs: molecular features generated with a method called Geometric Scattering for Graphs (GSG) and classical molecular dynamics [38]. Finally, TFE_Attentive_FP used a graph neural network with a novel architecture called Attentive FP. This NN architecture includes an attention mechanism that focuses on the most important parts of the inputs to achieve better predictions [39].
Table 4.
Calculated submission ID “TFE MLR”—and experimental n-octanol/water partition coefficient -log PN—determined for the 22 sulfonamides included in the SAMPL7 dataset
| Compound | Calculated | Experimental | Δlog P (calc-exptl) |
|---|---|---|---|
| SM25 | 2.35 | 2.67 0.01 | − 0.32 |
| SM26 | 1.19 | 1.04 0.01 | + 0.15 |
| SM27 | 1.47 | 1.56 0.11 | − 0.09 |
| SM28 | 1.87 | 1.18 0.08 | + 0.69 |
| SM29 | 1.47 | 1.61 0.03 | − 0.14 |
| SM30 | 2.74 | 2.76 0.19 | − 0.02 |
| SM31 | 1.55 | 1.96 0.14 | − 0.41 |
| SM32 | 1.98 | 2.44 0.17 | − 0.46 |
| SM33 | 3.25 | 2.96 0.21 | + 0.29 |
| SM34 | 2.06 | 2.83 0.20 | − 0.77 |
| SM35 | 1.37 | 0.88 0.02 | + 0.49 |
| SM36 | 2.64 | 0.76 0.05 | + 1.88a |
| SM37 | 1.45 | 1.45 0.10 | + 0.00 |
| SM38 | 0.94 | 1.03 0.07 | − 0.09 |
| SM39 | 2.21 | 1.89 0.13 | + 0.32 |
| SM40 | 1.01 | 1.83 0.05 | − 0.82 |
| SM41 | 1.45 | 0.58 0.02 | + 0.87 |
| SM42 | 1.58 | 1.76 0.03 | − 0.18 |
| SM43 | 0.38 | 0.85 0.01 | − 0.47 |
| SM44 | 1.39 | 1.16 0.03 | + 0.23 |
| SM45 | 2.66 | 2.55 0.04 | + 0.11 |
| SM46 | 1.46 | 1.72 0.01 | − 0.26 |
| RMSE | 0.58 | ||
| MUE | 0.41 | ||
| MSE | 0.05 |
aBold value represents the compound with the largest deviation between theoretical and experimental value
Among the 17 participants/organizations allowed ranked submissions, which include physical (QM and MM) and empirical categories, our approach MLR-3 (submission id: “TFE-MLR”) is ranked at the 1st position as determined by the root-mean-squared error and mean absolute error (see Fig. S3). Comparing to physical methods, two Quantum Mechanics (QM) ranked methods (COSMO-RS and IEFPCM MST) and none Molecular Mechanics (MM) achieved an RMSE around 1 log P units (in ranked submissions). The less time-consuming, cheaper computational cost, and good performance make the simple multiple linear regression models, as well as other empirical approaches (e.g., machine learning), attractive strategies to compute lipophilic descriptors as log PN. Despite most well-performing methods for computing log PN in the SAMPL7 blind challenge belonged to empirical methodologies [40], it must be kept in mind that it presents important disadvantages regarding strategies based on molecular mechanics and/or quantum chemistry. For instance, have a high dependence on the training set as this limits the coverage of molecules that can be predicted [41] (e.g., our approach was trained for predicting partition coefficients for drug-like sulfonamides compounds) and to the best of our knowledge, empirical methods are not able to assign a partition coefficient to a specific conformation of the molecule under analysis, these facts limit subsequent applications, e.g., the study of bioactive conformations, that MM and/or QM approaches can face.
For the sake of consistency with the results obtained for the training and test set, Table 5 reports statistical parameters of predicted log PN values for the 22 N-sulfonamides in the SAMPL7 challenge dataset using the 3 MLR approaches described in the methods section. As expected, the submitted model obtained the highest accuracy among the MLR approaches tested. In addition, MLR-3 had a better performance with the SAMPL7 set (RMSE = 0.58 log P units) than with our training set (RSME = 0.64 log P units, see Table 2).
Table 5.
Statistical parameters of the comparison between experimental and predicted log PN values for the 22 N-sulfonamides in the SAMPL7 challenge dataset using the 3 MLR approaches
| Method | MSE | MUE | RMSE | R2 |
|---|---|---|---|---|
| MLR-1 | 0.03 | 0.62 | 0.73 | 0.13 |
| MLR-2 | 0.12 | 0.51 | 0.66 | 0.24 |
| MLR-3a | 0.05 | 0.41 | 0.58 | 0.42 |
aThe bolded row represents the submitted approach
Analyzing the difference between the predicted and experimental values, the notable outlier is the compound SM36 (see Table 4), which shows an error in the predicted log PN that roughly diverges 3 times the model uncertainty (RMSE = 0.64). In fact, SM36 is the only compound in our method with an absolute error larger than 1 log units. For the sake of comparison, it is worth noting that the three most accurate empirical methods (MLR-3, Chemprop, and GROVER) evidence the same tendency, the overestimation of the log PN of compound SM36 which amounts, on average, to 1.61 log units. Exclusion of SM36 improves significantly the ability of prediction of our approach, reducing the RMSE by 26% and increasing the R2 by 51% (see Fig. 5).
Fig. 5.
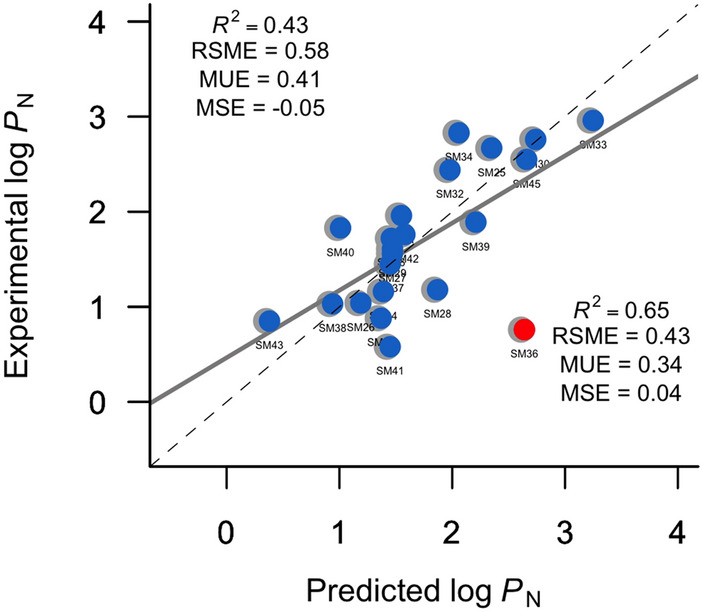
Comparison between experimental and the multiple linear regression method for determining the n-octanol/water log PN for the SAMPL7 dataset. Red point illustrates the outlier founded in our method. Top left, statistical analyses are shown for all compounds and bottom right, after exclusion of SM36
The experimental log PN reported for SM36 is low considering the chemical structure of this compound. For instance, SM35 has a phenyl group in the sulfonamide moiety instead of the methyl group in SM36 (see Fig. 1). Thus, it is expected a higher log PN value for SM36 because benzene rings are significant lipophilic fragments [42–44], however, it was not the experimental observation for the pair SM35-SM36. Comparison of analogous situations in pairs of molecules: SM29-SM30, SM32-SM33, SM41-SM42, and SM44-SM45 reveals the conventional increase in the experimental log PN resulting from the substitution of methyl for phenyl groups. Figure 6 depicts the experimental tendency observed in the log PN for phenyl/methyl analogs, which was the predicted situation employing our method except for the pair SM35–SM36.
Fig. 6.
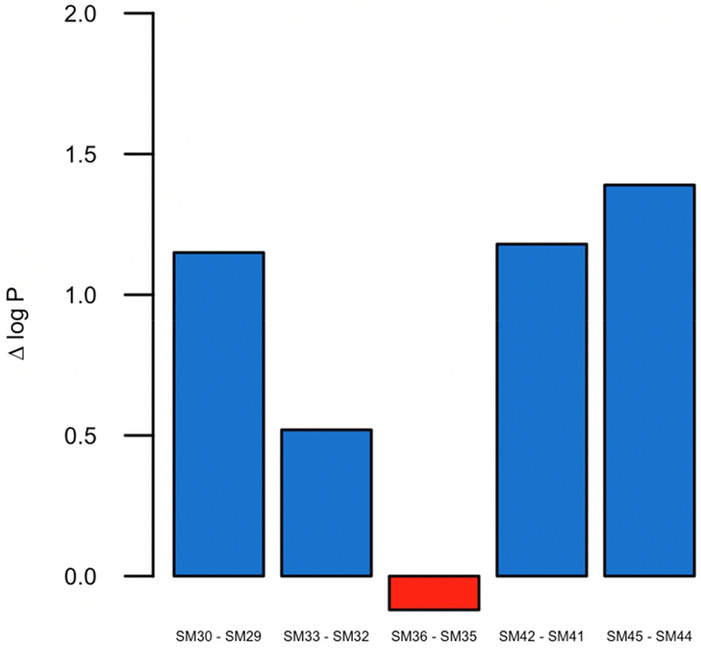
Difference between experimental log PN of SAMPL7 phenyl/methyl N-sulfonamides analogs. Δ log P corresponds to the difference between log PPhenyl analogous–log PMethyl analogous
Because the model was intended as a local model to accurately determine the n-octanol/water log PN for the SAMPL7 dataset, it provides an approach to test the reliability of other compounds that comply with the domain of application of our model, this means biologically active sulfonyl-bearing drugs. For this reason, we decided to test the DB40 set (see methods section for details) whose prediction power was less than that of SAMPL7 (RSME = 1.13, see Fig. S5), however, it can still represent an acceptable estimate considering that the variability of experimental values can often amount to 0.6 units of log P [45].
Finally, we have used 149 compounds belonging to the training, test, SAMPL7, and DB40 datasets to further check the reliability of the MLR-3 model, where we have detected only six outliers exceed for 3 times the model uncertainty (see Fig. 7, top). Here, rosuvastatin (DB40 set) represents the largest absolute deviation (3.08), followed by other two compounds of the DB40 set, vardenafil (2.12) and tirofiban (2.10), next a compound of the training set, brinzolamide (1.97), then another compound of DB40 set, meloxicam (1.89), and finally, a compound of the SAMP7 set, SM36 (1.88). In the case of rosuvastatin and brinzolamide, the predicted log PN value are 3.21 and 0.17, respectively (see SI TFE-MLR_DB40.xlsx and TFE-MLR_trainingset.xlsx), whereas DrugBank Database [22] reports experimental log PN values of 0.13 and − 1.80, respectively, but without available reference. Nevertheless, conducting a more exhaustive search in the literature it is reported experimental log PN values of 2.52 for rosuvastatin [46] and 0.82 for brinzolamide [47], which are in better agreement with the predicted value. Indeed, we implement those verified experimental values in the DB40 set, and taking into account that it is imperative of being able to verify the sources of the experimental values, we decided to omit the values for vardenafil and tirofiban. Thus, a new set of 147 compounds was tested with our model (see Fig. 7, bottom) which reduces the RSME between predicted and experimental data to ∼ − 0.10 (log P units). The remaining outliers are SM36, whose peculiarities were explained above, and meloxicam which is a compound that our method was unable to properly determine its log PN value for own limitations of our local model, presumably due to lack of a correct description of crucial functional groups as enolic groups which can present several tautomeric forms and also favor conformations with specific intramolecular hydrogen bonds [48].
Fig. 7.
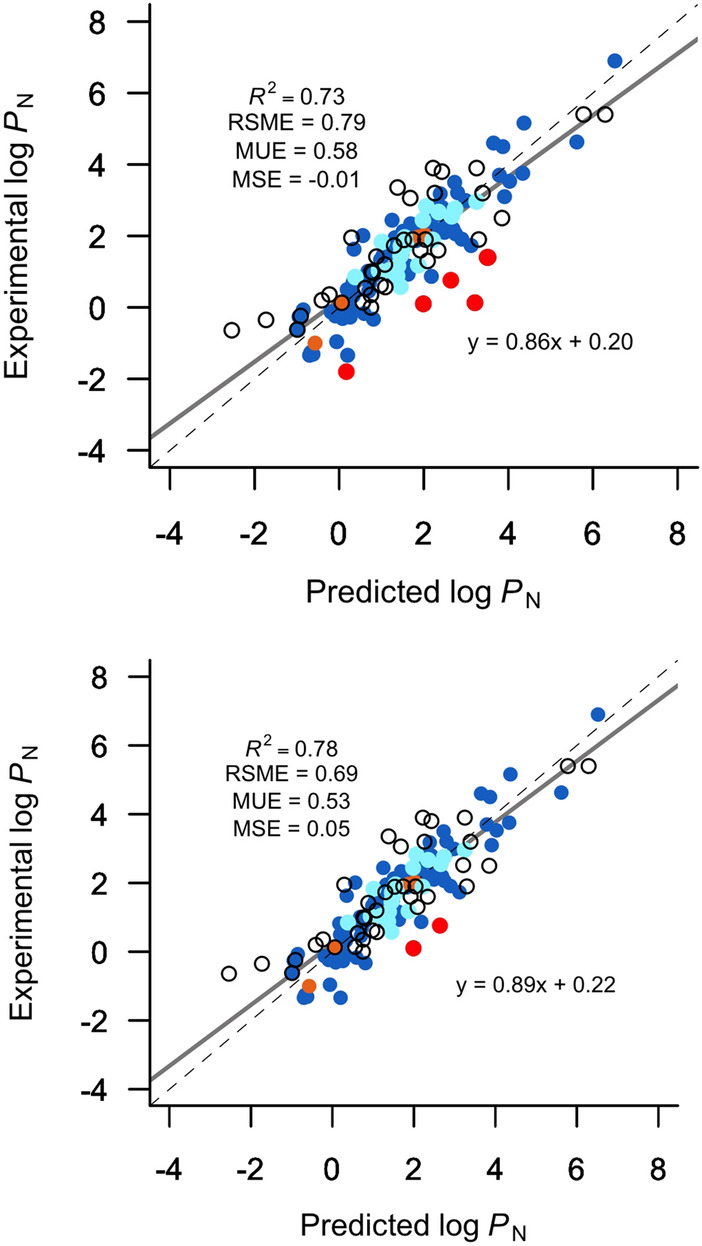
Comparison between experimental and predicted n-octanol/water log PN using the MLR-3 model for 149 (top) and 147 (bottom) molecules from the training (blue), test (orange), SAMPL7 (light blue), and DB40 (unfilled dots) sets (top). In the second graph (bottom), two values from the DrugBank dataset without providing the source were omitted and two experimental values were modified by those from confirmed experimental sources. Red points represent the outliers founded in both sets using our MLR-3 method (meloxicam and SM36 present the same deviation)
Overall, the results support the appropriateness of our multiple linear regression model for computing lipophilic descriptors as the n-octanol/water partition coefficient in drug-like sulfonamides compounds. Furthermore, the outstanding performance of empirical methodologies, where 75% of the ranked submissions achieved root-mean-square errors < 1 log P units, reinforce the suitability of these strategies for obtaining fast and accurate predictions of physicochemical properties of bioorganic compounds.
Conclusions
Fast and accurate predicting of the n-octanol/water partition coefficient in compounds of pharmacological relevance is of utmost importance for evaluating their molecular quality. Within the framework of the blind partition coefficient challenge SAMPL7, we have explored the performance of a multiple linear regression model called MLR-3 for predicting the n-octanol/water partition coefficient of 22 sulfonamides. Taking into consideration the small number of molecules in our training set and the simplicity of the descriptors used, the results obtained have been encouraging and support the efficiency of the straightforward strategy presented here for computing n-octanol/water log PN. Even though the selection of training molecules was appropriate for the aim of this study, we are aware of the limitations of our model in terms of the application domain. In this context, future studies will be focused on the use of a more extensive and diverse set of experimental data to apply the approach developed here to other kinds of bioorganic compounds for the sake of having a generalized model.
Supplementary Information
Below is the link to the electronic supplementary material.
Footnotes
Publisher's Note
Springer Nature remains neutral with regard to jurisdictional claims in published maps and institutional affiliations.
References
- 1.Waring MJ. Lipophilicity in drug discovery. Expert Opin Drug Discov. 2010;5:235–248. doi: 10.1517/17460441003605098. [DOI] [PubMed] [Google Scholar]
- 2.Yang X, Wang Y, Byrne R, et al. Concepts of artificial intelligence for computer-assisted drug discovery. Chem Rev. 2019;119:10520–10594. doi: 10.1021/acs.chemrev.8b00728. [DOI] [PubMed] [Google Scholar]
- 3.Lobo S. Is there enough focus on lipophilicity in drug discovery? Expert Opin Drug Discov. 2020;15:261–263. doi: 10.1080/17460441.2020.1691995. [DOI] [PubMed] [Google Scholar]
- 4.Miller RR, Madeira M, Wood HB, et al. Integrating the impact of lipophilicity on potency and pharmacokinetic parameters enables the use of diverse chemical space during small molecule drug optimization. J Med Chem. 2020;63:12156–12170. doi: 10.1021/acs.jmedchem.9b01813. [DOI] [PubMed] [Google Scholar]
- 5.Kakehashi H, Shima N, Ishikawa A, et al. Effects of lipophilicity and functional groups of synthetic cannabinoids on their blood concentrations and urinary excretion. Forensic Sci Int. 2020 doi: 10.1016/j.forsciint.2019.110106. [DOI] [PubMed] [Google Scholar]
- 6.Chmiel T, Mieszkowska A, Kempińskakupczyk D, et al. The impact of lipophilicity on environmental processes, drug delivery and bioavailability of food components. Microchem J. 2019;146:2–48. doi: 10.1016/j.microc.2019.01.030. [DOI] [Google Scholar]
- 7.Chatzopoulou M, Emer E, Lecci C, et al. Decreasing HepG2 cytotoxicity by lowering the lipophilicity of Benzo[d]oxazolephosphinate Ester Utrophin modulators. ACS Med Chem Lett. 2020;11:2421–2427. doi: 10.1021/acsmedchemlett.0c00405. [DOI] [PMC free article] [PubMed] [Google Scholar]
- 8.https://www.samplchallenges.org/
- 9.Işık M, Bergazin TD, Fox T, et al. Assessing the accuracy of octanol–water partition coefficient predictions in the SAMPL6 Part II log P challenge. J Comput Aided Mol Des. 2020;34:335–370. doi: 10.1007/s10822-020-00295-0. [DOI] [PMC free article] [PubMed] [Google Scholar]
- 10.Peter SC, Dhanjal JK, Malik V, et al (2018) Quantitative structure-activity relationship (QSAR): Modeling approaches to biological applications. In: Encyclopedia of Bioinformatics and Computational Biology: ABC of Bioinformatics
- 11.Eros D, Kovesdi I, Orfi L, et al. Reliability of logP predictions based on calculated molecular descriptors: a critical review. Curr Med Chem. 2012;9:1819–1829. doi: 10.2174/0929867023369042. [DOI] [PubMed] [Google Scholar]
- 12.Patel P, Kuntz DM, Jones MR, et al. SAMPL6 logP challenge: machine learning and quantum mechanical approaches. J Comput Aided Mol Des. 2020;34:495–510. doi: 10.1007/s10822-020-00287-0. [DOI] [PMC free article] [PubMed] [Google Scholar]
- 13.Plante J, Werner S. JPlogP: an improved logP predictor trained using predicted data. J Cheminform. 2018;10:1–10. doi: 10.1186/s13321-018-0316-5. [DOI] [PMC free article] [PubMed] [Google Scholar]
- 14.Chen HF. In silico log P prediction for a large data set with support vector machines, radial basis neural networks and multiple linear regression. Chem Biol Drug Des. 2009;74:142–147. doi: 10.1111/j.1747-0285.2009.00840.x. [DOI] [PubMed] [Google Scholar]
- 15.Bahmani A, Saaidpour S, Rostami A. A Simple, robust and efficient computational method for n-octanol/water partition coefficients of substituted aromatic drugs. Sci Rep. 2017;7:1–14. doi: 10.1038/s41598-017-05964-z. [DOI] [PMC free article] [PubMed] [Google Scholar]
- 16.Yang P, Chen J, Chen S, et al. QSPR models for physicochemical properties of polychlorinated diphenyl ethers. Sci Total Environ. 2003;305:65–76. doi: 10.1016/S0048-9697(02)00467-9. [DOI] [PubMed] [Google Scholar]
- 17.Yin J. LogP prediction for blocked tripeptides with amino acids descriptors (HMLP) by multiple linear regression and support vector regression. Procedia Environ Sci. 2011;8:173–178. doi: 10.1016/j.proenv.2011.10.028. [DOI] [Google Scholar]
- 18.Raevsky OA, Perlovich GL, Kazachenko VP, et al. Octanol/water partition coefficients of sulfonamides: experimental determination and calculation using physicochemical descriptors. J Chem Eng Data. 2009;54:3121–3124. doi: 10.1021/je900189v. [DOI] [Google Scholar]
- 19.Francisco KR, Varricchio C, Paniak TJ, et al. Structure property relationships of N-acylsulfonamides and related bioisosteres. Eur J Med Chem. 2021 doi: 10.1016/j.ejmech.2021.113399. [DOI] [PMC free article] [PubMed] [Google Scholar]
- 20.https://github.com/samplchallenges/SAMPL7/tree/master/physical_property/logP
- 21.Kim S, Chen J, Cheng T, et al. PubChem in 2021: new data content and improved web interfaces. Nucleic Acids Res. 2021 doi: 10.1093/nar/gkaa971. [DOI] [PMC free article] [PubMed] [Google Scholar]
- 22.Wishart DS, Knox C, Guo AC, et al. DrugBank: a comprehensive resource for in silico drug discovery and exploration. Nucleic Acids Res. 2006 doi: 10.1093/nar/gkj067. [DOI] [PMC free article] [PubMed] [Google Scholar]
- 23.Royal Society of Chemistry (2015) ChemSpider. Search and Share Chemistry. R. Soc. Chem.
- 24.Avdeef A. Absorption and drug development:solubility, permeability and charge state. New York: Wiley; 2003. [Google Scholar]
- 25.Zaragoza-Dörwald F. Lead optimization for medicinal chemists: pharmacokinetic properties of functional groups and organic compounds. New York: Wiley-VCH Verlag GmbH; 2012. [Google Scholar]
- 26.Horan K G (2017) ChemmineOB: R interface to a subset of OpenBabel functionalities. R package version 1.18.0, https://github.com/girke-lab/ChemmineOB. 2017
- 27.El Tayar N, Testa B, Carrupt PA. Polar intermolecular interactions encoded in partition coefficients: an indirect estimation of hydrogen-bond parameters of polyfunctional solutes. J Phys Chem. 1992;96:1455–1459. doi: 10.1021/j100182a078. [DOI] [Google Scholar]
- 28.Cao Y, Charisi A, Cheng LC, et al. ChemmineR: A compound mining framework for R. Bioinformatics. 2008;24:1733–1734. doi: 10.1093/bioinformatics/btn307. [DOI] [PMC free article] [PubMed] [Google Scholar]
- 29.ChemAxon, Budapest, Hungary, http://www.chemaxon.com
- 30.Sander T, Freyss J, Von Korff M, Rufener C. DataWarrior: an open-source program for chemistry aware data visualization and analysis. J Chem Inf Model. 2015;55:460–473. doi: 10.1021/ci500588j. [DOI] [PubMed] [Google Scholar]
- 31.Leo A, Hansch C, Elkins D. Partition coefficients and their uses. Chem Rev. 1971;71:525. doi: 10.1021/cr60274a001. [DOI] [Google Scholar]
- 32.Ghose AK, Crippen GM. Atomic physicochemical parameters for three-dimensional-structure-directed quantitative structure-activity relationships. 2. Modeling dispersive and hydrophobic interactions. J Chem Inf Comput Sci. 1987;27:21–35. doi: 10.1021/ci00053a005. [DOI] [PubMed] [Google Scholar]
- 33.Wang R, Fu Y, Lai L. A new atom-additive method for calculating partition coefficients. J Chem Inf Comput Sci. 1997;37:615–621. doi: 10.1021/ci960169p. [DOI] [Google Scholar]
- 34.http://chemprop.csail.mit.edu/
- 35.https://github.com/kmansouri/OPERA
- 36.Rong Y, Bian Y, Xu T, et al (2020) GROVER: self-supervised message passing transformer on large-scale molecular data. arXiv 1–13
- 37.Schütt KT, Kessel P, Gastegger M, et al. SchNetPack: a deep learning toolbox for atomistic systems. J Chem Theory Comput. 2019;15:448–455. doi: 10.1021/acs.jctc.8b00908. [DOI] [PubMed] [Google Scholar]
- 38.https://github.com/samplchallenges/SAMPL7/blob/master/physical_property/logP/analysis/logP_predictions/logp_DB3.csv.
- 39.Xiong Z, Wang D, Liu X, et al. Pushing the boundaries of molecular representation for drug discovery with the graph attention mechanism. J Med Chem. 2020;63:8749–8760. doi: 10.1021/acs.jmedchem.9b00959. [DOI] [PubMed] [Google Scholar]
- 40.Danielle T, Orcid B, Orcid NT, et al. Evaluation of logP , pKa , and log D predictions from the SAMPL7 blind challenge. J Comput Aided Mol Des. 2021;4:1–32. [Google Scholar]
- 41.Artrith N, Butler KT, Coudert F-X, et al. Best practices in machine learning for chemistry. Nat Chem. 2021;13:505–508. doi: 10.1038/s41557-021-00716-z. [DOI] [PubMed] [Google Scholar]
- 42.Fujita T, Iwasa J, Hansch C. A new substituent constant, ir, derived from partition coefficients. J Am Chem Soc. 1964;86:5175–5180. doi: 10.1021/ja01077a028. [DOI] [Google Scholar]
- 43.Wimley WC, Creamer TP, White SH. Solvation energies of amino acid side chains and backbone in a family of host-guest pentapeptides. Biochemistry. 1996;35:5109–5124. doi: 10.1021/bi9600153. [DOI] [PubMed] [Google Scholar]
- 44.Sangster J. Octanol-water partition coefficients: fundamentals and physical chemistry. New York: Wiley-VCH Verlag GmbH; 1997. [Google Scholar]
- 45.Port A, Bordas M, Enrech R, et al. Critical comparison of shake-flask, potentiometric and chromatographic methods for lipophilicity evaluation (log Po/w) of neutral, acidic, basic, amphoteric, and zwitterionic drugs. Eur J Pharm Sci. 2018;122:331–340. doi: 10.1016/j.ejps.2018.07.010. [DOI] [PubMed] [Google Scholar]
- 46.Pallicer JM, Calvet C, Port A, et al. Extension of the liquid chromatography/quantitative structure-property relationship method to assess the lipophilicity of neutral, acidic, basic and amphotheric drugs. J Chromatogr A. 2012;1240:113–122. doi: 10.1016/j.chroma.2012.03.089. [DOI] [PubMed] [Google Scholar]
- 47.Brittain HG, Florey K (1992) Analytical profiles of drug substances and excipients: preface. Anal Prof Drug Subst Excip 21: 1-4 [DOI] [PubMed]
- 48.Cysewski P. Intermolecular interaction as a direct measure of water solubility advantage of meloxicam cocrystalized with carboxylic acids. J Mol Model. 2018 doi: 10.1007/s00894-018-3649-0. [DOI] [PMC free article] [PubMed] [Google Scholar]
Associated Data
This section collects any data citations, data availability statements, or supplementary materials included in this article.