

Abstract
Background:
Patients with mood disorders may benefit from psychosocial interventions through changes in brain networks underlying emotion processing. In this study, we used functional magnetic resonance imaging (fMRI) to investigate treatment-related changes in emotion processing networks in youth at familial high risk for bipolar disorder (BD).
Methods:
Youth, ages 9–17, were randomly assigned to family-focused therapy for high-risk youth (FFT-HR) or an active comparison treatment, Enhanced Care (EC). Before and after these 4-month treatments, participants underwent fMRI while viewing happy, fearful, and calm facial expressions. Twenty youth in FFT-HR and 20 in EC were included in analyses of pre- to post-treatment changes in activation across the whole brain. Significant clusters were assessed for correlation with mood symptom improvement.
Results:
In the dorsolateral prefrontal cortex (DLPFC), activation increased from pre- to post-treatment in the FFT-HR group and decreased in the EC group. Insula activation decreased in the FFT-HR group and did not change in the EC group. Across both treatments, decreasing activation in the hippocampus and amygdala was correlated with pre- to post-treatment improvement in hypomania, while increasing activation in the DLPFC was correlated with pre- to post-treatment improvement in depression.
Discussion:
Psychosocial treatment addresses abnormalities in emotion regulation networks in youth at high risk for BD. Increased prefrontal cortex activation suggests enhanced emotion regulation from pre- to post-treatment with FFT-HR. Improvements in family interactions may facilitate the development of prefrontal resources that provide protection against future mood episodes.
Keywords: mood disorder, neuroimaging, psychotherapy, youth
1 |. INTRODUCTION
Children and adolescents who have symptoms of depression, anxiety, and mood instability as well as a parent with bipolar I or II disorder (BD) are at high risk for developing BD over periods of up to 8 years.1 Whether they develop fully syndromal BD, symptoms of depression, and hypomania can significantly impact daily functioning and impair academic, social, and neural development.2–4 To reduce suffering and impairment in these youth, it is important to provide treatments that stabilize mood, improve functioning, and reduce the likelihood of recurrent mood episodes.5 It is also important to better understand how these treatments impact brain function in youth at high risk for BD. Examining neurofunctional changes associated with psychosocial interventions for youth at high risk for BD may advance our understanding of developmental processes associated with mood disorder onset, and potentially inform biomarkers for personalized treatment.
Previous studies of the neural correlates of treatments for BD support the hypothesis that brain networks underlying emotion processing undergo changes during treatment. Pharmacological treatment is associated with pre- versus post-treatment increases in activation of the ventrolateral prefrontal cortex (VLPFC)6,7 and pre- minus post-treatment decreases in activation of the amygdala.6,8,9 In youth at high risk for BD taking divalproex, pre- minus post-treatment decreases in frontal cortex activation were correlated with pre- minus post-treatment improvement in symptoms of depression.10 In one of the few treatment studies using non-pharmacological interventions for youth at risk for BD, decreases in anxiety during mindfulness-based cognitive therapy were associated with pre-/post-treatment increases in insula and cingulate cortex.11
Our group previously conducted a pilot neuroimaging study of Family Focused Therapy for youth at high risk for bipolar disorder (FFT-HR) versus an active psychoeducational comparison treatment. FFT-HR is an evidence-based 12-session treatment that teaches communication and problem-solving skills to patients, caregivers, and siblings, resulting in symptom improvement and reduced mood recurrences. We found that DLPFC activation increased from pre- to post-treatment, and was correlated with improvement in symptoms of mania.12 However, in that study, the sample (N = 12) was not large enough to identify pre- minus post-treatment changes specific to FFT-HR. In the current study, we present results from an entirely new and larger sample of youth in which we examined changes in activation across the whole brain, measured before and after a 4-month FFT-HR treatment compared to a 4-month comparison treatment, Enhanced Care (EC), that provides psychoeducation. We used a facial expressions task during fMRI for several reasons, including continuity with our previous study in a different sample,12 its relevance to mood disorders as a probe of affective responses, and expectations that psychotherapy will be associated with a change in affective responses.
Based on the results of our pilot study, we hypothesized that brain networks underlying emotion processing would undergo changes in association with treatment, and neural changes in the DLPFC would be more prominent in FFT-HR than in EC, related to FFT-HR’s focus on communication and problem solving.
2 |. MATERIALS AND METHODS
2.1 |. Participants
The study was approved by the Institutional Review Boards of Stanford University and UCLA, and written consent or assent was obtained from all participants. Participants were recruited, treated, and scanned at one of two sites: Stanford University (P.I. Kiki Chang) or University of California, Los Angeles (UCLA) (P.I. David Miklowitz). A full description of the larger treatment trial is provided elsewhere.13 Briefly, criteria for inclusion were (1) age 9–17 and (2) meets DSM-IV criteria for major depressive disorder (MDD) or bipolar disorder not otherwise specified (BD-NOS). BD-NOS was defined as distinct periods of abnormally elevated, expansive, or irritable mood plus 2 (or 3 if irritable mood only) symptoms of mania that caused a change in functioning and lasted at least 4 hours in a day and occurred 10 or more days in the lifetime4; (3) at least one first- or second-degree relative with DSM-IV BD I or BD II (described below); (4) significant current mood symptoms, defined as a score >11 on the Young Mania Rating Scale (YMRS),14 or a score >29 on the Children’s Depression Rating Scale–Revised (CDRS-R)15; and (5) no previous manic or mixed episode according to DSM-IV criteria. Exclusion criteria included developmental disorders, neurological conditions or major medical illness, substance use disorder, IQ less than 80, MRI contraindications (metal in the body), or orthodontic braces.
2.2 |. Clinical assessments
All assessments were administered by reliable trained raters. Symptom severity was assessed at pre- and post-treatment using the Young Mania Rating Scale (YMRS)14 to measure symptoms of mania in past week, and the Children’s Depression Rating Scale (CDRS-R)15 to measure symptoms of depression during the past 2 weeks. Parental diagnoses of BD I or II were obtained by interviewing at least one biological parent using the Mini International Neuropsychiatric Interview (MINI).16 First- or second-degree relatives who were not available for interview were diagnosed based on secondary information provided by one or both biological parents using the Family History Screening Instrument.17 Primary and comorbid diagnoses were assessed based on Kiddie Schedule for Affective Disorders and Schizophrenia for School-Age Children—Present and Lifetime (K-SADS-PL)18 interviews of the child and at least one parent (regarding the child). Final DSM-IV diagnoses were determined during a consensus meeting including the K-SADS interviewer and a board-certified child psychiatrist or licensed psychologist.
2.3 |. Family-focused therapy (FFT-HR) and enhanced care (EC) treatments
Participants were randomly assigned to either Family Focused Therapy (FFT-HR) or the active comparison treatment, Enhanced Care (EC). Both of these treatments included medication management from a study-affiliated psychiatrist, using a pharmacotherapy protocol.19 The FFT-HR sessions included the patient, parents/caregivers, and siblings when possible. FFT-HR was delivered in 12 one-hour sessions over 4 months (8 weekly and 4 biweekly) and was comprised of three modules: psychoeducation about managing depression and mood swings, enhancing family communication, and problem-solving skills training. The EC protocol also lasted 4 months, but consisted of 3 weekly family psychoeducation sessions followed by 3 monthly individual child sessions that focused on mood management.13 Overall, the treatments differed primarily in terms of the problem-solving and communication skills training provided to the family in the FFT-HR but not the EC treatment.
2.4 |. Facial expression task during fMRI
Emotional facial expressions were presented in a block design including happy, fearful, and calm faces from the McArthur (‘NimStim’) set (macbrain.org/resources.htm). A ‘scrambled’ image was used as the comparison condition, to control for viewing a complex visual stimuli and pushing a button. Four (non-repeated) blocks of each face condition were shown, and each block contained eight pictures. Each picture was shown for 3 s with no inter-stimulus interval. Total task duration was 6.4 min. Subjects pressed button 1 for female and button 2 for male models. Subjects alternately pushed buttons 1 or 2 for the scrambled pictures. Stimuli were presented using ePrime software (www.pstnet.com), which also collected responses. Analyses of task accuracy and response times were conducted using SPSS software to examine changes in accuracy from pre- to post-treatment, within and across the FFT-HR and EC groups, as well as the interaction of group (FFT-HR vs. EC) × time (pre vs. post). Analyses were conducted across facial expression types, with post-hoc analyses of face type (happy, fearful, calm) when appropriate.
2.5 |. Neuroimaging cross-site reliability
Data from our analyses of cross-site reliability are presented in the supplemental materials. In addition, the same proportion of subjects in each treatment group was scanned at each site, and whole-brain analyses were statistically adjusted for the effects of study site.
2.6 |. FMRI scan parameters
Before the scan, participants completed a mock scanner session in which they became familiar with the sounds and confines of the scanner and were trained to hold still for up to 10 min. At Stanford, a 3 Tesla General Electric MR750 scanner with an 8-channel head coil was used for data collection, and at UCLA, a 3 Tesla Siemens TIM Trio with a 12-channel head coil was used. At both sites, a gradient echo-planar pulse sequence was used to acquire interleaved oblique slices parallel to the AC-PC plane. Scan parameters at both sites included: flip angle = 78 degrees; TE = 25; TR = 2 s; NEX = 1; field of view = 192 mm, slice thickness of 3.2 with 0.8 mm skip, inplane resolution 3 × 3 mm. Also, a high-resolution anatomical scan was collected in order to optimize registration to standard space.
2.7 |. FMRI data analysis
Preprocessing of fMRI data used SPM12 software (www.fil.ion.ucl.ac.uk/spm/) to spatially realign, normalize to an age-appropriate MNI template, and smooth images using a 5-mm full-width at half-maximum Gaussian kernel. Motion correction was accomplished using the ArtRepair toolbox (www.nitrc.org/projects/art_repair) to remove motion artifacts time points, defined as rapid motion > 0.5 mm/TR or translation >3 mm, and replaced with a time point interpolated from the surrounding unaffected volumes. Scans that required repair of more than 25% of the fMRI time series were rejected from further analysis. A high-pass temporal filter was used to remove slow signal drift.
Individual statistics were calculated at the whole-brain level using fixed-effects general linear models in SPM12. The task was modeled as 24-s blocks convolved with the hemodynamic response function. Contrasts included happy minus scrambled, fearful minus scrambled, and calm minus scrambled pictures. Whole-brain voxel-wise analyses of changes in activation from pre- to post-treatment were conducted using the ‘Multivariate and Repeated Measures for Neuroimaging’ (MRM) toolbox, implemented in matlab R2016b (mathworks.com). The MRM toolbox allows advanced statistical modeling of repeated measures mixed effects designs using a multivariate form of the general linear model.20 Analyses in MRM tested for the main effect of time (pre- vs. post-treatment) across both groups, as well as the interaction of group (FFT-HR vs. EC) by time (pre- vs. post-treatment), adjusted for site (Stanford vs. UCLA). Statistical thresholds were set using permutation-based inference, with a cluster-setting threshold of p = .001 and family-wise error correction of p < .05 at the cluster level, following the recommendations of Eklund.21
Follow-up analyses were conducted to determine if significant group × time clusters were associated with symptom improvement, as opposed to other factors such as the passage of time, effects of repeated scanning, or nonspecific group differences. For the correlation analysis, average activation in each cluster was extracted using the REX toolbox22 and exported to SPSS software version 25 (www.ibm.com). Correlations were calculated as Spearman’s rho for non-parametric data. Bonferroni corrections for multiple comparisons were applied by dividing by the p-value by the number of activation clusters included in the correlation analysis. To limit the number of correlations, we conducted correlations across all facial expressions combined. For regions showing trends, we explored correlations associated with each face type (happy, fear, calm) separately.
3 |. RESULTS
3.1 |. Participants included/excluded from neuroimaging
Of 147 subjects randomized to treatment in the clinical trial, 20 were excluded due to administrative withdrawals (most commonly, missing data supporting eligibility for study inclusion). Of the remaining 127, 46 were not included in neuroimaging procedures because they were enrolled at the University of Colorado site, which did not conduct neuroimaging. Four subjects were not scanned because they began treatment before the scan protocol was finalized and 3 after scanner hardware was upgraded. Ten subjects were excluded from scanning due to orthodontic braces, 2 to a comorbid neurological disorder, and 3 for other reasons. This left 59 subjects who participated in the neuroimaging portion of the study. Of these, scan data from five subjects were removed due to technical errors during scan prescription or acquisition (3 in FFT-HR and 2 in EC). An additional 11 subjects were removed for having pre-treatment but no post-treatment scans (6 in FFT-HR and 5 in EC). Reasons for having no post-treatment scan included dropping out of the study before beginning treatment (1 in FFT-HR and 4 in EC), getting braces during treatment (1 in FFT-HR and 1 in EC), or declining to have the scan (4 in FFT-HR and 0 in EC). This left 43 participants with both pre- and post-treatment scans. Of these, 1 did not complete the faces task and 2 had excessive head motion artifact, leaving 40 subjects with high-quality scan data at both pre- and post-treatment comprising the sample for analysis: 20 in FFT-HR and 20 in EC.
3.2 |. Participant characteristics
Table 1 provides demographic, task performance, and clinical information for the 40 participants included in our analysis. The FFT-HR and EC groups did not differ in terms of age, gender, or proportion from the UCLA versus the Stanford site. In terms of task performance, both groups had greater than 90% accuracy on the facial expression task at both pre- and post-treatment, indicating compliance with the simple task demands. There was a main effect of group on response time for all faces combined (F (1,36) = 5.5, p = .025), which was attributed to slower response times in the EC group at pre-treatment (mean difference 123 ms; t (36) = 2.4, p = .024) and a trend at post-treatment (mean difference 90 ms; t (36) = 1.9, p = .062). The group × time interaction was not significant for response time. There were no significant changes from pre- to post-treatment in accuracy or response time across groups, and no group × time interactions for accuracy. Task performance data were not available for two subjects in the FFT-HR group at post-treatment, however, these subjects had completed neuroimaging and were included in all neuroimaging analyses.
TABLE 1.
Demographic and clinical description of groups
| Family-focused therapy for high-risk youth (N = 20) | Enhanced care (N = 20) | FFT-HR vs. EC p-value | |
|---|---|---|---|
| Age, mean (SD) | 14.1 (2.5) | 13.04 (2.9) | p = .25 |
| Female/male | 45% F/55% M | 55% F/45% M | p = .53 |
| Site | 12 (60%) UCLA | 9 (45%) UCLA | p = .34 |
| 8 (40%) stanford | 11 (55%) stanford | ||
| Faces task accuracy @ pre-treatment | 96% | 95% | p = .39 |
| Faces task accuracy @ post-treatment | 96% | 93% | p = .12 |
| Primary diagnoses | |||
| BD NOS | 25% | 55% | p = .053 |
| MDD | 75% | 45% | |
| Comorbid diagnosesa | |||
| ADHD | 25% | 25% | p = 1.0 |
| Anxiety disorder | 60% | 50% | p = .53 |
| Oppositional defiant disorder | 20% | 15% | p = .68 |
| Psychiatric medications at baselineb | |||
| No meds | 6 (30%) | 11 (55%) | p = .11 |
| Stimulants | 5 (25%) | 5 (25%) | p = 1.0 |
| Antidepressants | 10 (50%) | 4 (20%) | p = .047 |
| Antipsychotics | 4 (20%) | 7 (35%) | p = .30 |
| Anticonvulsants | 6 (30%) | 10% 2(10%) | p = .11 |
| Symptom severityc | |||
| Depression at pre-treatment | 46.6 (11.8) | 50.4 (16.7) | p = .41 |
| Depression at post-treatment | 41.7 (13.5) | 37.3 (15.2) | p = .34 |
| Mania at pre-treatment | 9.4 (7.4) | 13.6 (6.2) | p = .06 |
| Mania at post-treatment | 9.3 (6.2) | 10.4 (6.2) | p = .58 |
BD NOS = bipolar disorder not otherwise specified; MDD = major depressive disorder.
Other infrequent comorbid diagnoses that did not differ between groups include trichotillomania (5% in FFT; 0% in EC); dysthymia (5% each group); DMDD (5% in each group); and substance abuse (5% FFT; 0% EC).
Other infrequent medications include anxiolytics (1 in the EC group).
Depression symptom severity = total score on the Children’s Depression Rating Scale (CDRS); Mania symptom severity = total score on the Young Mania Rating Scale (YMRS).
The FFT-HR and EC groups did not differ significantly in terms of primary diagnosis or comorbid diagnoses, although there was a trend for more MDD versus BD-NOS diagnoses in the FFT-HR group (Chi-square(1) = 3.75, p = .053). The groups did not differ in the proportions of children taking no medications or taking stimulants, antipsychotics, or anticonvulsants. There were significantly more participants in the FFT-HR group taking antidepressants compared to the EC group (Chi-square = 3.96, p = .047). There were no group × time interactions on mood symptoms (CDRS-R and YMRS), indicating no differences between the groups in symptom improvement over 4 months. Although four participants in the larger clinical trial reported using nicotine, none of these participants were among those included in the neuroimaging analysis. Six participants in the FFT group and eight in the EC group reported drug use (p > .10). The number of participants reporting use of the substance more than 1–2 times per month did not differ between groups, nor were there differences in the frequency of use of specific substances.
3.3 |. FMRI results
A significant main effect of time was found for the whole-brain voxel-wise analysis, including all subjects in both groups, as shown in Figure 1. Significant clusters were located in the VLPFC (Brodmann’s Area 47), the hippocampus/amygdala (one cluster that included both regions), dorsal caudate, visual cortex, and post-central gyrus. All clusters decreased from pre- to post-treatment, except for the visual cortex, which increased. The effects were significant for all facial expressions combined (happy, fear, calm). The interaction of facial expression × time was not significant, indicating that treatment effects were similar across all facial expressions.
FIGURE 1.
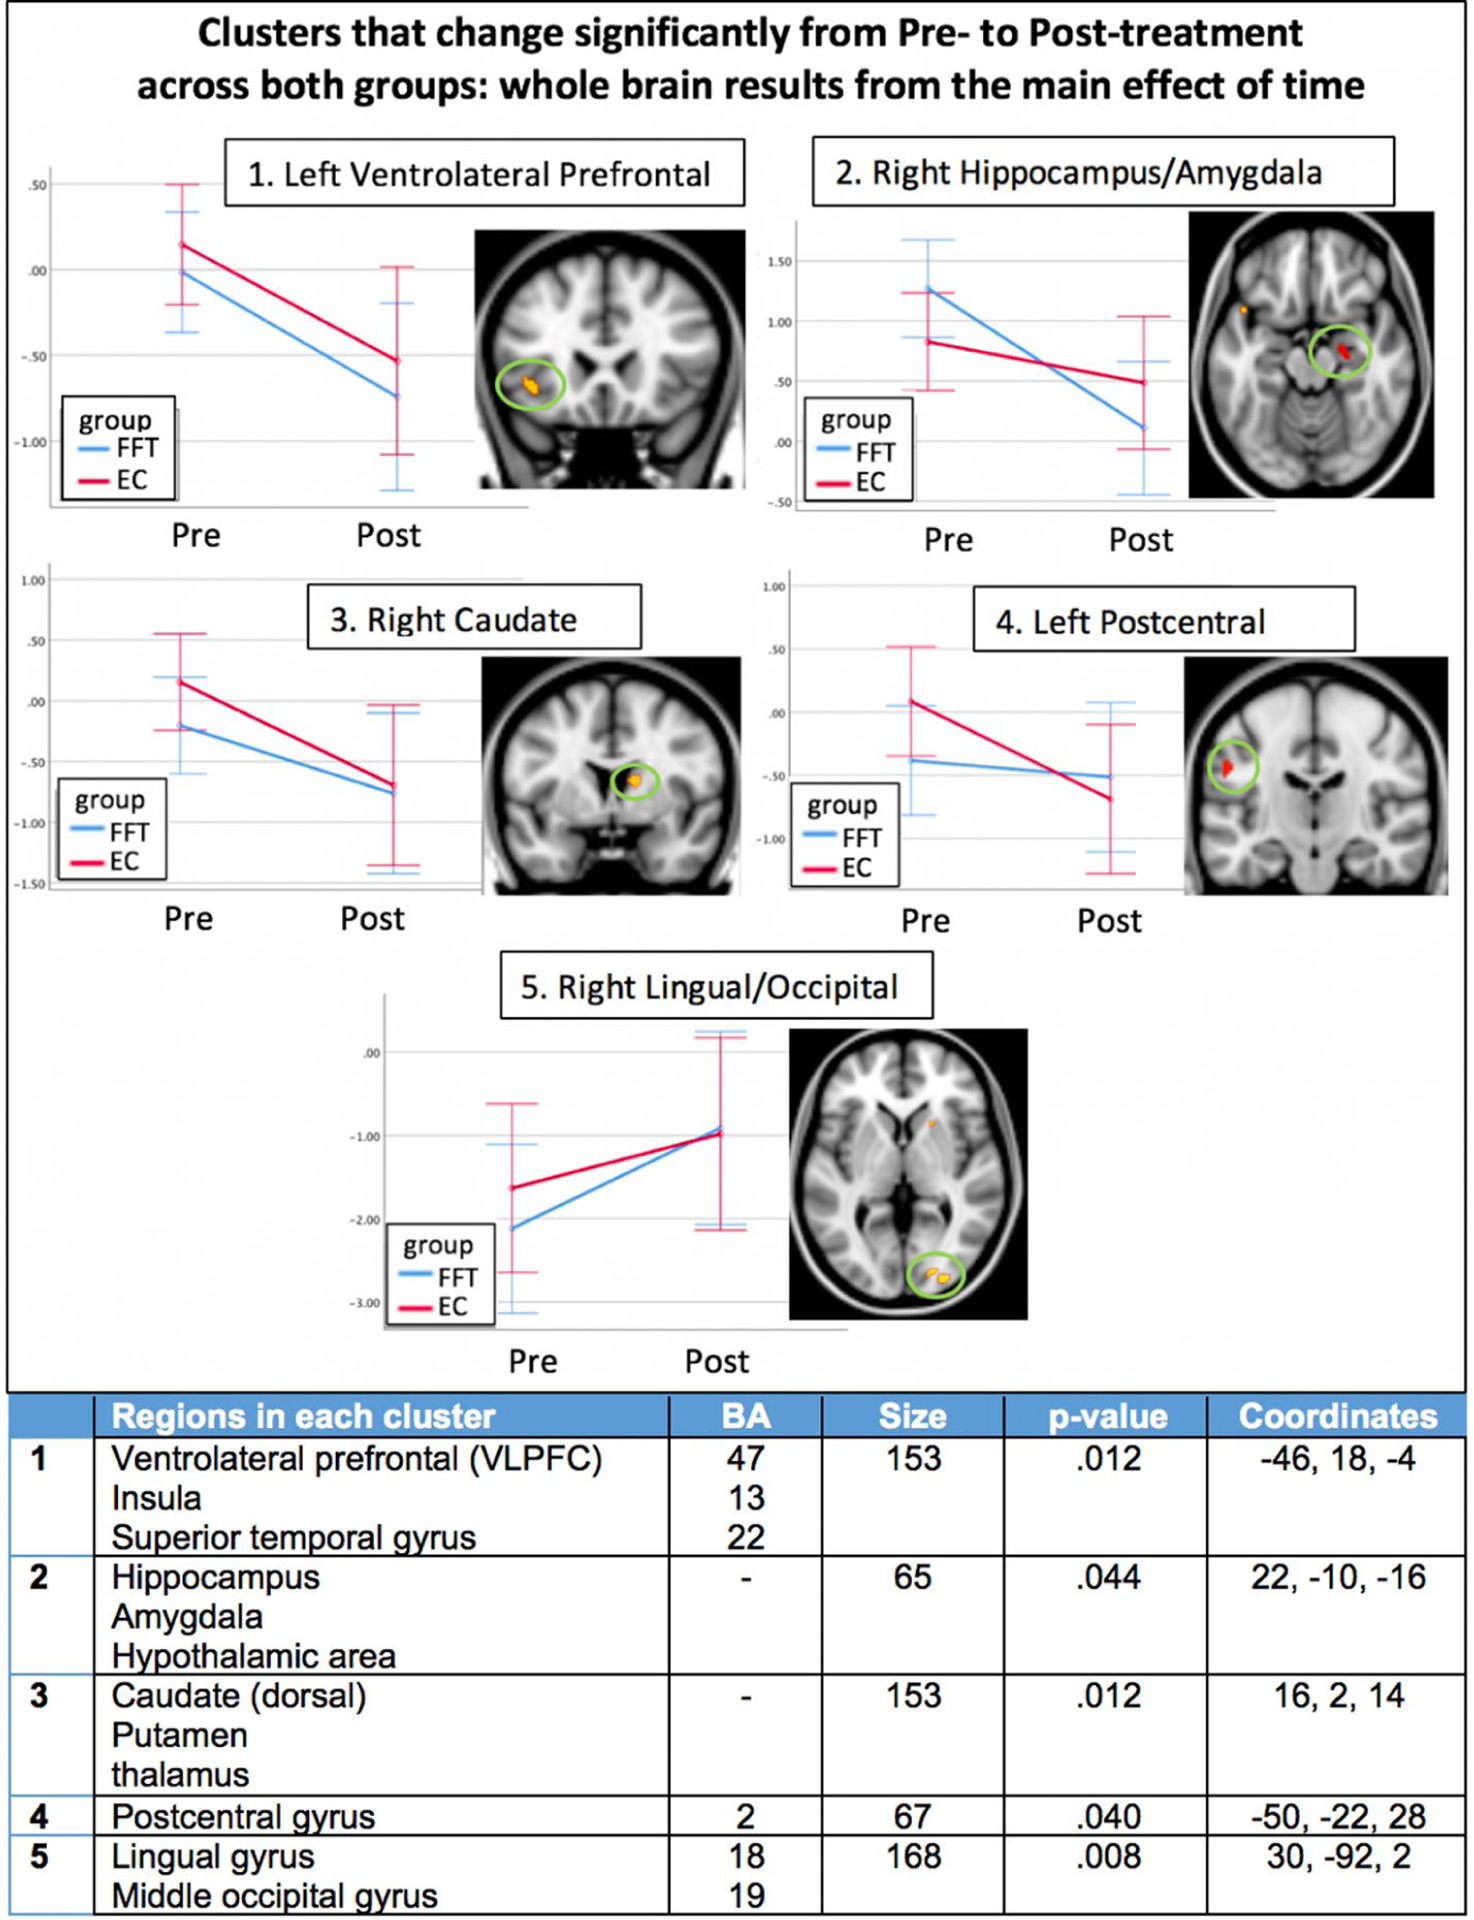
Clusters of activation that changed significantly from pre- to post-treatment for both groups (main effect of time) across all face types. All clusters survive family-wise error correction for multiple comparisons at the cluster level (p < 0.05), and color scale of the clusters indicates p-value, as listed in table below. Each cluster is shown next to a graph of pre- to post-treatment changes. The y-axis units are adjusted marginal means of the contrast value, adjusted for site. Graphs are for illustrative purposes to aid with interpretation of the statistically significant clusters. Details of each cluster are given in the table; EC, enhanced care; FFT, family focused therapy; Pre, pre-treatment; Post, post-treatment
Follow-up correlations were conducted to better understand the nature of pre minus post-treatment changes in each significant cluster from the main effect of time analysis. Correlations with symptoms of depression or mania were not significant using a Bonferroni-corrected p-value of .01 (.05/5 clusters). Exploratory post-hoc correlations for each type of facial expression separately revealed that pre- minus post-treatment changes in activation of the hippocampus/amygdala cluster when viewing happy faces were significantly correlated with pre- minus post-treatment improvement in symptoms of mania (YMRS score, rho = −.41, p = .008), shown in Figure 3(B).
FIGURE 3.

Correlations between symptom change and significant clusters from the fMRI analysis: a) from the group × time analysis, the DLPFC cluster is correlated with pre/post improvement in depression severity across both treatment groups; b) from the main effect of time analysis, pre/post decreases in the hippocampus/amygdala cluster are correlated with decreasing symptoms of mania in both treatment groups combined, for happy faces only
A significant interaction of group (FFT-HR vs. EC) × time (pre- versus post-treatment) was found in the whole-brain voxel-wise analysis, as shown in Figure 2. The only significant clusters were the left DLPFC (BA 9 extending into BA 6/8) and the right insula. For the DLPFC cluster, activation increased significantly from pre- to post-treatment in the FFT-HR group (t(19) = 3.8, p = .001) and decreased significantly in the EC group (t(19) = 3.2, p = .005). In the insula, activation decreased in the FFT-HR group (t(19) = 3.1, p = .006) and did not change in the EC group (p = .24) from pre- to post-treatment.
FIGURE 2.

Significant clusters from the group × time interaction, indicating regions of group differences in pre- to post-treatment change. All clusters survive family-wise error correction for multiple comparisons at the cluster level (p < 0.05), and color scale of the clusters indicates p-value, as listed in table below. Each cluster is shown next to a graph of pre- to post-treatment changes. The y-axis units are adjusted marginal means of the contrast value, adjusted for site. Graphs are for illustrative purposes to aid with interpretation of the statistically significant clusters. Details of each cluster are given in the table; EC, enhanced care; FFT, family focused therapy; Pre, pre-treatment; Post, post-treatment
Follow-up correlations were conducted to determine if significant group × time clusters from the whole-brain analysis were associated with symptom improvement. These analyses revealed a significant correlation between pre- minus post-treatment increases in DLPFC activation and improvement in CDRS depression severity across both groups (rho = .49, p = .001), using a Bonferroni-corrected threshold of p = .05/2 clusters = .01. The scatterplot is shown in Figure 3(A). Pre- minus post-treatment changes in the insula were not correlated with improvement in symptoms of depression or mania.
3.4 |. Effects of medications
We examined the possibility that medications taken by subjects influenced our neuroimaging findings. For each of our neuroimaging findings, we compared effect sizes with versus without subjects for each class of medication. Results (see Table S4) showed that effect sizes varied slightly with versus without medication, but variations did not exceed 0.09, which indicates a small change in effect size. The only exception was the insula, where effect sizes dropped markedly when subjects taking antidepressant medications were excluded.
3.5 |. Effects of age
Although the FFT-HR and EC groups were not significantly different by age, we recalculated the voxel-wise analysis including age as covariate. For the group × time interactions, results were unchanged in the DLPFC (p = .008) and the correlation between DLPFC and depression symptom improvement remained significant (p = .001) with age covaried. The group × time effect became marginally significant in the insula (p = .052, originally p = .034). For the main effect of time, results remained significant in the VLPFC (p = .020), caudate (p = .028), and lingual gyrus (p = .030), and became marginally significant for the hippocampus/amygdala (p = .058, originally p = .044) and postcentral gyrus (p = .056, originally p = .040). Post-hoc correlations between hippocampus/amygdala and improvement in symptoms of mania remained significant after adjusting for age (p = .028). A separate correlation analysis was conducted across groups, and none of the clusters or changes in clusters were significantly correlated with age. Thus, there were minimal effects of age in each of these analyses.
3.6 |. Associations with therapy attendance
Although the FFT-HR and EC treatments were designed to differ in terms of number of protocol visits, there was no difference in the proportion of protocol therapy sessions attended for FFT-HR (proportion of 12 sessions) versus EC (proportion of 6 sessions). Across groups, there were no correlations between proportion of sessions attended and any of the fMRI findings. Furthermore, the group × time interaction in the DLPFC and insula remained significant while covarying for proportion of sessions attended, suggesting negligible effects of attendance on fMRI group differences.
4 |. DISCUSSION
This study examined changes in brain function from before to after 4 months of FFT-HR compared to a 4-month psychoeducational treatment for youth at high symptomatic and familial risk for BD. Our results suggest that brain networks underlying emotion regulation undergo measurable changes that are associated with mood improvement, and that the two treatments show evidence of separable neural correlates. Whereas the FFT-HR group showed increasing activation in the DLPFC and decreasing activation in the insula from pre- to post-treatment, the EC group showed decreasing DLPFC and no change in insula activation. Furthermore, pre- minus post-treatment decreases in the hippocampus and amygdala, found in both groups, were correlated with improvement in symptoms of hypomania, while pre- minus post-treatment increases in the DLPFC were correlated with improvement in depression. These results advance our understanding of the neurobiological correlates of symptom improvement in high-risk youth.
The brain regions that we identified as changing with treatment are consistent with those showing abnormalities in youth with mood disorders. A coordinate-based meta-analysis of 29 previous studies showed that the brain regions consistently reported as abnormal in fMRI studies of youth at high risk for BD include the DLPFC, insula, and cerebellum, whereas youth with a diagnosis of bipolar disorder consistently show abnormalities in these same regions and also in the amygdala, parahippocampal gyrus, medial frontal, ventral striatum, and VLPFC.23 Our current study found pre- minus post-treatment-treatment changes in four of these regions: DLPFC, insula, amygdala, and VLPFC. Furthermore, human and non-human tract-tracing studies report connections among these regions, suggesting networks that support the experience and modulation of emotion.24,25 Taken together, these data suggest that psychosocial treatment is associated with improvement in the functioning of emotion regulation networks in youth at high risk for BD.
Our finding of enhanced engagement of the DLPFC from pre- to post-FFT-HR replicates our previous study conducted in a small sample of adolescents at high risk for BD, in which we found increasing DLPFC activation from pre- to post-treatment across both FFT-HR and EC treatments.12 Pre- minus post-treatment changes in the DLPFC also have been reported in previous treatment studies of pharmacological treatments for mood disorders, including decreases in DLPFC activation in adolescents with BD undergoing treatment with divalproex,10 pre- minus post-treatment increases in the volume of the DLPFC in adults with BD who responded to lithium treatment,26 and increases in the thickness of the DLPFC in adults with depression who responded to antidepressant treatment.27 Previous studies also showed that functional activation of the DLPFC increases with remission from mania in adults with BD,28 and pre- minus post-treatment increases in DLPFC activity were consistently reported across 60 studies of depressed adults receiving antidepressant treatments.29 Furthermore, the left DLPFC is the site targeted by transcranial magnetic stimulation for the treatment of depression.30 These studies are part of the growing evidence that the DLPFC plays a role in modulating mood symptoms through its broader role in emotion regulation. Emotion regulation is considered one of the executive control processes mediated by the DLPFC, as confirmed by numerous studies in healthy participants (Brandl et al., 2019). Our current study suggests that FFT-HR treatment is associated with enhanced engagement of the DLPFC, suggesting improvements in emotion regulation. Emotion regulation may be enhanced during FFT-HR through training patients and parents in communication and problem-solving skills, leading to more constructive and less conflictual family interactions.
The insula also showed differential response to FFT-HR versus EC treatment. Abnormal insula function and structure have been reported in major depressive disorder (for a recent review, see Ref. [31]), although we did not find correlations between pre- minus post-treatment changes in insula activation and pre- minus post-treatment improvement in depression. The insula is strongly implicated in interoception and is activated by autonomic arousal and anxiety,32,33 therefore decreased activation of the insula in the FFT-HR group could be related to improvement in symptoms of anxiety. However, post-hoc analyses of improvement in anxiety, as measured by the Screen for Child Anxiety Related Disorders (SCARED34), did not differ between groups, and was not correlated with insula activation. Instead, the group × time interaction in the insula could be attributable to group differences in the number of youth taking antidepressant medications. Post-hoc sensitivity analyses showed a substantial decrease in effect size for the insula when removing participants taking antidepressants. This interpretation is supported by previous studies showing changes in insula connectivity during antidepressant treatment35 and abnormalities in insula connectivity as a predictor of response to antidepressants.36,37
Pre- minus post-treatment decreases in amygdala and hippocampus activation were seen in both groups. The amygdala has been a focus of research on pediatric bipolar disorder for decades38 with growing evidence of abnormal connectivity with VLPFC.39–41 There is evidence that amygdala activation decreases with remission from mania9 and with pharmacological treatment.6 Although less frequently a focus of research in BD, it makes sense that alterations in hippocampal activation are associated with treatment, given the observation that hippocampal neurons change cellular structure in association with antidepressant treatment and with stress (for a review, see Ref. [42]). The results of our current study are consistent with previous studies in showing that reactivity of the amygdala and hippocampus decreases with symptom improvement.
Other brain regions were observed to change across both groups (including the VLPFC, caudate, and visual cortex), although pre- minus post-treatment changes in these regions were not significantly correlated with symptom improvement. In previous medication treatment studies of pediatric BD, pre- minus post-treatment changes in VLPFC activation have been frequently reported, and were correlated with symptom changes in some studies6 but not others.7,43,44 It is possible that changes in the VLPFC reflect treatment-related improvement in neuropsychological functioning, such as decision making, memory, or response inhibition. Future studies could include neuropsychological assessments and test for treatment-related improvements and correlation with brain function.
Limitations of our study include heterogeneity in terms of youths’ comorbid diagnoses. We chose this sample to represent the population of youth at high risk for bipolar disorder, in which comorbid diagnoses are common.45 Our sample size is small compared to other randomized clinical trials, but it is on par or larger than previous neuroimaging studies of treatment mechanisms. Nearly half of the youth in this study were taking psychoactive medications, but it would have been unethical to request patients to stop medications for the study. We took steps to maintain consistency during the study by requiring that psychiatrists follow a standardized medication protocol. To confirm that medications did not account for our primary results, we conducted a post-hoc analysis comparing effect sizes of all clusters with and without the medicated subjects, and determined that only the insula cluster was attributable to group differences in antidepressant medications.
There are potential sources of variability when combining neuroimaging data collected at two sites, but we took every precaution to carefully match scan parameters and test image comparability before recruiting subjects. Furthermore, the same proportion of subjects in each group were scanned at each site, and we adjusted statistically for the effects of site during analyses. Group differences in primary diagnosis were nonsignificant but trended toward disproportionately more participants with MDD in the FFT-HR group. However, follow-up analyses adjusting for primary diagnosis did not change the results, nor was primary diagnosis a significant contributor to the models examining treatment × time interactions on the DLPFC and insula. Finally, while changes in activation can occur for many reasons, such as the passage of time, repeated exposure to the task stimuli, or other factors, previous studies in healthy control adolescents performing a similar facial expressions task found no significant changes in activation over a 5-month period.46
In conclusion, our study provides valuable information about the neural mechanisms of psychosocial therapy in general, and FFT-HR specifically, in youth at high risk for BD. Additional research is needed to determine how neural correlates of symptom improvement can be used clinically as biomarkers of treatment response.
Supplementary Material
ACKNOWLEDGEMENTS
This study was supported in part by grants R01MH093676 (Drs. Miklowitz), R01MH093666 (Chang), and K01MH097769 (Garrett) and the Brain and Behavior Research Foundation (Chang).
Funding information
National Institute of Mental Health, Grant/Award Number: K01MH097769, R01MH093666 and R01MN093676; Brain and Behavior Research Foundation
DISCLOSURES
Dr. Garrett received research support from the National Institutes of Health and UT Health San Antonio Department of Psychiatry; Dr. Chang is a consultant for Abbvie, Impel Neuropharma, and Sunovion, and is on the speakers bureau for Sunovion. Dr. Singh has received research support from Stanford’s Maternal & Child Health Research Institute and Department of Psychiatry, National Institutes of Health, PCori, Johnson and Johnson, Allergan, and the Brain and Behavior Foundation. She is on the advisory board for Sunovion, Skyland Trail, and has been a consultant for X, Moonshot Factory, Alphabet Inc, and Limbix, and has received royalties from the American Psychiatric Association Publishing; Ms. Armstrong has no disclosures; Dr. Walshaw received research support from the National Institutes of Health, the National Institutes of Neurological Disorders and Stroke, and Second Sight Medical Products, Inc.; Dr. Miklowitz received research support from the National Institute of Mental Health (NIMH), the Danny Alberts Foundation, the Attias Family Foundation, the Carl and Roberta Deutsch Foundation, the Kayne Family Foundation, AIM Youth Mental Health, American Foundation for Suicide Prevention, and the Max Gray Fund; and book royalties from Guilford Press and John Wiley and Sons.
Footnotes
DATA AVAIL ABILIT Y STATEMENT
De-identified participant data are available beginning 01/01/2021. After approval of a proposal, researchers can access the data from the National Database for Clinical Trials Related to Mental Illness: https://catalog.data.gov/dataset/national-database-for-clinical-trials-related-to-mental-illness-ndct).
SUPPORTING INFORMATION
Additional supporting information may be found online in the Supporting Information section.
REFERENCES
- 1.Hafeman DM, Merranko J, Axelson D, et al. Toward the definition of a bipolar prodrome: dimensional predictors of bipolar spectrum disorders in at-risk youths. Am J Psychiatry. 2016;173(7):695–704. [DOI] [PMC free article] [PubMed] [Google Scholar]
- 2.Carlson GA, Findling RL, Post RM, et al. AACAP 2006 research forum-advancing research in early-onset bipolar disorder: barriers and suggestions. J Child Adolesc Psychopharmacol. 2009;19(1):3–12. [DOI] [PubMed] [Google Scholar]
- 3.Luby JL, Navsaria N. Pediatric bipolar disorder: evidence for prodromal states and early markers. J Child Psychol Psychiatry. 2010;51(4):459–471. [DOI] [PMC free article] [PubMed] [Google Scholar]
- 4.Birmaher B, Axelson D, Goldstein B, et al. Four-year longitudinal course of children and adolescents with bipolar spectrum disorders: the Course and Outcome of Bipolar Youth (COBY) study. Am J Psychiatry. 2009;166(7):795–804. [DOI] [PMC free article] [PubMed] [Google Scholar]
- 5.Miklowitz DJ, Schneck CD, Singh MK, et al. Early intervention for symptomatic youth at risk for bipolar disorder: a randomized trial of family-focused therapy. J Am Acad Child Adolesc Psychiatry. 2013;52(2):121–131. [DOI] [PMC free article] [PubMed] [Google Scholar]
- 6.Passarotti AM, Sweeney JA, Pavuluri MN. Fronto-limbic dysfunction in mania pre-treatment and persistent amygdala over-activity post-treatment in pediatric bipolar disorder. Psychopharmacology. 2011;216(4):485–499. [DOI] [PMC free article] [PubMed] [Google Scholar]
- 7.Diler RS, Ladouceur CD, Segreti AnnaMaria, et al. Neural correlates of treatment response in depressed bipolar adolescents during emotion processing. Brain Imaging Behav. 2013;7(2):227–235. [DOI] [PubMed] [Google Scholar]
- 8.Chang KD, Wagner C, Garrett A, et al. A preliminary functional magnetic resonance imaging study of prefrontal-amygdalar activation changes in adolescents with bipolar depression treated with lamotrigine. Bipolar Disord. 2008;10(3):426–431. [DOI] [PubMed] [Google Scholar]
- 9.Kaladjian A, Jeanningros R, Azorin J-M, et al. Remission from mania is associated with a decrease in amygdala activation during motor response inhibition. Bipolar Disord. 2009;11(5):530–538. [DOI] [PubMed] [Google Scholar]
- 10.Chang K, Karchemskiy A, Kelley R, et al. Effect of divalproex on brain morphometry, chemistry, and function in youth at high-risk for bipolar disorder: a pilot study. J Child Adolesc Psychopharmacol. 2009;19(1):51–59. [DOI] [PMC free article] [PubMed] [Google Scholar]
- 11.Strawn JR, Cotton S, Luberto CM, et al. Neural function before and after mindfulness-based cognitive therapy in anxious adolescents at risk for developing bipolar disorder. J Child Adolesc Psychopharmacol. 2016;26(4):372–379. [DOI] [PMC free article] [PubMed] [Google Scholar]
- 12.Garrett AS, Miklowitz DJ, Howe ME, et al. Changes in brain activation following psychotherapy for youth with mood dysregulation at familial risk for bipolar disorder. Prog Neuropsychopharmacol Biol Psychiatry. 2015;56:215–220. [DOI] [PMC free article] [PubMed] [Google Scholar]
- 13.Miklowitz DJ, Schneck CD, Walshaw PD, et al. Early intervention for youth at high risk for bipolar disorder: a multisite randomized trial of family-focused treatment. Early Interv Psychiatry. 2019;13(2):208–216. [DOI] [PMC free article] [PubMed] [Google Scholar]
- 14.Young RC, Biggs JT, Ziegler VE, et al. A rating scale for mania: reliability, validity and sensitivity. Br J Psychiatry. 1978;133:429–435. [DOI] [PubMed] [Google Scholar]
- 15.Mayes TL, Bernstein IH, Haley CL, et al. Psychometric properties of the children’s depression rating scale-revised in adolescents. J Child Adolesc Psychopharmacol. 2010;20(6):513–516. [DOI] [PMC free article] [PubMed] [Google Scholar]
- 16.Sheehan DV, Lecrubier Y, Sheehan KH, et al. The Mini-International Neuropsychiatric Interview (M.I.N.I.): the development and validation of a structured diagnostic psychiatric interview for DSM-IV and ICD-10. J Clin Psychiatry. 1998;59(Suppl 20):34–57. [PubMed] [Google Scholar]
- 17.Weissman MM. Brief screening for family psychiatric history: the family history screen. Arch Gen Psychiatry. 2000;57(7):675–682. [DOI] [PubMed] [Google Scholar]
- 18.Kaufman J, Birmaher B, Brent D, et al. Schedule for affective disorders and schizophrenia for school-age children-present and lifetime version (K-SADS-PL): initial reliability and validity data. J Am Acad Child Adolesc Psychiatry. 1997;36(7):980–988. [DOI] [PubMed] [Google Scholar]
- 19.Schneck CD, Chang KD, Singh MK, et al. A pharmacologic algorithm for youth who are at high risk for bipolar disorder. J Child Adolesc Psychopharmacol. 2017;27(9):796–805. [DOI] [PMC free article] [PubMed] [Google Scholar]
- 20.McFarquhar M, McKie S, Emsley R, et al. Multivariate and repeated measures (MRM): a new toolbox for dependent and multimodal group-level neuroimaging data. NeuroImage. 2016;132:373–389. [DOI] [PMC free article] [PubMed] [Google Scholar]
- 21.Eklund A, Nichols TE, Knutsson H. Cluster failure: why fMRI inferences for spatial extent have inflated false-positive rates. Proc Natl Acad Sci USA. 2016;113(28):7900–7905. [DOI] [PMC free article] [PubMed] [Google Scholar]
- 22.Duff EP, Cunnington R, Egan GF. REX: response exploration for neuroimaging datasets. Neuroinformatics. 2007;5(4):223–234. [DOI] [PubMed] [Google Scholar]
- 23.Lee MS, Anumagalla P, Talluri P, Pavuluri MN. Meta-analyses of developing brain function in high-risk and emerged bipolar disorder. Front Psychiatry. 2014;5:141. [DOI] [PMC free article] [PubMed] [Google Scholar]
- 24.Price JL. Prefrontal cortical networks related to visceral function and mood. Ann N Y Acad Sci. 1999;877:383–396. [DOI] [PubMed] [Google Scholar]
- 25.Ongur D, Price JL. The organization of networks within the orbital and medial prefrontal cortex of rats, monkeys and humans. Cereb Cortex. 2000;10(3):206–219. [DOI] [PubMed] [Google Scholar]
- 26.Selek S, Nicoletti M, Zunta-Soares GB, et al. A longitudinal study of fronto-limbic brain structures in patients with bipolar I disorder during lithium treatment. J Affect Disord. 2013;150(2):629–633. [DOI] [PubMed] [Google Scholar]
- 27.Saricicek Aydogan A, Oztekin E, Esen ME, et al. Cortical thickening in remitters compared to non-remitters with major depressive disorder following 8-week antidepressant treatment. Acta Psychiatr Scand. 2019;140(3):217–226. [DOI] [PubMed] [Google Scholar]
- 28.Alonso-Lana S, Moro N, McKenna PJ, et al. Longitudinal brain functional changes between mania and euthymia in bipolar disorder. Bipolar Disord. 2019;21(5):449–457. [DOI] [PubMed] [Google Scholar]
- 29.Ma Y Neuropsychological mechanism underlying antidepressant effect: a systematic meta-analysis. Mol Psychiatry. 2015;20(3):311–319. [DOI] [PubMed] [Google Scholar]
- 30.Brunoni AR, Sampaio-Junior B, Moffa AH, et al. Noninvasive brain stimulation in psychiatric disorders: a primer. Braz J Psychiatry. 2019;41(1):70–81. [DOI] [PMC free article] [PubMed] [Google Scholar]
- 31.Eggart M, Lange A, Binser M, Queri S, Müller-Oerlinghausen B. Major depressive disorder is associated with impaired interoceptive accuracy: a systematic review. Brain Sci. 2019;9(6):131. 10.3390/brainsci9060131. [DOI] [PMC free article] [PubMed] [Google Scholar]
- 32.Craig AD. Significance of the insula for the evolution of human awareness of feelings from the body. Ann N Y Acad Sci. 2011;1225:72–82. [DOI] [PubMed] [Google Scholar]
- 33.Craig AD. How do you feel–now? The anterior insula and human awareness. Nat Rev Neurosci. 2009;10(1):59–70. [DOI] [PubMed] [Google Scholar]
- 34.Birmaher B, Brent DA, Chiappetta L, et al. Psychometric properties of the screen for child anxiety related emotional disorders (SCARED): a replication study. J Am Acad Child Adolesc Psychiatry. 1999;38(10):1230–1236. [DOI] [PubMed] [Google Scholar]
- 35.Rütgen M, Pletti C, Tik M, et al. Antidepressant treatment, not depression, leads to reductions in behavioral and neural responses to pain empathy. Transl Psychiatry. 2019;9(1):164. [DOI] [PMC free article] [PubMed] [Google Scholar]
- 36.Abdallah CG, Averill LA, Collins KA, et al. Ketamine treatment and global brain connectivity in major depression. Neuropsychopharmacology. 2017;42(6):1210–1219. [DOI] [PMC free article] [PubMed] [Google Scholar]
- 37.Geugies H, Opmeer EM, Marsman JBC, et al. Decreased functional connectivity of the insula within the salience network as an indicator for prospective insufficient response to antidepressants. Neuroimage Clin. 2019;24:102064. [DOI] [PMC free article] [PubMed] [Google Scholar]
- 38.Chang KD. Amygdalar-prefrontal connectivity changes during adolescence: implications for development of mood disorders. Biol Psychiatry. 2017;82(7):458–459. [DOI] [PubMed] [Google Scholar]
- 39.Hafeman D, Bebko G, Bertocci MA, et al. Amygdala-prefrontal cortical functional connectivity during implicit emotion processing differentiates youth with bipolar spectrum from youth with externalizing disorders. J Affect Disord. 2017;208:94–100. [DOI] [PMC free article] [PubMed] [Google Scholar]
- 40.Chang K, Garrett A, Kelley R, et al. Anomalous prefrontal-limbic activation and connectivity in youth at high-risk for bipolar disorder. J Affect Disord. 2017;222:7–13. [DOI] [PubMed] [Google Scholar]
- 41.Zhang L, Opmeer EM, van der Meer L, et al. Altered frontal-amygdala effective connectivity during effortful emotion regulation in bipolar disorder. Bipolar Disord. 2018;20(4):349–358. [DOI] [PubMed] [Google Scholar]
- 42.Aleksandrova LR, Wang YT, Phillips AG. Evaluation of the Wistar-Kyoto rat model of depression and the role of synaptic plasticity in depression and antidepressant response. Neurosci Biobehav Rev. 2019;105:1–23. [DOI] [PubMed] [Google Scholar]
- 43.Diler RS, Segreti AM, Ladouceur CD, et al. Neural correlates of treatment in adolescents with bipolar depression during response inhibition. J Child Adolesc Psychopharmacol. 2013;23(3):214–221. [DOI] [PMC free article] [PubMed] [Google Scholar]
- 44.Pavuluri MN, Passarotti AM, Lu LH, et al. Double-blind randomized trial of risperidone versus divalproex in pediatric bipolar disorder: fMRI outcomes. Psychiatry Res. 2011;193(1):28–37. [DOI] [PMC free article] [PubMed] [Google Scholar]
- 45.Birmaher B, Axelson D, Monk K, et al. Lifetime psychiatric disorders in school-aged offspring of parents with bipolar disorder: the Pittsburgh Bipolar Offspring study. Arch Gen Psychiatry. 2009;66(3):287–296. [DOI] [PMC free article] [PubMed] [Google Scholar]
- 46.Garrett A, Cohen JA, Zack S, et al. Longitudinal changes in brain function associated with symptom improvement in youth with PTSD. J Psychiatr Res. 2019;114:161–169. [DOI] [PMC free article] [PubMed] [Google Scholar]
Associated Data
This section collects any data citations, data availability statements, or supplementary materials included in this article.