

Abstract
Morphometric analyses in the early foetal phase (9‐13 postconceptional week) are critical for evaluating normal brain growth. In this study, we assessed sequential morphological and morphometric changes in the foetal brain during this period using high‐resolution T1‐weighted magnetic resonance imaging (MRI) scans from 21 samples preserved at Kyoto University. MRI sectional views (coronal, mid‐sagittal, and horizontal sections) and 3D reconstructions of the whole brain revealed sequential changes in its external morphology and internal structures. The cerebrum's gross external view, lateral ventricle and choroid plexus, cerebral wall, basal ganglia and thalamus, and corpus callosum were assessed. The development of the cerebral cortex, white matter microstructure, and basal ganglia can be well‐characterized using MRI scans. The insula became apparent and deeply impressed as brain growth progressed. A thick, densely packed cellular ventricular/subventricular zone and ganglionic eminence became apparent at high signal intensity. We detected the emergence of important landmarks which may be candidates in the subdivision processes during the early foetal period; the corpus callosum was first detected in the sample with crown‐rump length (CRL) 62 mm. A primary sulcus on the medial part of the cortex (cingulate sulcus) was observed in the sample with CRL 114 mm. In the cerebellum, the hemispheres, posterolateral fissure, union of the cerebellar halves, and definition of the vermis were observed in the sample with CRL 43.5 mm, alongside the appearance of a primary fissure in the sample with CRL 56 mm and the prepyramidal fissure in the sample with CRL 75 mm. The volumetric, linear, and angle measurements revealed the comprehensive and regional development, growth, and differentiation of brain structures during the early foetal phase. The early foetal period was neither morphologically nor morphometrically uniform. The cerebral proportion (length/height) and the angle of cerebrum to the standard line at the lateral view of the cerebrum, which may reflect the growth and C‐shape formation of the cerebrum, may be a candidate for subdividing the early foetal period. Future precise analyses must establish a staging system for the brain during the early foetal period. This study provides insights into brain structure, allowing for a correlation with functional maturation and facilitating the early detection of brain damage and abnormal development.
Keywords: early foetal phase, foetal brain development, T1‐weighted magnetic resonance imaging, three‐dimensional analysis
Sequential changes in its external morphology and internal structures of human fetal brain during postembryonic phase at the first trimester were analyzed using high‐resolution T1‐weighted MRI (coronal, mid‐sagittal, and horizontal sections) and 3D reconstructions of the brain (n = 21) preserved at Kyoto University. Results demonstrated that the early fetal phase was neither morphologically nor morphometrically uniform. Future analyses should focus on establishing a staging system for the brain.
![]()
1. INTRODUCTION
The human embryonic brain develops while undergoing rapid morphological changes (O'Rahilly & Müller, 2006; Nakashima et al., 2012; Shiraishi et al., 2015,). A major development was the introduction of the Carnegie staging system of the embryonic period, which divides the first 8 weeks following fertilization into 23 stages (O'Rahilly & Müller, 1987). Changes in the human brain have been described in details, contributing to better understanding of brain development.
The embryonic period is followed by the postembryonic period, the first 5 weeks of which are referred to as the early foetal period [9–13 post‐conception weeks (PCW)] (Kostovic & Vasung, 2009; O'Rahilly & Müller, 2006). Although this period is not described stage‐by‐stage as the embryonic period, it involves the rapid, threefold enlargement of the cerebral hemispheres. (Lemire et al., 1975; O'Rahilly & Müller, 2006). O’Rahilly and Müller (2006) summarized the major external changes in morphology in the postembryonic phase as (1) the union of the cerebellar halves and the definition of the vermis; (2) the increasing concealment of the interbrain (diencephalon and hypothalamus), midbrain, and (later on) part of the cerebellum by the cerebral hemispheres; (3) further approach of the frontal and temporal poles around the insula, which becomes increasingly buried by opercula; and (4) the decreasing conspicuousness of the flexures.
As morphometry and quantitative analyses were previously difficult following gross anatomy and histology, previous studies were limited to using the methods of gross observation, dissection, and histological sectioning to detect the development of representative structures in the foetal brain (Desmond & O’Rahilly, 1981; Dobbing & Sands, 1973; Dunn, 1921; Grenell & Scammon, 1943; His, 1897; Hochstetter, 1919; Jenkins, 1921; Lemire et al., 1975; Levitan & Desmond, 2009).
The recent advent of MRI acquisition systems has enabled the acquisition of small samples at high resolution (Habas et al., 2010; Smith, 1999), and postmortem specimens scanned with MRI revealed the development of the foetal brain at high resolution. Kostovic et al. studied brain development by combining MRI and histological analyses (Kostovic & Vasung, 2009; Kostovic et al., 2019; Rados & Judas, 2006; Vasung et al., 2016) . Combining the two methods illustrated almost all parts of the cerebrum on in vitro T1‐weighted MR images during the foetal period, even during the early foetal phase. For example, MRI and histological assessments have characterized the lamination of the cerebral cortex, white matter microstructure, and basal ganglia. Further, upon revealing a thick, densely packed cellular ventricular/subventricular zone and ganglionic eminence, this method can detect the intensive proliferation of neuroepithelial stem cells.
MRI data may be advantageous for precise 3D reconstruction, including volume and length measurements, for both external and internal structures (Takakuwa, 2018). Documenting morphometry during the early foetal period is important for evaluating normal growth. Such morphometric data may provide precise insight into brain structure, allowing for correlations with functional maturation and facilitating the early detection of brain damage. This study, therefore, analyzed sequential morphological and morphometric changes in the foetal brain during the early foetal phase [almost 9–13 post conceptional week (PCW)] using high‐resolution MR images from many samples (Kostovic & Vasung, 2009). Although this study is concerned primarily with early foetal phase, the sample obtained at a late embryonic period [Carnegie stage (CS) 22 and CS 23, almost 8 PCW] and middle foetal phase with early part (almost 14–15 PCW) is provided to establish some degree of continuity between the late embryonic and the middle foetal phase of the brain.
2. MATERIALS AND METHODS
2.1. Human embryo specimens
A total of 21 human embryo and foetal specimens from the Kyoto Collection at the Congenital Anomaly Research Center of Kyoto University, Japan (Yamaguchi & Yamada, 2018) were used for this study. The samples were divided into five groups. The late embryonic period included four specimens obtained at the late embryonic period from CS 22 to CS 23 [crown‐rump length (CRL) 22, 24.5, 27, 30 mm; almost 8 PCW]. The early foetal phase was divided by CRL length: namely, with early (n = 4, CRL 33.5, 37, 40, and 43.5 mm; almost 9–10 PCW), middle (n = 6, CRL 52.5, 56.5, 56.5, 62, 66, and 69 mm; almost 11–12 PCW) and late (n = 4, CRL 75, 75, 86, and 98 mm; almost 12–13 PCW) parts. Samples in the middle foetal phase with early part included three foetal specimens (n = 3, CRL 110, 114, and 122 mm; almost 14–15 PCW). The embryonic specimens were staged according to the criteria set forth by O’Rahilly and Müller (1987).
Most specimens stored at the Kyoto Collection were acquired when pregnancy was terminated for socioeconomic reasons and in accordance with the Maternity Protection Law of Japan. Samples were collected between 1963 and 1995 in accordance with the relevant regulations of those time periods. For instance, written informed consent was not required from parents at that time. Instead, parents provided verbal informed consent to have these specimens deposited, and each participant's consent was documented in their medical records. All samples were anonymized and de‐identified. The ethics committee of the Kyoto University Faculty and Graduate School of Medicine approved this study, which used human embryo and foetal specimens (E986, R0316).
2.2. MRI acquisition and 3D reconstruction
Magnetic resonance (MR) images were acquired using a 7‐T MR system (BioSpec 70/20 USR; Bruker BioSpin MRI GmbH, Ettlingen, Germany). The 7‐T MR system was equipped with 1H quadrature transmit‐receive volume coils of 35 and 72 mm diameters (T9988 and T9562; Bruker BioSpin MRI GmbH, Ettlingen, Germany). The 3‐D T1‐weighted images were acquired as previously described (Takakuwa, 2018).
MRI data from selected specimens were precisely analyzed using serial 2‐D images and reconstructed 3‐D images. The 3‐D images of the brain were manually reconstructed using Amira software, version 5.5.0 (Visage Imaging GmbH, Berlin, Germany). The 3‐D coordinates were initially assigned by assessing the voxel position on 3‐D images.
The regional non‐uniform thickness of the brain tissue was visualized using the filter module of the AmiraTM software program for surface thickness (the thickness of the brain was visualized on the surface with a colour scale).
2.3. Morphometry
The volumes of the brain were calculated using AmiraTM software.
For volume measurements, the brain tissue and ventricles were divided into five regions according to anatomic landmarks: the cerebrum (lateral ventricle), interbrain (diencephalon and hypothalamus), midbrain, rostral hindbrain and cerebellum, and caudal hindbrain (Nakashima et al., 2012; Yamaguchi et al., 2018). The fourth ventricle was defined as the cavity corresponding to the rostral hindbrain, cerebellum, and caudal hindbrain.
The widths of the brain regions were measured using a dorsal view of the 3D reconstructed images. Angles of the cerebrum to the spinal cord, cerebrum to the hindbrain, and cerebrum to the standard line were measured using the lateral views of the 3D reconstruction images. The tangential line of the frontal lobe line, which connects the pituitary gland by lateral view, was defined as the standard line. The cerebral ratio was defined as the ratio of the length to height of the cerebrum on the lateral view.
The line connecting the anterior and posterior commissure (AC‐PC line) was used to determine the sectional plane of the MRI. Namely, the horizontal plane was parallel, whereas the coronal plane was vertical, to the AC‐PC line. On MRI plane sections, the thickness, height, and length of each region of the brain tissue were measured. On coronal sections through the pituitary gland, the thickness of the cerebral cortex at the lateral, superior, and medial parts was measured on the horizontal line, tangential to the ganglionic eminence and its orthogonal line. On the mid‐sagittal section, the following lengths and angles were measured. The length of the corpus callosum and the distance between the anterior and posterior commissure was measured. For the midbrain, the thickness of the tectum, the tegmentum, and length were measured. The thickness (rostral hindbrain), length (basal pons), and pontine flexure (angle between the rostral and caudal hindbrain) were measured. For the caudal hindbrain and spinal cord, the thickness and cervical flexure (angle between caudal hindbrain and spinal cord) were measured; for the cerebellum, the length and height at the medial part were measured; the height at the sagittal section, which included the middle of the hemisphere, was also measured.
3. RESULTS
3.1. Forebrain (cerebrum, interbrain)
3.1.1. 3D reconstruction and gross view
3D reconstruction of the brain from late embryonic period, early foetal phase, and middle foetal phase with early part revealed a sequential change in morphology (Figure 1). The cerebrum was C‐shaped at the embryonic period. The cerebral cortex grew from an anterior to posterior direction with the so‐called C‐shaped structure at early foetal phase with early part. With the differentiation of the posterior and inferior horns, the cerebral cortex grew both from anterior to posterior and from parietal to occipital. This trend can be recognized on 3D reconstruction of the external view and lateral ventricle. The cerebrum gradually concealed the brain stem. The interbrain (diencephalon and hypothalamus) including pituitary gland was mostly found in the foetes in early foetal phase with early part. The midbrain remained visible in all samples in early foetal phase with all three parts. The basal pons and a part of the cerebellum were covered in the samples in early foetal phase with late part. The occipital lobe and temporal lobe were discernable in the foetes in early foetal phase with late part. The frontal and temporal poles approached the insula, which became increasingly buried by the opercula.
FIGURE 1.

3D reconstruction of the foetal brain. (a) Lateral external view. Cerebrum (green), interbrain (diencephalon and hypothalamus) (orange), midbrain (blue), rostral hindbrain and cerebellum (yellow), and caudal hindbrain (purple). (b) Ventricle (blue) and choroid plexus (purple) in the lateral ventricle observed through transparent brain tissue (same scale). The standard line was defined as the tangential line of the frontal lobe of the cerebral hemisphere, which goes through the pituitary gland (red circle). The number indicates the CRL of the samples. Note that distribution of the choroid plexus in the lateral ventricle was not uniform from the anterior to posterior part
A 3D reconstruction of the lateral ventricle revealed the differentiation of a simple C‐shape structure into four primary regions: the anterior horn, central parts, posterior horn, and inferior horn. The posterior horn and temporal horn of the lateral ventricle gradually become conspicuous during early foetal phase (Figure 1b).
Distribution patterns of the choroid plexus in the lateral ventricle were not uniform from the anterior to posterior part (Figure 1b). The choroid plexus was located in the middle part of the lateral ventricle, around the interventricular foramen (Monro's foramen) at the late embryonic period. The choroid plexus spread posteriorly at the lateral ventricle at the early foetal phase with early part, which was located in almost all regions of the lateral ventricle in the largest sample (CRL 56.5 mm) at the early foetal phase with middle part. The choroid plexus deviated to the middle towards the posterior and inferior horn at the middle foetal phase with early part.
3.1.2. Line and angle measurements
The gross proportion was estimated by the cerebral proportion (Figure 2a). The cerebral proportion changed linearly in late embryonic period, early foetal phase with early part, and early foetal phase with middle part, (length/height = 0.87 at the CS22 embryo with CRL 22 mm to 1.55 at the sample with CRL 69 mm). The cerebral proportion grew almost constant at early foetal phase with late part (length/height = 1.44–1.60) and middle foetal phase with early part (1.42–1.53).
FIGURE 2.

Morphometry on external view of the forebrain. (a) Cerebral proportion. The cerebral proportion was defined as the height per anterior–posterior length. See also (d). LE: late embryonic stage, MF.E: middle foetal phase with early part. (b) The angle of the cerebrum to the standard line (green), cerebrum to caudal hindbrain (purple), and cerebrum to the spinal cord (white) were indicated. The standard line was defined as the tangential line of the frontal lobe of the cerebral hemisphere, which goes through the pituitary gland. (c) Width of the cerebrum (green) and diencephalon (orange). The widths of other regions (midbrain, rostral hindbrain, cerebellum, and spinal cord) are indicated in Figure S1. (d) 3D reconstruction of the lateral view indicating angle measurements and calculation of the cerebral proportion. Angles of the spinal cord to the cerebrum (cx_spc), hindbrain to cerebrum (cx_hb), and cerebrum to the standard line (cx_stl) were measured. The tangential line of the frontal lobe, which passed through the pituitary gland by lateral view, was defined as the standard line. The cerebral proportion was defined as the ratio of the length to the height of the cerebrum. (e) 3D reconstruction of the posterior view for the width measurements. The widths of the cerebrum and diencephalon were measured
The gradual decrease in flexion of the spinal cord, hindbrain, and cerebrum was observed laterally. The angle of the cerebrum to the standard line (∠cx_stl) gradually decreased from 37.8° in the CS22 sample (CRL 22 mm) to –14.5° in the middle foetal phase with early part (CRL 114 mm) (Figure 2b). The speed of decrease was fast in late embryonic period and early foetal phase with early part, whereas it was almost constant in early foetal phase with late part and middle foetal phase with early part (–2.3° and –14.5°, respectively). The decreasing angle of ∠cx_stl corresponded to the C‐shape formation of the cerebrum. The angle of the cerebrum to the spinal cord decreased during early foetal phase (146–102.8°), which reached approximately 90° (89–92°) at middle foetal phase with early part. The angle of the cerebrum to the hindbrain gradually decreased during the early foetal phase (70–43°), reaching approximately 40° (37–40°) at middle foetal phase with early part.
The width of the cerebrum (BT) and diencephalon grew almost linearly, which was highly correlated with the CRL [R 2 = 0.94 for both the cerebrum and diencephalon, during all periods (Figure 2c)].
3.1.3. Volumetry
The brain tissue and ventricular volumes were calculated for all reconstructions samples (Figure 3A; Figure S2). The whole brain volume excluding the ventricles (brain tissue volume) was 277.5 mm3 in the smallest sample in early foetal phase with early part (CRL 33.5 mm) and increased to the third power to 4248.5 mm3 in the largest sample in early foetal phase with late part (CRL 98 mm). The whole brain tissue volume increased 15.3‐fold during early foetal phase.
FIGURE 3.

(a) Tissue volume of the whole brain, cerebrum, and interbrain (diencephalon and hypothalamus) (b) and volume rate of cerebrum, interbrain (diencephalon and hypothalamus), and forebrain to the whole brain. Whole brain (white), cerebrum (green), interbrain (diencephalon and hypothalamus) (orange). The volume of the midbrain, rostral hindbrain and cerebellum, and caudal hindbrain, and the volume ratio to the cerebrum are shown in Figure S2. LE: late embryonic stage, MF.E: middle foetal phase with early part
The brain tissue volumes of the cerebrum and interbrain (diencephalon and hypothalamus) were almost the same (24.6 mm3 and 22.0 mm3) at CS22 (CRL 22 mm; Figure 3A). The brain tissue volumes of the cerebrum and interbrain (diencephalon and hypothalamus) were 117.4 mm3 and 54.1 mm3, respectively, in the smallest sample in early foetal phase with early part (CRL 33.5 mm); the volumes increased to the third power and reached 3410.8 mm3 and 371.3 mm3, respectively, in the largest sample in early foetal phase with late part (CRL 98 mm). The growth rate of the cerebrum was greater than that of the interbrain (diencephalon and hypothalamus), as the cerebral hemispheres grew rapidly, contributing to the growth of the brain by the third power during the foetal period (Figure 3b). Namely, the volume rate of the cerebrum to the whole brain was 24% at CS22 (CRL 22 mm), increased to 42% in the smallest sample in early foetal phase with early part (CRL 33.5 mm), 80% in the largest sample in early foetal phase with late part, and reached 83–85% in the samples in middle foetal phase with early part.
3.1.4. Lateral ventricle and choroid plexus
The brain ventricle volume increased to the third power until early foetal phase with middle part. The speed of the increase was higher in late embryonic period than in early foetal phase with early and middle parts, and the speed of increase was lower in early foetal phase with late part and middle foetal phase with early part (Figure 4a). The choroid plexus volume increased to the third power in late embryonic period, early foetal phase with early and middle parts, and was almost constant in the larger samples in early foetal phase with late part and in middle foetal phase with early part (6.82–9.01).
FIGURE 4.

Growth of the cerebrum, lateral ventricle, and choroid plexus. (a) Volume (mm3 ^1/3) of the cerebrum (green), lateral ventricle (light blue), and choroid plexus (purple). (b) Volume ratio of the lateral ventricle (light blue) and choroid plexus (purple) to the cerebrum. (c) Volume ratio of the choroid plexus to lateral ventricle. LE: late embryonic stage, MF.E: middle foetal phase with early part
The volume ratio of the lateral ventricle to the brain tissue of the cerebrum was higher than 1 in the late embryonic period; namely, the volume of the ventricle was larger than that of the brain tissue (Figure 4b). The ratio decreased almost linearly to 0.4 at the end of early foetal phase with late part and decreased further in middle foetal phase with early part. The volume ratio of choroid plexus/cerebrum was 0.09 at CS22 (CRL 22 mm) in late embryonic period and increased in early foetal phase; however, the ratio varied among samples (0.20–0.47). The ratio gradually decreased in early foetal phase with late part and decreased further in middle foetal phase with early part (0.09–0.11).
The volume ratio of choroid plexus/lateral ventricle was 0.10 at CS22 in late embryonic period, which increased at a rate that varied across samples in early foetal phase (0.23–0.58; Figure 4c). It thereafter turned into 0.29–0.40 in the middle foetal phase with early part.
3.2. Internal structure of the forebrain (cerebrum and interbrain)
3.2.1. MRI coronal and horizontal views
The development of the cerebral cortex, white matter microstructure, and basal ganglia was well characterized using MRI scans (Figures 5 and 6). The insula became apparent and deeply impressed with growth. The cingulate sulcus and lateral sulcus (Sylvian fissure) were initially detected in the sample in middle foetal phase with early part (sample with the CRL 122 mm). A thick, densely packed cellular ventricular/subventricular zone and ganglionic eminence was apparent at high signal intensity.
FIGURE 5.

MRI coronal section including the pituitary gland. The coronal plane was defined as that which was vertical to the AC‐PC line. cn: caudate nucleus, cp: choroid plexus, ec: external capsule, fo: fornix, ge: ganglionic eminence, gp: globus pallidus ext., hc: hippocampus, ht: hypothalamus, ic: internal capsule, in: insula, pg: pituitary gland, pu: putamen, st: subthalamus, th: thalamus, v3: third ventricle. Note the initial sulcus formation at the insula in the sample with middle foetal phase with early part (CRL 122 mm) (122_1 arrowhead) and at the medial part of the cerebral wall (CRL 122_2 high magnification)
FIGURE 6.

MRI horizontal section including anterior and posterior commissure. ac: anterior commissure, ah: anterior horn, cn: caudate nucleus, ec: external capsule, ge: ganglionic eminence, hc: hippocampus, pc: posterior commissure, pu: putamen, th: thalamus, v3: third ventricle. Note that the cerebrum developed posteriorly and inferiorly. Internally, representative anatomical structures can be identified in early foetal phase. For example, the trilaminar appearance of the cerebral wall; transient, thick proliferative foetal zones (ventricular and subventricular); protruding large and high MRI signal intense ganglionic eminence. Higher MRI signal intensity of dorsomedial thalamus; lateral geniculate body with higher MRI intensity
3.2.2. Cerebral wall
The cerebral wall was thin, and lamination was difficult to observe in the late embryonic period (Figure 7a). In early foetal phase with early part, the trabecular appearance of the cerebral wall‐layered structure of the cerebral cortex was detected. The subplate zone gradually appeared in early foetal phase with middle part as low MRI signal intensity, resulting in the deep border of the cortical plate being less sharply delineated from the intermediate zone (see asterisk in Figure 7a). Five typical foetal laminations of the cerebral wall (5 laminae: (1) ventricular zone, (2) subventricular zone, (3) intermediate zone, (4) subplate zone, and (5) cortical plate) were discernable in the largest sample in early foetal phase with late part (CRL 98 mm). The thickness of the cerebral wall varied significantly across the hemispheres (Figure 7b). In the lateral portion, the cerebral wall was thick, but the superior and medial portions were thin. These observations were confirmed by measurements of the thickness of the cerebral wall at the lateral, superior, and medial portions. The cerebral cortex became linearly thick according to growth in all three portions. The cortex was thickest at the lateral portion, followed by the superior and medial portions.
FIGURE 7.

Cerebral wall development. (a) Mid‐lateral portion of the cerebral wall on MRI. A coronal section including the pituitary gland was selected. Gradual changes in lamination and formation of the subplate zone are indicated. First appearance of subplate zone was indicated (*). (b) The thickness of the cerebral wall at the lateral, superior, and medial portions. The white lines indicate the tangential line of the ganglionic eminence (ge) and its orthogonal line. The thickness of the cerebral cortex is represented at the lateral (blue), superior (red), and medial (yellow) regions, as measured on these lines. (c) Surface colour mapping external view of the whole brain at early foetal phase with late part (CRL 75 mm). The thickness of cerebral wall changes was visualized using a rainbow colour scale (range: 0–2 mm). Surface colour mapping at other phases were provided in Figure S3
The 3D changes of the thickness of the cerebral wall were visualized on the surface using a colour scale (Figure 7C; Figure S3). The forebrain initially thickens by the central lateral portion of the basal part, according to the growth of the basal ganglia and thalamus. The thickened area shown in red was enlarged to both anterior and posterior to temporal parts. The cortex was thinner in the anterior part than in the posterior‐temporal part at early foetal phase with late part. Almost all hemispheres had a thickness exceeding 2 mm, except for the anterior lobe and medial side of the hemisphere in the largest sample at early foetal phase with late part (CRL 98 mm).
3.2.3. Basal ganglia and thalamus
The basal ganglia and thalamus developed in the territory that is discernable at the early foetal phase with middle and late parts, although the extent depends on the condition of the samples and MRI acquisition (Figures 5 and 6). Typically, a higher MRI signal intensity of the putamen and lower intensity in the caudate nucleus were detected. Granularity in the striatum was observed. The thalamus can be divided into the following territories: low MRI signal intensity in the dorso‐medial and pulvinar complex and high MRI signal intensity in the lateral and medial geniculate body.
The basal ganglia and thalamus were reconstructed in two samples (CRL 56 mm and 69 mm) in early foetal phase with middle part, in addition to the selected three samples (CRL 75 mm, 75 mm, and 98 mm) in early foetal phase with late part and two samples (CRL 114 mm and 122 mm) in middle foetal phase with early part (Figure S4a). The putamen, caudate nucleus, globus pallidus, and internal capsule grew in parallel. The anatomical position appeared to be essentially similar to that of the adults. The volume of the basal ganglia and thalamus increased linearly with growth and according to a similar rate (Table 1; Figure S4b). The volume ratios of the basal ganglia, thalamus, and their sum to the forebrain were 3.2%, 5.2%, and 8.3% in the sample in early foetal phase with middle part (CRL 56.6 mm); these ratios gradually decreased in the early foetal phase with late part and middle foetal phase with early part samples.
TABLE 1.
Volume of the basal ganglia and thalamus
| ID | CRL (mm) | Forebrain (mm3) | Basal ganglia | Thalamus | Basal ganglia +thalamus | |||||||
|---|---|---|---|---|---|---|---|---|---|---|---|---|
| Volume (mm3) | Ratio to forebrain (%) | Volume (mm3) | Ratio to forebrain (%) | Volume (mm3) | Ratio to forebrain (%) | |||||||
| Caudate nucleus | Internal capsule | Putamen | Globus pallidus | Total | ||||||||
| 19 | 56.5 | 492.0 | 1.9 | 5.1 | 7.1 | 1.5 | 15.6 | 3.2 | 25.3 | 5.2 | 40.9 | 8.3 |
| 34 | 69 | 1449.1 | 10.9 | 25.2 | 33.7 | 7.0 | 76.8 | 5.3 | 71.9 | 5.0 | 148.6 | 10.3 |
| 29 | 75 | 1708.1 | 14.4 | 19.9 | 34.4 | 6.6 | 75.3 | 4.4 | 79.3 | 4.6 | 154.6 | 9.1 |
| 30 | 75 | 2092.1 | 13.8 | 15.3 | 46.9 | 8.6 | 84.6 | 4.0 | 67.0 | 3.2 | 151.5 | 7.2 |
| 51 | 98 | 3782.1 | 22.5 | 32.3 | 66.1 | 8.4 | 129.3 | 3.4 | 123.2 | 3.3 | 252.5 | 6.7 |
| 49 | 114 | 7184.6 | 48.9 | 33.1 | 128.9 | 7.1 | 218.0 | 3.0 | 145.0 | 2.0 | 363.0 | 5.1 |
| 48 | 122 | 5447.3 | 48.7 | 32.2 | 86.9 | 23.2 | 191.0 | 3.5 | 169.0 | 3.1 | 360.0 | 6.6 |
3.2.4. Corpus callosum
The sequential growth of the corpus callosum was observed on MRI mid‐sagittal sections (Figure 8). The anterior and posterior commissure had not yet differentiated within the commissural plate in late embryonic period and early foetal phase with early part. The corpus callosum was first detected in the smallest sample in early foetal phase with middle part (CRL 62 mm). The length of the corpus callosum increased linearly, reaching 6.6 mm in the sample in middle foetal phase with early part (CRL 122 mm). The corpus callosum remained small: the roof of the third ventricle is exposed at the bottom of the longitudinal fissure during early foetal phase. The pineal region and its associated recesses and commissures were well developed, the distance between the anterior and posterior commissure increased linearly, and the aqueduct remained relatively wide
FIGURE 8.

Length of the corpus callosum and distance between the anterior and posterior commissure (AC_PC) on mid‐sagittal sections. LE: late embryonic stage, MF.E: middle foetal phase with early part
3.3. Brain stem (midbrain and hindbrain)
The sequential growth patterns of the corpus callosum, midbrain, hindbrain, and cerebellum were observed on MRI mid‐sagittal sections (Figure 9). The changes in the morphology of the midbrain, hindbrain, and cerebellum were shown using morphometric analysis.
FIGURE 9.

Mid‐sagittal MRI sections. ac: anterior commissure, aq: cerebral aqueduct, bp: basal pons, cc: corpus callosum, cer: cerebellum, ep: epiphysis, lt: lamina terminalis, oc: optic chiasma, pc: posterior commissure, pg: pituitary gland, sr: suprapineal recess, v3: third ventricle, v4: fourth ventricle
The pontine flexure was above 90° at GEL (116–99°) (Figure 10a). The flexure decreased rapidly from 107° to 48° during early foetal phase with early and middle parts and decreased gently at early foetal phase with late part and middle foetal phase with early part. The cervical flexure changed with a tendency similar to that of the pontine flexure; namely, the angle was above 90° at late embryonic period, decreased rapidly at early foetal phase with early part, and then gently at early foetal phase with middle and late parts, and middle foetal phase with early part.
FIGURE 10.
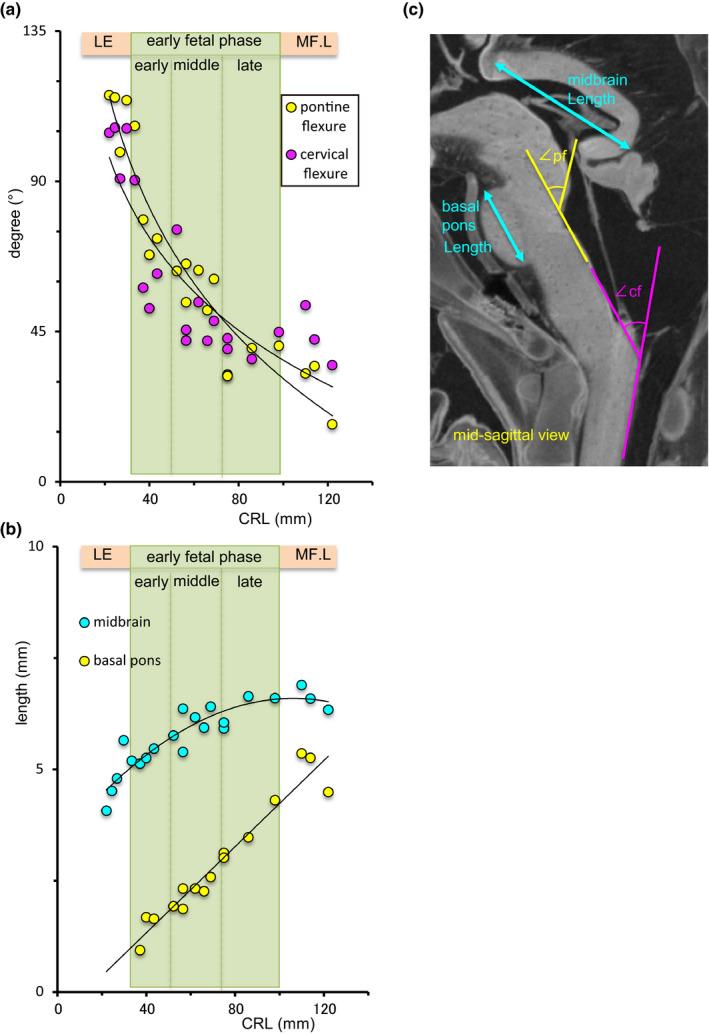
Morphometry of the brain stem. (a) Pontine flexure (yellow) and cervical flexure (purple). LE: late embryonic stage, MF.E: middle foetal phase with early part. (b) Length of the midbrain (blue) and basal pons (yellow). (c) Mid‐sagittal section for the linear and angular measurements of the brain stem. pf: pontine flexure, angle between the rostral and caudal hindbrain, cf: cervical flexure, angle between the caudal hindbrain and spinal cord
The basal pons grew prominent as a unique semi‐circular region with high signal intensity, according to the apparent decrease in the pontine flexure. The length of the basal pons was measurable in the sample with a CRL of 37.2 mm, which increased linearly (Figure 10b). The length of the midbrain increased nonlinearly, i.e., the growth rate gradually decreased.
The width of each region was measured in the caudal view of the 3D reconstruction (Figure S1); the increase in width was maximum in the midbrain, followed by the rostral hindbrain, midbrain, and spinal cord. All regions increased in width rapidly in late embryonic period and early foetal phase with early part, but the rate of increase gradually decreased in early foetal phase with late part and middle foetal phase with early part. The thickness of each region in the mid‐sagittal sections is illustrated in Figure S1c. The cross sections of the midbrain, rostral hindbrain, and cerebellum, caudal hindbrain, and spinal cord are shown in Figure S5.
3.4. Cerebellum
3.4.1. MRI sections and 3D reconstruction
The cerebellum developed dynamically, as detected on T1‐MRI scans. The dynamic changes in the thickness of its surface were visualized using a colour scale (Figure 11).
FIGURE 11.

Cerebellar growth. MRI mid‐sagittal section, coronal section, and 3D reconstruction. Surface colour mapping posterior view of the cerebellum. The thickness of brain tissue changes was visualized using a rainbow colour scale (range: 0–2 mm). CE: central lobule, CU: culmen, CP: choroid plexus, L: lingula, N: nodule, P: primary fissure, PL: posterolateral fissure, PP: prepyramidal fissure, Py; pyramis, T: tuber, U: uvula
The external cerebellar swelling represented the rhombic lip and cerebellar plate at late embryonic period. The cerebellar hemispheres became detectable and fused at the medial side, and the vermis and posterolateral fissure were recognized during early foetal phase with early part. The primary fissure was first detected in the samples at early foetal phase with middle part and became increasingly evident; the prepyramidal fissure was also recognized during early foetal phase with late part. The representative vermis and nodule (lingula, central lobule, culmen, tuber, pyramids, and uvula vermis and nodule) were discernable at middle foetal phase with early part.
3.4.2. Morphometry
The cerebellar height in the sagittal section, which included the middle of the hemisphere (H_par), increased linearly and was highly correlated with CRL (R 2 = 0.95) (Figure 12a). Conversely, the height in the mid‐sagittal section region increased gently at early foetal phase with early and middle parts, whereas the rate of increase became acute after early foetal phase with late part and middle foetal phase with early part. The cerebellar length increased linearly and was highly correlated with CRL (R 2 = 0.93) (Figure 12b). The width of the cerebellum was compatible with that of the cerebrum in the late embryonic period. The width increased almost linearly during early foetal phase with early and middle parts. The rate of increase became gentler at early foetal phase with late part and middle foetal phase with early part. The difference between the widths of the cerebrum and cerebellum gradually increased, whereas the ratio of the width of the cerebellum to that of the cerebrum decreased to approximately 0.43–0.51 in the early foetal phase with late part and middle foetal phase with early part (Figure 12b).
FIGURE 12.

Morphometric characteristics of the cerebellum. (a) Height at the sagittal section, which includes the middle of the hemisphere (H_ps, yellow) and mid‐sagittal section (H_ms, blue). See also Figure 12c. LE: late embryonic stage, MF.E: middle foetal phase with early part. (b) Width (white) and length (purple) of the cerebellum. Width ratio of the cerebellum to the cerebrum (Cb/Cx) is indicated as (X) with blue. (c) i) Cerebellar length (purple) and height at the mid‐sagittal section (H_ms, blue), ii) para‐sagittal section, which includes the middle of the hemisphere (H_ps, yellow), and fourth ventricle (iv) iii) 3D reconstruction of the posterior view for the width measurements. The widths of the cerebellum (Cb) and cerebrum (Cx) were measured. Cb/Cx ratio was calculated
The volume of the rostral hindbrain and cerebellum and caudal hindbrain are provided in Figure S2.
4. DISCUSSION
In this study, sequential morphological and morphometric changes in the foetal brain during the early foetal phase were assessed using high resolution T1‐MRI scans. Acquired data include morphological and morphometric information of the whole brain, including the cerebrum, cerebellum, and brain stem. The images capture both the external views as well as internal structures during the early foetal phase, precisely revealing the transition from the embryonic to the foetal brain across the middle foetal phase with early part. Kostovic et al found that almost all parts of the cerebrum can be identified on in vitro T1‐weighted MR images during the foetal period, even during the early foetal phase (Kostovic & Vasung, 2009; Kostovic et al., 2019; Rados & Judas, 2006; Vasung et al., 2016). Hence, our MRI acquisition system findings may be comparable to those of previous studies.
4.1. Comparison with MRI and histological studies
Classically, 3D developmental anatomy was analyzed using gross anatomy, dissection, and histological sections (His, 1897; Hochstetter, 1919). Serial sections are suitable for observing the internal structures of embryos and are often used as references for the drawings in the atlases of human anatomy (Bayer & Altman, 2006; O’Rahilly & Müller, 2006), and are also used for 3D reconstruction (Takakuwa, 2018; Yamaguchi & Yamada, 2018). However, a high level of skill is required to generate serial sections. Therefore, the method is difficult to apply to serial sections during the foetal period, as the specimen becomes quite large and contains ossified samples. Morphometric analyses using gross anatomy, dissection, and histology are difficult and sometimes inaccurate. By dissection of 10 foetal samples of different ages, Jenkins (1921) measured the brain volume and weight of several regions such as olfactory bulb, hippocampus, fornix, and paraterminal body, striatum, and cerebral cortex. Koop et al., (1985) measured the brain volumes of 10 samples during weeks 9 to 25 of gestation.
Previous studies (Desmond & O’Rahilly, 1981; Dunn, 1921; Grenell & Scammon, 1943; Levitan & Desmond, 2009) used histological sections, yielding limited measurements. Histological morphometry was reliable only when the landmark was in the identical histological section because the distance between the landmarks located at the different sections was erroneous. The mid‐sagittal section was often selected as the only section to determine orientation for a given embryo. The advantage of using the mid‐sagittal section is that this section is definite, covers all regions of the brain and even the spinal cord, and harbours important structures. In addition, several embryological textbooks use mid‐sagittal sections. Many previous morphometric analyses using histology have been reported using mid‐sagittal sections (Desmond & O’Rahilly, 1981; Levitan & Desmond, 2009). In this study, almost all morphometric measurements were performed using mid‐sagittal sections.
Several measurements [width of cerebrum (BT) (Figure 2c), length and height of the cerebellum (Figure 12a, b), and length of the midbrain (Figure 10b)] were similar to those reported by a previous study using MRI mid‐sagittal sections and histological assessments during the embryonic period (Desmond & O’Rahilly, 1981; Kobayashi et al., 2016). All four measurements increased linearly across and correlated highly with the CRL (r = 0.91–0.96) on MRI scans in the embryonic period. In the early foetal phase of this study, the width of the cerebrum (BT) and the length of the cerebellum still increased linearly and were highly correlated with CRL (R 2 = 0.94,0.93), which may be used as an indicator of the cerebrum and cerebellar growth during early foetal phase. The height of the cerebellum increased linearly in the para‐midsagittal sections (H_ps in Figure 12a; R 2 = 0.95), which correspond to the growth of the cerebellar hemispheres; however, in the mid‐sagittal section, the height of the cerebellum (H_ms) increased slowly at early foetal phase with early part and grew at an accelerated rate after early foetal phase with middle part. This morphometry corresponds with the occurrence of fusion of cerebellar hemispheres at the medial site and the observation of the vermis and posterolateral fissure during early foetal phase with early part. The length of the midbrain increased non‐linearly but increased gently and plateaued at early foetal phase with late part and middle foetal phase with early part (Figure 10b). These results may be explained by regional differences in growth rates during the early foetal phase. Other measurements used during the embryonic period were difficult to apply to the early foetal phase because brain morphological characteristics underwent significant changes.
4.2. Comparison with MRI and sonographic studies
Quantitative measurements to assess the comprehensive and regional development, growth, and differentiation of brain structures are required in various research fields, such as human developmental anatomy, anthropology, prenatal medicine, and gynaecology. Previous morphometric studies of the early foetal phase have used sonography (Blaas, 1999; Blaas et al.,1998; Tanaka & Hata, 2009; Tanaka et al., 2000). However, direct comparison with the present data was difficult to perform, excepting that of several parameters. For example, the whole brain and cavity volume were estimated using sonography, which could be compared. These parameters were established more than 20 years ago (Blaas, 1999; Tanaka et al., 2000). The lateral ventricle changed in shape and volume mainly by elongation and narrowing, corresponding to the external and internal growth of the surrounding cerebrum. Namely, lateral ventricle volume is an indirect indicator of brain growth. This study showed that the lateral ventricle volume did not increase linearly and varied between samples.
For linear measurements, BT may be used as an established indicator for cerebrum growth. Our data here also support the reliability of the BT as an indicator (Figure 2c). For other parameters, exact definition is required for length measurements, especially during early foetal phase, because the morphology of the brain becomes more complicated and regional growth differences become increasingly evident. Furthermore, it is sometimes difficult to measure the length with an identical definition because morphological features and suitable landmarks may change during development. The improvements in transvaginal ultrasound techniques over the last decade have allowed for a better visualization and offer the tools to measure these human embryonic brain tissues with precision (Gijtenbeek et al., 2014; Tanaka & Hata, 2009). In utero MRI of human foetus may also become an important tool for clinical evaluation (Habas et al., 2010). The measurements of brain tissue thickness are advantageous in that they directly reflect the growth of the region. The present study indicates the risk of evaluating the measured thickness without an accurate definition in the region measured because brain tissue thickness varies among regions; this variation must be taken into account during evaluation and clinical applications.
4.3. Lateral ventricles and the choroid plexus
The lateral ventricle volume increased linearly at early foetal phase with early part, which plateaued and varied at early foetal phase with late part and middle foetal phase with early part (Figure 4a). The timing of the plateau phase was earlier than that previously reported, which the lateral ventricle increased linearly from 7 to 23 PCW, followed by a decrease until 28 PCW (Kinoshita et al., 2001).
The volume ratio of the choroid plexus/lateral ventricle increased at late embryonic period, reaching approximately one‐fifth of the lateral ventricle at CS23 as shown in a previous study (Shiraishi et al., 2013). The choroid plexus volume also varied, and the volume ratio of the choroid plexus/lateral ventricle was 0.23–0.58 at early foetal phase with middle part (Figure 4C), which was smaller to that documented in a previous study (Shuangshoti & Netsky, 1966). The speed of growth was maintained until the choroid plexus filled approximately three‐fourths of the lateral ventricle at a 50 mm crown‐rump length (around 11 PCW) (Shuangshoti & Netsky, 1966). In our study, the timing of the maximum occupation of the choroid plexus in the lateral ventricle was compatible with that study. At early foetal phase with middle part, the coronal section through the pituitary gland showed that the choroid plexus occupied almost all areas in the lateral ventricle (Figure 5). Meanwhile, the lateral view indicated that the distribution of the choroid plexus in the lateral ventricle was not uniform from the anterior to posterior part (Figure 1). The choroid plexus covered the central part of the lateral ventricle, which extended from the interventricular foramen (Monro's foramen) to the central and posterior part at early foetal phase with middle part and deviated to the posterior and inferior parts at middle foetal phase with early part. We speculate that the previous study might have overestimated the choroid plexus volume by observing the gloss anatomy and histologic sectional views confined to the central part.
4.4. Basal ganglia and thalamus
Morphometric analysis carried out for internal structures was very limited, especially during the early foetal phase. Jenkins (1921) roughly measured the volume of the internal structures, while Nara et al. (1989) measured the volume of the hypoglossal nucleus using serial histological sections from the foetus from 14 PCW to birth. Using MRI scans, Huang et al. (2009) measured the volume of the basal ganglia (caudate nucleus, putamen, and globus pallidus) and thalamus of the foetus in the MF. Both basal ganglia volume and whole brain volume increased linearly in the MF, whereas the volume ratio of the basal ganglia and thalamus to the whole brain was constant (<2%) during the same period. We observed that the volume of the basal ganglia and thalamus increased linearly (Table 1; Figure S4). The volume of the interbrain (diencephalon and hypothalamus) and cerebrum increased by the third power, thereby resulting in a decrease in the relative volume of the basal ganglia and thalamus during early foetal phase with middle and late parts.
4.5. Subdivision of the early foetal period
The Carnegie stage was initially planned to be divided into 25 stages up to the foetal samples with CRL 32–38 mm, the stage at which the eyelids are joined (Streeter, 1942). Streeter (1951) divided the system into 23 stages, defining the final stage by the formation of bone marrow in the humerus (approximately 30 mm CRL). The authors believed that the CRL might be sufficient to subdivide the foetal period. O’Rahilly and Müller (2006) subdivide the postembryonic phase at the first trimester: the early postembryonic phase (CRL 30–50 mm) and postembryonic phase (CRL 50–100 mm).
Kostovic and Vasung (2009) subdivide the foetal period into early foetal phase (almost 9–13 PCW) and other phases. In this study, the early foetal phase was subdivided into early (CRL 30–50 mm), middle (CRL 50–75 mm), and late (CRL 75–100 mm) parts, based on their subdivisions. Such a subdivision was useful to present the early foetal phase, which was morphologically and morphometrically non‐uniform.
Previous histological studies have predicted the emergence of important landmarks during the early foetal phase (Lemire et al., 1975). Our MRI study illustrated such landmarks according to a time course similar to that in which they were detected histologically. The corpus callosum was first detected at early foetal phase with middle part (CRL 62 mm) (Figure 8), and the primary sulcus (cingulate sulcus) was observed at the medial part of the cortex at middle foetal phase with early part (CRL 114 mm) (Figure 5). As for the corpus callosum, the length at the mid sagittal sections increased linearly according to growth. Most landmarks (fissure) in the cerebellum were detected as described in a previous gross anatomy and histology study (Lemire et al., 1975). Namely, the cerebellar hemispheres, posterolateral fissure, union of the cerebellar halves, and definition of the vermis were observed at early foetal phase with early part (CRL 43.5 mm); the primary fissure was seen at early foetal phase with middle part (CRL 56 mm), and the prepyramidal fissure at early foetal phase with late part (CRL 75 mm) (Figure 11). Detection of such important landmarks may be candidate to subdivide the early foetal phase.
As for the lateral view of the cerebrum, the cerebral proportion (length/height) and the angle of ∠cx_stl may be candidate for subdividing the early foetal phase (Figure 2). Both parameters may correspond to the growth and C‐shape formation of the cerebrum. The cerebrum proportion becomes almost constant and ∠cx_stl becomes minus when the samples were at early foetal phase with late part, in which the differentiation of the posterior and inferior horns become apparent and the pituitary gland was concealed with the cerebral cortex by lateral view (Figure 1). As for the brain stem, the emergence of the basal pons and decrease of pontine flexure to acute angle were observed at early foetal phase with early part. Regarding the cerebellum, the cerebellar hemispheres became fused at the medial side at early foetal phase with early part, which resulted in an accelerated increase in height of the cerebellum in the mid‐sagittal sections. The establishment of a staging system for the brain during the postembryonic phase requires more precise analysis in the future.
4.6. Limitations
This study is subject to a number of limitations. First, most MR‐imaging‐based anatomical studies such as ours have been limited by the use of foetal samples stored in formalin. The shrinkage and deformity of the samples should be considered for assessments of morphology and morphometry. The formalin fixation resulted in tissue shrinkage of 2.7–3.5% (Boonstra et al., 1983; Schned et al., 1996). Second, the conditions of MRI acquisition should also be considered. As for the basal ganglia, we reconstructed and measured the volume of the seven selected samples. The visibility of the basal ganglia on MRI may depend on the condition of each sample, which should be related to the limited accuracy. MRI acquisition of well‐preserved samples at a much higher resolution may be necessary to yield better results. Third, this study failed to consider multiple important structures which may be important; this thus warrants future investigations.
5. CONCLUSION
This study provides insights into the morphological and morphometric characteristics of the human foetal brain during the early foetal phase. MRIs have the advantage of providing convenient 3D reconstruction and quantitative morphometric assessment of the foetal brain, especially with regard to the dynamic changes that occur during brain development. Such morphometric data are critical for evaluating normal growth, which may provide precise insights into brain structure, allowing for correlations with functional maturation, and facilitating the early detection of brain abnormalities.
CONFLICT OF INTEREST
There are no conflicts of interest to declare.
AUTHOR CONTRIBUTIONS
Tetsuya Takakuwa performed concept/design and drafting of the manuscript. Naoki Shiraishi, Mei Terashima, Miki Yamanaka, Ikue Okamoto, Koichi Ishizu, Aoi Ishikawa, Toru Kanahash carried out data analysis/interpretation. Hirohiko Imai, Shigehito Yamada contributed to acquisition of data.
Supporting information
Fig S1
Fig S2
Fig S3
Fig S4
Fig S5
ACKNOWLEDGEMENTS
The authors thank Ms. Chigako Uwabe of the Congenital Anomaly Research Center for technical assistance handling the human embryos. This study was supported by grant JP18K07876 from the Japan Society for the Promotion of Science.
DATA AVAILABILITY STATEMENT
The data that support the findings of this study are available from the corresponding author upon reasonable request.
REFERENCES
- Bayer, S. & Altman, J. (2006) The human brain during the late first trimester. Boca Raton, FL; London: CRC; Taylor & Francis distributor, 592 pp. [Google Scholar]
- Blaas, H.G. (1999) The embryonic examination. Ultrasound studies on the development of the human embryo. PhD thesis. 10.13140/RG.2.1.5176.6642 [DOI] [Google Scholar]
- Blaas, H.G. , Eik‐Nes, S.H. , Berg, S. & Torp, H. (1998) In‐vivo three‐dimensional ultrasound reconstructions of embryos and early fetuses. Lancet, 352, 1182–1186. [DOI] [PubMed] [Google Scholar]
- Boonstra, H. , Oosterhuis, J. , Oosterhuis, A. & Fleuren, G. (1983) Cervical tissue shrinkage by formaldehyde fixation, paraffin wax embedding, section cutting and mounting. Virchows Archiv A Pathological Anatomy and Histopathology, 402, 195–201. [DOI] [PubMed] [Google Scholar]
- Desmond, M.E. & O'Rahilly, R. (1981) The growth of the human brain during the embryonic period proper. 1. Linear axes. Anatomy and Embryology, 162, 137–151. [DOI] [PubMed] [Google Scholar]
- Dobbing, J. & Sands, J. (1973) Quantitative growth and development of human brain. Archives of Disease in Childhood, 48(10), 757–767. [DOI] [PMC free article] [PubMed] [Google Scholar]
- Dunn, H. (1921) The growth of the central nervous system in the human fetus as expressed by graphic analysis and empirical formulae. The Journal of Comparative Neurology, 33(5), 405–491. [Google Scholar]
- Gijtenbeek, M. , Bogers, H. , Groenenberg, I.A. et al. (2014) First trimester size charts of embryonic brain structures. Human Reproduction (Oxford, England), 29, 201–207. [DOI] [PubMed] [Google Scholar]
- Grenell, R. & Scammon, R. (1943) An iconometrographic representation of the growth of the central nervous system in man. The Journal of Comparative Neurology, 79(3), 329–354. [Google Scholar]
- Habas, P.A. , Kim, K. , Rousseau, F. , Glenn, O.A. , Barkovich, A.J. & Studholme, C. (2010) Atlas‐based segmentation of developing tissues in the human brain with quantitative validation in young fetuses. Human Brain Mapping, 31, 1348–1358. [DOI] [PMC free article] [PubMed] [Google Scholar]
- His, W. (1897) Address upon the development of the brain. Transactions of the Royal Academy of Medicine in Ireland, 15(1), 1–19. [Google Scholar]
- Hochstetter, F. (1919) Beitrage zur Entwicklungsgeschicbte desmenschlichen Gehirns. 1. Teil. Vienna: Deuticke. [Google Scholar]
- Huang, H. , Xue, R. , Zhang, J. et al. (2009) Anatomical characterization of human fetal brain development with diffusion tensor magnetic resonance imaging. The Journal of neuroscience: The Official Journal of the Society for Neuroscience, 29, 4263–4273. [DOI] [PMC free article] [PubMed] [Google Scholar]
- Jenkins, G. (1921) Relative weight and value of the component parts of the brain of the human embryo at different stages of development. Contributions to Embryology, 13, 41–60. [Google Scholar]
- Kinoshita, Y. , Okudera, T. , Tsuru, E. & Yokota, A. (2001) Volumetric analysis of the germinal matrix and lateral ventricles performed using MR images of postmortem fetuses. AJNR. American Journal of Neuroradiology, 22, 382–388. [PMC free article] [PubMed] [Google Scholar]
- Kobayashi, A. , Ishizu, K. , Yamada, S. , Uwabe, C. , Kose, K. & Takakuwa, T. (2016) Morphometric human embryonic brain features according to developmental stage. Prenatal Diagnosis, 36, 338–345. [DOI] [PubMed] [Google Scholar]
- Koop, M. , Rilling, G. , Hermann, A. & Kretschmann, H.J. (1985) Volumetric development of the fetal telencephalon, cerebral cortex, diencephalon and rhombencephaIon including the cerebellum in man. In: Kretschmann, H.J. (Ed.) Brain growth. Basel: Karger, pp. 53–78. [PubMed] [Google Scholar]
- Kostović, I. , Sedmak, G. & Judaš, M. (2019) Neural histology and neurogenesis of the human fetal and infant brain. NeuroImage, 188, 743–773. [DOI] [PubMed] [Google Scholar]
- Kostovic, I. & Vasung, L. (2009) Insights from in vitro fetal magnetic resonance imaging of cerebral development. Seminars in perinatology, 33, 220–233. [DOI] [PubMed] [Google Scholar]
- Lemire, R.J. , Loeser, J.D. , Leech, R.W. & Alvord, E.C. (1975) Normal and abnormal development of the human nervous system. Hagerstown, MD: Harper & Row, 421 pp. [Google Scholar]
- Levitan, M.L. & Desmond, M.E. (2009) Expansion of the human embryonic brain during rapid growth: Area analysis. The Anatomical Record: Advances in Integrative Anatomy and Evolutionary Biology, 292(4), 472–480. [DOI] [PubMed] [Google Scholar]
- Nakashima, T. , Hirose, A. , Yamada, S. , Uwabe, C. , Kose, K. & Takakuwa, T. (2012) Morphometric analysis of the brain vesicles during the human embryonic period by magnetic resonance microscopic imaging. Congenital Anomalies, 52(1), 55–58. 10.1111/j.1741-4520.2011.00345.x [DOI] [PubMed] [Google Scholar]
- Nara, T. , Goto, N. & Yamaguchi, K. (1989) Development of the human hypoglossal nucleus: A morphometric study. Developmental Neuroscience, 11, 212–220. [DOI] [PubMed] [Google Scholar]
- O’Rahilly, R. & Müller, F. (1987) Developmental stages in human embryos: Including a revision of Streeter's Horizons and a survey of the Carnegie Collection. Washington: Carnegie Institution of Washington, pp. 1–306. [Google Scholar]
- O'Rahilly, R. & Müller, F. (2006) The embryonic human brain: an atlas of developmental stages, 3rd edition. Hoboken, NJ: Wiley‐Liss. [Google Scholar]
- Rados, M. & Judas, M. (2006) Kostovihuman embryos: Including a revision of Street. European journal of Radiology, 57, 187–198. [DOI] [PubMed] [Google Scholar]
- Schned, A.R. , Wheeler, K.J. , Hodorowski, C.A. , Heaney, J.A. , Ernstoff, M.S. , Amdur, R.J. et al. (1996) Tissue‐shrinkage correction factor in the calculation of prostate cancer volume. The American Journal of Surgical Pathology, 20(12), 1501–1506. [DOI] [PubMed] [Google Scholar]
- Shiraishi, N. , Katayama, A. , Nakashima, T. , Yamada, S. , Uwabe, C. , Kose, K. et al. (2015) Morphology and morphometry of the human embryonic brain: A three‐dimensional analysis. NeuroImage, 115, 96–103. [DOI] [PubMed] [Google Scholar]
- Shiraishi, N. , Nakashima, T. , Yamada, S. , Uwabe, C. , Kose, K. & Takakuwa, T. (2013) Morphogenesis of lateral choroid plexus during human embryonic period. The Anatomical Record, 296(4), 692–700. [DOI] [PubMed] [Google Scholar]
- Shuangshoti, S. & Netsky, M.G. (1966) Histogenesis of choroid plexus in man. The American Journal of Anatomy, 118, 283–316. [DOI] [PubMed] [Google Scholar]
- Smith, B.R. (1999) Visualizing human embryos. Scientific American, 280, 76881. [DOI] [PubMed] [Google Scholar]
- Streeter, G.L. (1942) Developmental horizons in human embryos. Description of age group XI, 13 to 20 somites, and age group XII, 21 to 29 somites. Contributions to Embryology, 30, 211–245. [PubMed] [Google Scholar]
- Streeter, G.L. (1951) Developmental horizons in human embryos. Description of age groups XTX, XX, XXI, XXII, and XXIII, being the fifth issue of a survey of the Carnegie Collection (prepared for publication by C. H. Heuser and G. W. Corner). Contributions to Embryology, 34, 165–196. [Google Scholar]
- Takakuwa, T. (2018) 3D analysis of human embryos and fetuses using digitized datasets from the Kyoto Collection. The Anatomical Record, 301, 960–969. [DOI] [PubMed] [Google Scholar]
- Tanaka, H. & Hata, T. (2009) Intrauterine sonographic measurement of the embryonic brain mantle. Ultrasound in Obstetrics and Gynecology, 34, 47–51. [DOI] [PubMed] [Google Scholar]
- Tanaka, H. , Senoh, D. , Yanagihara, T. & Hata, T. (2000) Intrauterine sonographic measurement of embryonic brain vesicle. Human Reproduction (Oxford, England), 15, 1407–1412. [DOI] [PubMed] [Google Scholar]
- Vasung, L. , Lepage, C. , Radoš, M. , Pletikos, M. , Goldman, J.S. , Richiardi, J. et al. (2016) Quantitative and qualitative analysis of transient fetal compartments during prenatal human brain development. Frontiers in Neuroanatomy, 10, 11. [DOI] [PMC free article] [PubMed] [Google Scholar]
- Yamaguchi, Y. , Miyazaki, R. , Kamatani, M. et al. (2018) Three‐dimensional models of the segmented human fetal brain generated by magnetic resonance imaging. Congenital Anomalies, 58, 48–55. [DOI] [PubMed] [Google Scholar]
- Yamaguchi, Y. & Yamada, S. (2018) The Kyoto collection of human embryos and fetuses: History and recent advancements in modern methods. Cells, Tissues, Organs, 205, 314–319. [DOI] [PubMed] [Google Scholar]
Associated Data
This section collects any data citations, data availability statements, or supplementary materials included in this article.
Supplementary Materials
Fig S1
Fig S2
Fig S3
Fig S4
Fig S5
Data Availability Statement
The data that support the findings of this study are available from the corresponding author upon reasonable request.