

Abstract
Inhibitors of the programmed death-1/programmed death-ligand 1 (PD-1/PD-L1) immune checkpoint system are used for treating various malignancies. However, evidence on their use in soft tissue sarcomas (STS) is limited. This study aimed to retrospectively investigate the relationship between the expression of PD-1/PD-L1 and related antigens in STS, and their association with clinical characteristics. Immunostaining for CD4, CD8, PD-1, PD-L1, IL-2, and IFN-γ was performed using pathological specimens harvested at the time of biopsy from 10 patients with undifferentiated pleomorphic sarcoma (UPS), nine with myxofibrosarcoma (MFS), and three with malignant peripheral nerve sheath tumor (MPNST) who were treated at our hospital. Subsequently, the positive immunostaining cell rates were calculated. We also examined the correlation between each immune positive cell rate and age, tissue grade, size, and maximum standardized uptake (SUV-max) values. The 3-year event-free survival (EFS) and overall survival (OS) rates were compared between the positive and negative groups (positive rate >10%; negative <10%) for various immune stains. The positive rates were also compared between the presence and absence of events groups. There was positive staining for the immune checkpoint molecules in every STS type except for PD-1 in MPNST. CD4, CD8, and PD-1 stained lymphocytes in close proximity to the tumor in adjacent tissue sections. A positive correlation was observed between the positive cell rates of each immune component including inflammatory cytokines such as IL-2 and IFN-γ. Additionally, the clinical features positively correlated with the positive PD-1/PD-L1 expression rates. No significant differences in the 3-EFS and OS rates were observed between the PD-1/PD-L1 positive and negative groups. Our results suggest that an inducible immune checkpoint mechanism may be involved in UPS, MFS, and MPNST.
Key words: Immune checkpoint inhibitors, PD-1/PD-L1, soft tissue sarcoma, programmed death-1, programmed death-ligand 1
Introduction
Soft tissue sarcoma (STS) is a rare disease with a wide variety of histological types, accounting for approximately 1% of adult malignancies.1,2 Wide resection combined with chemotherapy and radiotherapy, if necessary, is the curative treatment for STS.3,4 In general, the drugs used for the chemotherapy of STS include doxorubicin and ifosfamide as well as gemcitabine and docetaxel.4,5 Although pazopanib, trabectedin, and eribulin have also been approved, their efficacy is limited.6-8 The median overall survival of patients with unresectable advanced diseases remains low at approximately 1-2 years.9 Therefore, there is a crucial need to develop new treatments.
The programmed death-1/programmed death-ligand 1 (PD- 1/PD-L1) immune checkpoint mechanism has recently been identified and implicated in the pathogenesis of various malignancies. 10-12 Anti-PD-1/PD-L1 drugs have been approved for the treatment of some malignancies, such as melanoma and renal cancer. 13,14 The possibility of the involvement of the PD-1/PD-L1 immune checkpoint mechanism in STS has been reported; however it remains unclear.15,16 Previous clinical trials have shown limited involvement,17-19 while another previous study reported a strong role of PD-1/PD-L1 immune checkpoint mechanism in STS.20 In addition, the relationship between clinical features and PD-1/PDL1 immune checkpoint mechanism is unknown.
Moreover, with complex genomic characteristics and aggressive clinical behavior, the pathogenesis of STS remains unclear and difficult to treat.21 Therefore, we aimed to perform an immunohistochemical study to identify the clinical significance of PD- 1/PD-L1 immune check point molecules and expression of inflammatory cytokines in STS.
Materials and Methods
Immunostaining for CD4, CD8, PD-1, PD-L1, IL-2, and IFN- γ was performed on pathological specimens harvested at the time of biopsy from patients with STS, including undifferentiated pleomorphic sarcoma (UPS) (n=10), myxofibrosarcoma (MFS) (n=9), and malignant peripheral nerve sheath tumor (MPNST) (n=3) who were treated at our institution between January 2006 and December 2019. Tissue sections were formalin-fixed and paraffin embedded. Sections of 4 μm thickness were cut and mounted onto slides. The tissues were deparaffinized, rehydrated, and subjected to inhibition of endogenous peroxidase using 3% hydrogen peroxide. For antigen activation, PD-1 was heat-treated (95°C, 5 min) in a pH 6 environment, and the other antigens were heat-treated (95°C, 5 min) in a pH 9 environment. The tissue sections were incubated with the following primary antibodies: CD4 antibody (rabbit monoclonal, SP35/Roche Diagnostics, Risch-Rotkreuz, Switzerland) for 32 min at 37°C after 60 min high pH (9.0) heat activation; CD8 antibody (rabbit monoclonal, C8/144B; Nichirei Corporation, Tokyo, Japan) for 32 min at 37°C after 60 min high pH (9.0) heat activation; PD-1 (mouse monoclonal, ab52587; NAT105/Abcam, Cambridge, UK) for 30 min at 37°C after 30 min low pH (6.0) heat activation; PD-L1 antibody (rabbit monoclonal, ab205921; 28-8/Abcam, Cambridge, UK) for 32 min at 37°C after 60 min high pH (9.0) heat activation; IL-2 antibody (rabbit monoclonal, ab92381; Abcam, Cambridge, UK) for 32 min at 37 °C after 60 min high pH (9.0) heat activation; IFN-γ antibody (rabbit polyclonal, ab9657; Abcam) for 32 min at 37°C after 60 min high pH (9.0) heat activation. Sections were incubated with the corresponding secondary antibodies for 30 min at 37°C. The reaction was visualized using 3,3-diaminobenzidine (DAB) (DAB Substrate Chromogen System; DAKO, Kyoto, Japan) and counterstained with hematoxylin. Tissues from the tonsils were used as positive controls; negative controls were not used because lymphocyte and other related antigens can stain almost all human tissues. Slides were observed under a microscope (BIOREVO BZ-9000; KEYENCE, Osaka, Japan), and brown granules in the cytoplasm, nuclei, or membrane indicated positive staining. The immune marker staining within the tumor was quantified in 4 representative high-power fields (40x magnification).22 The positivity rate of each immune component was calculated. The positivity rate was defined as the number of positive cells/total cell number. The positivity rate was quantified using the software provided with BIOREVO-BZ 9000 (Keyence).
Figure 1.

Representative histopathological findings of undifferentiated pleomorphic sarcoma (UPS) (A), myxofibrosarcoma (MYF) (B), and malignant peripheral sheath tumor (MPNST) (C). Hematoxylin and Eosin (H&E) staining images (A-C). CD4-positive histological findings in MYF (D). CD8-positive histological findings in MPNST (E). CD4 and CD8 were positively stained in the membrane of lymphocytes (D,E). PD-1-positive histological findings in MYF (F). PD-L1-positive histological findings in UPS (G). The positive staining of PD-1 and PD-L1 were observed in the membrane and cytoplasm of tumor cells and lymphocytes (Figure F and G). IFN-γ-positive histological findings in MPNST (H). IL-2-positive histological findings in MPNST (I). The inflammatory cytokines, IFN-γand IL-2 were positively stained in the membrane and cytoplasm of tumor cells and lymphocytes (H, I). Scale bars: 100 μm.
Table 1.
Characteristics of the study population.
| Factor | Patients, n |
|---|---|
| Age (years) | |
| <70 | 9 |
| ≥70 | 13 |
| Sex | |
| Male | 13 |
| Female | 9 |
| Tumor site | |
| Arms | 4 |
| Legs | 9 |
| Trunk | 9 |
| Histological type | |
| MFS | 9 |
| UPS | 10 |
| MPNST | 3 |
| Histological grade | |
| Grade 1 | 2 |
| Grade 2 | 8 |
| Grade 3 | 12 |
| Tumor size | |
| <5 | 8 |
| 5-10 | 11 |
| >10 | 3 |
| SUV-max | |
| <5 | 4 |
| 5-10 | 4 |
| >10 | 5 |
| Treatment | |
| Wide resection, flap | 4 |
| Wide resection, post op radiation | 3 |
| Wide resection | 10 |
| Wide resection, skin graft | 2 |
| Marginal resection | 2 |
| Radiation | 1 |
| Recurrence | |
| (+) | 8 |
| (-) | 14 |
| Metastasis | |
| (+) | 5 |
| (-) | 17 |
| Outcome | |
| CDF | 11 |
| NED | 6 |
| AWD | 3 |
| DOD | 2 |
| Follow-up duration (years) | |
| <3 | 8 |
| ≥3 | 14 |
| Positive cell rate (%) | |
| CD4 | |
| 0-10 | 3 |
| 10-50 | 12 |
| ≥50 | 7 |
| CD8 | |
| 0-10 | 11 |
| 10-50 | 10 |
| ≥50 | 1 |
| PD-1 | |
| 0-10 | 18 |
| 10-50 | 4 |
| ≥50 | 0 |
| PD-L1 | |
| 0-10 | 9 |
| 10-50 | 7 |
| ≥50 | 6 |
| IL-2 | |
| 0-10 | 4 |
| 10-50 | 6 |
| ≥50 | 12 |
| IFN-γ | |
| 0-10 | 3 |
| 10-50 | 7 |
| ≥50 | 12 |
MFS, myxofibrosarcoma; UPS, undifferentiated pleomorphic sarcoma; MPNST, malignant periph-
Figure 2.

Larger microscopic view of CD4 (A), CD8 (B), and PD-1 (C) immunostaining (immunostaining results of CD4, CD8, and PD-1 in adjacent sections are shown as 1000× magnification). Tumor-infiltrating lymphocytes (TILs) found at the nearby site can be seen in each staining. Scale bars: 100 µm.
Age, sex, site, histological type, tissue grade, size, standardized uptake value (SUV)-max value, treatment, recurrence, metastasis, and outcome were also surveyed. Correlations between the clinical characteristics and positive rates of immune components were examined. In addition, the 3-year event-free survival (EFS) and 3-year overall survival (OS) rates were compared between the positive/negative groups for each immunostaining. Recurrence, metastasis, or death was considered an event.
Statistical analyses
One way ANOVA were used for comparisons between two groups. The positivity rate of each molecule was plotted, and a correlation diagram was drawn. The coefficient of determination (R) was calculated by drawing an approximation line to examine the correlation of each molecule. The Pearson's method of testing for correlation was used to perform the tests. The correlation between the clinical parameters and positive rate of each molecule was also investigated similarly. We determined 1.0≧|R|≧0.7 as very strong, 0.7≧|R|≧0.5 as strong, 0.5≧|R|≧0.4 as moderate, 0.4≧|R|≧0.3 as medium, 0.3≧|R|≧0.2 as week, and 0.2≧|R|≧0.0 as no correlation. The Kaplan-Meier method was used to evaluate the 3-year survival rates. Analyses were performed using Stat Mate 5.05 (ATMS, Tokyo, Japan).
Results
The results of immune staining of UPS (n=10), MYS (n=9), and MPNST (n=3) specimens are shown in Figure 1 (A-C). CD4 and CD8 were positively stained in the membrane of lymphocytes (Figure 1 D,E). PD-1 and PD-L1 were positively stained in the membrane and cytoplasm of tumor cells and lymphocytes (Figure 1 F,G). The inflammatory cytokines, IFN-γ and IL-2, were positively stained in the membrane and cytoplasm of tumor cells and lymphocytes (Figures 1 H,I). In addition, the results of adjacent tissue sections for CD4, CD8, and PD-1 staining are shown in Figure 2, confirming that CD4, CD8, and PD-1 were stained in lymphocytes at the same site.
The patients’ characteristics are summarized in Table 1. The median age was 72.5 years (range: 34-101). There were 13 men and nine women. The tumor was located in the upper extremities in four patients, lower extremities in 13 patients, and the trunk in five patients. The histological grades were grade 1, grade 2, and grade 3 in two, eight, and 12 patients, respectively.
The median diameter was 5.8 (range 1.5-15.1) cm. The median SUV-max value was 7.38 (range, 3.13-24.1). Treatment consisted of wide resection with flap in two patients, wide resection and skin graft in two patients, additional wide resection with flap in one patient, wide resection and postoperative radiotherapy in three patients, wide resection only in 11 patients, marginal resection in two patients, and postoperative radiotherapy only in one patient. The aim of the surgery was to obtain an R0 wide margin.23 Recurrence occurred in eight patients; metastasis occurred in five patients.
The final clinical outcomes were continuous disease-free (CDF) survival in 11 patients, no evidence of disease (NED) in six, alive with disease (AWD) in three, and dead of disease (DOD) in two patients.
The positive patients were as follows: 19/22 (86.3%) CD4+, 11/11 (100%) CD8+, 4/22 (18.1%) PD-1+, 13/22 (59.0%) PD-L1+, 18/22 (81.8%) IL-2+, and 19/22 (86.3%) IFN-γ+. The means ± standard deviations (S.D) of the positivity rates of CD4, CD8, PD-1, PD-L1, IL-2, and IFN-γ were 32.5±26.1, 8.85±17.6, 0±10.6, 21.3±29.1, 60.6±36.6, and 61.1±34.6, respectively.
The correlation between the CD4 and IL-2 positivity rates was strong (R=0.66, Figure 3A), while the correlation between the CD8 and PD-1 positivity rates was medium (R=0.34, Figure 3B). Further, the correlation between the CD8 and IL-2 positivity rates was strong (R=0.55, Figure 3C), and that between the CD8 and IFN-γ positivity rates was also strong (R=0.69, Figure 3D). Moreover, the correlation between the PD-L1 and IFN-γ positivity rates was also strong (R=0.60, Figure 3E). However, the correlation between the PD-1 positivity rate and age was medium (R=0.39, Figure 4A), as was the correlation between the PD-1 positivity rate and tumor size (R=0.35, Figure 4B). The correlation between the PD-1 positivity rate and the histological grade was weak (R=0.28, Figure 4C), as was the correlation between the PD- 1 positivity rate and SUV-max value (R=0.28, Figure 4D), while the correlation between the PD-L1 positivity rate and age was strong (R=0.68, Figure 5A). The correlation between the PD-L1 positivity rate and tumor size was medium (R=0.59, Figure 5B); whereas the correlation between the PD-L1 positivity rate and histological grade was strong (R=0.68, Figure 5C). Additionally, the correlation between the PD-L1 positivity rate and SUV-max value was strong (R=0.55, Figure 5D). Each immune checkpoint molecule’s positivity rate in the event group / event absent group is shown in Table 2. The CD4 positive cell rates in the event group /event absent group were 45.1 (28.8-61.3) / 28.5 (12.2-44.8) [average (95% confidence interval: CI)], and there was no significant difference between the two groups. CD8 positive cell rates were 15.3 (0.52-31.9)/ 16.8 (0.59-33.1), and there was no significant difference between the two groups. PD-1 positive cell rates were 16.6 (9.66-22.86)/ 2.1 (14.0-18.4), while PD-L1 positive cell rates were 23.0 (6.82-39.3) / 33.0 (16.8-49.3), and there was no significant difference between the two groups. The IL-2 positive cell rates were 61.7 (45.5-78.0) / 43.9 (27.6-60.1), and there was no significant difference between the two groups. The IFN-γ positive cell rates were 62.8 (46.6-79.1) /46.5 (30.2-62.8), and there was no significant difference between the two groups. The 3-year EFS and OS rates of PD-1/PD-L1 positive and negative patients are shown in Figure 6. The EFS rate was 0% in both PD-1 positive (n=4) and negative patients (n=18) (Figure 6A), with no significant difference (p=0.14). The OS rates were 100% and 83.6% in PD-1 positive (n=4) and negative patients (n=18), respectively (Figure 6B), with no significant difference (p=0.45). The EFS rate was 0% in both PD-L1 positive (n=13) and negative patients (n=9) (Figure 6C), with no significant difference (p=0.76). The OS rates were 76.3% and 100% in PD-L1 positive (n=13) and negative patients (n=9), respectively (Figure 6D), with no significant difference (p=0.18).
Table 2.
Immune checkpoint molecule’s positivity rate in the event group vs event absent group.
| Immune component | Event group Average (95% CI) | Event absent group Average (95%CI) |
|---|---|---|
| CD4 | 45.1 (28.8-61.3) | 28.5 (12.2-44.8) |
| CD8 | 15.3 (0.52-31.9) | 16.8 (0.59-33.1) |
| PD-1 | 16.6 (9.66-22.86) | 2.1 (14.0-18.4) |
| PD-L1 | 23.0 (6.82-39.3) | 33.0 (16.8-49.3) |
| IL-2 | 61.7 (45.5-78.0) | 43.9 (27.6-60.1) |
| IFN | 62.8 (46.6-79.1) | 46.5 (30.2-62.8) |
CI, confidence interval.
Discussion
According to previous reports, the expression of PD-1/PD-L1 in STS varies according to the subtype;24-26 however, there is still no conclusive evidence.27 In the present study, we investigated the expression of PD-1/PD-L1 inflammatory cytokine molecules in STS, which have complex genomic characteristics and aggressive clinical behavior by immunohistochemical analysis and its relationship with clinical features.
The expression rates of PD-1 and PD-L1 have been reported to be approximately 34-80% and are highest in UPS.28-30 While the expression rates of PD-1 and PD-L1 have been reported to be approximately 0-35% in MFS.30,31 The expression rates of PD-1 and PD-L1 have been reported to be little or nil31 or 13-17%32,33 in MPNST. The high expression rate in the present study suggests that the immune checkpoint mechanism may be strongly involved in the tumor microenvironment of UPS, MFS, and MPNST.
In a recent study on PD-1/PD-L1 immune checkpoint mechanisms in STS it was reported that PD-1/PD-L1 and PD-L2 were also expressed in approximately 30% of subcutaneous angiosarcomas and retroperitoneal sarcomas and were prognostic factors.34,35 In addition, studies on UPS, MFS, LMS, and LPS have clarified that PD-L1 is activated by the Th1 pathway.36 The study also suggested that those sarcomas have the therapeutic potential of immune checkpoint inhibitors, although the expression rate of each differs.36 The study further suggests that in UPS, CMTM6 may be a PD-L1 immune checkpoint inhibitor.37
Although our study did not focus on subcutaneous cases and did not include retroperitoneal cases, the findings are suggestive of the involvement of the PD-1/PD-L1 system in STS, which is consistent with previous studies. However, the novelty of this study is the involvement of inflammatory cytokines and evidence of the involvement of the PD-1/PD-L1 system in STSs, which have complex genomic characteristics and aggressive clinical behavior, especially MPNST. In general, the expression of PD-L1 is classified into constitutive or inductive.38
Inflammatory cytokines have been reported to induce PD-L1 expression.38 In particular, the involvement of IFN-γ in immune checkpoint induction has been reported.39 Notably, the expression of proinflammatory cytokines was high in the present study. Therefore, it suggests the possibility that the expression of PD-L1 in UPS, MFS, and MPNST was inducible.
In general, IL-2, which is secreted by CD4 + T cells, stimulates the activation of naïve CD8 T cells and the differentiation of cytotoxic T cells.40 IL-2 can up-regulate functions of CD4+Foxp3+ regulatory T cells (Treg). Treg cells are powerful immunosuppressors.41 In addition, IL-2 activation might induce the exhaustion of naïve CD8 + T cells in the tumor microenvironment of STS.42 However, in the current study, there was no significant difference in IL-2 positivity between patients with poor clinical outcomes and those without poor clinical outcomes. There were correlations between positive cell rate of CD8 and IFN-γ or positive cell rate of IFN-γ and PD-L1. These findings suggest that inflammatory cytokines such as IL-2 and IFN-γ are involved in the pathogenesis of UPS, MYF, and MPNST.
Figure 3.

Graphs showing the strong positive correlation between the CD4 and IL-2 positivity rates (r = 0.66) in sarcomas (A); medium positive correlation between the CD8 and PD-1 positivity rates (r = 0.34) in sarcomas (B); strong positive correlation between the CD8 and IL-2 positivity rates (r = 0.55) in sarcomas (C); strong positive correlation between the CD8 and IFN-γ positivity rates (r = 0.69) in sarcomas (D); strong positive correlation between the IFN-γ and PD-L1 positivity rates (r = 0.60) in sarcomas (E).
Figure 4.
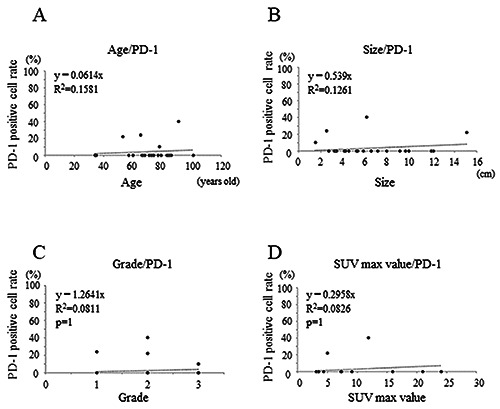
Graphs showing the medium positive correlation between age and PD-1 positivity rate (r = 0.29) in sarcomas (A); medium positive correlation between the tumor size and PD-1 positivity rate (r = 0.35) in sarcomas (B); weak positive correlation between the histological grade and PD-1 positivity rate (r = 0.28) in sarcomas (C); weak positive correlation between the SUV-max value and PD-1 positivity rate (r = 0.28) in sarcomas (D).
Figure 5.
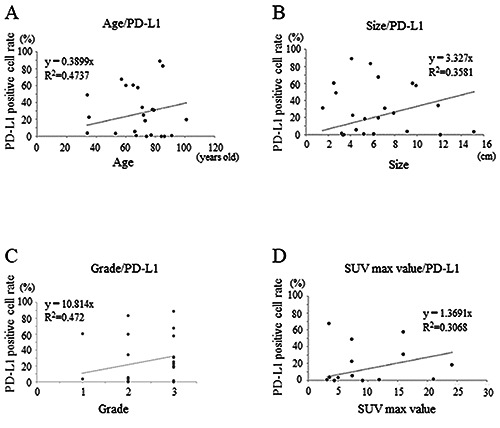
Graphs showing strong positive correlation between age and PD-L1 positivity rate (r = 0.68) in sarcomas (A); medium positive correlation between the tumor size and PD-L1 positivity rate (r = 0.59) in sarcomas (B); strong positive correlation between the histological grade and PD-L1 positivity rate (r = 0.68) in sarcomas (C); strong positive correlation between the SUV-max value and PD-L1 positivity rate (r = 0.55) in sarcomas (D).
Figure 6.

A) The 3-year event free survival (EFS) rate for PD-1- positive (red line) and -negative cases (blue line); the 3-year EFS rate for PD-1 positive and negative cases was 0%, and the difference was not significant (p=0.14). B) The 3-year overall survival (OS) rate for PD-1-positive (red line) and -negative cases (blue line); the 3-year OS rate for PD-1 positive cases was 100% and that for negative cases was 83.6%and the difference was not significant (p=0.45). C) The 3-year EFS rate for PD-L1-positive (red line) and -negative cases (blue line); the 3-year EFS rate for PDL1 positive and negative cases was 0%, and the difference was not significant (p=0.76). D) The 3-year OS rate for PD-L1-positive (red line) and -negative cases (blue line); the 3-year OS rate for PD-L1 positive cases was 76.3% and that for negative cases was 100%, and the difference was not significant (p=0.18).
Older age, larger size, higher grade, and higher SUV-max values have been reported as poor prognostic factors for STS.43-46 In the current study, a correlation was observed between these poor prognostic factors and the positive cell rates of immune checkpoint molecules. These findings suggest that the immune checkpoint mechanism may be active in UPS, MFS, and MPNST, which are all associated with poor prognostic factors. However, the correlation between PD-1/PD-L1 expression and clinical outcome was controversial, and no significant difference was found in the present study.
This study has some limitations. First, the small sample size may have affected the significance of the findings and potency of the statistical results. Second, since next-generation sequencing was not used, the cases with and without genetic variation could not be compared. Third, we could not investigate downstream pathway or other immune molecules such as Th1 and PD-L2. However, the study provides evidence for the involvement of the PD-1/PD-L1 immune checkpoint system, including inflammatory cytokines, in the pathogenesis of STS. Further studies with larger sample sizes are required to validate our findings.
Our results suggest that the inducible immune checkpoint mechanism may be involved in UPS, MFS, and MPNST, which have complex genomic characteristics and aggressive clinical behavior.
Acknowledgements
We thank Jay Wunder and Irene Andrulis for providing valuables suggestions about the study design. We would also like to thank Chikoto Tanaka for providing technical assistance.
References
- 1.Fletcher CD, Lazar AJ, Baldini EH, Messiou C, Blay JY, Pollock RE, et al. WHO Classification of Tumors of Soft Tissue and Bone. Antonescu CR (eds). 5th ed. IARC Publications, Lyon: 2020. p. 6-12. [Google Scholar]
- 2.Penel N, Coindre JM, Giraud A, Terrier P, Ranchere-Vince D, Collin F, et al. Presentation and outcome of frequent and rare sarcoma histologic subtypes: A study of 10,262 patients with localized visceral/soft tissue sarcoma managed in reference centers. Cancer 2018;124:1179-87. [DOI] [PubMed] [Google Scholar]
- 3.Clark MA, Fisher C, Judson I, Thomas JM. Soft-tissue sarcomas in adults. N Engl J Med 2005;353:701-11. [DOI] [PubMed] [Google Scholar]
- 4.Tanaka K, Mizusawa J, Fukuda H, Araki N, Chuman H, Takahashi M, et al. Perioperative chemotherapy with ifosfamide and doxorubicin for high-grade soft tissue sarcomas in the extremities (JCOG0304). Jpn J Clin Oncol 2015;45:555-61. [DOI] [PubMed] [Google Scholar]
- 5.Davis EJ, Chugh R, Zhao L, Lucas DR, Biermann JS, Zalupski MM, et al. A randomized open-label phase II study of neoadjuvant doxorubicin and ifosfamide versus gemcidabine and docetaxel in patients with localized, high risk, soft tissue sar coma. Eur J Cancer 2015;51:1794-802. [DOI] [PubMed] [Google Scholar]
- 6.van der Graaf WT, Blay JY, Chawla SP, Kim DW, Bui-Nguyen B, Casali PG, et al. Pazopanib for metastatic soft-tissue sarcoma (PALETTE): a randomised, double-blind, placebo-controlled phase 3 trial. Lancet 2012;379:1879-86. [DOI] [PubMed] [Google Scholar]
- 7.Kawai A, Araki N, Sugiura H, Ueda T, Yonemoto T, Takahashi M, et al. Trabectedin monotherapy after standard chemotherapy versus best supportive care in patients with advanced, translocation-related sarcoma: a randomised, open-label, phase 2 study. Lancet Oncol 2015;16:406-16. [DOI] [PubMed] [Google Scholar]
- 8.Schöffski P, Chawla S, Maki RG, Italiano A, Gelderblom H, Choy E, et al. Eribulin versus dacarbazine in previously treated patients with advanced liposarcoma or leiomyosarcoma: a randomised, open-label, multicentre, phase 3 trial. Lancet 2016;387:1629-37. [DOI] [PubMed] [Google Scholar]
- 9.Stefanovski PD, Bidoli E, De Paoli A, Buonadonna A, Boz G, Libra M, et al. Prognostic factors in soft tissue sarcomas: a study of 395 patients. Eur J Surg Oncol 2002;28:153-64. [DOI] [PubMed] [Google Scholar]
- 10.Dong H, Strome SE, Salomao DR, Tamura H, Hirano F, Flies DB, et al. Tumor-associated B7-H1 promotes T-cell apoptosis: a potential mechanism of immune evasion. Nat Med 2002;8:793-800. [DOI] [PubMed] [Google Scholar]
- 11.Ghebeh H, Mohammed S, Al-Omair A, Qattan A, Lehe C, Al- Qudaihi G, et al. The B7-H1 (PD-L1) T lymphocyte-inhibitory molecule is expressed in breast cancer patients with infiltrating ductal carcinoma: correlation with important high-risk prognostic factors. Neoplasia 2006;8:190-8. [DOI] [PMC free article] [PubMed] [Google Scholar]
- 12.Ohigashi Y, Sho M, Yamada Y, Tsurui Y, Hamada K, Ikeda N, et al. Clinical significance of programmed death-1 ligand-1 and programmed death-1 ligand-2 expression in human esophageal cancer. Clin Cancer Res 2005;11:2947-53. [DOI] [PubMed] [Google Scholar]
- 13.Gong J, Chehrazi-Raffle A, Reddi S, Salgia R.Development of PD-1 and PD-L1 inhibitors as a form of cancer immunotherapy: a comprehensive review of registration trials and future considerations. J Immunother Cance. 2018;6:8. [DOI] [PMC free article] [PubMed] [Google Scholar]
- 14.Mahoney KM, Freeman GJ, McDermott DF. The Next Immune-Checkpoint Inhibitors: PD-1/PD-L1 Blockade in Melanoma. Clin Ther 2015;37:764-82. [DOI] [PMC free article] [PubMed] [Google Scholar]
- 15.Oike N, Kawashima H, Ogose A, Hotta T, Hatano H, Ariizumi T, et al. Prognostic impact of the tumor immune microenvironment in synovial sarcoma. Cancer Sc. 2018;109:3043-54. [DOI] [PMC free article] [PubMed] [Google Scholar]
- 16.Boxberg M, Steiger K, Lenze U, Rechl H, von Eisenhart-Rothe R, Wörtler K, et al. PD-L1 and PD-1 and characterization of tumor-infiltrating lymphocytes in high grade sarcomas of soft tissue - prognostic implications and rationale for immunotherapy. Oncoimmunology 2017;7:e1389366. [DOI] [PMC free article] [PubMed] [Google Scholar]
- 17.D'Angelo SP, Mahoney MR, Van Tine BA, Atkins J, Milhem MM, Jahagirdar BN, et al. Nivolumab with or without ipilimumab treatment for metastatic sarcoma (Alliance A091401): two open-label, non-comparative, randomised, phase 2 trials. Lancet Oncol 2018;19:416-26. [DOI] [PMC free article] [PubMed] [Google Scholar]
- 18.Burgess MA, Bolejack V, Van Tine BA, Schuetze S, Hu J, D'Angelo SP, et al. Multicenter phase II study of pembrolizumab (P) in advanced soft tissue (STS) and bone sarcomas (BS): Final results of SARC028 and biomarker analyses. J Clin Oncol 2017;35:suppl-11008. [Google Scholar]
- 19.D'Angelo SP, Shoushtari AN, Keohan ML, Dickson MA, Gounder MM, Chi P, et al. Combined KIT and CTLA-4 Blockade in Patients with Refractory GIST and Other Advanced Sarcomas: A Phase Ib Study of Dasatinib plus Ipilimumab. Clin Cancer Res 2017;23:2972-80. [DOI] [PMC free article] [PubMed] [Google Scholar]
- 20.Ogura K, Hosoda F, Arai Y, Nakamura H, Hama N, Totoki Y, et al. Integrated genetic and epigenetic analysis of myxofibrosarcoma. Nat Commun 2018;9:2765. [DOI] [PMC free article] [PubMed] [Google Scholar]
- 21.Widemann BC, Italiano A.Biology and management of undifferentiated pleomorphic sarcoma, myxofibrosarcoma, and malignant peripheral nerve sheath tumors: State of the art and perspectives. J Clin Oncol 2018;36:160-7. [DOI] [PMC free article] [PubMed] [Google Scholar]
- 22.Kakavand H, Wilmott JS, Long GV, Scolyer RA. Targeted therapies and immune checkpoint inhibitors in the treatment of metastatic melanoma patients: a guide and update for pathologists. Pathology 2016;48:194-202. [DOI] [PubMed] [Google Scholar]
- 23.Gundle KR, Kafchinski L, Gupta S, Griffin AM, Dickson BC, Chung PW, et al. Analysis of margin classification systems for assessing the risk of local recurrence after soft tissue sarcoma resection. J Clin Oncol 2018;36:704-9. [DOI] [PubMed] [Google Scholar]
- 24.Orth MF, Buecklein VL, Kampmann E, Subklewe M, Noessner E, Cidre-Aranaz F, et al. A comparative view on the expression patterns of PD-L1 and PD-1 in soft tissue sarcomas Cancer Immunol Immunother 2020;69:1353-62. [DOI] [PMC free article] [PubMed] [Google Scholar]
- 25.Kim C, Kim EK, Jung H, Chon HJ, Han JW, Shin KH, et al. Prognostic implications of PD-L1 expression in patients with soft tissue sarcoma. BMC Cancer 2016;16:434. [DOI] [PMC free article] [PubMed] [Google Scholar]
- 26.Paydas S, Bagir EK, Deveci MA, Gonlusen G.Clinical and prognostic significance of PD-1 and PD-L1 expression in sarcomas. Med Oncol 2016;33:93. [DOI] [PubMed] [Google Scholar]
- 27.van Erp AEM, Versleijen-Jonkers YMH, Hillebrandt-Roeffen MHS, van Houdt L, Gorris MAJ, van Dam LS, et al. Expression and clinical association of programmed cell death- 1, programmed death-ligand-1 and CD8+ lymphocytes in primary sarcomas is subtype dependent. Oncotarget 2017;8: 71371-84. [DOI] [PMC free article] [PubMed] [Google Scholar]
- 28.Boxberg M, Steiger K, Lenze U, Rechl H, von Eisenhart-Rothe R, Wörtler K, et al. PD-L1 and PD-1 and characterization of tumor-infiltrating lymphocytes in high grade sarcomas of soft tissue – prognostic implications and rationale for immunotherapy. Oncoimmunology 2017;7:e1389366. [DOI] [PMC free article] [PubMed] [Google Scholar]
- 29.Pollack SM, He Q, Yearley JH, Emerson R, Vignali M, Zhang Y, et al. T-cell infiltration and clonality correlate with programmed cell death protein 1 and programmed death-ligand 1 expression in patients with soft tissue sarcomas. Cancer 2017;123:3291-304. [DOI] [PMC free article] [PubMed] [Google Scholar]
- 30.Budczies J, Mechtersheimer G, Denkert C, Klauschen F, Mughal SS, Chudasama P, et al. PD-L1 (CD274) copy number gain, expression, and immune cell infiltration as candidate predictors for response to immune checkpoint inhibitors in softtissue sarcoma. Oncoimmunology 2017;6:e1279777. [DOI] [PMC free article] [PubMed] [Google Scholar]
- 31.D'Angelo SP, Shoushtari AN, Agaram NP, Kuk D, Qin LX, Carvajal RD, et al. Prevalence of tumor-infiltrating lymphocytes and PD-L1 expression in the soft tissue sarcoma microenvironment. Hum Pathol 2015;46:357-65. [DOI] [PMC free article] [PubMed] [Google Scholar]
- 32.Davis LE, Nicholls LA, Babiker HM, Liau J, Mahadevan D.PD-1 Inhibition achieves a complete metabolic response in a patient with malignant peripheral nerve sheath tumor. Cancer Immunol Res 2019;7:1396-400. [DOI] [PubMed] [Google Scholar]
- 33.Shurell E, Singh AS, Crompton JG, Jensen S, Li Y, Dry S, et al. Characterizing the immune microenvironment of malignant peripheral nerve sheath tumor by PD-L1 expression and presence of CD8+ tumor infiltrating lymphocytes. Oncotarget 2016;7:64300-8. [DOI] [PMC free article] [PubMed] [Google Scholar]
- 34.Gambichler T, Koim S, Wrobel M, Käfferlein HU, Brüning T, Stockfleth E, et al. Expression of Programmed Cell Death Proteins in Kaposi Sarcoma and Cutaneous Angiosarcoma. J Immunother 2020;43:169-74. [DOI] [PubMed] [Google Scholar]
- 35.Miyake M, Oda Y, Nishimura N, Morizawa Y, Ohnishi S, Hatakeyama K, et al. Integrative assessment of clinicopathological parameters and the expression of PD-L1, PD-L2 and PD-1 in tumor cells of retroperitoneal sarcoma. Oncol Lett 2020;20:190. [DOI] [PMC free article] [PubMed] [Google Scholar]
- 36.Wunder JS, Lee MJ, Nam J, Lau BY, Dickson BC, Pinnaduwage D, et al. Osteosarcoma and soft-tissue sarcomas with an immune infiltrate express PD-L1: relation to clinical outcome and Th1 pathway activation. Oncoimmunology 2020;9:1737385. [DOI] [PMC free article] [PubMed] [Google Scholar]
- 37.Ishihara S, Iwasaki T, Kohashi K, Yamada Y, Toda Y, Ito Y, et al. The association between the expression of PD-L1 and CMTM6 in undifferentiated pleomorphic sarcoma. J Cancer Res Clin Oncol 2021;147:2003-11. [DOI] [PMC free article] [PubMed] [Google Scholar]
- 38.Ribas A, Hu-Lieskovan S.What does PD-L1 positive or negative mean? J Exp Med 2016;213:2835-40. [DOI] [PMC free article] [PubMed] [Google Scholar]
- 39.Liang SC, Latchman YE, Buhlmann JE, Tomczak MF, Horwitz BH, Freeman GJ, et al. Regulation of PD-1, PD-L1, and PDL2 expression during normal and autoimmune responses. Eur J Immunol 2003;33:2706-16. [DOI] [PubMed] [Google Scholar]
- 40.Shrikant P, Khoruts A, Mescher MF. CTLA-4 blockade reverses CD8+ T cell tolerance to tumor by a CD4+ T cell- and IL- 2-dependent mechanism. Immunity 1999;11:483-93. [DOI] [PubMed] [Google Scholar]
- 41.Tran DQ, Glass DD, Uzel G, Darnell DA, Spalding C, Holland SM, et al. Analysis of Adhesion Molecules, Target Cells, and Role of IL-2 in Human FOXP3+ Regulatory T Cell Suppressor Function. J Immunol. 2009;182(5)2929-38. [DOI] [PMC free article] [PubMed] [Google Scholar]
- 42.Schietinger A, Greenberg PD. Tolerance and exhaustion: defining mechanisms of T cell dysfunction. Trends Immunol 2014;35:51-60. [DOI] [PMC free article] [PubMed] [Google Scholar]
- 43.Iqbal N, Shukla NK, Deo SV, Agarwala S, Sharma DN, Sharma MC, et al. Prognostic factors affecting survival in metastatic soft tissue sarcoma: an analysis of 110 patients. Clin Transl Oncol 2016;18:310-6. [DOI] [PubMed] [Google Scholar]
- 44.Coindre JM, Terrier P, Bui NB, Bonichon F, Collin F, Le Doussal V, et al. Prognostic factors in adult patients with locally controlled soft tissue sarcoma. A study of 546 patients from the French Federation of Cancer Centers Sarcoma Group. J Clin Oncol 1996;14:869-77. [DOI] [PubMed] [Google Scholar]
- 45.Hong SP, Lee SE, Choi YL, Seo SW, Sung KS, Koo HH, et al. Prognostic value of 18F-FDG PET/CT in patients with soft tissue sarcoma: comparisons between metabolic parameters. Skeletal Radiol 2014;43:641-8. [DOI] [PubMed] [Google Scholar]
- 46.Lahat G, Dhuka AR, Lahat S, Lazar AJ, Lewis VO, Lin PP, et al. Complete soft tissue sarcoma resection is a viable treatment option for select elderly patients. Ann Surg Oncol 2009;16:2579-86. [DOI] [PubMed] [Google Scholar]