

Abstract
The particle irradiation data ensemble (PIDE) is the largest database of cell survival data measured after exposure to ion beams and photon reference radiation. We report here on the updated version of the PIDE database and demonstrate how to investigate generic properties of radiation dose response using these sets of raw data. The database now contains information of over 1100 pairs of photon and ion dose response curves. It provides the originally published raw data of cell survival in addition to given linear quadratic (LQ) model parameters. If available, the raw data were used to derive LQ model parameters in the same way for all experiments. To demonstrate the extent of the database and the variability among experiments we focus on the dose response curves after ion and photon radiation separately in a first step. Furthermore, we discuss the capability and the limitations of the database for analyzing properties of low and high linear energy transfer (LET) radiation response based on multiple experiments. PIDE is freely available to the research community under www.gsi.de/bio-pide.
Keywords: dose response, relative biological effectiveness (RBE), cell survival, high LET
INTRODUCTION
The loss of proliferation capacity as measured by the clonogenic survival assay has established itself as the ‘gold standard’ to test for radiation effects in in vitro experiments using mammalian cell lines. Since the pioneering experiments by Puck and Markus [1] it is known that mammalian cells usually exhibit a shoulder-shaped dose response curve. The nonlinearity in the dose response is commonly interpreted as a hallmark of the cells’ repair mechanism or the distinction of lethal and sublethal damage [2]. To parameterize such dose response curves, the linear quadratic (LQ) model is the most established mathematical framework, which is regarded either empirically or to reflect some mechanistic underpinning [3].
Many experimental survival studies have been published comparing cell survival after ion and photon reference radiation, mostly to investigate the phenomenon of enhanced effects observed after high linear energy transfer (LET) radiation, which is often expressed as relative biological effectiveness (RBE). While such studies share many common aspects, they differ in the choice of cell lines or other effect modifying factors, such as the specific radiation qualities used, for example. The general goal of databases compiling such experiments is to analyze the impact of experimental choices and constraints on the effect and on the RBE.
The particle irradiation data ensemble (PIDE) contains results of in vitro cell survival experiments gathered in an extensive literature survey, which were performed after ion irradiation and compared with corresponding reference measurements using photon radiation [4]. Such a collection facilitates the analysis of properties of RBE with unprecedented statistical power. The dose response curves were expressed by the LQ parameters in the first consistent version of PIDE (labeled PIDE 2.0), i.e. within the formalism –ln(S) = α d + β d2, where α and β are the linear and quadratic coefficients, respectively, d is the radiation dose and S the corresponding cell survival. It was launched in 2013 on a website (www.gsi.de/bio-pide), where we made it available to the scientific community after user registration. The database is disseminated as ASCII tables and MS Excel files. While the data ensemble turned out to be a very useful tool in many ways, we found options for enhancements in three aspects: First, augmenting the database by further entries newly spotted out in the literature adds statistical power. Second, the availability of raw data would allow a much more detailed insight in the experiments’ original results and facilitate uncertainty estimates. Third, deriving LQ model based fits to the raw data of all experiments in the same way establishes a set of consistent LQ parameters, thus facilitating a ‘fair’ comparison between different experiments. After several revisions the current updated version PIDE 3.2, which is available since November 2019, now provides over 1100 experimental pairs of photon and ion survival curves as well as the experiments’ raw data (doses and survival levels) and ‘fair’ fits.
For most of the experiments, raw data are available. The experiment specifications cover many cell lines (tumor and normal cell lines, rodent and human ones, different radiosensitivities) either synchronized or distributed in cell cycle, various ion species and photon radiation sources and multiple irradiation settings (e.g. within a spread-out Bragg peak or in a monoenergetic beam). For a typical application, one may distill a subset of all database entries that match a number of comparability criteria (such as all experiments with V79 cells within a given LET window, for example) and investigate the radiation response within that subset.
Until now, about 160 colleagues downloaded the previous version PIDE 2.0 and about 100 the current version PIDE 3.2. The database has been used within a considerable number of publications so far for different purposes in the fields of radiation biology and therapy in our own group [5–8] as well as from others [9–19]. Also, colleagues reported to us that they used the database to identify available data they found useful for their research, and to become aware of degrees of freedom impacting radiation response.
In this report, we want to demonstrate how the raw data was retrieved and LQ parameters were derived in the updated PIDE 3.2. We furthermore use the data to demonstrate the parameter ranges covered within PIDE and evaluate as an example of application the variability of sensitivities to photon radiation within experiments using the same cell line. Additionally, we investigate RBE(LET) relationships at the example of carbon ion irradiation.
MATERIALS AND METHODS
Determination of data
As one aspect of the database update, over 200 new experiments were included, enhancing further its total content. For all included experiments, quality criteria as described previously [4] were required in order to assure that the experiments can be used for RBE determination. In the process of updating, the previous entries were rechecked and corrected where necessary. Detected bugs—typically typographic errors—were eliminated.
To characterize the radiation quality in the experiments, the available information in the original publications on photon energy source, ion energy and ion LET was included. If not fully specified, energies and LET values were calculated from each other using the stopping power code ATIMA [20]. For exposures within a spread-out Bragg peak LET values were either taken from the publications, where they specify either track or dose average LET values of the mixed radiation field, or, if only the mean energy at the cell target was specified in the publications, a corresponding LET value was calculated with ATIMA. This method was applied regardless of whether the contribution of secondary fragment particles was included explicitly or not. The entire procedure was followed already in the previous version PIDE 2.0. Moreover, the type of photon reference radiation quality is now explicitly included in PIDE 3.2.
The raw survival data (i.e. dose values and corresponding survival levels) are the most basic description of the experimental results. If they are available within the original publications, they were included in PIDE 3.2. This was realized typically by inspecting the plots of dose response curves and digitizing plot symbols. Alternatively, in few cases, survival values were given explicitly and included in the publications. The raw data for the large data collection of Furusawa et al. [21] were directly obtained from the authors. Uncertainty estimates of survival levels were not included, mainly because in many publications none are given, or they are evaluated by different methods, making them incomparable.
The PIDE 3.2 contains two sets of LQ parameters for photons as well as for ions: One set of LQ parameters directly stems from the original publications and only reflects information therein: If LQ parameters were published, they were included. If a different parameterization of the dose response curve was used originally, corresponding LQ parameters were derived and included as well. For example, in Wulf et al. [22] apparently linear survival curves were parameterized by the inactivation cross section σ, where α = σρ/L with target density ρ and LET L. If no parameterization was given at all, no values are tabled in PIDE 3.2. The second set of LQ parameters originates from our own fit to the raw data as described in the next section.
Model fits
Unfortunately, different authors use different ways of evaluating their data to retrieve LQ model parameters. Differences consist in: (i) either evaluating the plating efficiency jointly from all dose points as an offset or from considering controls at 0 Gy only, (ii) fitting either exp(−α d - β d2) to survival data or (α d + β d2) to negative log survival data, (iii) including uncertainties in the fit or not, and (iv) leaving or not leaving out data points at high doses, where the LQ model tends to lose validity. In order to evade these ambiguities we set up a clear and most general recipe for fitting the LQ model to the raw data, that provides a unique method applicable to all data sets in the same way and resulting in comparable LQ parameters and associated uncertainty information. The obtained LQ parameters by this method are included in PIDE 3.2. We proceeded as follows:
If no survival level was given at 0 Gy, it was artificially added and set to 1. This is reasonable, as cell inactivation of unirradiated samples is typically determined to obtain the plating efficiency, which is used to normalize the survival data to full survival at 0 Gy. By including the data point to the raw data we appreciate that it was actually measured.
-
Then, independently, three different fits were performed to the negative log survival data – ln(S), provided the data set contains more measurement points than the number of free parameters in the fit functions. Otherwise, no fit was performed. The functions are:
-ln(S) = α d + β d2 + c (Full LQ model)
-ln(S) = α d + c (Linear model)
-ln(S) = β d2 + c (Quadratic model)
Here, α and β are the typical LQ parameters as mentioned above, and the parameter c is an offset in –ln(S) which acts as a correction term to the plating efficiency. We generally included this term, as thereby a PE correction was inferred equally balanced from all dose points instead of at 0 Gy only.
The covariance matrix of each fit and the reduced χ2 values (i.e. χ2 per degree of freedom) were determined as well.
Based on the reduced χ2 values, the best fit variant was determined. Additionally, even if the full LQ fit performs best but the alpha term is evaluated negative, it is rejected and the best fit is determined among the linear and the quadratic fit model, as negative alpha terms should not be allowed considering its mechanistic meaning. The beta term instead is allowed to assume negative values, which may occur, e.g. when subpopulations of different radiosensitivities coexist within the cell culture. Then the resistant cells give rise to elevated survival probability at high doses, apparent as a negative beta value.
The following parameters (α, β, c), the full covariance matrix and the reduced χ2 values were tabled for the best fit variant. For the pure linear and for the pure quadratic model, β and α were set to 0, respectively, and the same applies for the corresponding entries in the covariance matrix.
The model selection included in this process brings along two advantages as compared to a static LQ fit: First, from the covariance matrix an appropriate uncertainty estimate for the parameters was derived based on the fluctuations of the data points about the best fit curve. Second, if a parameter is redundant and its uncertainty becomes large, a linear or a quadratic fit without that parameter eventually may result in a better fit with more exact parameters. This is typically the case for high LET radiation, where no shoulder is evident but dose response curves can be simply represented by a straight line.
RESULTS
Key features of PIDE 3.2
The experiments included in the updated database originate from 115 publications. Table 1 provides an overview of the number of cell survival curves contained in the PIDE, resolving for how many experiments raw data and/or LQ parameters were given in the publication as well as the number of LQ fits which we performed based on published raw data. For a gross part of the data collection, both ion and photon raw data are available within PIDE 3.2, and so are derived LQ parameters. As often multiple ion experiments are performed with the same cell line, these experiments share the same reference curve. In Table 1 we thus indicated the number of experiments for which photon curves are available as well as the number of distinct reference curves.
Table 1.
Overview of amount of dose response curves contained in the PIDE
| Number of considered publications | 115 | |
| Number of experimental pairs | 1118 | |
| Photons | Ions | |
| Number of experiments with available raw data | 248 (for 1059 ion experiments) | 953 |
| Number of experiments without available raw data | 8 (for 59 ion experiments) | 165 |
| Number of LQ parameters in publications | 121 (for 616 ion experiments) | 754 |
To facilitate a sub-selection of experiments according to specific criteria for the user, in addition to the dose response characterization a number of additional experiment specific parameters are listed in PIDE 3.2. These are:
The name of the cell line used
The species (human or rodent), cell type (normal or cancer cells) and DNA content in diploid cells (6.0 Gbp for human or 5.6 Gbp for rodent cells). The cell cycle stage (synchronized in a phase or asynchronous)
The photon reference radiation type (including the peak energy for orthovoltage X-rays)
The ion species and the corresponding nuclear charge
The irradiation condition (quasi-monoenergetic within a pristine Bragg peak fulfilling track-segment conditions or within a spread-out Bragg peak)
The LET in water at the position of the irradiated cells (in spread-out Bragg peaks mostly the dose mean and in few cases also the track mean LET are given as specified in the publications)
The ion energy at the position of the irradiated cells (in spread-out Bragg peaks an indicative value was calculated corresponding to the given LET value).
Based on the desired usage of the database, with these specifications it is simple to select a subset of the database by means of table filtering. For example, all experiments performed with V79 cells after carbon irradiation within a specified LET window could be determined and analyzed separately.
Photon fit parameters
Before considering specific relations between radiobiological quantities and dose response curves, it is instructive to inspect the properties of all PIDE data, reflecting generic properties of cell survival experiments. The 245 photon parameter sets obtained by our own fits to the raw data are illustrated in Fig. 1 as a scatter plot of the LQ coefficients plotted against each other. Accumulation of points at α = 0 and β = 0 in that plot refers to quadratic and linear fits, while all other data points originate from a LQ fit. Typically, α values are of order of 0.1 Gy−1 and β values of 0.03 Gy−2. Negative β values are mostly found going along with large α values. This may be attributed to a radioresistant subpopulation (such as S phase cells where DNA damage repair is very efficient), which may still survive at intermediate doses when the more sensitive cells are already inactivated due to their large α term. Moreover, generally a small anti-correlation between α and β is observed as expected and discussed previously in Friedrich et al. [23].
Fig. 1.

Scatter plot of photon LQ parameters α vs β contained in PIDE. While negative β values were allowed, α was restricted to positive values in the fit procedure. Note that not all data points are included in the figure, as some cell experiments showed dose response parameters exceeding the plot limits.
Inspecting the corresponding frequency histograms of the photon LQ parameters (Figs 2a and b) it becomes evident that the α values of all cell lines used are broadly distributed and have a tail towards high values, whereas the distribution of β value appears to be rather condensed, as it shows a pronounced maximum. We conjecture that this observation is generally valid for mammalian cell lines, because PIDE contains a plethora of cell lines, thus reflecting what is used in the radiobiology labs all over the world.
Fig. 2.

Frequency histograms for photon α and β (A and B, respectively) according to Fig. 1 and the corresponding photon α/β ratio (C). Histogram boundaries have been chosen in order to reflect the main part of the distribution.
The ratio of the photon LQ parameters α/β is often used as an indicator for the radiosensitivity of the cell. In the therapeutic context they represent a measure for fractionation sensitivity, as the quadratic component relative to the linear one determines a correction term when changing between fractionation schemes at equal effect. Figure 2c shows the histogram of α/β, where cases were excluded when either α or β were 0. Typically, α/β values are in the order of 5–10 Gy, while smaller values are occurring less often. Again, the distribution appears to be heavy tailed, which will be explained below.
Ion fit parameters
Figure 3 shows a scatter plot for the ion LQ parameters plotted against each other. As observed already in Fig. 1, some data accumulate at either α = 0 or β = 0. Again, in particular for large values of α, β is likely to vanish or even be negative, and this trend is even more expressed as observed for photons. This indicates a general variation of the β term with LET, as demonstrated already in [4].
Fig. 3.

Scatter plot as Fig. 1, but for ion dose response curves. The dashed and dotted lines are linear fits to the data points including or neglecting data where one parameter is zero, respectively. Note that not all data points are included in the figure, as some cell experiments showed dose response parameters exceeding the plot limits.
As can be seen in Fig. 4, the distribution of α is considerably broadened as compared to the photon data, which is explained by a variation of this parameter with LET. Notably, the PIDE contains ion dose response information covering a wide range of LET values.
Fig. 4.

Frequency histograms for ion α and β (A and B, respectively) according to Fig. 3. Purely quadratic or linear fits lead to peaks at α = 0 and β = 0, respectively. Histogram boundaries were chosen in order to reflect the main part of the distribution.
Correspondence between cell line and photon dose response
In the previous sections large parameter variations are expected, because very different biological systems were compared. In contrast, we here investigate exemplarily the variation of LQ parameters for one cell line only. For this purpose, the V79 cell line is well-suited as it is the one which is most often listed within PIDE. Excluding again cases where either α or β are 0, PIDE contains photon LQ parameters from 38 different photon experiments. Figure 5 demonstrates that the LQ parameters have a smaller but still considerable scatter as compared to Fig. 1, while the gross part of the corresponding survival curves form a tight family of curves, resulting in comparable doses typically needed for a reference level of cell inactivation. This is reasoned in a small anti-correlation of the LQ parameters that can already be appreciated in the scatter plot and has been investigated previously [4]. Therefore, variations in the α term compensate the β term in the intermediate dose ranges, making fluctuations less strongly evident in survival curves. However, as the cell lines were cultured in different labs and handled by different people, they might have attained their own distinct properties and thus may show additional variations in radiosensitivities. In contrast, the name of cell lines (here V79) rather characterizes its origin and is not uniquely connected to properties in radiosensitivity. Hence, the database provides information to appreciate the spread in sensitivity parameters that may be due to developmental factors of cell lines of same origin.
Fig. 5.

Scatter plot of α and β values for 38 LQ photon parameter sets for V79 cells (A), corresponding survival curves (B) and dose values D10 at 10% survival level (C).
When deriving LQ parameters from experimental survival data their fluctuations have an important consequence: Uncertainties in dose response measurements will propagate to uncertainties in the derived LQ parameters, which may be considerably large due to the anti-correlation between the parameters. For instance, if by chance at low doses cell survival is measured smaller than its expectation value, α will be derived too large and β too small to compensate the strong α term in the rest of the curve. In the discussed example of V79 cells we find that α = 0.17 ± 0.10 Gy−1 and β = 0.025 ± 0.011 Gy−2 for all experiments, where the uncertainties are unweighted standard deviations of the LQ parameters. Moreover, from inspecting the covariance matrix of each fit to the available data we obtained uncertainty intervals for the LQ parameters of each individual experiment as indicated by the error bars in Fig. 5a. The unweighted mean uncertainties are <Δα> = 0.04 Gy−1 and <Δβ> = 0.005 Gy−2. This demonstrates that the average size of error bars is about half of the fluctuation width of the data points, and thus the scatter of the data reflects true properties of the cells under investigation and cannot be explained solely by statistical fluctuations of survival measurements.
Concerning the α/β ratio, these uncertainties will be even more amplified, as can be seen in Fig. 6a, where the α/β values are very broadly distributed. Considering α and β as independent random variables with means and standard deviations as given above, the ratio α/β can be evaluated by means of analytic arithmetic techniques as outlined in [24]. This leads to the solid curve in Fig. 6. Intuitively as β can get small by chance, large ratios are not unlikely to occur, which explains the heavy tail in the distribution. As, however, in histograms information gets lost because data points lose their position information once categorized into bins, we also investigated the cumulative distribution function. In first order, the analytic approach describes the shape indicated by the experimental data points correctly. This demonstrates that comparing data from different publications (or different experiments) under seemingly comparable conditions may result in a large scatter of derived radiobiological quantities even if the same cell type is used for the experiments. We suspect that this is due to variations in cell handling and culture conditions in the different labs as well as on the age and history of the particular cell culture.
Fig. 6.
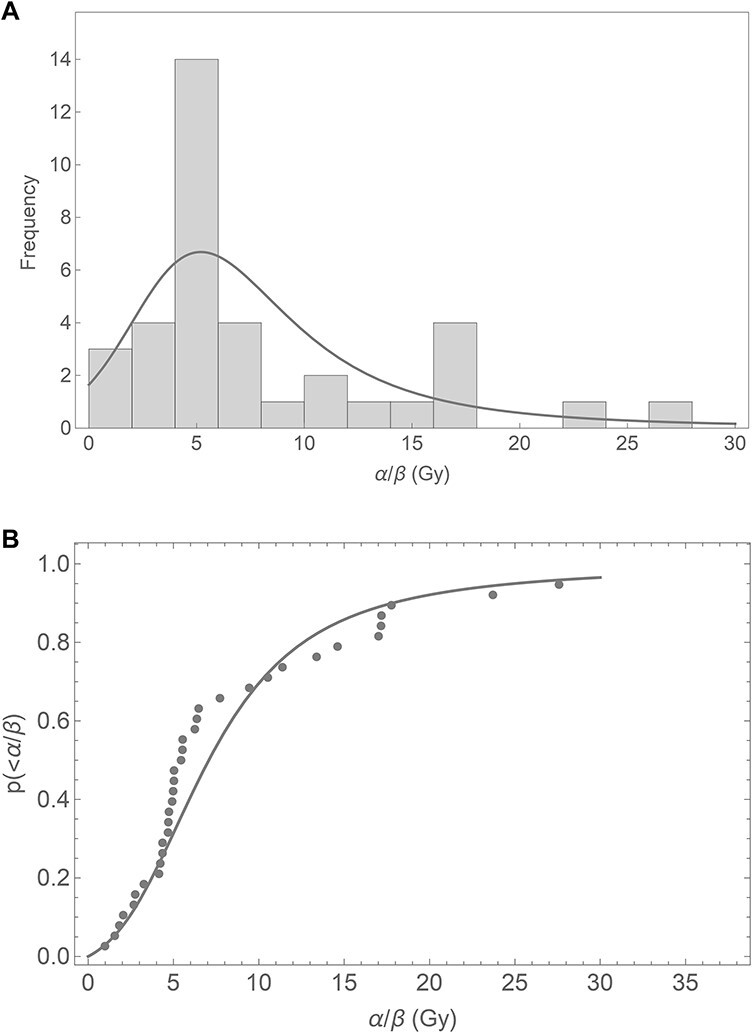
Frequency distribution (A) and cumulative relative frequency distribution (B) of α/β ratios for 38 photon dose response curves using V79 cells. The solid curves represent an analytical formulation, see text.
High LET dose response and RBE
Sticking to the example of all V79 experiments listed in the PIDE, Fig. 7 displays the RBE after carbon ion irradiation at two dose levels as a function of LET. By using PIDE, the high LET dose response, expressed as RBE, can be obtained. For that purpose, as mentioned before, either the raw data or the tabled LQ parameters as given in the publications or derived by the authors’ own fits can be used. The RBE values in Fig. 7 were calculated by own fits to the raw data contained in the PIDE. The low dose limit RBEα shows considerable uncertainty. Note that the RBE as the ratio of two doses is a quantity similar affected by fluctuations as the α/β ratio, because the denominator can become small by chance, broadening up the probability distribution of the ratio. At larger doses, despite the uncertainty in the LQ coefficients, the fluctuations appear to be reduced. This goes along with the observation of robust dose response curves in the intermediate dose regime. While individual experiments are always subject to fluctuations, one can exploit PIDE to obtain average RBE values, provided if experimental conditions are similar enough.
Fig. 7.

RBEα in the low dose limit (red) and RBE10 for 10% cell survival (blue) after carbon ion irradiation of V79 cells in monoenergetic beams vs LET. RBE values were obtained from the LQ fits performed in the same way for all experiments. The four data points showing RBEα = 0 correspond to cases where the dose response after photon radiation was best fitted by a purely quadratic function, thus resulting in a vanishing α term.
The availability of raw data in PIDE 3.2 brings also the option to selectively evaluate RBE values only for effect levels where raw data exist. Therefore, for each survival curve the highest measured dose point was taken and the corresponding cell survival level was calculated with the LQ model. If the survival level of the considered RBE exceeds the lowest measured survival, the RBE was not calculated. Figure 8 shows the RBE vs LET relationship for all monoenergetic carbon ion experiments in PIDE 3.2 for 50% and 1% cell survival, provided that the underlying experimental data cover the corresponding survival level. There are less data points visible for 1% cell survival, as most experiments did not cover that survival level. Furthermore, both Figs 7 and 8 nicely demonstrate the decrease of RBE towards lower survival levels as a consequence of the dose dependence of RBE. This example shows that by working selectively with the LQ parameters, extrapolations into dose regions not covered by experiments can be avoided.
Fig. 8.

RBE50 (red) and RBE1 (blue) for PIDE experiments with monoenergetic carbon ion irradiations. The RBE at 1% survival was only calculated if the experiment was performed down to a cell survival level ≤ 1%. In contrast to Fig. 7, no database selection concerning the cell type was performed.
DISCUSSION
Depending on the question under investigation, using large data collections may be useful but may at the same time also infer problems. A collection of data allows one to identify generic properties of observables that may be hidden in individual experiments. Contrary to that, pooling information from multiple experiments leads to fluctuations due to differences between the experiments, which may again hide the information that is to be extracted. As pointed out by Jones in the context of dose response [25], databases cannot replace establishing large data sets that are obtained under exactly defined conditions. Therefore, caution is needed, and imposing restrictive filtering is a suggestive way to exploit the statistic power of databases. Previous data collections for more specific situations such as proton or carbon ions have been proven fruitful to exhibit specific properties of RBE [26, 27]. However, it should be noted that a set of gathered experiments reflects in the end the experimenters’ choice, and therefore all conclusions drawn from such data sets may be subject to a selection bias. For example, the shape of histograms in Figs 2 and 4 depend on the choice of cell lines investigated in individual research projects.
With the updated version of PIDE, from the raw dose response data the levels of uncertainties can be accessed as well. This is a novel aspect and opens doors for a quantitative assessment of properties of the LQ parameters (such as the evolution of β with LET) and the RBE. Corresponding studies from the authors are on the way. The strategy to solely extract uncertainty measures from fluctuations of the data and discard uncertainty estimates from individual data points allows one to perform LQ parameter fits in exactly the same way for all data sets for which raw data are available. This makes the derived parameters comparable, although the uncertainty information might not fully reflect experimental details. For the plots shown in the present publication, no qualitative changes occur if LQ parameters are used as given within the original publications underlying PIDE.
The examples presented show typical applications of PIDE. It can give an overview of survival data present in the literature and allows to determine typical orders of magnitude of parameters and their distributions. Concerning well established concepts like using the α/β ratio to characterize general properties of cell lines, our analysis suggests caution, because this quantity is inherently uncertainty prone, which goes back to its definition as a ratio. In particular, in multiple experiments the mean, the median and the most probable α/β ratio do not coincide, and in individual evaluations a bias towards larger values is expected. This demonstrates that the α/β ratio should be used rather as an indication than a fixed parameter. Exploiting the ion dose response information in PIDE allows one to investigate systematics of the LQ parameters after ion exposure and properties of RBE in great statistical detail. In particular, uncertainty properties of RBE can be investigated and implications for the use of RBE estimates in radiobiology and clinical applications can be derived.
The tabled structure of PIDE makes it simple to enhance. In the future we plan to further update it, when a sufficient number of new data becomes available. Possible further extensions could include the oxygenation status as well as other, non-mammalian cell lines. We feel that the most important capability of PIDE is that it can be used as a testing ground for biophysical effect models, which should be applicable to make predictions in multiple experimental scenarios. Such comprehensive model validations are planned to be performed for several biophysical models in a future work. Specifically, we currently work on benchmarking our own RBE model, the local effect model, at the hand of PIDE.
ACKNOWLEDGEMENTS
We thank M. Sc. A. Bothe for technical help in updating the database. We also thank Dr Y. Furusawa for sharing raw data of the experiments compound in Furusawa et al. [21]. This work was supported by HGS-HIRe for FAIR (Helmholtz Graduate School for Hadron and Ion Research).
CONFLICT OF INTEREST
The authors declare they have no conflicts of interest.
REFERENCES
- 1. Puck TT, Marcus PI. Action of x-rays on mammalian cells. J Exp Med 1956;103:653–66. [DOI] [PMC free article] [PubMed] [Google Scholar]
- 2. Goodhead DT. Saturable repair models of radiation action in mammalian cells. Radiat Res Suppl 1985;8:S58–67. [PubMed] [Google Scholar]
- 3. Brenner DJ, Hlatky LR, Hahnfeldt PJ et al. The linear-quadratic model and most other common radiobiological models result in similar predictions of time-dose relationships. Radiat Res 1998;150:83–91. [PubMed] [Google Scholar]
- 4. Friedrich T, Scholz U, Elsässer T et al. Systematic analysis of RBE and related quantities using a database of cell survival experiments with ion beam irradiation. J Radiat Res 2013;54:494–514. [DOI] [PMC free article] [PubMed] [Google Scholar]
- 5. Loeffler JS, Durante M. Charged particle therapy-optimization, challenges and future directions. Nat Rev Clin Oncol 2013;10:411–24. [DOI] [PubMed] [Google Scholar]
- 6. Durante M. New challenges in high-energy particle radiobiology. Br J Radiol 2014;87:20130626. [DOI] [PMC free article] [PubMed] [Google Scholar]
- 7. Grün R, Friedrich T, Krämer M et al. Systematics of relative biological effectiveness measurements for proton radiation along the spread out Bragg peak: experimental validation of the local effect model. Phys Med Biol 2017;62:890–908. [DOI] [PubMed] [Google Scholar]
- 8. Stewart RD, Carlson DJ, Butkus MP et al. A comparison of mechanism-inspired models for particle relative biological effectiveness (RBE). Med Phys 2018;45:e925–52. [DOI] [PubMed] [Google Scholar]
- 9. Cometto A, Russo G, Bourhaleb F et al. Direct evaluation of radiobiological parameters from clinical data in the case of ion beam therapy: an alternative approach to the relative biological effectiveness. Phys Med Biol 2014;59:7393–417. [DOI] [PubMed] [Google Scholar]
- 10. Tracy BL, Stevens DL, Goodhead DT et al. Variation in RBE for survival of V79-4 cells as a function of alpha-particle (helium ion) energy. Radiat Res 2015;184:33–45. [DOI] [PubMed] [Google Scholar]
- 11. Verkhovtsev A, Surdutovich E, Solov'yov AV. Multiscale approach predictions for biological outcomes in ion-beam cancer therapy. Sci Rep 2016;6:27654. [DOI] [PMC free article] [PubMed] [Google Scholar]
- 12. Mairani A, Magro G, Dokic I et al. Data-driven RBE parameterization for helium ion beams. Phys Med Biol 2016;61:888–905. [DOI] [PubMed] [Google Scholar]
- 13. Cunha M, Monini C, Testa E et al. NanOx, a new model to predict cell survival in the context of particle therapy. Phys Med Biol 2017;62:1248–68. [DOI] [PubMed] [Google Scholar]
- 14. Conte V, Selva A, Colautti P et al. Nanodosimetry: towards a new concept of radiation quality. Radiat Prot Dosimetry 2018;180:150–6. [DOI] [PubMed] [Google Scholar]
- 15. Howard ME, Beltran C, Anderson S et al. Investigating dependencies of relative biological effectiveness for proton therapy in cancer cells. Int J Part Ther 2018;4:12–22. [DOI] [PMC free article] [PubMed] [Google Scholar]
- 16. Parodi K. The biological treatment planning evolution of clinical fractionated radiotherapy using high LET. Int J Radiat Biol 2018;94:752–5. [DOI] [PubMed] [Google Scholar]
- 17. Manganaro L, Russo G, Bourhaleb F et al. 'Survival': a simulation toolkit introducing a modular approach for radiobiological evaluations in ion beam therapy. Phys Med Biol 2018;63:08NT01. [DOI] [PubMed] [Google Scholar]
- 18. Wang W, Li C, Qiu R et al. Modelling of cellular survival following radiation-induced DNA double-strand breaks. Sci Rep 2018;8:16202. [DOI] [PMC free article] [PubMed] [Google Scholar]
- 19. Jones B, Hill MA. Physical characteristics at the turnover-points of relative biological effect (RBE) with linear energy transfer (LET). Phys Med Biol 2019;64:225010. [DOI] [PubMed] [Google Scholar]
- 20. Geissel H, Weick H, Scheidenberger C et al. Experimental studies of heavy-ions slowing down in matter. Nucl Instr and Meth B 2002;195:3–54. [Google Scholar]
- 21. Furusawa Y, Fukutsu K, Aoki M et al. Inactivation of aerobic and hypoxic cells from three different cell lines by accelerated (3)He-, (12)C- and (20)Ne-ion beams. Radiat Res 2000;154:485–96. [DOI] [PubMed] [Google Scholar]
- 22. Wulf H, Kraft-Weyrather W, Miltenburger HG et al. Heavy-ion effects on mammalian cells: inactivation measurements with different cell lines. Radiat Res 1985;104:S122–34. [PubMed] [Google Scholar]
- 23. Friedrich T, Durante M, Scholz M. Modeling cell survival after photon irradiation based on double-strand break clustering in megabase pair chromatin loops. Radiat Res 2012;178:385–94. [DOI] [PubMed] [Google Scholar]
- 24. Friedrich T, Weyrather W, Elsässer T et al. Accuracy of RBE: experimental and theoretical considerations. Radiat Environ Biophys 2010;49:345–9. [DOI] [PubMed] [Google Scholar]
- 25. Jones B. Why RBE must be a variable and not a constant in proton therapy. Br J Radiol 2016;89:20160116. [DOI] [PMC free article] [PubMed] [Google Scholar]
- 26. Paganetti H. Relative biological effectiveness (RBE) values for proton beam therapy. Variations as a function of biological endpoint, dose, and linear energy transfer. Phys Med Biol 2014;59:R419–72. [DOI] [PubMed] [Google Scholar]
- 27. Ando K, Kase Y. Biological characteristics of carbon-ion therapy. Int J Radiat Biol 2009;85:715–28. [DOI] [PubMed] [Google Scholar]