

Abstract
Background and Purpose:
Healthy People establishes objectives to monitor the nation’s health. Healthy People 2020 (HP2020) included objectives to reduce national stroke and coronary heart disease (CHD) mortality by 20% (to 34.8 and 103.4 deaths per 100,000, respectively). Documenting the proportion and geographic distribution of counties meeting neither the HP2020 target nor an equivalent proportional reduction can help identify high-priority geographic areas for future intervention.
Methods:
County-level mortality data for stroke (ICD-10 codes I60–I69) and CHD (I20–I25) and bridged-race population estimates were used. Bayesian spatiotemporal models estimated age-standardized county-level death rates in 2007 and 2017 which were used to calculate and map the proportion and 95% credible interval (CI) of counties achieving neither the national HP2020 target nor a 20% reduction in mortality.
Results:
In 2017, 45.8% of counties (CI: 42.9, 48.3) met neither metric for stroke mortality. These counties had a median stroke death rate of 42.2 deaths per 100,000 in 2017, representing a median 12.8% decline. For CHD mortality, 26.1% (CI: 25.0, 27.8) of counties met neither metric. These counties had a median CHD death rate of 127.1 deaths per 100,000 in 2017, representing a 10.2% decline. For both outcomes, counties achieving neither metric were not limited to counties with traditionally high stroke and CHD death rates.
Conclusions:
Recent declines in stroke and CHD mortality have not been equal across US counties. Focusing solely on high mortality counties may miss opportunities in the prevention and treatment of cardiovascular disease and in learning more about factors leading to successful reductions in mortality.
Introduction
For over forty years, the Healthy People initiative has included objectives to improve outcomes for coronary heart disease (CHD) and stroke,1 which are prevalent causes of death in the United States (US).2 Healthy People 2020 (HP2020) included objectives to reduce mortality from CHD and stroke by 20% to 103.4 and 34.8 deaths, respectively, per 100,000 population over the goal period.3 Interim results suggested that the national HP2020 mortality target would be met for CHD, but not for stroke.3
Assessing county-level achievement of the national HP2020 CHD and stroke mortality targets, as well as an equivalent proportional decline of ≥20% in county-level stroke and CHD death rates, can help public health professionals identify counties that may benefit from greater resources. When considered alongside a county’s health-related resources and barriers, these trend analyses also support Healthy People’s overarching goals of promoting health equity and eliminating disparities.4, 5 Therefore, this analysis describes the proportion and geographic distribution of counties meeting neither the national HP2020 targets for stroke and CHD mortality nor an equivalent proportional decline over the goal period.
Materials and Methods
We obtained deaths for all ages in 3,136 US counties with underlying causes listed as stroke (International Classification of Diseases [ICD-10] codes I60–I69) or CHD (ICD-10 codes I20–I25) from the National Vital Statistics System and bridged-race population estimates from the National Center for Health Statistics. As specified in the HP2020 methodology, we used age-standardized death rates in 2007 for baseline and 2017 for follow-up.
Bayesian multivariate space-time conditional autoregressive models generated posterior distributions for county-level CHD and stroke death rates (per 100,000), age-standardized to the 2000 U.S. population, in 2007 and 2017.6 We summarized county-level death rates as medians, interquartile ranges (IQR), and median percent change (calculated as the difference in death rates between 2017 and 2007, divided by the 2007 rate). Posterior distributions of death rates were used to calculate the proportion and 95% credible interval (CI) and map the geographic distribution of counties that had: 1) achieved the national HP2020 target, 2) reduced death rates by ≥20% but not achieved the national HP2020 target, 3) reduced death rates by <20% and not achieved the national HP2020 target, or 4) could not be conclusively classified. All analyses were completed in R; user-generated code is available upon request.
Results
For stroke, 45.8% (CI: 42.9, 48.3) of counties achieved neither the national HP2020 target nor reduced death rates by ≥20% during 2007–2017. These counties reduced stroke death rates by a median 12.8% (IQR: −16.6, −7.7) to a final rate of 42.2 deaths per 100,000 population (IQR: 38.6, 47.4) and were concentrated in the Deep South; Appalachia; Midwest; and the Pacific Coast (Figure 1). Approximately 22.7% (CI: 20.7, 25.0) did not achieve the national HP2020 target but reduced stroke death rates by ≥20%. These counties reduced stroke death rates by a median 24.6%-27.4, −22.4) to a final rate of 42.4 deaths per 100,000 population (IQR: 39.2, 47.0). Approximately 26.7% (CI: 25.4, 28.4) of counties achieved the national HP2020 target.
Figure 1.
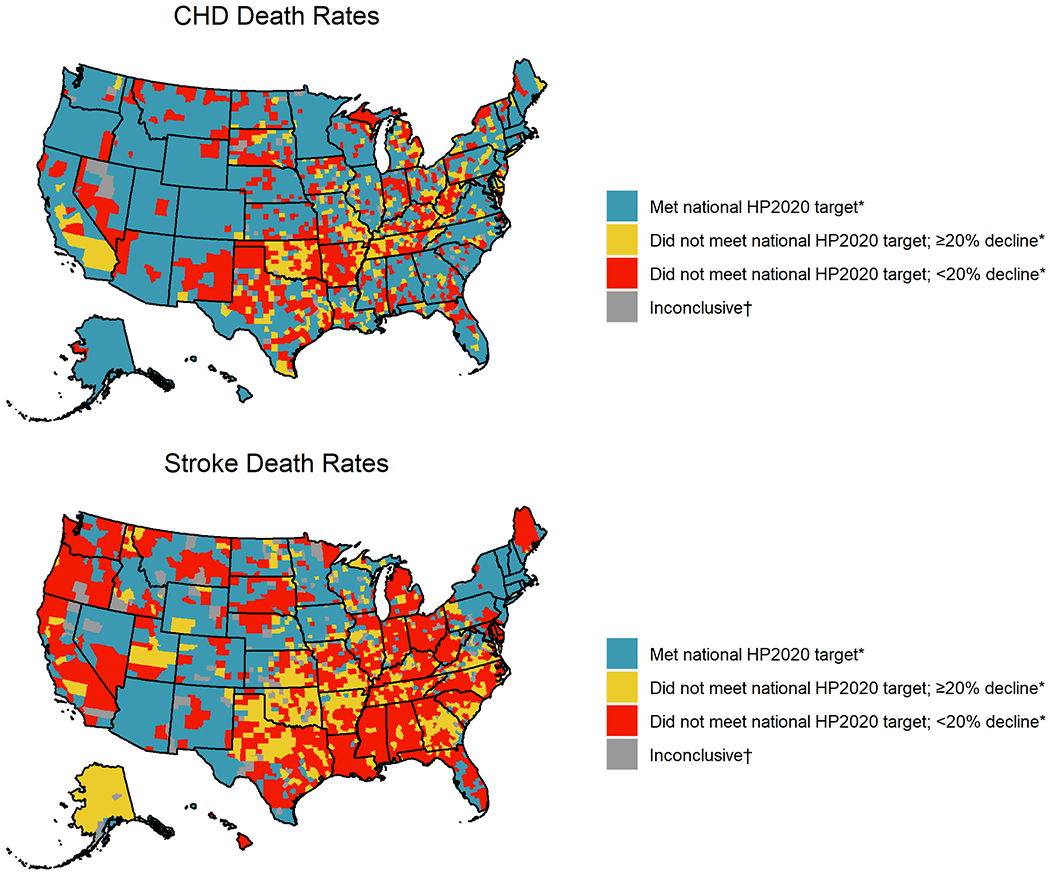
Counties by achievement of national Healthy People 2020 (HP2020) targets* and equivalent proportional reduction in coronary heart disease (CHD) and stroke mortality — United States, 2007–2017
*HP2020 targets: 34.8 stroke deaths and 103.4 CHD deaths per 100,000 population.
†Could not be classified due to uncertainty in Bayesian estimates.
For CHD, 26.1% (CI: 25.0, 27.8) of counties achieved neither the national HP2020 target nor reduced death rates by ≥20% during 2007–2017 (Table 1). These counties reduced CHD death rates by a median 10.2% (IQR: −15.2, −1.7) to a final rate of 127.1 deaths per 100,000 (IQR: 115.1, 149.9), and were concentrated in a band stretching from northern Appalachia through New Mexico (Figure 1). Approximately 16.5% (CI: 15.4, 17.7) did not achieve the national HP2020 target but reduced CHD death rates by ≥20%. These counties reduced CHD death rates by 27.5% (IQR: −32.7, −24.1) to a final rate of 121.6 deaths per 100,000 (IQR: 111.7, 135.8). Approximately 54.8% (CI: 53.7, 55.7) of counties achieved the national HP2020 target.
Table 1.
County-level achievement of national Healthy People 2020 (HP2020) targets* and equivalent proportional reduction in stroke and coronary heart disease (CHD) mortality — United States, 2007–2017
| Counties | Median age-standardized death rate (IQR) | Median percent change (IQR) | |||
|---|---|---|---|---|---|
| n | % (95% CI) | 2007 | 2017 | 2007–2017 | |
| Stroke Mortality | |||||
| Met HP2020 target | 849 | 26.7 (25.4, 28.4) | 38.5 (35.4, 41.7) | 32.0 (29.8, 33.4) | −18.1 (−22.9, −13.2) |
| Did not meet HP2020 target, ≥20% decline | 648 | 22.7 (20.7, 25.0) | 56.7 (52.1, 63.1) | 42.4 (39.2, 47.0) | −24.6 (−27.4, −22.4) |
| Did not meet HP2020 target, <20% decline | 1,496 | 45.8 (42.9, 48.3) | 47.7 (43.8, 53.4) | 42.2 (38.6, 47.4) | −12.8 (−16.6, −7.7) |
| Inconclusive† | 143 | 4.6 | 46.4 (44.9, 47.7) | 35.7 (35.1, 36.6) | −21.2 (−23.0, −20.3) |
| CHD Mortality | |||||
| Met HP2020 target | 1,757 | 54.8 (53.7, 55.7) | 110.7 (96.3, 125.7) | 84.1 (73.1, 93.6) | −26.0 (−32.5, −17.4) |
| Did not meet HP2020 target, ≥20% decline | 500 | 16.5 (15.4, 17.7) | 170.1 (157.3, 194.2) | 121.6 (111.7, 135.8) | −27.5 (−32.7, −24.1) |
| Did not meet HP2020 target, <20% decline | 799 | 26.1 (25.0, 27.8) | 141.2 (127.5, 162.2) | 127.1 (115.1, 149.9) | −10.2 (−15.2, −1.7) |
| Inconclusive† | 80 | 2.6 | 138.6 (135, 143.8) | 105.6 (104.1, 110.5) | −21.9 (−24.2, −20.3) |
Abbreviations: CI=Credible interval, IQR=interquartile range
National HP2020 targets: 34.8 stroke deaths and 103.4 CHD deaths per 100,000 population.
Could not be classified due to uncertainty in Bayesian estimates.
Discussion
About one-half and one-quarter of US counties, respectively, neither met the national HP2020 target nor reduced death rates by ≥20% for stroke and CHD mortality. The greater improvements in county-level CHD mortality as compared to stroke may be partly explained by suboptimal recognition of stroke signs and symptoms,7 geographic disparities in recombinant tissue plasminogen activator utilization,8 or other factors. By examining both death rates and trends, these results can inform geographically-focused programs, interventions, and policies at the county level, which is especially critical given recently stalled declines in stroke and CHD mortality.9, 10
These findings support continued focus on cardiovascular disease prevention and treatment in the southern U.S. as well as expanding focus to other geographic areas of the country experiencing adverse mortality-related trends. Some counties outside of the traditionally high-burden areas in the southern U.S. (e.g., the Stroke Belt for stroke mortality; West Virginia through Oklahoma for CHD mortality4, 5) neither met the national HP2020 target nor reduced death rates by ≥20%. These counties were concentrated in Appalachia, the Midwest, and West Coast for stroke, and in the Midwest and Northern Plains for CHD. Additionally, some counties within traditionally high-burden areas reduced mortality by ≥20% (e.g., South Georgia and South Carolina for stroke; Tennessee and Oklahoma for CHD). These counties experienced large declines in mortality amid stagnating national trends,9, 10 representing opportunities to understand programs, policies, and interventions addressing risk factors, treatments, and social determinants of health contributing to these counties’ successes.
A key strength of this analysis is the Bayesian spatiotemporal model, which estimated precise, reliable death rates in counties with small death or population counts.11 A limitation is that detecting the targeted reduction in death rates in counties with small death count and population sizes may be more difficult due to less precision in the estimated rates. The potential for misclassification of underlying cause of death reported on death certificate data was minimized by using broad ICD-10 categories for CHD and stroke.12 Finally, this analysis considered only mortality from CHD and stroke, not level of functional impairment following these events.
Summary:
Local progress toward HP2020 stroke and CHD mortality objectives has been uneven. Focusing solely on high mortality counties may miss opportunities in preventing and treating cardiovascular disease.
Acknowledgments:
The findings and conclusions in this report are those of the authors and do not necessarily represent the official position of CDC.
Sources of Funding:
None.
Non-Standard Abbreviations and Acronyms:
- CHD
Coronary Heart Disease
- CI
Credible Interval
- HP
Healthy People
- ICD-10
International Classification of Diseases, Tenth Revision
- IQR
Interquartile Range
- US
United States
Footnotes
Disclosures:
None.
References
- 1.Koh HK. A 2020 Vision for Healthy People. N Engl J Med. 2010;362:1653. [DOI] [PubMed] [Google Scholar]
- 2.Virani SS, Alonso A, Benjamin EJ, Bittencourt MS, Callaway CW, Carson AP, Chamberlain AM, Chang AR, Cheng S and Delling FN. Heart Disease and Stroke Statistics—2020 Update: a Report from the American Heart Association. Circulation. 2020:E139–E596. [DOI] [PubMed] [Google Scholar]
- 3.Pahigiannis K, Thompson-Paul AM, Barfield W, Ochiai E, Loustalot F, Shero S and Hong Y. Progress Toward Improved Cardiovascular Health in the United States: Healthy People 2020 Heart Disease and Stroke Objectives. Circulation. 2019;139:1957–1973. [DOI] [PMC free article] [PubMed] [Google Scholar]
- 4.Vaughan AS, Schieb L and Casper M. Historic and Recent Trends in County-Level Coronary Heart Disease Death Rates by Race, Gender, and Age Group, United States, 1979-2017. PLoS One. 2020;15:e0235839. [DOI] [PMC free article] [PubMed] [Google Scholar]
- 5.Hall EW, Vaughan AS, Ritchey MD, Schieb L and Casper M. Stagnating National Declines in Stroke Mortality Mask Widespread County-Level Increases, 2010–2016. Stroke. 2019;50:3355–3359. [DOI] [PMC free article] [PubMed] [Google Scholar]
- 6.Quick H, Waller LA and Casper M. A Multivariate Space—Time Model for Analysing County Level Heart Disease Death Rates by Race and Sex. J R Stat Soc. 2018;67:291–304. [Google Scholar]
- 7.Patel A, Fang J, Gillespie C, Odom E, King SC, Luncheon C and Ayala C. Awareness of Stroke Signs and Symptoms and Calling 9-1-1 Among US Adults: National Health Interview Survey, 2009 and 2014. Prev Chronic Dis. 2019;16:E78. [DOI] [PMC free article] [PubMed] [Google Scholar]
- 8.Kleindorfer D, Xu Y, Moomaw CJ, Khatri P, Adeoye O and Hornung R. US geographic distribution of rt-PA utilization by hospital for acute ischemic stroke. Stroke. 2009;40:3580–3584. [DOI] [PubMed] [Google Scholar]
- 9.Yang Q, Tong X, Schieb L, Vaughan A, Gillespie C, Wiltz JL, King SC, Odom E, Merritt R and Hong Y. Vital Signs: Recent Trends in Stroke Death Rates—United States, 2000–2015. MMWR. 2017;66:933. [DOI] [PMC free article] [PubMed] [Google Scholar]
- 10.Shah NS, Molsberry R, Rana JS, Sidney S, Capewell S, O’Flaherty M, Carnethon M, Lloyd-Jones DM and Khan SS. Heterogeneous trends in burden of heart disease mortality by subtypes in the United States, 1999-2018: observational analysis of vital statistics. BMJ. 2020;370:m2688. [DOI] [PMC free article] [PubMed] [Google Scholar]
- 11.Vaughan AS, Kramer MR, Waller LA, Schieb LJ, Greer S and Casper M. Comparing Methods of Measuring Geographic Patterns in Temporal Trends: An Application to County-Level Heart Disease Mortality in the United States, 1973 to 2010. Ann Epidemiol. 2015;25:329–335. [DOI] [PMC free article] [PubMed] [Google Scholar]
- 12.Ives DG, Samuel P, Psaty BM and Kuller LH. Agreement between Nosologist and Cardiovascular Health Study Review of Deaths: Implications of Coding Differences. J Am Geriatr Soc. 2009;57:133–139. [DOI] [PMC free article] [PubMed] [Google Scholar]