Abstract
Personal neoantigen vaccines have been envisioned as an effective approach to induce, amplify, and diversify antitumor T cell responses. To define the long-term effects of such a vaccine, we evaluated the clinical outcome and circulating immune responses of 8 patients with surgically resected stage IIIB/C or IVM1a/b melanoma, at a median of almost 4 years after treatment with NeoVax, a long peptide vaccine targeting up to 20 personal neoantigens per patient. (NCT01970358). All patients were alive, 6 without evidence of active disease. We observed long-term persistence of neoantigen-specific T cell responses following vaccination, with ex vivo detection of neoantigen-specific T cells exhibiting a memory phenotype. We also found diversification of neoantigen-specific T cell clones over time, with emergence of multiple T cell receptor clonotypes exhibiting distinct functional avidities. Furthermore, we detected evidence of tumor infiltration by neoantigen-specific T cell clones after vaccination and epitope spreading, suggesting on-target vaccine-induced tumor cell killing. Personal neoantigen peptide vaccines thus induce T cell responses that persist over years and broaden the spectrum of tumor-specific cytotoxicity in patients with melanoma.
Keywords: Neoantigen, melanoma, vaccine, memory T cells, epitope spreading, immune checkpoint, personalized, pICLC, epitope, HLA
Introduction
Cytotoxic and helper T cells play critical roles in controlling tumors long term, making cancer vaccines an attractive therapeutic approach because of their potential to expand and broaden the repertoire of tumor antigen-specific T cell responses. Progress in the field, however, has been impeded by the absence of suitable vaccine targets and delivery platforms to achieve adequate tumor-specific T cell expansion and tumor specificity, as well as the lack of adjunct therapies to protect tumor-specific T cells from immunosuppressive mechanisms.
Recently, breakthroughs in the ability to identify personal neoantigens in real-time through systematic analysis of cancer sequencing data in the setting of anti-tumor activity of immune checkpoint blocking antibodies have brought increased attention to neoantigen cancer vaccines. Personalized cancer vaccines targeting neoantigens have shown early promise. We previously demonstrated that NeoVax, a personal neoantigen long peptide vaccine formulated with the TLR-3 and MDA5 agonist poly-ICLC is feasible, safe, and immunogenic in patients with high-risk melanoma1, and in a separate study, in patients with glioblastoma1,2. Robust neoantigen-specific T cell responses were also detected in three melanoma patients treated with a vaccine consisting of autologous dendritic cells loaded ex vivo with personal neoantigen-specific MHC class I peptides3, and in all 13 melanoma patients treated with a personal neoantigen-targeting mRNA-based vaccine4. Collectively, results from these early phase clinical trials testing personal neoantigen-directed vaccines are encouraging. However, to date the follow up of immune responses generally has not extended beyond one year. Furthermore, recent studies in mice have demonstrated that proper T cell priming is critical for the clinical efficacy of PD-1 blockade and that PD-1 blockade can induce exhaustion of tumor-directed T cell responses, emphasizing the importance of functional T cell state of tumor-specific T cells in the context of immune checkpoint inhibition5. Here, we report the long-term clinical courses of 8 high-risk melanoma patients treated with NeoVax, examine and track single cell phenotypes and clonotypes of neoantigen-specific T cells during the vaccination phase and following subsequent anti-PD-1 therapy, and demonstrate the broadening and persistent durability of vaccine-induced neoantigen-specific T cell responses.
Results
Long-term clinical outcomes of neoantigen-vaccine treated melanoma patients
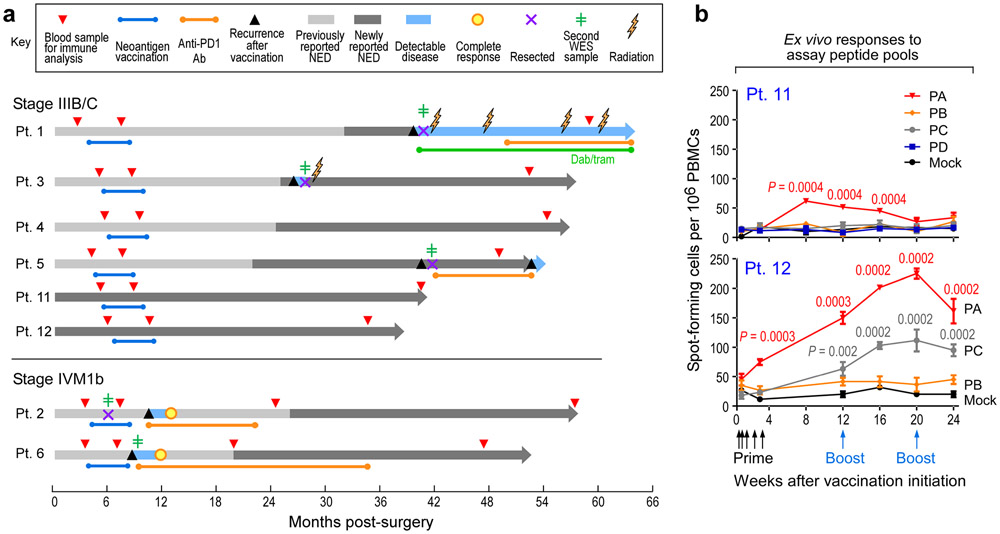
Eight patients with stage IIIB/C or stage IVM1b high-risk melanoma received vaccines on the study (NCT01970358), 6 of whom (patients 1-6) were previously reported1(Supplementary Table 1. At a median follow-up of 55 months after surgery with curative intent upon study entry, all patients were alive. Five of these 8 patients experienced melanoma recurrence; of these 5, 2 patients with stage IV disease had a complete response after treatment with pembrolizumab as previously reported, one patient had a surgical resection and has remained NED, while 2 patients developed unresectable metastatic disease. (Fig. 1a). In our extended analysis, no further vaccine-related toxicities were detected beyond the transient, mild flu-like symptoms, injection site reactions, rash, and fatigue previously reported (Supplementary Table 2).
Figure 1. Long-term clinical outcomes of neoantigen-vaccine treated melanoma patients and immune responses in two newly vaccinated patients.
a. Clinical course of 8 patients (Pts) who received personalized neoantigen vaccines starting at the time of melanoma resection until data cut-off (September 25th, 2019) (range 38-64 months from initial surgery). Patient 3 had a local soft tissue recurrence at 26 months after initial melanoma resection, Pt. 5 experienced recurrence of an isolated lung metastasis at 40 months, which was resected followed by adjuvant therapy with nivolumab; at 53 months, several new lung metastases were detected. Pt. 1 developed multiple brain metastases at 40 months and underwent surgical resection of the dominant lesion. This was followed by multiple lines of therapy ultimately resulting in clinical stability at 64 months.
Green line dabrafenib and trametinib (dab/tram) targeted therapy; NED, no evidence of disease. b. PBMCs from Pts. 11 and 12 were tested ex vivo by IFN-γ ELISpot against assay peptide (ASP) pools PA-PD in triplicate wells at each time point (error bars, standard error of the mean [s.e.m].; see IFN-γ ELISpot assay in Methods for statistical analysis). 2x10⁵ PBMCs were plated with 5 μg/ml peptide and incubated overnight and normalized results are presented as previously1 as sfu/1 x 106 cells.
Genomic and phenotypic analyses of recurrent tumors
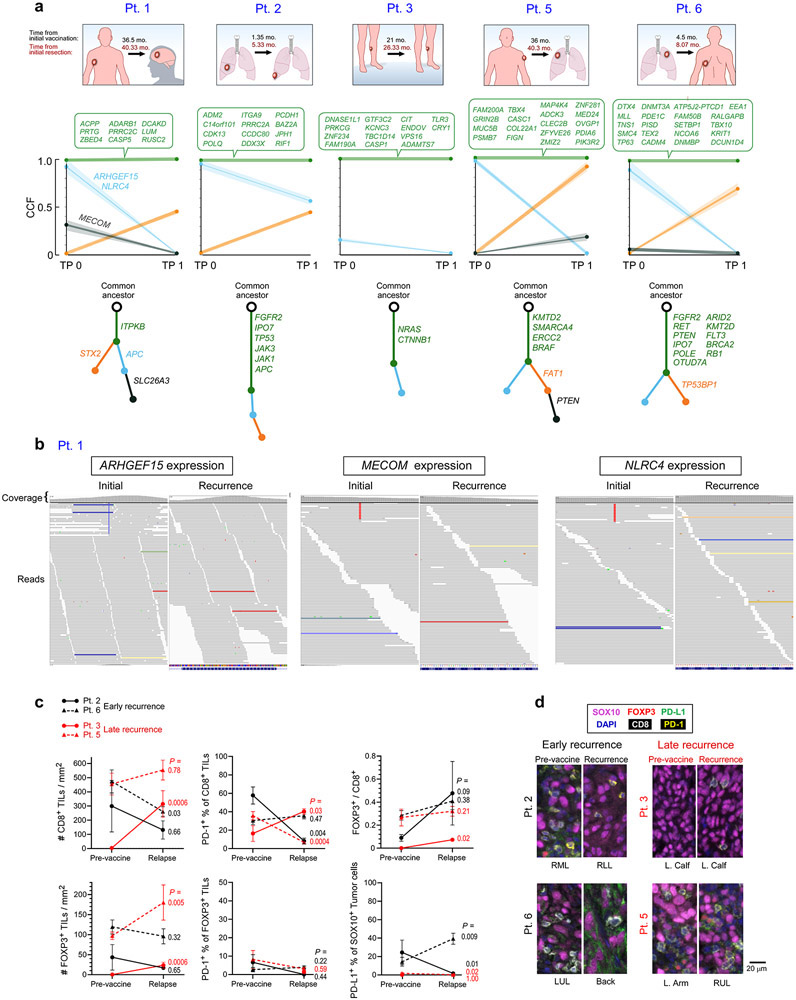
To assess for evidence of immune editing signatures and to interrogate for defects in antigen processing or presentation, we characterized the mutational profiles of available pre- and post-vaccine tumor samples by whole-exome sequencing (WES) and RNA-sequencing. Across 5 patients with available paired pre- and post-vaccine tumor specimens, 74 of 77 (96%) mutations encoding neoantigens targeted by the vaccine persisted, while 3 targeted somatic mutations were lost in the post-vaccination recurrent tumor of Pt. 1, indicating minimal if any immune-editing of vaccine targets (Extended Data Fig. 1a, b). Vaccination against one of the three mutations (NLRC4) had previously elicited an IFN-γ response after in vitro stimulation at week 161. We detected 4 non-synonymous mutations in antigen presentation machinery genes across the patients that were each predicted to have functional impact (CTSD, PSMB7, HLA-A; Supplementary Table 3); these mutations were present both before and after vaccination. By multiplexed immunofluorescence of available paired baseline and recurrence samples, we observed individual patients to display longitudinal changes in the densities of CD8+ cytotoxic TILs and CD8−/FOXP3+ regulatory TILs, as well as in the expression of the PD-1 checkpoint on TILs and its ligand PD-L1 on SOX10+ melanoma cells (Extended Data Fig. 1c, d). However no clear trends could be discerned in this small data set.
Immunological responses in newly reported patients
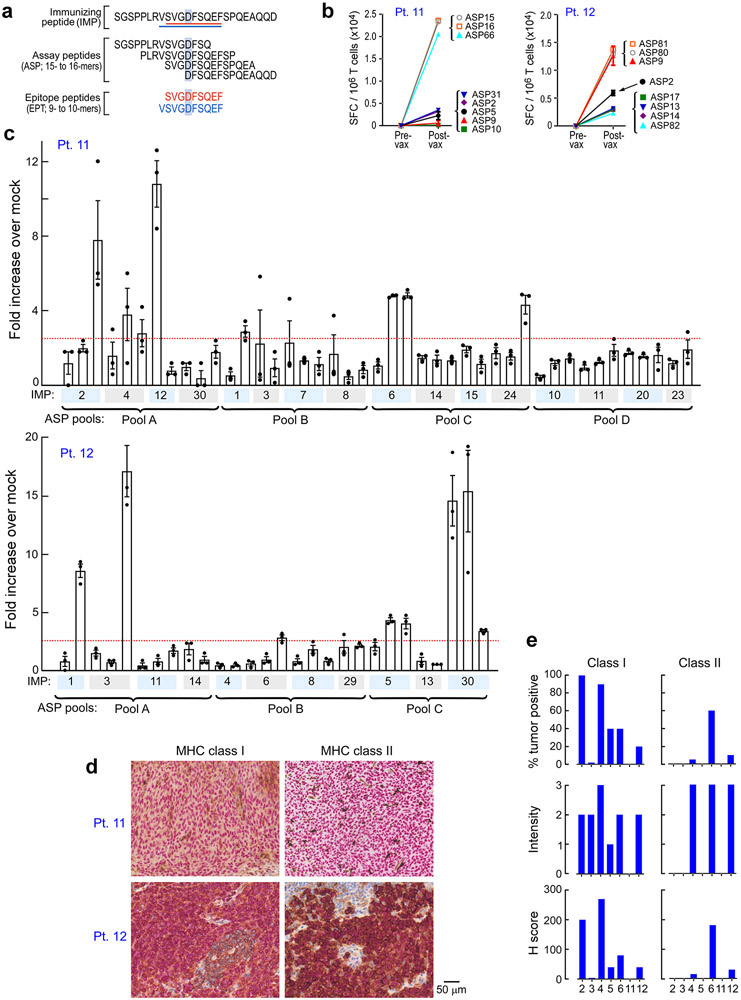
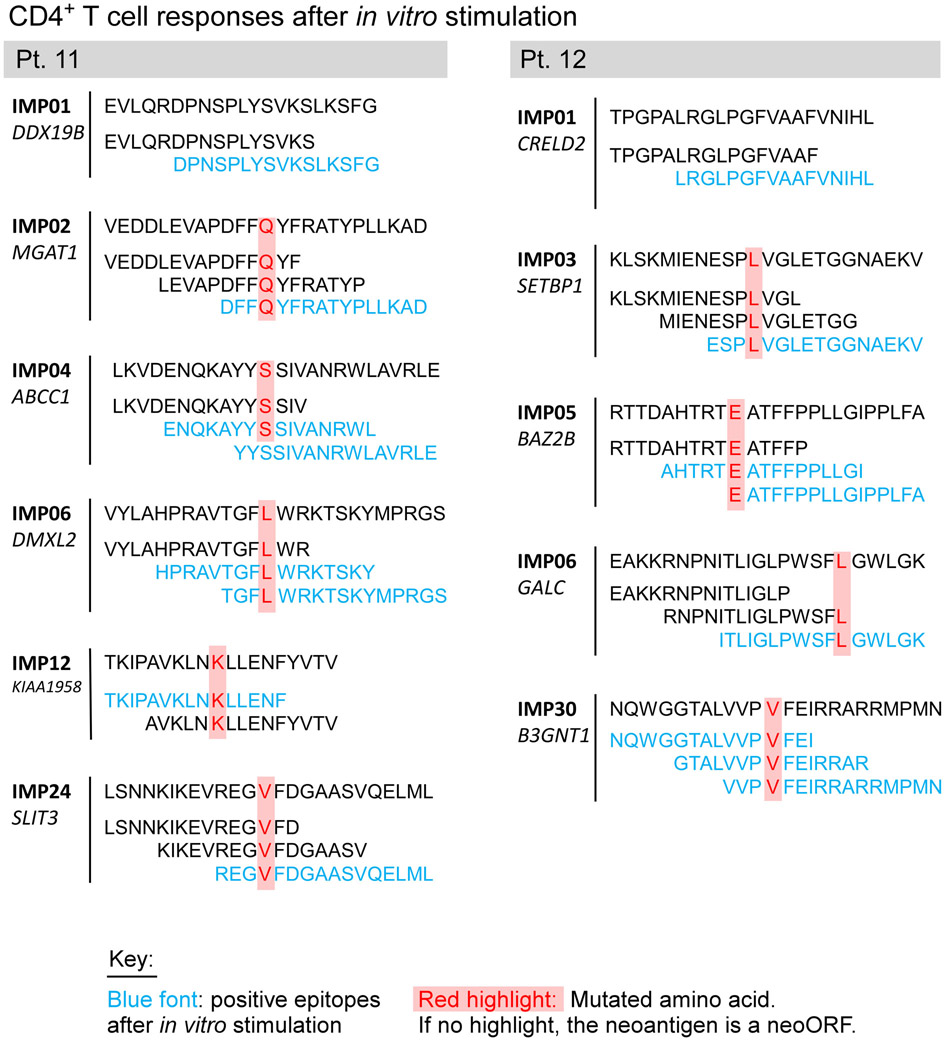
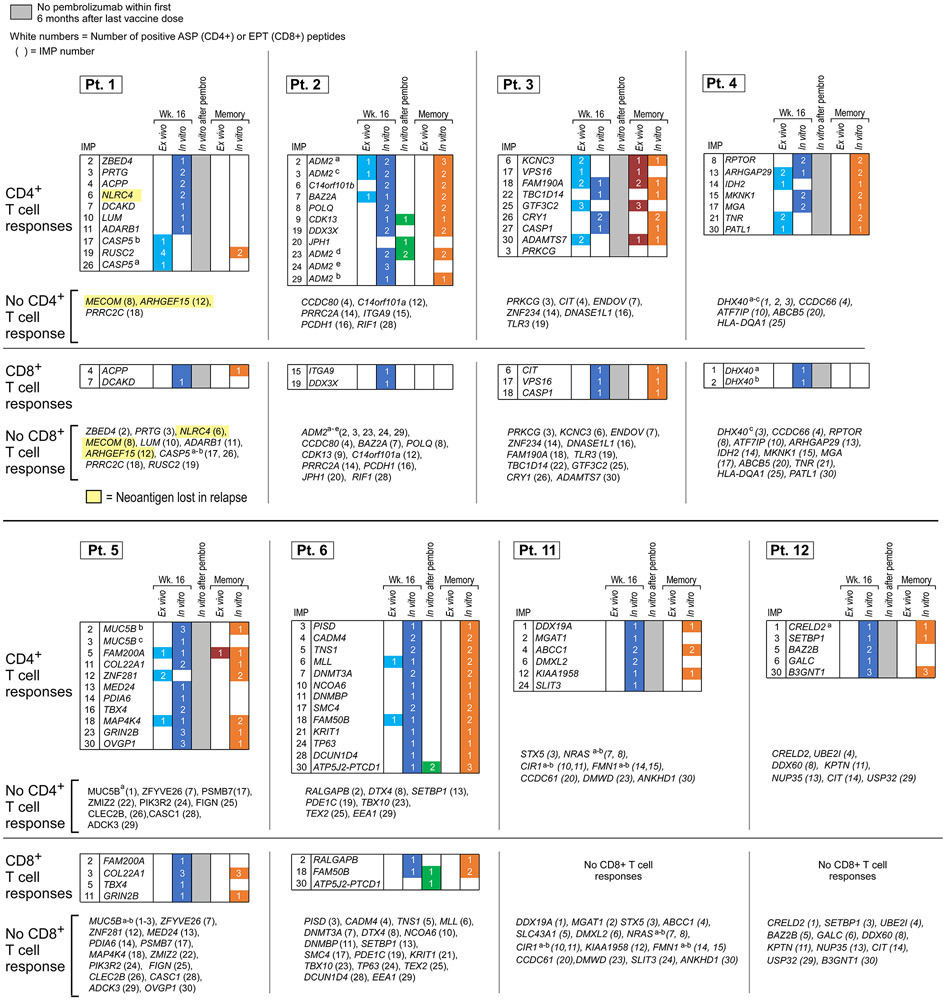
Following vaccination of the newly reported Pts. 11 and 12 (Methods, Supplementary Dataset 1-4, Extended Data Fig. 2a), robust neoantigen-specific ex vivo CD4+ T cell responses were detected by IFN-γ ELISpot against assay peptide (ASP) pool A for Pt. 11, and ASP pools A and C for Pt. 12 (Methods; Fig. 1b). Deconvolution of all peptide pools after one round of in vitro stimulation revealed CD4+ T cell reactivity against 11 of 27 (41%) immunizing peptides (IMP), but no CD8+ T cell responses across these two patients (Extended Data Fig. 2b-c, Extended Data Fig. 3, Extended Data Fig. 7). Consistent with our previous observations, ex vivo responses to pooled peptides for Pts. 11 and 12 were only detectable for CD4+ T cells. Altogether, across the 8 patients, we detected in vitro stimulated CD8+ T cell responses against 15 of the 117 IMP (13%) and ex vivo or in vitro CD4+ T cell responses against 69 of the 124 IMP (56%) that were tested.
Vaccine-induced neoantigen-specific CD4+ T cells exhibit memory and cytotoxic signatures
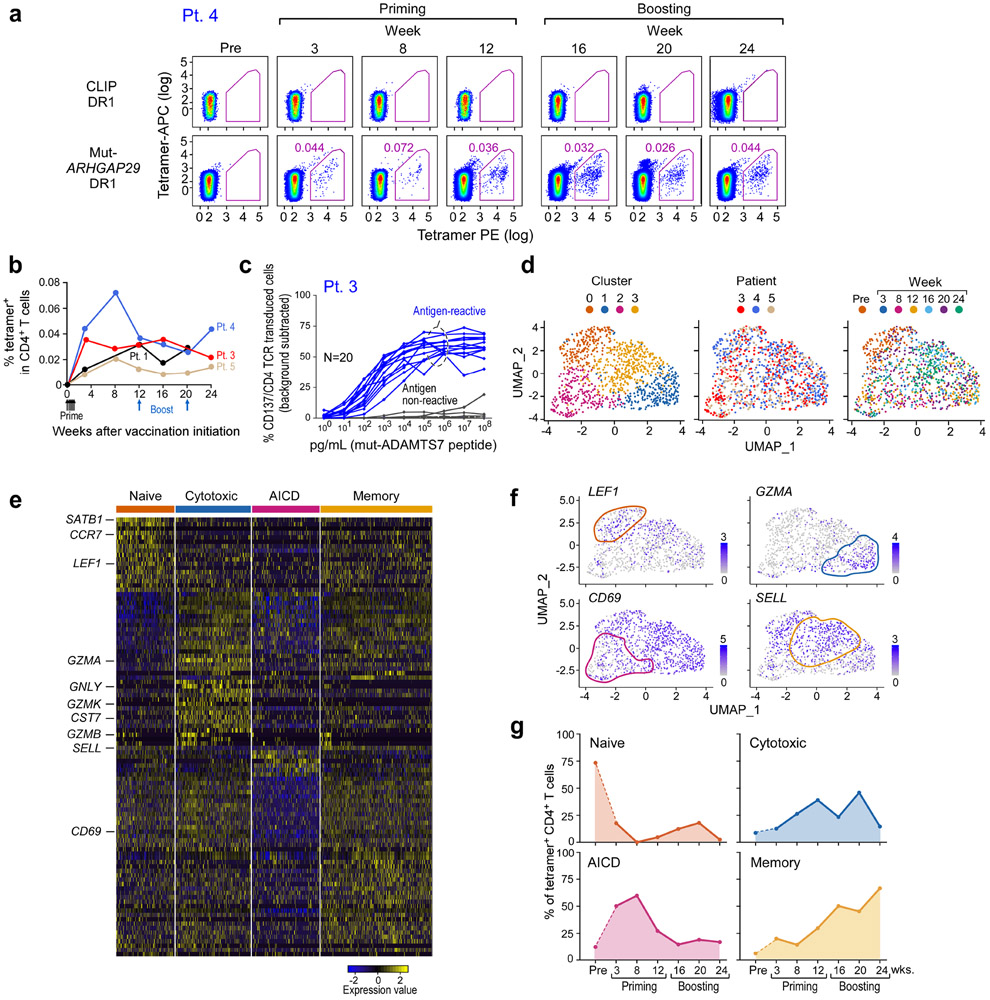
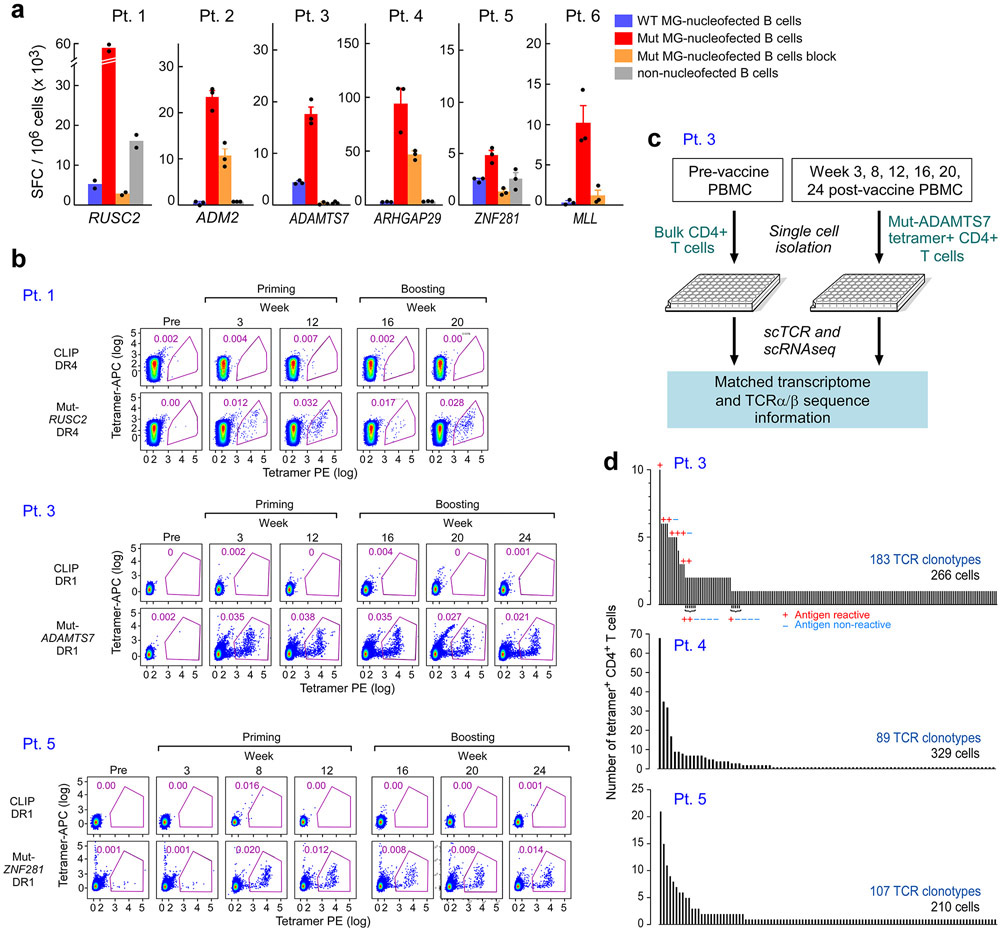
To gain insight into the mechanisms underlying the long-term clinical courses of this patient cohort, we first sought to determine how the functional states of circulating vaccine-induced neoantigen-specific T cells evolved across the course of vaccination. We therefore evaluated the transcriptomic signatures of individual neoantigen-reactive T cells identifiable by tetramer staining of PBMCs over time. We focused on the isolation and characterization of neoantigen-reactive CD4+ T cells, since our previous study had revealed robust ex vivo detection by week 16 after vaccination1. (Methods, Extended Data Fig. 4a, Supplementary Table 4). For 4 patients with strong ex vivo responses and serial time points available, we generated one HLA-DR restricted class II tetramer each and demonstrated that tetramer-specific CD4+ T cells could be detected ex vivo in peripheral blood mononuclear cell (PBMC) samples collected at serial time points starting at 3 weeks following vaccination, with persistence over the course of treatment (Fig. 2a-b, Extended Data Fig. 4b).
Figure 2. Transcriptional profile of neoantigen-specific T cells over the course of vaccination.
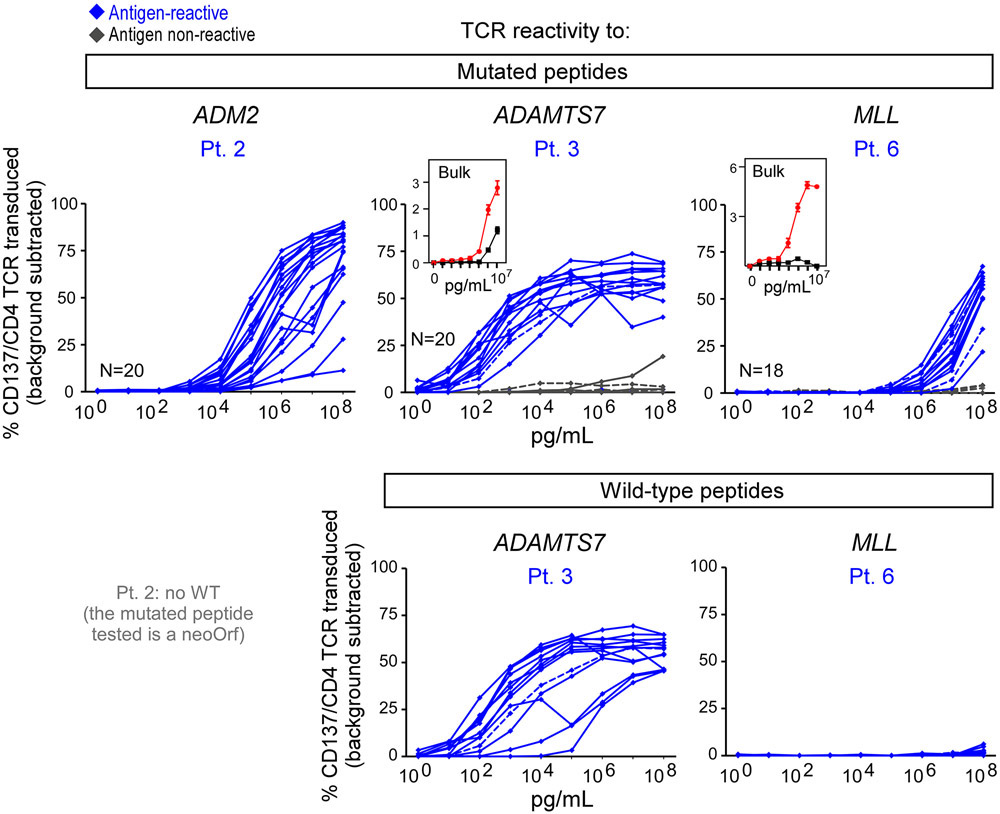
a. Representative plots of ex vivo MHC class II tetramer staining of Pt. 4 (mut-ARHGAP29) CD4+ T cells at a series of time points pre- and following vaccination. Flow plots were pre-gated on CD4+ T cells. b. Kinetics of ex vivo tetramer-specific CD4+ T cell frequencies (mut-RUSC2, -ADAMT27, -ARHGAP29, and -ZNF281 tetramers for Pts. 1, 3, 4, and 5, respectively) following vaccination. c. Dose-response curves of CD137 (4-1BB) upregulation following neoantigen stimulation of selected TCR clonotypes from Patient 3, engineered into allogeneic T cells. These TCRs represented clonotypes that were observed in more than one cell (either as replicates at a single timepoint or at more than one timepoint) or as singletons (observed as a single replicate at a single timepoint). d. Clustering of tetramer-specific CD4+ T cells for Pts. 3, 4 and 5, depicted by cluster, patient and time point, respectively. Across these 3 patients, neoantigen-specific CD4+ T cells from 5 or 6 post-vaccination time points were collected, with a median of 310 total cells collected per patient (range 297-378). Ninety one and 73 non-tetramer-specific CD4+ T cells from Pts. 4 and 5, respectively, were collected prior to vaccination for comparison. e. Heatmap of top and bottom 20 differentially expressed genes by cluster. Selected marker genes are labeled. Normalized expression values are based on TPM counts. f. Feature plots of selected cluster marker genes. Clusters of interest are indicated by colored lines. g. Proportions of tetramer-positive CD4+ cells in each cluster by time. See Supplementary Dataset 5 for differentially expressed genes.
For 3 of the 4 patients, we directly isolated individual neoantigen-specific CD4+ T cells over time (median of 310 cells per patient) ex vivo from PBMCs, allowing us to characterize their transcriptional states at single-cell resolution (Extended Data Fig. 4c, Methods). For comparison, 164 non-tetramer specific cells were collected from two patients prior to vaccination. To confirm the antigen specificity of the observed single cell clonotypes from the tetramer-sorted cells, we selected a representative 20 paired alpha/beta TCR clonotypes from Pt. 3; these were cloned and inserted into primary allogeneic human T lymphocytes (Extended Data Fig. 4d, Methods). Following stimulation by peptide loaded autologous antigen-presenting cells, 13 of 16 (81%) clonotypes that were observed in more than one cell and 1 of 4 (25%) singletons were positive by 4-1BB upregulation, indicating that a large fraction of the tetramer-sorted clones were antigen-reactive (Fig. 2c; Extended Data Fig. 4d, Extended Data Fig. 6).
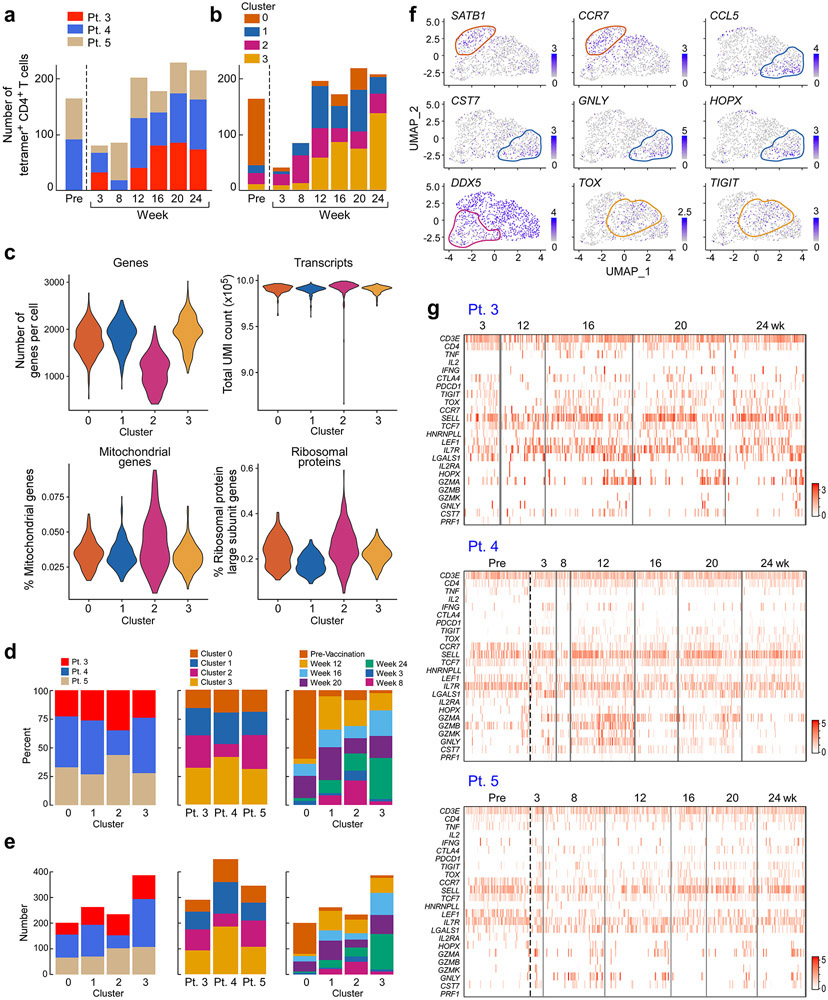
By pooling all cells and performing joint-clustering and integration using Seurat v36, we observed 4 transcriptionally-defined clusters, each composed of cells from all 3 patients (Fig. 2d, Extended Data Fig. 5b-f, Supplementary Dataset 5, Methods). Evaluation of the significant genes per cluster (adjusted p-value by Bonferroni correction < 0.05) revealed each to represent distinct T cell states identified by specific gene signatures (Fig. 2d-e). Cluster 0 (‘naïve-like’) was characterized by LEF1, CCR7, and SATB1 upregulation7,8. Cluster 1 (‘cytotoxic-like’) exhibited markers of cytotoxicity (i.e. GZMA, GNLY, and CST7), and was also characterized by expression of genes associated with exhaustion and a non-naïve effector state (i.e. presence of HOPX, CCL4, CCL5, downregulation of CCR7 and SELL). Gene-set enrichment analysis of this cluster revealed significant upregulation of gene sets involved in IL-2 production and the response to IL-12, supporting the identification of this cluster as an early effector state (Supplementary Dataset 6, Methods). Cluster 2 (‘AICD-like’) demonstrated a transcriptional profile consistent with activation-induced cell death (AICD) and the contraction phase of an immune response. This cluster was characterized by a pan-downregulation of numerous genes, including markers of naïve T cells (LEF1 and SELL), T cell activation (CD69) and cytotoxicity (GZMB). Differentially downregulated gene sets in this cluster included those implicated in the IL-12 and IL-4 response (Supplementary Dataset 6). Cluster 3 (‘memory-like’) was characterized by differential upregulation of central memory markers (SELL) and downregulation of effector memory markers (HOPX).
To determine if specific phases of vaccination were associated with distinct transcriptional states, we evaluated the composition of each time point with respect to the transcriptionally-identified clusters (Fig. 2d, f, Extended Data Fig. 5b, d-f). Indeed, whereas the majority of non-tetramer sorted CD4+ T cells isolated before vaccination had a “naïve-like” T cell phenotype (cluster 0), tetramer-positive T cells isolated after priming and at early time points after boosting (weeks 8 – 20) mostly resided in Clusters 1 and 2, indicating a transition towards the states of cytotoxicity and AICD with continued vaccination (Fig. 2g). While relatively few cells collected prior to or early during vaccination exhibited an exhaustion phenotype, various exhaustion genes including TOX and TIGIT were upregulated following vaccination (Extended Data Fig. 5g). Finally, most of the tetramer-positive T cells from four weeks after the last vaccine boost had a “memory-like” phenotype (Cluster 3). Thus, our studies reveal an apparent transition in differentiation state from naïve, to effector and apoptosis, and finally, to memory, in association with neoantigen-specific vaccination.
Neoantigen-specific TCR clonotypes diversify following vaccination and following anti-PD1 therapy
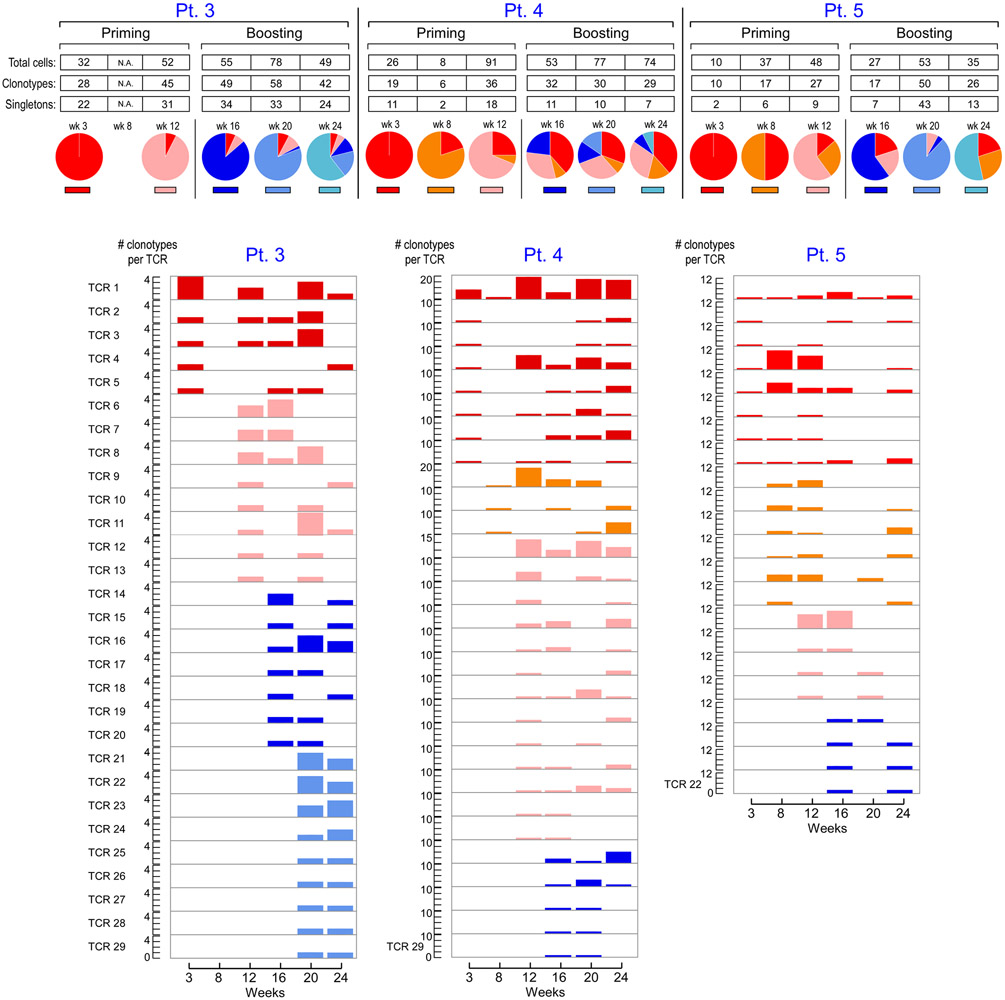
To determine how the clonal composition of neoantigen-specific T cells evolved across the course of vaccination, we also assessed the TCR repertoires of individual circulating tetramer-specific CD4+ T cells from Pts. 3, 4 and 5. (Supplementary Dataset 7, Methods). Strikingly, across all 3 patients, we observed rapid emergence of new tetramer-specific clonotypes present in multiple T cells per time point during both the priming (weeks 3, 8 and 12) and boosting (weeks 16, 20 and 24) phases of vaccination (Fig. 3) and noted recurrence of 80 total unique neoantigen-specific T cell clones across multiple time points (Supplementary Dataset 7). This dynamic diversification of paired alpha and beta clonotypes could also be observed by detection of individual alpha or beta clonotypes in the bulk TCR sequencing data from several time points throughout vaccination (Supplementary Dataset 8).
Figure 3. TCR repertoire kinetics of neoantigen-specific T cells in relation to vaccination.
Paired TCRα and β clonotypes of mut-ADAMT27 CD4+ T cells, mut-ARHGAP29-specific CD4+ T cells and mut-ZNF281-specific CD4+ T cells for Pts. 3, 4 and 5, respectively, collected at different time points post-vaccination. Additional colors from left to right indicate the first appearance of new TCR clonotypes (defined as having a unique TRAV, TRAJ, TRBV, TRBJ, CDR3α and CDR3β amino acid sequence) at individual time points. Across 5 to 6 time points, 183, 89 and 107 distinct clonotypes were identified from 266, 329 and 210 single cells for each patient, respectively, none of which were shared with 133 clonotypes observed in non-tetramer-sorted cells prior to vaccination from Pts. 4 and 5. Pie charts indicate the proportions of TCR clonotypes originating at the individual time point and each previous time point. Numbers of T cells and TCR clonotypes per time point are shown for clonotypes appearing at more than one time point. Paired TCRα and β clonotypes from non-tetramer selected cells from Pts. 4 and 5 prior to vaccination are not shown. See Supplementary Dataset 7 for TCR clonotypes.
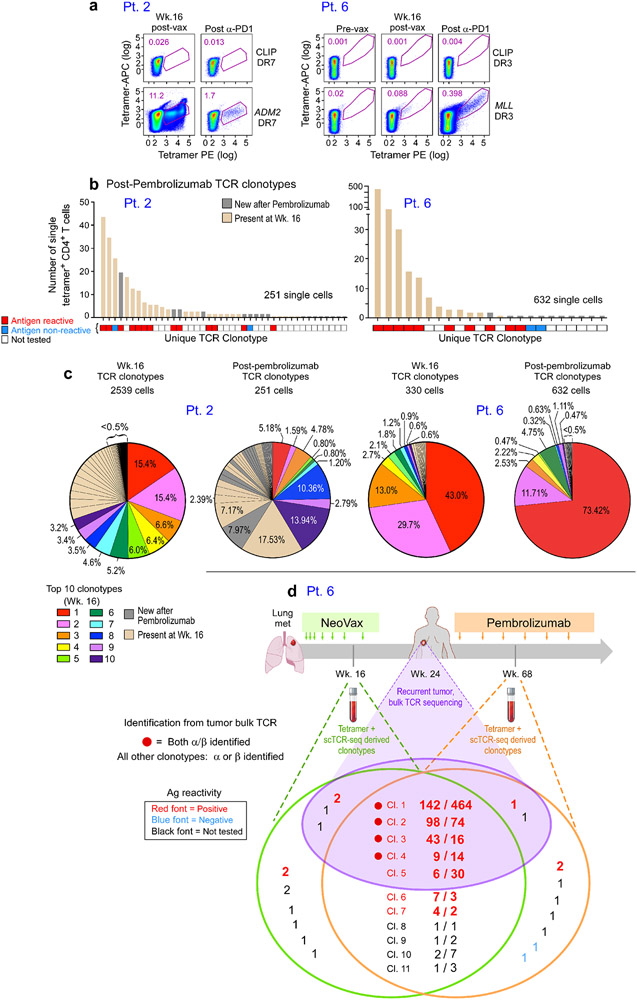
For Pts. 2 and 6, we also had the opportunity to evaluate the repertoire diversity of neoantigen-specific T cells following exposure to vaccine and following subsequent treatment with pembrolizumab. For both patients, tetramer-positive CD4+ T cell populations specific for the target neoantigen could be detected following one round of in vitro stimulation at week 16 after vaccination and after treatment with pembrolizumab (Fig. 4a, Methods). Tetramer-specific TCR clonotype analysis for Pt. 2 revealed that 25 of 99 (25%) mut-ADM2-specific TCR clonotypes detected at week 16 were still present at week 89, approximately one year after initiation of pembrolizumab therapy; of note, 13 of 15 (87%) of these clonotypes that were tested were confirmed as antigen-reactive (Fig. 4b, Extended Data Fig. 6; Supplementary Dataset 9). Five of the top 10 most dominant clonotypes present at week 16 were still among the top 10 most dominant clonotypes observed one year after initiation of pembrolizumab and 9 of the 10 most dominant clones seen one year after initiation of pembrolizumab were present at week 16 (Fig. 4c). Seventeen tetramer-specific TCR clones were uniquely detected post-pembrolizumab. Similarly, 12 (55%) of the 22 unique clonotypes detected in the peripheral blood of Pt. 6 at week 16 were present 55 weeks later, one year after initiation of pembrolizumab therapy (9 of 10 [90%] persisting clonotypes that were tested were confirmed to be antigen reactive [Extended Data Fig. 6]). Nine of the top 10 most dominant clonotypes at week 16 were still among the top 10 most dominant clonotypes observed one year after pembrolizumab initiation, and all of the 10 most dominant clones seen one year after the initial dose of pembrolizumab were present at week 16 (Fig. 4c). Eleven tetramer-specific TCR clones were uniquely detected post-pembrolizumab. Altogether, these population dynamics indicate both maintenance of a substantial fraction of TCR clonotypes and a shift in the TCR repertoire by emergence of new clonotypes following anti-PD-1 therapy.
Figure 4. Neoantigen-specific TCR dynamics following vaccination and PD-1 inhibition.
a. Plots of MHC class II tetramer staining of Pt. 2 and 6 CD4+ T cells after in vitro stimulation with mut-ADM2 and mut-MLL peptides, respectively, at week 16 following vaccination and after anti-PD-1 therapy with pembrolizumab (week 89 for Pt. 2, week 72 for Pt. 6). Flow plots were pre-gated on CD4+ T cells. b. Single-cell TCR sequencing of Pt. 2 and 6 tetramer-specific CD4+ T cells reveals enrichment of particular clonotypes. Beige bars indicate TCR clonotypes present at both week 16 and following pembrolizumab; gray bars indicate new TCR clonotypes after pembrolizumab (Pt. 2: 17 clonotypes; Pt. 6: 11 clonotypes). Each TCR clonotype is annotated for antigen reactivity following insertion of the engineered TCRs into primary human T cells. c. Pie charts depict proportions of individual tetramer-specific TCRs at week 16 and post-pembrolizumab. Colored clonotypes mark the top ten TCR clonotypes at week 16 (by frequency). The top 10 clonotype colors are arranged clockwise based on the clonotype abundance observed at week 16. In the post-pembrolizumab pie charts, the colors correspond to the same clonotypes shown in the week 16 pie charts. Beige color indicates non-dominant week 16 TCR clonotypes that were also present following pembrolizumab; gray color indicates new TCR clonotypes after pembrolizumab. d. Overlap of single cell observed TCR clonotypes identified in Patient 6 week 16 and post-pembrolizumab (week 68) peripheral blood samples and alpha and/or beta TCR sequences observed in bulk TCR sequence data from the recurrent tumor sample from Patient 6 at week 24. Only TCR sequences that were identical across TCRV, TCRJ and the CDR3 were considered a match. The subset of the identified clonotypes with confirmed neoantigen reactivity is indicated. See Supplementary Dataset 7 for TCR clonotypes.
Finally, given the broad repertoire of neoantigen-specific T cells that we detected in circulating blood, we asked if this mirrored the change in repertoire of T cells following vaccination present at the site of disease. In particular, for Pts. 3, 5 and 6, who had recurrences at 17 months, 2.5 years and 4 weeks, respectively, after the vaccination period, we evaluated whether clonotypes identical to those found through the tetramer-specific single cell analysis of circulating blood could also be detected in bulk TCR sequencing of recurrent tumors following vaccination. No alpha or beta sequences related to the TCR clonotypes identified in the blood samples for Pt. 3 were detected in the relapse sample, and similarly only one alpha chain sequence was found for Pt. 5. However, in the recurrent tumor of Pt. 6, which became radiographically manifest 4 weeks after completion of the vaccinations, we detected both the alpha and beta chains corresponding to 4 of the single cell-identified clonotypes from peripheral blood (Fig. 4d, Supplementary Dataset 10). Antigen reactivity to the MLL epitope was confirmed for all 4 of these clonotypes by testing of TCR expressed in T cell lines. Of note, these clonotypes were already present in the circulating periphery at week 16 (4 weeks after the first vaccination boost) and were also present 9 months after the start of pembrolizumab. Indeed, two of these 4 clonotypes represented the most abundant clonotypes at week 16. Additionally, we detected the alpha or beta chain only for 6 additional clonotypes, 3 of which were tested and also confirmed to be antigen-reactive. These data support the notion that neoantigen-specific T cells indeed were already in situ at the time of initiation of pembrolizumab, presumably mobilized by neoantigen vaccination.
Personal neoantigen vaccines generate memory T cell responses and TCR clonotypes that persist for years
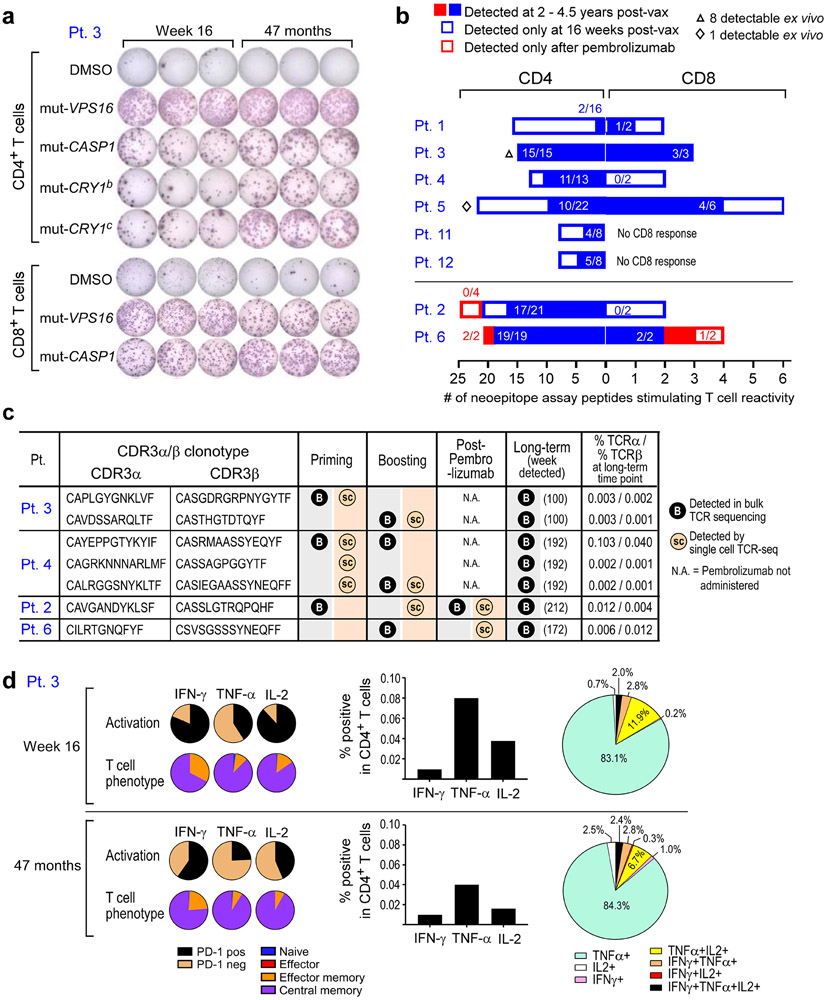
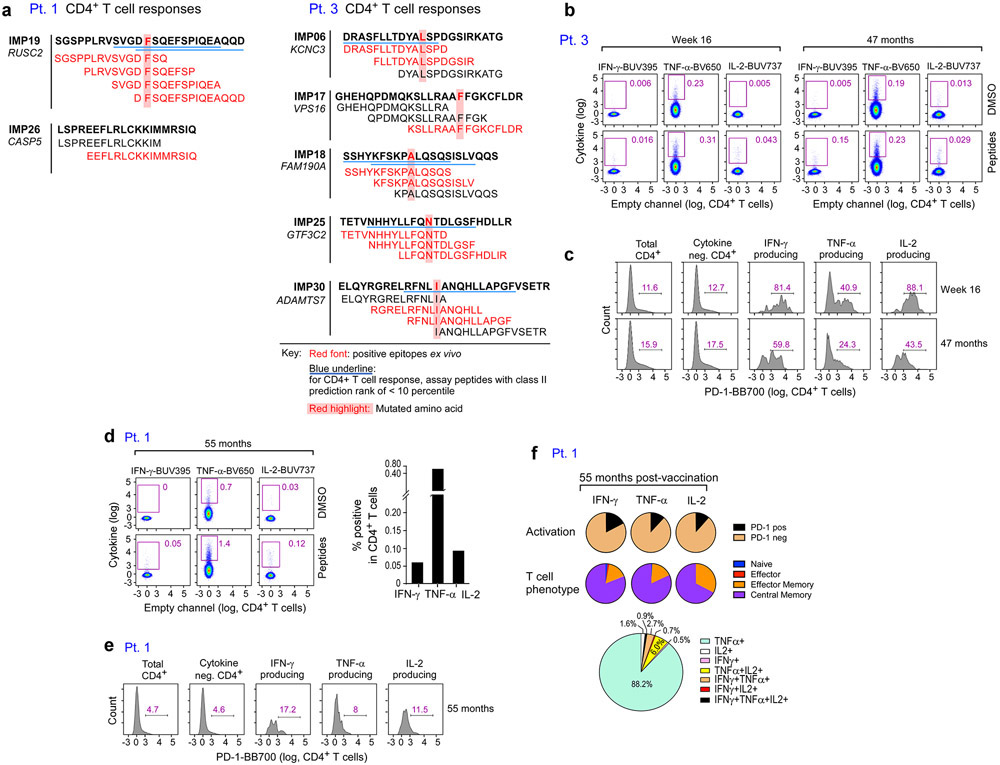
To assess the longer-term persistence of vaccine-induced, neoantigen-specific T cells, we measured T cell responses using PBMC samples collected 28 to 55 months following initiation of vaccination (Methods). Remarkably, T cell responses against the majority of immunizing peptides were largely sustained up to 4.5 years after vaccination. For example, in Pt. 3, we observed strong T cell responses both at week 16 (frozen PBMCs) and 47 months post-vaccination (fresh PBMCs) to both ASP and predicted class I epitopes (EPT) peptides (Fig. 5a). Across the 8 patients, 68% of previously positive ASP-specific CD4+ T cell responses and 59% of previously positive EPT-specific CD8+ T cell responses observed at week 16 remained detectable 28 to 56 months post-vaccination (Fig. 5b). In Pts. 3 and 5, we could also detect persistent CD4+ T cell responses directly ex vivo against 80% and 25% of ASP peptides that had generated ex vivo responses at week 16, respectively (Supplementary Dataset 4, Extended Data Fig. 7). Notably, in Pt. 6, who received pembrolizumab after vaccination, CD4+ T cell responses against 2 of 2 peptides (corresponding to one targeted neoantigen) and CD8+ T cell responses against 1 of 2 peptides (corresponding to two targeted neoantigens) that had emerged only after anti-PD-1 therapy remained detectable 44 months after vaccination.
Figure 5. Vaccine-induced neoantigen specific T cells persist over several years.
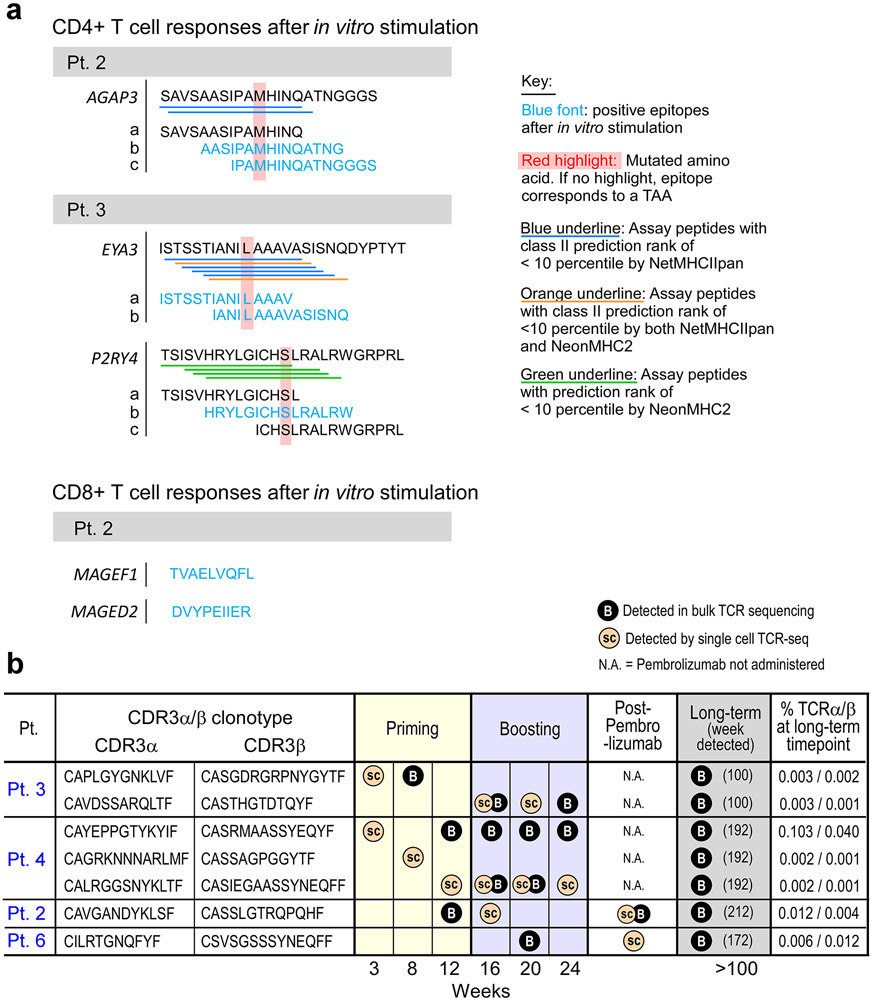
a. Representative IFN-γ ELISpot responses of Pt. 3 neoantigen-specific CD4+ T cells specific for 4 ASP (15- to 16-mer) peptides and neoantigen-specific CD8+ T cells specific for 2 EPT (9-10-mer) peptides at 16 weeks and 47 months post-vaccination, respectively (cells were stimulated with peptides in vitro prior to ELISpots). b. Proportion of neoepitope peptides stimulating T cell reactivity that persisted to 2-4.5 years (filled blue and red) of the total responses detected at 16 weeks (blue outline), and after anti-PD-1 therapy (Pts. 2 and 6, red outline). Note that the x-axis scaling is different for CD4 (left) vs. CD8 (right) to visualize the distribution of persistent and non-persistent responses.. c. CDR3α/β chains of tetramer-specific TCRα/β that were detected in the bulk TCR sequencing of PBMCs collected between 100 and 212 weeks after vaccination. Timepoints of earlier detections by single-cell and bulk TCR sequencing and percentages of TCRα and TCRβ chains in the long-term bulk population are also shown. d. Percentages of Pt. 3 CD4+ T cells secreting cytokines in response to pools of ASP peptides that had generated ex vivo CD4+ responses as measured by intracellular cytokine staining after ex vivo stimulation with ASP pools at 16 weeks and at 47 months after vaccination. Negative controls (unstimulated CD4+ T cells) have been subtracted. Pie charts depict PD-1 expression, T cell phenotypes, and secretion of individual cytokines among the cytokine-producing CD4+ T cells. Markers were selected to evaluate cytokine secretion (IFN-γ, IL-2, and TNF-α), activation (PD-1), naïve (blue, CD27+/CD45RA+), effector (red [not visible], CD27−/CD45RA+), central memory (purple, CD27+/CD45RA−), and effector memory (orange, CD27−/CD45RA−) T cell phenotypes.
To determine whether we could detect long-term persistence of individual neoantigen-specific T cell clonotypes, we analyzed bulk TCR sequencing data from PBMC collected during priming, boosting, and more than 2 years after vaccination. Multiple TCRα/β pairs that had been identified by the tetramer-specific single-cell TCR sequencing during the priming and boosting phase were identified at several time points in the bulk sequencing data (Supplementary Dataset 8). Importantly, across 4 of the 5 patients with available long-term bulk TCR sequencing data, at the long-term time point we detected 7 tetramer-specific TCRα/β pairs that had been identified by single-cell TCR sequencing during the priming and boosting phases (Fig. 5c, Extended Data Fig. 9b), demonstrating on a clonal level that vaccine-induced T cells persisted for several years after vaccination.
Further assessment of T cells from Pts. 1 and 3 by 11-color multi-parameter flow cytometry revealed that CD4+ T cells that had generated robust and persistent ex vivo responses after stimulation with ASP peptides produced IFN-γ, TNF-α, and IL-2 at 55 months for Pt. 1 and both 16 weeks and at 47 months for Pt. 3, demonstrating polyfunctionality that persisted over several years (Fig. 5d, Supplementary Table 5). For Pt. 3 at week 16, the majority of ASP-peptide pool-stimulated cells were PD-1-expressing central memory T cells, and while the majority of cytokine-producing T cells at 3 years maintained a central memory phenotype, there was a 39% average decrease in the expression of PD-1, suggesting an association between antigen exposure (i.e. actively ongoing vaccination) and T cell activation (Extended Data Fig. 8c). For Pt. 1 at 55 months, we also observed a predominantly central memory phenotype with relatively lower expression of PD-1 on cytokine producing T cells (Extended Data Fig. 8d-f).
Personal neoantigen vaccines induce epitope spreading of T cell responses, indicative of tumor cytolysis
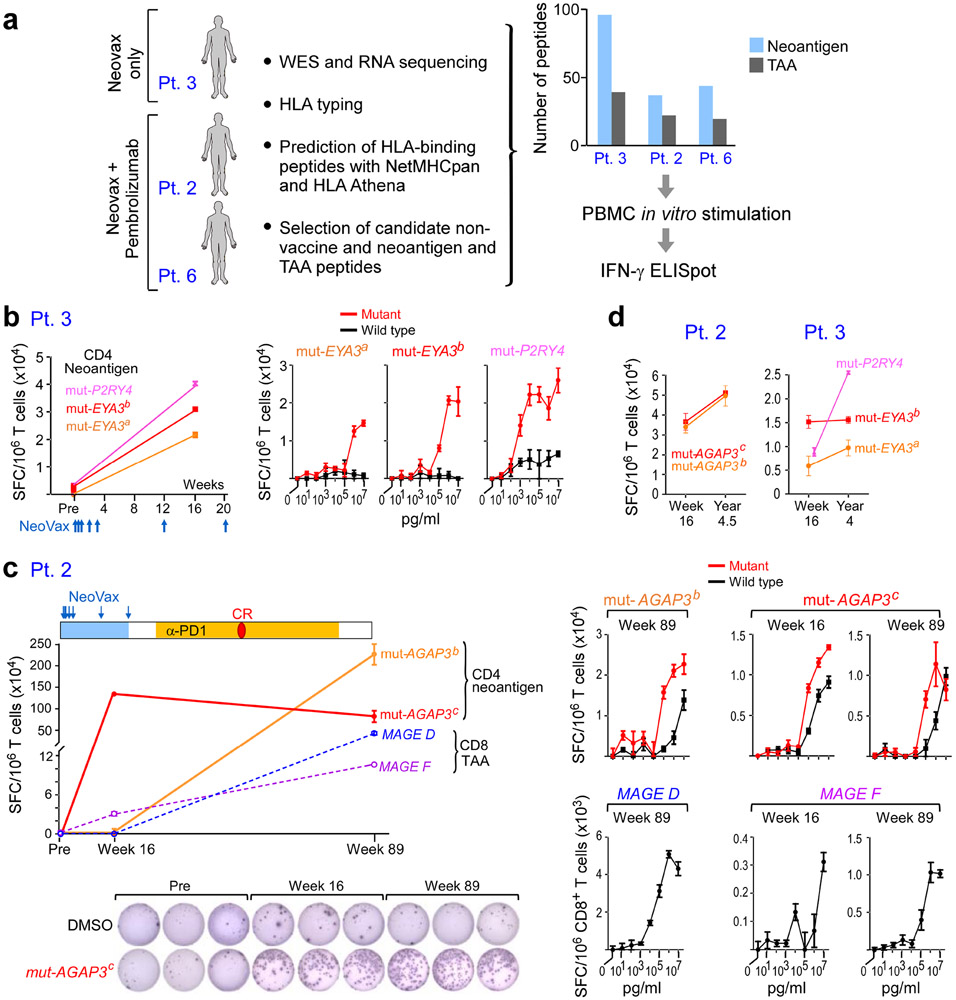
None of the patients on this trial had measurable disease at the time of vaccine initiation, preventing direct evaluation of in situ vaccine-mediated anti-tumor activity. Therefore, to probe for evidence of on-target tumor killing in vivo, we tested for epitope spreading against additional antigens, as tumor destruction would be expected to result in the release of new tumor neoantigens or tumor-associated antigens (TAAs), which can trigger additional tumor-directed immune responses. To this end, we assessed T cell reactivity to personal tumor neoantigens and TAAs that were not targeted by the vaccines in three patients (Pts. 2, 3 and 6) for whom sufficient samples were available (“non-vaccine antigens”; Fig. 6a, Methods, Supplementary Datasets 11, 12).
Figure 6. Vaccine-induced T cell responses spread to non-vaccine neoantigen and TAA epitopes.
a. Somatic mutations and tumor-associated antigens were identified by WES of melanoma and germline DNA and their expression was confirmed by tumor RNA-seq. Non-vaccine neoantigen and tumor-associated antigen (TAA) epitope spreading peptides were selected on the basis of HLA binding predictions (Methods). PBMCs were pre-stimulated in vitro with epitope spreading peptides and reactivity was confirmed by IFN-γ ELISpot. b. Left: Pt. 3 IFN-γ secretion of CD4+ T cells stimulated with 3 non-vaccine neoantigen peptides measured by ELISpot in triplicates pre-vaccination and at week 16. Right: IFN-γ secretion of neoantigen-specific CD4+ T cells tested across a range of concentrations of mutated and wildtype peptides. c. Top left: Pt. 2 IFN-γ secretion of T cells stimulated with 2 non-vaccine neoantigen peptides (solid lines) and 2 TAA peptides (dashed lines) as measured by ELISpot in triplicates at week 16 and week 89 (after anti-PD-1 therapy). CR indicates complete response. Bottom left: Representative IFN-γ ELISpot response of mut-AGAP3c-specific CD4+ T cells. Right: IFN-γ secretion of neoantigen-specific CD4+ T cells tested across a range of concentrations of mutated and wildtype peptides; TAA-specific CD8+ T cells against TAA peptides (lower panels), respectively. d. IFN-γ ELISpot responses of CD4+ T cells specific for non-vaccine neoantigens persist up to 3 years post-vaccination in Pts. 2 and 3. ELISpots were performed in triplicate wells/condition (error bars, s.e.m).
For Pt. 3, pre-vaccine and post-vaccination (week 16) PBMCs were stimulated in vitro for 14-21 days with pools of peptides encompassing 58 and 38 non-vaccine EPT and ASP neoantigen peptides corresponding to 15 neoantigen mutations, respectively, and 39 EPT TAA peptides targeting 9 TAA genes, then tested for T cell reactivity. Upon peptide deconvolution, we observed CD4+ T cell responses against 3 (8%) of 38 ASP peptides corresponding to 2 non-vaccine neoantigens (mut-EYA3 and mut-P2RY4) following vaccination, which were not detected prior to vaccination (Fig. 6b, Extended Data Fig. 9a). For all three peptides, CD4+ T cells could discriminate between mutated and wildtype antigens.
For Pts. 2 and 6, we also had the opportunity to additionally evaluate whether pembrolizumab following vaccination impacted epitope spreading. PBMCs collected pre-vaccination, post-vaccination (week 16), and post-pembrolizumab were stimulated with pools of peptides encompassing 13 and 24 non-vaccine neoantigen EPT and ASP peptides corresponding to 12 neoantigen mutations, and 22 non-vaccine TAA EPT peptides targeting 11 TAA genes, for a single round of in vitro expansion. For Pt. 2, both following vaccination and after pembrolizumab, but not prior to vaccination, we detected a CD4+ T cell response against one (4%) of 24 non-vaccine neoantigen ASP peptides (mut-AGAP3c) and a CD8+ T cell response against one (3%) of 30 non-vaccine TAA EPT peptides (MAGEF) (Fig. 6c, Extended Data Fig. 9a). Moreover, after pembrolizumab (89 weeks post-vaccination), we detected an additional CD4+ T cell response against a second non-vaccine neoantigen ASP peptide targeting mut-AGAP3 (mut-AGAP3b), and an additional CD8+ T cell response against a TAA EPT peptide (MAGED). Again, all of the non-vaccine neoantigen-specific CD4+ T cells were able to discriminate between mutated and wildtype antigens, and the functional avidities of the TAA epitopes and neoepitopes were comparable. For Pt. 6, neither CD4+ nor CD8+ T cell responses against any non-vaccine peptides were observed. Finally, we observed persistence of CD4+ T cell responses to the identified non-vaccine neoantigens out to 4.5 and 4 years after vaccination in Pts. 2 and 3, respectively (Fig. 6d). Altogether, our data reveal epitope spreading that is detectable early after vaccination, can extend to additional targets after anti-PD-1 therapy, and that persists for several years.
Discussion
Specificity, memory, functionality, and adaptability are key attributes that enable the immune system to mediate long-term control of continuously evolving tumors. Since the generation of durable immunity is a hallmark of successful vaccination, we are encouraged by the long-term persistence of CD4+ and CD8+ T cell responses against the majority of immunizing epitopes in all 8 high-risk melanoma patients on study. The ability to induce and maintain neoantigen-specific T cell responses lasting several years underscores the capacity of neoantigen-directed cancer vaccines to imitate long-term immunity observed following vaccination against infectious organisms by utilizing targets that are “foreign” to the immune system and therefore not subject to central tolerance mechanisms in the thymus. Nevertheless, as evident by several recurrences observed in the 8 patients on the trial after longer-term follow up, neoantigen vaccination alone may not be sufficient to generate lasting clinically effective antitumor immunity as the tumor microenvironment evolves.
We assessed gene expression profiles in individual neoantigen-reactive CD4+ T cells directly ex vivo serially across multiple time points during the prime and boost phases of vaccination. In all patients, we found upregulation of genes related to cytotoxicity (GZMA, GNLY) that was most pronounced during the post-priming and early-boosting phase, suggesting that these vaccine-specific CD4+ T cells may be able to kill tumor targets directly, consistent with our own observation of CD107αβ protein expression on vaccine specific CD4+ T cells and previous data9-12. We also identify the expression of memory markers (SELL) in neoantigen-specific T cells arising towards the end of the NeoVax vaccination period, followed by a shift to a less exhausted memory phenotype after vaccination. Memory T cells are critical to spontaneous immune control13 and following adoptive therapy14 and the ability to properly differentiate to effective memory cells, which depends on PD-1 signaling, has been shown to be critical for long term viral control15.
Single-cell TCR sequencing of tetramer-sorted cells allowed the dissection of T cell populations reactive to a single neoepitope by individual TCR clonotypes. Expression of paired α and β TCRs demonstrated the antigen reactivity of a large fraction of tetramer+ cells. This high resolution approach provides a first insight into the composition and evolution of neoantigen vaccine-induced T cell responses on a clonal level. We observed persistence of individual clonotypes throughout the 6 month vaccination regimen, but also a substantial degree of diversification, consistent with dynamic shaping of the TCR repertoire over time.
In addition to long-term durability and elucidation of phenotypic and functional states, a key question is whether vaccine-induced neoantigen-specific T cells are able to recognize and kill tumor targets in vivo. We previously reported that NeoVax-induced T cells can recognize autologous melanoma cells in a subset of patients. We now provide evidence of NeoVax-induced in vivo tumor cytolysis manifested by the development of de novo T cell responses directed against neoantigen targets and tumor-associated antigens that were expressed by the tumors, but not contained in the vaccines in 2 of 3 patients with available samples. T cell responses against non-vaccine neoepitopes and TAA epitopes were detected in Pt. 2, who developed recurrent melanoma metastases after vaccination and in Pt. 3, who remained without evidence of disease. We note that although we did not detect responses to non-vaccine neoepitopes following in vitro stimulation of PBMC prior to vaccination, we cannot exclude the possibility that very low-frequency T cells specific for some of the non-vaccine epitopes could have been present. These results suggest that epitope spreading can occur not only in patients with clinically evident metastases, but also in the presence of undetectable micro-metastatic disease. In both patients, non-vaccine antigen-directed responses were detected after treatment with NeoVax alone, and Pt. 2 subsequently developed two additional non-vaccine antigen-directed responses after anti-PD-1 therapy. In a separate study in patients with advanced melanoma, non-small cell lung cancer, or bladder cancer who received a similar personalized neoantigen vaccine concurrently with nivolumab, T cell responses against 33 of 330 non-vaccine neoepitopes across 25 patients were detected, indicating epitope spreading in a larger cohort of patients. Of note, epitope spreading in that study was associated with prolonged progression-free survival, consistent with previous observations.16,17.
In conclusion, we demonstrate that personal neoantigen long peptide vaccines in patients with melanoma generate memory T cell responses that exhibit cytolytic properties in vivo and are sustained in the peripheral blood over several years. The long-term persistence of functional neoantigen-specific T cells in conjunction with the expansion and diversification of neoantigen-specific T cell clones, particularly in combination with immune checkpoint directed therapy, may be well suited to help control continuously evolving metastatic tumors.
Methods
Study design
Between May 2014 and July 2016, patients with high-risk melanoma were enrolled in a single center, phase I clinical trial approved by the Dana-Farber/Harvard Cancer Center Institutional Review Board (IRB) (NCT01970358). This study was conducted in accordance with the Declaration of Helsinki. Patients provided informed written consent prior to enrolling in the trial. Patients satisfied eligibility criteria if they had clinically or radiographically evident, pathologically-confirmed stage IIIB/C and IVM1a/b melanoma deemed amenable to complete surgical resection and an ECOG performance status of 0 or 1 (Supplementary Table 1). More details about eligibility criteria have been described previously1. As previously reported, Pts. 1-6 received vaccines; Pts. 7-10 were not vaccinated (reasons originally reported)1; Pts. 11 and 12 had not yet been enrolled at the time of the previous report, but are described herein. The primary endpoints of the study were safety and feasibility. The secondary endpoints were the induction of tumor- and neoantigen-specific cellular immune responses and the number of patients alive at 2 years after melanoma resection.
Each personalized neoantigen-targeting vaccine was generated as previously described1. In brief, vaccines consisted of long peptides combined into 4 distinct immunizing peptide pools with 0.3 mg of each peptide admixed with 0.5 mg poly-ICLC per pool in a volume of 1 ml, which were administered subcutaneously (SC) on days 1, 4, 8, 15, and 22 (priming phase) and weeks 12 and 20 (booster phase). Each of the 4 neoantigen vaccine pools per patient was injected into one of four “non-rotating” extremities (or the left or right midriff as an alternate anatomical location).
Clinical assessments
Safety was assessed based on the occurrence of adverse events, which were categorized and graded according to National Cancer Institute Common Terminology Criteria for Adverse Events (CTCAE, version 4.0). Safety assessments were performed on the day of vaccination and one week after each vaccination during the treatment phase and every 3 months until 2 years during the follow-up phase (Supplementary Table 2b). Surveillance scans (computer tomography or combined position emission tomography/computer tomography) were performed every 6 months and are ongoing; standard RECIST 1.1 criteria were to assess disease recurrence.
Patient samples
Heparinized blood samples were obtained from study subjects on IRB-approved protocols at the DFCI and stored in vapor-phase liquid nitrogen until the time of analysis. Patient peripheral blood mononuclear cells (PBMCs) were isolated by Ficoll/Hypaque density-gradient centrifugation (GE healthcare) and cryopreserved with 10% dimethylsulfoxide in FBS (Sigma-Aldrich). HLA class I and class II molecular typings were elucidated by PCR-rSSO (reverse sequence specific oligonucleotide probe), with ambiguities resolved by PCR-SSP (sequence specific primer) techniques (One Lambda Inc., BWH Tissue Typing Laboratory).
Patient tumor samples were attained immediately following surgery. A portion of the sample was removed for formalin fixation and paraffin embedding (FFPE), while the remainder of the tissue was manually minced and suspended in a solution of collagenase D (200 unit/mL) and DNAse I (20 unit/ml) (Roche Life Sciences). The tissue was then transferred to a sealable plastic bag and incubated with regular agitation in a Seward Stomacher Lab Blender for 30-60 min. After digestion, remaining clumps were removed and the single cell suspension was recovered, washed, and immediately frozen in aliquots and stored in vapor-phase liquid nitrogen. For Pts 1, 2, 3, 5, 7, 11 and 12, frozen tumor cell suspensions were used for WES and RNA-seq. For Pt. 4 and 6, WES and RNA-seq were performed on scrolls from the FFPE tissue. Immunohistochemical evaluation of HLA class I and II expression of the surgically resected tumors at study entry demonstrated detectable class I expression in tumors from Pt. 12 but not Pt. 11 (Extended Data Fig. 2d-e, Supplementary Table 2a, Supplementary Dataset 1).
Generation of personal neoantigen vaccines
Whole-Exome Sequencing (WES):
CLIA-certified WES was conducted by the Clinical Research Sequencing Platform, Broad Institute (CLIA #:22D2055652). Library construction from surgical melanoma specimens (original and relapsed tumors) and matched germline DNA of all patients was performed as previously described18. Briefly, cell suspensions were used for WES, and whole-exome capture was performed using the Illumina Nextera Rapid Capture Exome v1.2 bait set. Resulting libraries then underwent qPCR quantification, pooling, and sequencing with 76 base paired-end reads using HiSeq 2500 sequencers (Illumina). The Broad Picard Pipeline, which includes de-multiplexing, duplicate marking, and data aggregation, was used to analyze the data.
RNA sequencing (RNA-seq):
RNA sequencing was performed as previously described for Pts. 11 and 12. Briefly, for sequencing library construction, a Qiagen RNeasy RNA extraction kit was used to extract RNA from frozen cell suspensions. RNA was extracted from fresh frozen sections (Pt. 1 relapsed tumor) or FFPE samples (Pt. 2, 3, 5, 6 relapsed tumors) using the Qiagen AllPrep DNA/RNA/miRNA Universal Kit or the Qiagen AllPrep DNA/RNA FFPE Kit, respectively. RNA-seq libraries were prepared using an Illumina TruSeq Stranded mRNA Library Prep Kit (for cell suspensions) or Illumina’s TruSeq RNA Access Library Prep Kit (for FFPE samples). Flowcell cluster amplification and sequencing were performed according to the manufacturer’s protocols using the HiSeq 2500. Each run was a 101 bp paired-end with an eight-base index barcode read. Data were analyzed using the Broad Picard Pipeline, which includes de-multiplexing and data aggregation.
DNA quality control:
Standard Broad Institute protocols as previously described 19,20 were used for DNA quality control. Mass spectrometric fingerprint genotyping of 95 common SNPs by Fluidigm Genotyping (Fluidigm) was used to confirm the identities of all tumor and normal DNA samples. ContEst21 was used to assess sample contamination from foreign DNA (Supplementary Dataset 1).
RNA quality control:
All RNA was quantified using the Quant-It RiboGreen RNA reagent, an ultrasensitive fluorescent nucleic acid stain used for quantitating RNA in solution, and a dual standard curve. The assay generates a quantity metric ranging from 2-1000 ng/μL. The dilution plate generated with 3 μL of sample was used for entire QC process. The RNA was then qualified using the LabChip GX Touch. The assay generated a quality metric – the RNA Quality Score (RQS) – which was used to establish acceptance criteria for further analysis of the samples. The RQS ranges from 0 to 10, with 10 representing the highest quality. This metric correlates closely with Agilent’s RIN score. The LabChip GX instrument primed the chip and automatically initiated the electrophoretic analysis of the samples. The samples were aspirated one-by-one into the chip through the sipper capillary. Once samples were in the chip, it was stained, separated, and detected in microfluidic channels. For poor quality samples, such as FFPE, a DV200 score was used to determine the percentage of fragments >200 nucleotides. A score of 35% or greater was considered likely to perform well in sequencing.
Modified explanation of RQS from the LabChip GX user guide https://www.perkinelmer.com/Product/24-labchip-gx-ii-touch-cls138161: RQS stands for Relative Quality Score. The software determines the quality of the RNA sample by measuring the amounts of known RNA fragments relative to the total RNA present in the sample. The raw data were filtered and the resulting electropherograms of all wells were plotted. A curve spline fit to the data were performed to generate a baseline above which RNA fragment peaks are detected. This baseline was displayed as a blue line on the electropherogram and was adjusted as needed. A sizing ladder, which is a mixture of RNA fragments of different known sizes, was run first from the ladder vial. The ladder was analyzed and a standard curve of migration time versus RNA size was plotted from the RNA ladder by interpolation between individual RNA fragment size/migration points. A dye matching the lowest peak in the ladder was run with each of the samples. This is called the lower marker, which is used to align the ladder data with data from the sample wells. The standard curve and the markers were used to calculate RNA fragment sizes for each well from the migration times measured. The total RNA present was computed by finding the area under the electropherogram trace. The baseline for this integration is a straight line starting at the end of the lower marker and ending at the baseline end time. The height of the baseline endpoints was computed from an average of a five second window around the baseline start time and end time. These values were used to create a Relative Quality Score which allowed us to evaluate the quality of RNA before it moves forward for sequencing (Supplementary Dataset 1).
Somatic mutation calling
Mutation analysis:
Coding-sequence specific mutations and small insertions/deletions were identified through analyses of whole-exome sequencing data of tumor and matched PBMCs (as the source of normal germline DNA). We utilized GATK4 pipelines in the Terra cloud platform for somatic mutation detection. Paired-end Illumina reads were aligned to the hg19 human genome reference using the Picard pipeline to yield BAM files containing aligned reads (bwa version 0.5.9) with well-calibrated quality scores. Cross-sample contamination was assessed with the GATK’s CalculateContamination tool with a 5% threshold. Point mutations and indels were identified using the Mutect2 tool (v2.7.0). Possible artifacts due to orientation bias and alignment errors were removed through a series of filters (github.com/gatk-workflows/gatk4-somatic-snvs-indels/Mutect2). A random subset of alterations were manually reviewed in integrated genome viewer22. The final list of filtered mutations, insertions and deletions were annotated using Funcotator. (Supplementary Dataset 2).
Copy number analysis:
Copy number events were called and filtered using GATK4 ModelSegments23 [https://gatkforums.broadinstitute.org/dsde/discussion/11683]. In order to minimize false positives, we utilized a copy number panel-of-normals created based on germline samples processed using the same platform. We applied a custom conversion script to format the outputs of ModelSegments (both copy ratio and allelic fraction) to be compatible with ABSOLUTE24, the tool used to estimate sample purity and ploidy as well as cancer cell fractions (CCFs). ABSOLUTE solutions were picked by manual inspection. The final chosen purity and ploidy solutions were used to estimate CCFs for detected somatic alterations in each sample. Mutations were considered clonal if the expected CCF of the mutation as estimated by ABSOLUTE was 1, or if the estimated probability of the mutation being clonal was greater than 0.5.
Power calculation for somatic mutation detection
Consider a mutation in a sample with purity α, with k mutation-bearing reads and j reference-bearing reads aligned at a locus with total copy number q. The set of possible multiplicity values m . {1,2,…,q}. The expected allelic fractions for each multiplicity value fm was calculated as22:
These were used to estimate the power of detecting at least one mutation-bearing read at the locus as ϕm = 1 − Bin(0; (k + j), fm). The likelihood of each multiplicity was calculated as the probability of observing k mutation-bearing reads under a binomial model lm = Bin(k; (k + j), fm). The normalized likelihoods were used as estimates of probability for each multiplicity.
The overall power of detection was then estimated as the weighted sum of power values at each multiplicity as:
Transcriptomic analysis
RNA-seq data were aligned using STAR25, quantified using RSEM26, and evaluated for quality using RNA-seqQC227. Samples were excluded if they had an interquartile range of log2(TPM+1) < 0.5 (indicating low dynamic range), had less than 15,000 genes detected (indicating low library complexity), had an End 2 Sense Rate<0.90, or End 1 Sense Rate>0.10 (as defined by RNA-seqQC2, indicating strand bias).
Identification of target epitopes for peptide design
For Pt. 11, NetMHCpan v2.49 was used to identify mutation-containing epitopes that were predicted to bind to the patient’s MHC class I molecules, as previously described1. For Pt. 12, 30 peptides were initially designed using NetMHCpan v2.4 as above. The bottom 6 were then replaced with distinct epitopes based on binding predictions from a preliminary version of HLAthena10, a machine-learning algorithm trained on mass spectrometry-identified peptides25, using all other criteria as previously described1. Thirty peptides of 17-26 amino acids length (“long peptides”) from up to 30 independent mutations were selected and prioritized for each patient (Source Data Table 2, 3, 4).
Synthesis of long peptides, pooling, and final vaccine preparation
As previously described1. Standard solid-phase synthetic peptide chemistry and Reverse Phase High Performance Liquid Chromatography (RP-HPLC) was used to synthesize and purify (CS Bio) theGMP peptides for all 8 subjects. A maximum of 20 peptides were formulated in an aqueous solution containing ≤4% DMSO in isotonic dextrose and mixed into up to 4 pools (for Pts. 11 and 12, 3-4 peptides per pool). A final dose of 0.3mg of each peptide was included in the vaccines. On the day of vaccine administration, peptide pools were admixed with 0.5 mg poly-ICLC (Hiltonol®; Oncovir Inc.) by syringe-to-syringe transfer at the DFCI Clinical Pharmacy.
Vaccines for the newly reported patients 11 and 12
The vaccines for Pts. 11 and 12 consisted of 16 and 11 long peptides (lengths 17-26 amino acids [aa]), respectively, encompassing 15 and 11 mutated epitopes. Similar to our previous assessments for neoantigen-specific T cell responses, a total of 71 overlapping 15- to 16-mer assay peptides (ASP) spanning the entirety of each of the 27 immunizing long peptides (IMPs) as well as 42 9- and 10-mer peptides corresponding to predicted class I epitopes (EPT) from the 27 IMP were prepared and pooled.
Evaluation of clonal evolution
Inference of clonal structure, phylogenetic relationship between clones and evolution between pre- and post-treatment time points within a sample was performed using the PhylogicNDT tool (https://www.bioRxiv.org/content/10.1101/508127v2). Clusters with less than 5 supporting mutations were discarded.
Immunohistochemical evaluation of primary melanoma cells
Tumor samples underwent dual immunohistochemical staining of the antigen presentation components: HLA class I (Abcam, EMR8-5, 1:6000) and HLA class II (Dako, CR3/43 M0775, 1:750) with the melanoma marker SOX10 (EP 268, Cell Marque, 1:1500) using an automated staining system (Bond III, Leica Biosystems) according to the manufacturer's protocol, as previously described28. The intensity of positive staining of melanoma cell membranes for the marker of interest (0, negative; 1, weak; 2, moderate; 3, strong) and for the percentage of positive staining malignant cells (0-100%) was assessed by semi-quantitative scoring. A cumulative “H score” was calculated by multiplying the intensity score (0-3) by the percentage of malignant cells with positive membranous staining (0%-100%; with any intensity of positive staining). Stained slides were reviewed and scored by a pathologist as previously described26.
Multiplex immunofluorescence microscopy
Multiplex immunofluorescence staining and analysis was performed on 5-micron thick FFPE tissue sections as previously described using a Bond RX autostainer2,29. Following deparaffinization, rehydration, and antigen retrieval, slides were serially stained with antibodies for SOX10 (EP268; Epitomics), CD8 (4B11, Leica), FOXP3 (D608R, Cell Signaling), PD-1 (EPR4877(2), Abcam), and PD-L1 (E1L3N, Cell signaling); each followed by anti-rabbit polymeric horseradish peroxidase (BOND Polymer Refine Detection Kit, Leica Biosystems) with labelling by Opal Fluorophore Reagents - as previously described. Stained slides were subsequently coverslipped with Prolong Diamond Anti-fade mounting medium (no. P36965, Life Technologies) and imaged using the Vectra multispectral imaging platform (PerkinElmer, Hopkinton, MA). Between 5 and 11 fields of view at 20x resolution were acquired and analyzed using supervised machine learning algorithms within the Inform 2.4 software (PerkinElmer), in order to assign spatial coordinates and cell phenotypes to all cells.
Antigen formats for immune monitoring
Assay (ASP) and predicted class I epitope peptides (EPT) were synthesized and lyophilized (from either JPT Peptide Technologies or RS Synthesis or Automated Flow Synthesis30 (>80% purity). ASP were 15-16 aa covering the IMP sequence. EPT were 9-10 aa. Peptides for generation of class II tetramers were synthesized to >90% purity (21st Century Biochemicals).
Generation and detection of patient neoantigen-specific T cells
PBMCs were cultured in RPMI-1640 medium supplemented with nonessential amino acids, HEPES, L-glutamine, sodium pyruvate, β-mercaptoethanol, penicillin/streptomycin (Gibco), and 10% AB-positive heat-inactivated human serum (Gemini Bioproduct). For in vitro expansion (‘pre-stimulation’) of antigen-specific T cells, IL-7 (20 ng/ml; R&D Systems) was added to culture medium and 5x10⁶ PBMCs per well were stimulated in 24-well cell culture plates with individual (1.5-2 μg/ml) or pooled peptides (each at 1.5-2 μg/ml). On day 3, low-dose IL-2 (20 U/ml) was added. Supplementation of cytokines and half-medium change were performed every 3 days, as described previously31. T cell specificity against peptide was tested by interferon (IFN)-γ ELISpot in RPMI-1640 medium supplemented with penicillin/streptomycin and 10% FBS (complete RPMI) after 14-21 days. T cells were enriched with CD4+ or CD8+ T cell Isolation Kit beads (Miltenyi Biotec) prior to plating for ELISpot for deconvolution of CD4+ and CD8+ T cell responses.
IFN-γ enzyme-linked immunospot (ELISpot) assay
IFN-γ ELISpot assays were performed as described previously1. Briefly, for pre-stimulated T cells, 1x10⁴ autologous CD4+ and CD8+ T cell-depleted PBMC (APCs) were co-cultured with 5x10³ CD4+ T cells or 1-3x10⁴ CD8+ T cells. Peptides (10 μg/ml) and APCs were directly added to the ELISpot wells and incubated with T cells overnight in complete RPMI at 37°C. For ex vivo ELISpot, 2x10⁵ PBMCs were plated in triplicate with 5 μg/ml peptide and incubated overnight, and normalized results are presented as previously1, by spot-forming cells (SFC)/1 x 106 cells. For the experiments in Extended Data Fig. 4a, non-nucleofected B cells or B cells nucleofected with minigenes encoding mutated or wildtype peptides were used as APCs, and APCs were cultured on the ELISpot plate with HLA blocking antibodies (10 μg/ml, pan anti-DR [clone: L243]) as previously described1. Responses were scored positive if SFC were at least 2.5-fold over the DMSO control. For Fig. 1b, for each patient, SFC were regressed on pool, time, and the interaction of pool and time using repeated measures-models with an unstructured covariance. The Benjamini-Hochberg procedure was used to adjust P-values (two-sided t-test) for the comparisons of each pool against the mock to maintain an overall alpha of 0.05 at each time point within patient.
Assessment of long-term vaccine induced responses
For each of the 8 patients, we stimulated PBMCs in vitro for one round using pools of overlapping 15- to 16-mer assay peptides (ASP) and epitope-length peptides (EPT) that had previously induced IFN-γ responses at 16 weeks after vaccine initiation, and in the cases of Pts. 2 and 6, using additional vaccine peptides specific for responses that were observed only after pembrolizumab initiation8.
Flow cytometry staining
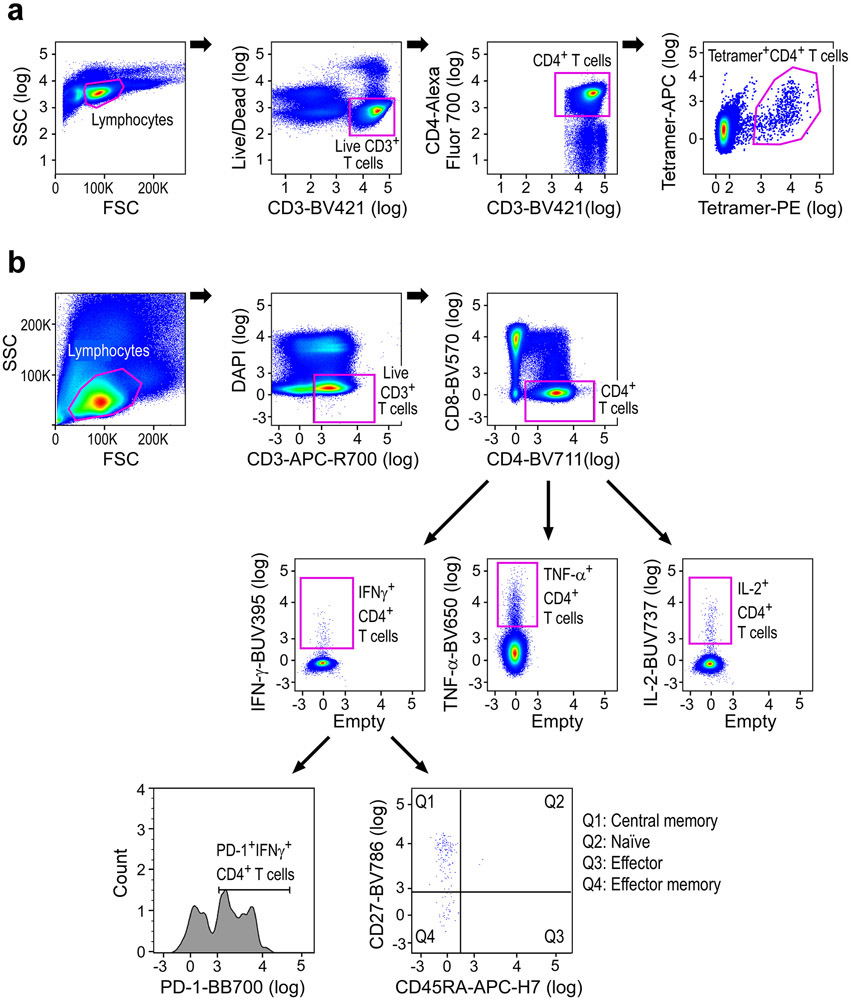
Multiparameter intracellular cytokine staining assays were performed as previously described32. Briefly, frozen patient PBMCs were thawed and then rested in RPMI containing 10% FBS and 50 U/ml Pen/Strep in 50 mL conical tubes overnight. The next day, intracellular cytokine staining (ICS) was performed. 1-5 x 10⁶ PBMCs /well were re-suspended in 100 μL of R10 media supplemented with CD49d monoclonal antibody (1 μg/mL). Each sample was assessed with mock (100μL of R10 plus 0.5% DMSO; background control), pooled ASP peptides (5 or 10 μg/ml each), or 10 pg/mL phorbol myristate acetate (PMA) and 1 μg/mL ionomycin (Sigma-Aldrich) (100μL; positive control) and incubated at 37°C for 1 h. After incubation, 0.25 μL of GolgiStop and 0.25 μL of GolgiPlug in 50 μL of R10 was added to each well and incubated at 37°C for 8 h and then held at 4°C overnight. The next day, the cells were washed twice with DPBS, stained with Aqua Amin live/dead dye for 10 mins and then stained with predetermined titers of monoclonal antibodies (Supplementary Table 5) against CD4 (clone L200; BV711), CD8 (clone RPA-T8; BV570), PD-1 (clone EH12.1; BB700), CD27 (clone O323; BV786), CD45RA (clone 5H9; APC-H7), and CD69 (clone TP1.55.3, ECD), for 30 min. Cells were then washed twice with 2% FBS/DPBS buffer and incubated for 15 min with 200μL of BD CytoFix/CytoPerm Fixation/Permeabilization solution. Cells were washed twice with 1X Perm Wash buffer (BD Perm/Wash™ Buffer 10X in the CytoFix/CytoPerm Fixation/Permeabilization kit diluted with MilliQ water and passed through 0.22 μm filter) and stained with intracellularly with monoclonal antibodies against CD3 (clone UCHT1; APC-R700), IFN-γ (clone B27; BUV395), IL-2 (clone MQ1-17H12; BUV737), and TNF-α (clone Mab11; BV650) for 30 min. Cells were washed twice with 1X Perm Wash buffer and fixed with 250 μL of freshly prepared 1.5% formaldehyde. Fixed cells were transferred to 96-well round bottom plate and analyzed by BD FACSymphony™ system (Extended Data Fig. 10b). Data was analyzed using FlowJo v10 software.
Generation of HLA-DR tetramers loaded with defined neoantigen peptides
We focused on HLA-DR restricted responses, as class II tetramers against peptide-HLA-DR complexes could be reliably generated. DR1/CLIP or and DR4/CLIP were expressed in stably transfected CHO cells as previously described33. Jun and Fos dimerization domains were incorporated in the DRα and β chain extracellular domains, and a C-terminal BirA site was attached to the DRα chain to enable site-specific biotinylation. A CLIP peptide occupied the peptide binding site, which was linked through a thrombin-cleavable linker to the N-terminus of the mature DRβ chain. Affinity chromatography using mAb L243 (American Type Culture Collection) was used to purify DR/CLIP complexes from CHO cell supernatants. Purified DR molecules were biotinylated with a 1:20 molar ratio of BirA:DR as described30. DR complexes were treated with thrombin for 2 h to release the CLIP peptide prior to peptide loading. Peptide-exchange reactions were carried out with a 15-fold molar excess of dansyl-labeled peptides (21st Century Biochemicals) in a buffer containing 50 mM J1031, 50 mM sodium citrate, 100 mM NaCl, and 1x protease inhibitor cocktail overnight at 30-37 °C. A Superose 12 HPLC gel filtration column (Amersham) was used to separate DR/peptide complexes from unbound peptide. DR molecules loaded with defined neoantigen peptides (Supplementary Table 4) were isolated using an anti-dansyl affinity column, then complexes were eluted using 50 mM CAPS, pH 11.5 and neutralized with 1 M phosphate, pH 6.0. Biotinylated DR/peptide monomers were buffer exchanged with PBS, concentrated to >1 mg/mL, and frozen in aliquots at −80°C. Fluorophore-labeled streptavidin (either PE or APC) was then added to biotinylated DR/peptide monomers at a 1:4 molar ratio in four separate additions over 40 min at room temperature (Streptavidin-R-Phycoerythrin (PE), Prozyme; Streptavidin-Allophycocyanin (APC), Invitrogen or Prozyme).
DR3/CLIP and DR7/CLIP complexes were expressed in Sf9 insect cells as previously described34. DRα and β chain constructs were cloned into the pAcDB3 vector for dual p10 promotor-driven expression. Recombinant baculoviruses was prepared, amplified, and used for protein expression in Sf9 cells cultured in SF900 II medium (Life Technologies). Cells were harvested 72 hours after infection and DR/CLIP complexes were purified from concentrated supernatants by affinity chromatography using mAb L243. Subsequent purification and peptide loading was performed as described above for DR1 and DR4 molecules.
Tetramer labeling of CD4+ T cells
CD4-enriched patient PBMCs (CD4+ T cell Isolation Kit (Miltenyi Biotec) at a cell density of 10-20x106 cells/mL were stained with both APC- and PE-labeled tetramers (Supplementary Table 4) at 20 μg/mL in RPMI containing 10% FBS, 2mM glutamine, 10 mM HEPES, and 50 U/mL Pen/Strep for 1 h at room temperature. DR/CLIP tetramers were used as negative controls. Two washes with flow staining buffer (PBS + 2%FBS) were performed to remove unbound tetramer. Cells were then stained with Live/Dead Aqua (Invitrogen) for 15 min at room temperature, then with anti-CD3 (BV421, UCHT1, Biolegend), anti-CD4 (Alexa Fluor700, OKT4, Biolegend), and anti-CD14/CD19 (BV510) for 20 min at 4°C (Supplementary Table 6). Cells were washed once with PBS then analyzed on a BD Aria cell sorter (Extended Data Fig. 10a).
TCR reconstruction and expression in T cells for reactivity screening.
T cell receptors were selected upon TCR sequencing of tetramer positive CD4+ T cells sorted from 3 patients (Pts. 2, 3, 6). The full-length TCRA and TCRB chains, separated by the Furin SGSG P2A linker, were synthesized in the TCRB/TCRA orientation (Integrated DNA Technologies) and cloned into a lentiviral vector under the control of the pEF1α promoter using Gibson assembly (New England Biolabs Inc). For generation of TCRs, full-length TCRA V-J regions were fused to optimized mouse TRA constant chain, and the TCRB V-D-J regions to optimized mouse TRB constant chain to allow preferential pairing of the introduced TCR chains, enhanced TCR surface expression and functionality.35,36
Donor T cells enriched from PBMCs using PanT cell selection kit (Miltenyi) were activated with anti-CD3/CD28 dynabeads (ThermoFisher Scientifics) in the presence of 5ng/mL of IL-7 and IL-15 (Peprotech). After 2 days, activated cells were transduced with a lentiviral vector encoding the TCRB-TCRA chains. Briefly, lentiviral particles were generated by transient transfection of the lentiviral packaging Lenti-X 293T cells (Takahara) with the TCR encoding plasmids and packaging plasmids (VSVg and PSPAX2,37) using Transit LT-1 (Mirus). Lentiviral supernatant was harvested 2 days later, for 2 subsequent days, and used to transduce activated T cells. Lentiviral transductions were performed by spinoculation of the virus at 2,000 rpm, 37°C for 2 hours, and cells were cultured on viral supernatant for 3 days. Six days after activations the beads were removed from culture and expanded in media enriched of IL-7 and IL-15. Transduction efficiency was determined by flow cytometric analysis using the anti-mTCRB antibody. Transduced T cells were used at 14 days post-transduction for TCR reactivity tests. Briefly, 2x10⁵ TCR-transduced T cells were co-cultured with an equal number of patient-derived B cells immortalized with the EBV virus (EBV lymphoblastoid cell lines, EBV-LCL) and pulsed with different doses of mutated or wildtype neoantigen peptides (Genscript). After an overnight incubation, TCR reactivity was measured trough detection of CD137 surface expression on CD4+ TCR transduced (mTCRB+) T cells using a Fortessa flow cytometer (BD Biosciences). The activation level of each CD4+ TCR transduced T cell population was expressed as percentage of CD137 positive cells with subtraction of the background detected on the same T cells upon coculture with the patient EBV-LCL pulsed with DMSO (negative control).
Single-cell RNA-seq data generation and analysis
Tetramer-specific CD4+ T cells were dry sorted into 96-well plates for Patients 3, 4, and 5 for whole transcriptome sequencing and TCR sequencing. Whole transcriptome sequencing in plates was performed by Smart-seq2 based protocols previously described38. The FASTQ files were initially trimmed and adaptors were removed using Flexbar39 before aligned to NCBI Human Reference Genome Build GRCh38 (hg38) using the STAR aligner23. The Transcript Per Million (TPM) counts were quantified from the alignment using RSEM24. Further QC was performed excluding cells from the analysis based on four criteria. (1) cells with no PTPRC and CD3 expression (either as CD3D, CD3E or CD3G), (2) cells with less than 500 genes expressed, (3) cells expressing housekeeping genes (Supplementary Dataset 13) with log2 (TPM+1) < 2.5, and (4) percent mitochondrial genes > 10%. For the downstream analysis we only used genes expressed with log2(TPM+1) > 1 in at least 5 cells or log2(TPM+1) > 8 in at least one cell. For each patient, cells from all time points passing the QC were combined before clustering cells from all patients using the integration method in Seurat v36. The clustering was performed using the standard workflow with a resolution of 0.6 and a lower number of principal components (15) in the principal component analysis (PCA) to account for the low variance between the T cells. To account for unwanted variation caused by differences in ribosomal gene content between samples we excluded ribosomal genes from the variable gene set used in the PCA. From the identified clusters, one was removed from the analysis as the cells were suspected to be doublets based on a high number of identified genes with a lower average amount of mapped reads in the cluster. The remaining cells were then re-clustered using the same parameters. Differential expressed genes were identified both between time points, patients and clusters as wells as combinations of these using the default Wilcoxon Rank Sum test implementation in Seurat (Supplementary Dataset 5).
Gene Set Enrichment Analysis
A Gene Set Enrichment Analysis (GSEA) was performed on the identified differentially expressed genes for each cluster with a False discovery rate (FDR) corrected P-value below 0.05. The analysis was done separately for up- and down-regulated genes compared to the other clusters. The background gene set consisted of all genes identified in the dataset. We used WebGestalt40 for the analysis with the gene ontology database of biological processes (Supplementary Dataset 6).
Targeted TCR Sequencing and Analysis
For single-cell TCR sequencing for Pt. 2, FACS-sorted tetramer-stained cells were loaded onto a 10× Genomics Chromium™ instrument (10× Genomics) according to the manufacturer’s instructions. The scRNAseq libraries were processed using Chromium™ single cell 5’ library & gel bead kit and coupled scTCRseq libraries were obtained using Chromium™ single cell V(D)J enrichment kit (10× Genomics). Quality control for cDNA and sequencing libraries were performed using Bioanalyzer High Sensitivity DNA Kit (Agilent). The pooled libraries were sequenced on Illumina MiSeq platform. The sequencing parameters were: Read 1 of 150bp, Read 2 of 150bp, and Index 1 of 8bp. The sequencing depth for TCRseq was >3000 reads per cell (Supplementary Dataset 7). Single-cell TCR sequencing for Pts. 3, 4, and 5 was performed by targeted TCR amplification of TCR transcripts in a 96-well plate format using single-cell-amplified cDNA libraries as published previously41.
RNA extraction for bulk TCR sequencing
Cryopreserved PBMCs were thawed and rested overnight in DMEM GlutaMAX medium (Gibco, ThermoFisher), supplemented with 10% AB-positive heat-inactivated human serum (Gemini Bioproduct), nonessential amino acids, HEPES, β-mercaptoethanol, sodium pyruvate, penicillin-streptomycin (Gibco, ThermoFisher), and 20 ng/mL IL-7 (Peprotech). On the next day, 5 × 10⁶ PBMCs were collected, CD3+ negative selection was performed using a Miltenyi Biotech Pan T Cell Isolation Kit, and total RNA was extracted using a QIAGEN RNeasy Mini kit.
Bulk TCR sequencing analysis
Alpha and beta TCR repertoire analysis in bulk RNA samples was performed using an adapted rhTCRseq protocol published previously41. Specifically, 10 ng bulk RNA was used in each RT reaction, and 4 to 8 replicates were done for each sample and excess RT primers were eliminated by exonuclease digestion, and then rhPCR was performed. After the sequencing library was made, it was sequenced using MiSeq 300 cycle Reagent Kit v2 on the Illumina sequencing system according to the manufacturer’s protocol with 248bp read 1, 48bp read 2, 8bp index 1, and 8bp index 2. The sequencing data analysis was done based on the method published previously36 (Source Data Table 8).
Identification of target epitopes for epitope spreading peptide design
For Pts. 2 and 6, NetMHCpan v2.442 was used to identify non-vaccine mutation-containing epitope (neoepitopes) peptides predicted to bind to the individual patients’ MHC class I molecules, and their expression was confirmed through RNA-seq (TPM >1; for single nucleotide variations, peptides were excluded if there was no expression detected by read count of mutated alleles)1. Non-vaccine neoepitope assay peptides (including both EPT [9- to 10-mer) and overlapping ASP [15- to 16-mer] were then designed and prioritized for peptide preparation). NetMHCpan-predicted peptides not included in the original vaccines were chosen for epitope spreading experiments on the basis of a pre-defined set of criteria in the following rank order: (1) neoORFs which included predicted binding epitopes; (2) high predicted affinity (<150 nM) somatic single nucleotide variations due to anchor residue changes; (3) high-affinity (<150 nM) somatic single nucleotide variations due to mutations in positions other than anchor residues; (4) neoORFs with no predicted binding epitopes; (5) lower affinity (<150-500 nM) versions of (2) and (3) (Supplementary Dataset 11). NetMHCIIpan43 and NeonMHC239 were used to predict MHC class II binding peptides (Supplementary Dataset 12).
For Pt. 3, overlapping ASP were generated for non-vaccine peptides chosen based on NetMHCpan v2.4 binding predictions using the same criteria as above. NetMHCIIpan43 and NeonMHC244 were used to predict MHC class II binding peptides. For Pt. 3 EPT, we selected peptides based on NetMHCpan v4.045 and a preliminary version of HLAthena10. We used the following criteria for initial peptide selection: (1) TPM>1; (2) T_alt_count>5; (3) No cysteine. From the peptides that met the above criteria, for NetMHCpan prediction, we ordered EPT starting from the lowest ell_rank_m that had Ell_rank_mut <0.5. Then, for HLAthena-based prediction, we ordered EPT peptides starting from the highest MSEC (a binding affinity metric that is calculated based on sequencing of HLA-bound peptides by mass spectrometry, expression (TPM), and cleavability) for neoepitopes that had a MSEC>0.85. For HLA-C*06:02, we selected 9-mers only, as this HLA mostly presents 9-mers10. After we listed the peptides predicted by NetMHCpan and HLAthena in the order described above, we selected peptides in the following manner: (4) selected the top 38 peptides that appeared in both the NetMHCpan and HLAthena lists; (5) selected 10 additional NetMHCpan-predicted peptides that had the lowest Ell_rank_mut; (6) selected 10 additional HLAthena-predicted peptides that had the highest MSEC (Supplementary Datasets 11, 12).
For Pt. 2 and 6, TAA EPT peptides originating from a chosen set of common melanoma TAAs expressed in patient tumors and predicted by a preliminary version of HLAthena were chosen. The 20 peptides with the highest MSEC score (> 0.85) were chosen for inclusion (Supplementary Dataset 11). The MAGEEF1 and MAGED2 peptides were unintentionally included.
For Pt. 3, TAA EPT peptides were predicted by a preliminary version of HLAthena and chosen for inclusion on the basis of a pre-defined set of criteria in the following rank order: (1) high predicted binding affinity peptides MSEC > 0.9; (2) high expression in the patient’s tumor (TPM > 100); (3) T_alt_count>5; (4) peptides not containing cysteine residues; (5) only 9- and 10-mer peptides; (6) for HLA-C*06:02-binding peptides, only 9-mers. For those peptides that met these criteria, we listed the peptides from the highest MSEC. We then selected the top 5 peptides for each gene. (Supplementary Dataset 11).
Code Information
Code used for data analysis including Broad Picard Pipeline v2.22.4 (WES/RNA-seq), GATK4 v4.0, Mutect2 v 2.7.0 (sSNV and indel identification), NetMHcpan v2.4 and 4.0 (neoantigen prediction), NetMHCIIpan v4.0 (MHC class II binding peptide prediction), ContEST v1 (contamination estimation), ABSOLUTE v1.1 (purity/ploidy estimation), STAR v2.6.1c (sequencing alignment), RSEM v1.3.1 (gene expression quantification), Flexbar v3.4, WebGestalt 2019 (gene set enrichment analysis), HLAthena (neoantigen prediction), Seurat v3.1.0 (single cell sequencing analysis), IGV v2.6.3 (genomic variant visualization), PhylogicNDT v1, Inform 2.4, and FlowJo v10, are publicly available from the indicated references.
Reporting summary
Further information on research design is available in the Nature Research Reporting Summary linked to this paper.
Data availability statement
All requests for raw and analyzed data and materials will be promptly reviewed by the Belfer Office for Dana-Farber Innovations to verify if the request is subject to any intellectual property or confidentiality obligations. Patient-related data not included in the paper were generated as part of clinical trials and may be subject to patient confidentiality. Any data and materials that can be shared will be released via a Material Transfer Agreement. DNA and RNA sequencing data are available through dbGaP (https://www.ncbi.nlm.nih.gov/gap) with accession number phs001451.v2.p1. TCR sequencing data are available in Supplementary Tables 7 and 8.
Extended Data
Extended Data Figure 1. Genomic and immunofluorescence analysis of pre-vaccination and recurrent tumors.
a. Evolution of tumor clones post-NeoVax treatment. Top panel. Sites of primary and relapse tumors in the five patients. Relapse tissue sites are different from the primary in all patients except Pt. 3. Middle panel. Change in cancer cell fraction (CCF) of tumor clones (depicted by different colors) between the pre- and post-vaccination time points (T0 and T1 respectively). Gene targets of the vaccine are indicated next to their corresponding clones. Bottom panel. Phylogenetic relationship between the different clones evolving from the main clonal population (common ancestor). Known cancer drivers are indicated next to their corresponding clones. b. The ARHGEF15, MECOM, and NLRC4 mutations originally targeted by neoantigen vaccination for Pt. 1 are not found in the recurrent tumor specimen, as visualized by the IGV22 c. Multiplex immunofluorescence staining for SOX10, CD8, FOXP3, PD-1, and PD-L1. In the left panel, changes in 1) the cell densities of CD8+ and FOXP3+ TILs, 2) the ratio of FOXP3+ to CD8+ TILs, 3) the percentages of CD8+ TILs and FOXP3+ TILs expressing PD-1, and 4) the PD-L1+expression of SOX10+ melanoma cells are portrayed between pre-vaccine versus recurrent tumor samples for 4 patients with available paired tumor specimens. Pts. 3 and 5 (red lines) had late recurrences, while patients 2 and 6 (black lines) had recurrence during vaccinations and 4 weeks after completion of vaccinations, respectively. Data were derived from 5 to 11 fields of view (median 7) per sample, displayed as mean +/− standard error, and compared using two-sided Wilcoxon rank sum tests. d. Representative multiplexed immunofluorescence micrographs (from among 5 to 11 fields of view per sample) from pre-vaccine versus recurrent tumor samples for the 4 patients with paired tumor specimens. Scale bar = 20 μm.
Extended Data Figure 2. Vaccination induces strong multi-functional CD4+ T cell responses in two additional patients with high-risk melanoma.
a. Exemplary schema of immunizing (IMP), assay (ASP), and epitope (EPT) peptides. Mutated amino acid is shaded. Each predicted epitope peptide is in colored text and its location is underlined below the IMP peptide. b. PBMCs collected pre- and post- vaccination were tested with individual peptides after one round of in vitro stimulation by IFN-γ ELISpot using week 16 post-vaccination PBMCs, tested in triplicate wells per peptide (error bars, s.e.m.). Only results from positive peptides are shown. c. Deconvolution of T cell reactivity against individual ASP after one round of in vitro stimulation by IFN-γ ELISpot using week 16 post-vaccination PBMCs, tested in triplicate wells per peptide (error bars, s.e.m.). *Responses were scored positive if spot-forming cells (SFC) were at least 2.5-fold over the DMSO control. d. Dual chromogenic immunohistochemical staining of FFPE tumor samples from Pts. 11 and 12 (see Methods for details) for HLA class I and HLA class II. Red: SOX10 (melanoma transcription factor); brown: HLA class I or class II. Representative images of 5 to 11 fields of view (median 7) are shown. e. Summary of immunohistochemical results of seven patients with available FFPE tissue. Semi-quantitative scoring was performed for the intensity of positive staining of melanoma cell membranes for class I or II (0, negative; 1, weak; 2, moderate; 3, strong) and for the percentage of positive staining malignant cells (0–100%). A cumulative H score was obtained by multiplying intensity score by the percentage of malignant cells with positive staining.
Extended Data Figure 3. Mapping of CD4+ and CD8+ T cell responses to individual ASP and EPT to the IMP for Pts. 11 and 12.
ASP covering the IMP are shown for the IMP that induced T cell responses in Pts. 11 and 12. T cells from week 16 PBMCs were tested. Red bold and shading: mutated amino acids, absent in IMP arising from neoORFs. (Supplementary Dataset 4). Blue font: peptides that generated a T cell response after one round of in vitro pre-stimulation with individual peptides.
Extended Data Figure 4. Neoantigen-specific CD4+ T cells are isolated at serial time points after vaccination using tetramer staining and harbor diverse TCR clonotypes.
a. IFN-γ secretion measured by ELISpot from neoantigen-specific T cells co-cultured with B cells nucleofected with minigenes (MG) encoding wildtype or mutant neoantigens chosen for tetramers, with and without anti-HLA DR antibodies (“block”), tested in duplicate wells/condition for Pt. 1 and triplicate wells/condition for all other Pts (error bars, s.e.m.) (figure from our previous publication1). b. Ex vivo HLA class II tetramer staining of Pts. 1, 3 and 5 CD4+ T cells at a series of time points (pre-vaccination, weeks 3-24) following vaccination. Flow plots were pre-gated on CD4+ T cells. c. Schema of representative single-cell TCR and single-cell RNA sequencing analysis of non-specific CD4+ T cells and neoantigen-reactive CD4+ T cells isolated from pre-vaccination PBMCs and post-vaccination PBMCs, respectively, of Pt. 3. d. All TCR clonotypes observed in tetramer-positive T cells generated from PBMCs of Pts. 3, 4 and 5 based on single-cell-targeted TCRαβ sequencing. +: antigen-reactive following mut-ADAMT27 peptide stimulation of selected TCR clonotypes engineered into allogeneic T cells, −: antigen-non reactive.
Extended Data Figure 5. Neoantigen-specific CD4+ T cells exhibit transcriptional changes through vaccination.
a. Quantification of tetramer-specific or non-tetramer-specific (pre-vaccination) CD4+ T cells isolated at each time point colored by patient. b. Quantification of tetramer-specific or non-tetramer specific (pre-vaccination) CD4+ T cells isolated at each time point colored by cluster. c. Additional selected feature plots of cluster marker genes. d. Quality control metrics for all clusters. e. i) Patient membership by cluster (left); ii) Cluster membership by patient (center); and iii) time point membership by cluster (right). f. Numbers of neoantigen-specific CD4+ T cells in each i) patient by cluster (left); ii) cluster by patient (center); and iii) time point by cluster (right). g. Heatmaps generated from single-cell transcriptome analysis of CD4+ neoantigen-specific and non-neoantigen specific T cells from Pts. 3 (n = 383), 4 (n = 469), and 5 (n = 370) showing selected immunologic genes.
Extended Data Figure 6. TCR reconstruction and expression in T cells for reactivity screening.
T cell receptors were selected upon TCR sequencing of tetramer positive CD4+ T cells sorted from 3 patients (Pt 2, 3, 6). These TCRs represented clonotypes that were observed in more than one cell (either as replicates at a single timepoint or at more than one timepoint) or as singletons (observed as a single replicate at a single timepoint). The full-length TCRA and TCRB chains were cloned into a lentiviral vector and expressed in donor T cells through lentiviral transduction (Methods). Transduced T cells were co-cultured with patient-derived B cell lines immortalized with EBV virus and pulsed with different doses of mutated or wild-type neoantigen peptides. TCR reactivity was measured through detection of CD137 surface expression on CD4+ TCR transduced lymphocytes by flow cytometry. The values in the graphs report the percentage of CD137 positive cells with subtraction of background, measured upon coculture of T cells with patient-derived B cells pulsed with DMSO (negative control). Bulk data is showing IFN-γ secretion by neoantigen-reactive T-cell lines against mutated and wild-type peptides at several doses (figure from previous publication)1, tested in triplicate wells/condition (error bars, s.e.m.).
Extended Data Figure 7. Summary of all CD4+ and CD8+ T cell responses against neoantigen IMPs across all patients.
For each patient, CD4+ responses are shown above and CD8+ responses below. Immunogenic responses are shown in table format and non-immunogenic epitopes are listed below. In each table, from left to right, are shown the following: (1) light blue: ex vivo immune response detected at week 16 of vaccination, (2) dark blue: in vitro immune response detected at week 16 of vaccination, (3) green: in vitro immune response detected after pembrolizumab (only applicable in Pts 2 and 6; otherwise not applicable (gray), (4) dark red: ex vivo immune response detected long-term, (5) orange: in vitro immune response detected long-term. Numbers are IMP numbers. White numbers indicate the number of ASP (CD4+) and EPT (CD8+) peptides stimulating immune responses. Yellow highlight indicates mutations not found in recurrent tumors (applicable in Pt. 1 only). Note: all ex vivo responses were also detectable in vitro; thus, the in vitro responses shown were not detectable ex vivo.
Extended Data Figure 8. Induction of polyfunctional neoantigen-specific CD4+ T cell responses after vaccination in Pts. 1 and 3.
a. ASP covering the IMP are shown for the IMP that induced ex vivo T cell responses in Pts. 1 and 3 at week 16. T cells from week 16 PBMCs were tested. Red bold and shading: mutated amino acids. Blue underline: for class II epitopes, predicted epitopes <10th percentile based on the Immune Epitope Database and Analysis Resource (IEDB)-recommended consensus approach combining NN-align, SMM-align, and CombLib if allele predictions are available, otherwise NetMHCIIpan38. Red font, peptides that generated an ex vivo CD4+ T cell response. These data were previously reported1. b. Frequencies of Pt. 3 CD4+ T cells from week 16 and 47 months that were secreting cytokines as measured by ICS after stimulation of PBMCs ex vivo with peptides in Panel a. c. Frequency of PD-1 expression among total, non-cytokine producing, and cytokine-producing CD4+ T cells for Pt. 3. d. Representative flow plot and frequencies of Pt. 1 CD4+ T cells from 55 months that were secreting cytokines as measured by ICS after stimulation of PBMCs ex vivo with peptides in Panel a. e. Frequency of PD-1 expression among total, non-cytokine producing, and cytokine-producing CD4+ T cells for Pt. 1. f. Pie charts depict PD-1 expression, T cell phenotypes, and secretion of individual cytokines among the cytokine-producing CD4+ T cells for Pt. 1. Markers were selected to evaluate cytokine secretion (IFN-γ, IL-2, and TNF-α), activation (PD-1), naïve (blue, CD27+/CD45RA+), effector (red [not visible], CD27−/CD45RA+), central memory (purple, CD27+/CD45RA−), and effector memory (orange, CD27−/CD45RA−) T cell phenotypes.
Extended Data Figure 9. Mapping of individual ASP and EPT directed CD4+ and CD8+ T cell responses to the non-vaccine IMP and TAAs, and tracking of unique TCR clonotypes identified through single-cell and bulk TCR sequencing during and after vaccination.
a. ASP and EPT covering the non-vaccine IMP that induced T cell responses. Blue font: peptides that generated a T cell response after one round of pre-stimulation with peptides. Red highlight: mutated amino acids. EPT covering the TAA are shown for the TAA that induced T cell responses. Blue underline: assay peptides with class II prediction rank of < 10th percentile by NetMHCIIpan38. Green underline: assay peptides with prediction rank of < 10th percentile by NeonMHC239. Orange underline: assay peptides with class II prediction rank of <10th percentile by both NetMHCIIpan and NeonMHC2. (Supplementary Datasets 11, 12). b. TCRαβ clonotypes for Pts. 2-6 originally identified through single-cell TCR sequencing that were identifiable at the long-term time points by bulk TCR sequencing are shown. Beige circles indicate time points of detection by single-cell TCR sequencing. Black circles indicate timepoints of detection by bulk TCR sequencing.
Extended Data Figure 10. Flow cytometry gating strategy for tetramer staining assays and multiparameter intracellular cytokine staining.
a. Representative flow cytometry gating strategy for tetramer staining assays. Gating scheme was used for assays shown in Figure 2a, Figure 4a and Extended Data Figure 4b. b. Representative flow cytometry gating strategy for multiparameter intracellular cytokine staining assay. PD-1 and CD27/CD45RA gating only shown for IFN-γ; similar gating was performed for TNF-α and IL-2. Gating scheme was used for ICS shown in Figure 5d and Extended Data Figure 8b-f.
Supplementary Material
Acknowledgements
The authors thank J. Russell, Michael Manos and Mariano Severgnini and the Center for Immuno-Oncology (CIO) staff, M. Copersino (Regulatory Affairs), B. Meyers, C. Harvey, and S. Bartel (Clinical Pharmacy), M. Bowden (Center for Molecular Oncologic Pathology), O. Sturtevant, H. Negre, SY Kim, and MA Kelley (Cell Manipulation Core Facility), the Pasquarello Tissue Bank (all at DFCI), T. Bowman (DFHCC Specialized Histopathology Core Laboratory), Maegan Harden, Niall Lennon, Stacey Gabriel, Sam Pollack (the Broad Institute’s Biological Samples, Genetic Analysis, and Genome Sequencing Platform), Jerome Ritz (DFCI), and Ignaty Leshchiner, Gad Getz (Broad Institute), for discussions.
This research was made possible by a generous gift from the Blavatnik Family Foundation, and was supported by grants from the National Institutes of Health (NIH/NCI (R21 CA216772-01A1 and NCI-SPORE-2P50CA101942-11A1 [to D.B.K]; NCI-U24CA224331 and NCI-R01CA155010 [to C.J.W]; NCI-R50 RCA211482A [to S.A.S.]); NCI-R50 CA251956 [to S.L]; NCI-R01 CA229261 [to P.A.O]; NCI P01 CA163222; NCI-R01 CA238039 [to K.W.W]; 5P30 CA006516 [to A.G.H., R.R., and D.N], and NCI-K12CA090354 [to J.B.I]); a Team Science Award from the Melanoma Research Alliance (to C.J.W and P.A.O); the Francis and Adele Kittredge Family Immuno-Oncology and Melanoma Research Fund (to P.A.O); the Faircloth Family Research Fund (to P.A.O); the Bender Family Research Fund, and the DFCI Center for Cancer Immunotherapy Research fellowship and 5 T32 CA 207021-3 (to Z.H. and A.M.L.); a Physician-Scientist Training Award from the Damon Runyon Cancer Research Foundation (to P.B.); an Amy Strelzer Manasevit Scholar Award from the Be The Match Foundation (to P.B.); an American Society of Hematology Fellow Scholar Award (to P.B); an NSF Graduate Research Fellowships Program fellowship (to R.H.); a Kay Kendall Leukaemia Fund Fellowship (to S.H.G.). L.R.O is funded by The Free Research Fund Denmark (8048-00078A). C.J.W. is a Scholar of the Leukemia and Lymphoma Society. We also want to acknowledge a gift from a donor to the Developing Innovative Immunological Therapies for Intractable Cancers Fund. This work was further supported in part by The G. Harold and Leila Y. Mathers Foundation, and the Bridge Project, a partnership between the Koch Institute for Integrative Cancer Research at MIT and the Dana-Farber/Harvard Cancer Center, the Howard Hughes Medical Institute Medical Research Fellows Program and the Novo Nordisk Foundation (Grant agreement NNF14CC0001).
Footnotes
Competing Financial Interests
Z.H. is a current employee of ElevateBio. J.S. is a current employee of Moderna Therapeutics. E.F.F is an equity holder and consultant for BioNTech, and equity holder and SAB member of BioEntre. N.H. and C.J.W. are equity holders of BioNTech. N.H. is a consultant for Related Sciences. P.A.O. has received research funding from and has advised Neon Therapeutics, Bristol-Meyers Squibb, Merck, CytomX, Pfizer, Novartis, Celldex, Amgen, Array, AstraZeneca/MedImmune, Armo BioSciences and Roche/Genentech. C.J.W. is subject to a conflict of interest management plan for the reported studies because of her former competing financial interests in Neon Therapeutics, which was acquired by BioNTech. Under this plan, C.J.W. may not access identifiable data for human subjects or otherwise participate directly in the Institutional Review Board-approved protocol reported herein. C.J.W.’s contributions to the overall strategy and data analyses occurred on a de-identified basis. Patent applications have been filed on aspects of the described work entitled as follows: ‘Compositions and methods for personalized neoplasia vaccines’ (N.H., E.F.F. and C.J.W.), ‘Methods for identifying tumour specific neo-antigens’ (N.H. and C.J.W.), ‘Formulations for neoplasia vaccines’ (E.F.F.) and ‘Combination therapy for neoantigen vaccine’ (N.H., C.J.W. and E.F.F.). The Dana-Farber Cancer Institute, the lead site of this trial, has a proprietary and financial interest in the personalized neoantigen vaccine. P.B. reports equity in Agenus, Amgen, Breakbio Corp., Johnson & Johnson, Exelixis, and BioNTech. S.J.R. receives research support from Merck, Bristol Myers Squibb, Affimed, and KITE/Gilead, and is on a scientific advisory board (SAB) for Immunitas Therapeutics. S.A.S. reported nonfinancial support from Bristol-Myers Squibb outside the submitted work. S.A.S. previously advised and has received consulting fees from Neon Therapeutics. S.A.S. reported nonfinancial support from Bristol-Myers Squibb, and equity in Agenus Inc., Agios Pharmaceuticals, Breakbio Corp., Bristol-Myers Squibb and Lumos Pharma, outside the submitted work. B.L.P is a founder of Resolute Bio and Amide Technologies; both companies develop protein and peptide therapeutics. E.I.B. consults for Apexigen, Novartis, Partner Therapeutics and receives clinical trial support from Eli Lilly, Novartis, BMS, Genentech and BVD. K.W.W. serves on the scientific advisory board of TCR2 Therapeutics, T-Scan Therapeutics, SQZ Biotech, Nextechinvest and receives sponsored research funding from Novartis. He is a co-founder of Immunitas, a biotech company. These activities are not related to the research reported in this publication. D.B.K. has previously advised Neon Therapeutics and has received consulting fees from Neon Therapeutics. DBK owns equity in Aduro Biotech, Agenus, Armata Pharmaceuticals, Breakbio, BioMarin Pharmaceutical, Bristol Myers Squibb, Celldex Therapeutics, Editas Medicine, Exelixis, Gilead Sciences, IMV, Lexicon Pharmaceuticals, Moderna, Regeneron Pharmaceuticals. BeiGene, a Chine biotech company, supports unrelated research at TIGL. The remaining authors declare no competing interests.
References
- 1.Ott PA, et al. An immunogenic personal neoantigen vaccine for patients with melanoma. Nature 547, 217–221 (2017). [DOI] [PMC free article] [PubMed] [Google Scholar]
- 2.Keskin DB, et al. Neoantigen vaccine generates intratumoral T cell responses in phase Ib glioblastoma trial. Nature (2018). [DOI] [PMC free article] [PubMed] [Google Scholar]
- 3.Carreno BM, et al. Cancer immunotherapy. A dendritic cell vaccine increases the breadth and diversity of melanoma neoantigen-specific T cells. Science 348, 803–808 (2015). [DOI] [PMC free article] [PubMed] [Google Scholar]
- 4.Sahin U, et al. Personalized RNA mutanome vaccines mobilize poly-specific therapeutic immunity against cancer. Nature 547, 222–226 (2017). [DOI] [PubMed] [Google Scholar]
- 5.Verma V, et al. PD-1 blockade in subprimed CD8 cells induces dysfunctional PD-1(+)CD38(hi) cells and anti-PD-1 resistance. Nat Immunol 20, 1231–1243 (2019). [DOI] [PMC free article] [PubMed] [Google Scholar]
- 6.Stuart T, et al. Comprehensive Integration of Single-Cell Data. Cell 177, 1888–1902 e1821 (2019). [DOI] [PMC free article] [PubMed] [Google Scholar]
- 7.Nussing S, et al. Divergent SATB1 expression across human life span and tissue compartments. Immunol Cell Biol 97, 498–511 (2019). [DOI] [PMC free article] [PubMed] [Google Scholar]
- 8.Willinger T, et al. Human naive CD8 T cells down-regulate expression of the WNT pathway transcription factors lymphoid enhancer binding factor 1 and transcription factor 7 (T cell factor-1) following antigen encounter in vitro and in vivo. J Immunol 176, 1439–1446 (2006). [DOI] [PubMed] [Google Scholar]
- 9.Spitzer MH, et al. Systemic Immunity Is Required for Effective Cancer Immunotherapy. Cell 168, 487–502 e415 (2017). [DOI] [PMC free article] [PubMed] [Google Scholar]
- 10.Haabeth OA, et al. Idiotype-specific CD4(+) T cells eradicate disseminated myeloma. Leukemia 30, 1216–1220 (2016). [DOI] [PubMed] [Google Scholar]
- 11.Hirschhorn-Cymerman D, et al. Induction of tumoricidal function in CD4+ T cells is associated with concomitant memory and terminally differentiated phenotype. J Exp Med 209, 2113–2126 (2012). [DOI] [PMC free article] [PubMed] [Google Scholar]
- 12.Oh DY, et al. Intratumoral CD4(+) T Cells Mediate Anti-tumor Cytotoxicity in Human Bladder Cancer. Cell 181, 1612–1625 e1613 (2020). [DOI] [PMC free article] [PubMed] [Google Scholar]
- 13.Gattinoni L, Speiser DE, Lichterfeld M & Bonini C T memory stem cells in health and disease. Nat Med 23, 18–27 (2017). [DOI] [PMC free article] [PubMed] [Google Scholar]
- 14.Deng Q, et al. Characteristics of anti-CD19 CAR T cell infusion products associated with efficacy and toxicity in patients with large B cell lymphomas. Nat Med (2020). [DOI] [PMC free article] [PubMed] [Google Scholar]
- 15.Pauken KE, et al. The PD-1 Pathway Regulates Development and Function of Memory CD8(+) T Cells following Respiratory Viral Infection. Cell Rep 31, 107827 (2020). [DOI] [PMC free article] [PubMed] [Google Scholar]
- 16.Ott PA, et al. A Phase Ib Trial of Personalized Neoantigen Therapy Plus Anti-PD-1 in Patients with Advanced Melanoma, Non-small Cell Lung Cancer, or Bladder Cancer. Cell 183, 347–362 e324 (2020). [DOI] [PubMed] [Google Scholar]
- 17.Corbiere V, et al. Antigen spreading contributes to MAGE vaccination-induced regression of melanoma metastases. Cancer Res 71, 1253–1262 (2011). [DOI] [PubMed] [Google Scholar]
- 18.Fisher S, et al. A scalable, fully automated process for construction of sequence-ready human exome targeted capture libraries. Genome Biol 12, R1 (2011). [DOI] [PMC free article] [PubMed] [Google Scholar]
- 19.Chapman MA, et al. Initial genome sequencing and analysis of multiple myeloma. Nature 471, 467–472 (2011). [DOI] [PMC free article] [PubMed] [Google Scholar]
- 20.Berger MF, et al. The genomic complexity of primary human prostate cancer. Nature 470, 214–220 (2011). [DOI] [PMC free article] [PubMed] [Google Scholar]
- 21.Cibulskis K, et al. ContEst: estimating cross-contamination of human samples in next-generation sequencing data. Bioinformatics 27, 2601–2602 (2011). [DOI] [PMC free article] [PubMed] [Google Scholar]
- 22.Robinson JT, et al. Integrative genomics viewer. Nat Biotechnol 29, 24–26 (2011). [DOI] [PMC free article] [PubMed] [Google Scholar]
- 23.McKenna A, et al. The Genome Analysis Toolkit: a MapReduce framework for analyzing next-generation DNA sequencing data. Genome Res 20, 1297–1303 (2010). [DOI] [PMC free article] [PubMed] [Google Scholar]
- 24.Carter SL, et al. Absolute quantification of somatic DNA alterations in human cancer. Nat Biotechnol 30, 413–421 (2012). [DOI] [PMC free article] [PubMed] [Google Scholar]
- 25.Dobin A, et al. STAR: ultrafast universal RNA-seq aligner. Bioinformatics 29, 15–21 (2013). [DOI] [PMC free article] [PubMed] [Google Scholar]
- 26.Li B & Dewey CN RSEM: accurate transcript quantification from RNA-Seq data with or without a reference genome. BMC Bioinformatics 12, 323 (2011). [DOI] [PMC free article] [PubMed] [Google Scholar]
- 27.DeLuca DS, et al. RNA-SeQC: RNA-seq metrics for quality control and process optimization. Bioinformatics 28, 1530–1532 (2012). [DOI] [PMC free article] [PubMed] [Google Scholar]
- 28.Roemer MG, et al. Classical Hodgkin Lymphoma with Reduced beta2M/MHC Class I Expression Is Associated with Inferior Outcome Independent of 9p24.1 Status. Cancer Immunol Res 4, 910–916 (2016). [DOI] [PMC free article] [PubMed] [Google Scholar]
- 29.Carey CD, et al. Topological analysis reveals a PD-L1-associated microenvironmental niche for Reed-Sternberg cells in Hodgkin lymphoma. Blood 130, 2420–2430 (2017). [DOI] [PMC free article] [PubMed] [Google Scholar]
- 30.Truex NL, et al. Automated Flow Synthesis of Tumor Neoantigen Peptides for Personalized Immunotherapy. Sci Rep 10, 723 (2020). [DOI] [PMC free article] [PubMed] [Google Scholar]
- 31.Cai A, et al. Mutated BCR-ABL generates immunogenic T-cell epitopes in CML patients. Clin Cancer Res 18, 5761–5772 (2012). [DOI] [PMC free article] [PubMed] [Google Scholar]
- 32.Borducchi EN, et al. Antibody and TLR7 agonist delay viral rebound in SHIV-infected monkeys. Nature 563, 360–364 (2018). [DOI] [PMC free article] [PubMed] [Google Scholar]
- 33.Call MJ, et al. In vivo enhancement of peptide display by MHC class II molecules with small molecule catalysts of peptide exchange. J Immunol 182, 6342–6352 (2009). [DOI] [PMC free article] [PubMed] [Google Scholar]
- 34.Jang MH, Seth NP & Wucherpfennig KW Ex vivo analysis of thymic CD4 T cells in nonobese diabetic mice with tetramers generated from I-A(g7)/class II-associated invariant chain peptide precursors. J Immunol 171, 4175–4186 (2003). [DOI] [PubMed] [Google Scholar]
- 35.Haga-Friedman A, Horovitz-Fried M & Cohen CJ Incorporation of transmembrane hydrophobic mutations in the TCR enhance its surface expression and T cell functional avidity. J Immunol 188, 5538–5546 (2012). [DOI] [PubMed] [Google Scholar]
- 36.Cohen CJ, et al. Enhanced antitumor activity of T cells engineered to express T-cell receptors with a second disulfide bond. Cancer Res 67, 3898–3903 (2007). [DOI] [PMC free article] [PubMed] [Google Scholar]
- 37.Hu Z, et al. A cloning and expression system to probe T-cell receptor specificity and assess functional avidity to neoantigens. Blood 132, 1911–1921 (2018). [DOI] [PMC free article] [PubMed] [Google Scholar]
- 38.Picelli S, et al. Full-length RNA-seq from single cells using Smart-seq2. Nat Protoc 9, 171–181 (2014). [DOI] [PubMed] [Google Scholar]
- 39.Dodt M, Roehr JT, Ahmed R & Dieterich C FLEXBAR-Flexible Barcode and Adapter Processing for Next-Generation Sequencing Platforms. Biology (Basel) 1, 895–905 (2012). [DOI] [PMC free article] [PubMed] [Google Scholar]
- 40.Liao Y, Wang J, Jaehnig EJ, Shi Z & Zhang B WebGestalt 2019: gene set analysis toolkit with revamped UIs and APIs. Nucleic Acids Res 47, W199–W205 (2019). [DOI] [PMC free article] [PubMed] [Google Scholar]
- 41.Li S, et al. RNase H-dependent PCR-enabled T-cell receptor sequencing for highly specific and efficient targeted sequencing of T-cell receptor mRNA for single-cell and repertoire analysis. Nat Protoc 14, 2571–2594 (2019). [DOI] [PMC free article] [PubMed] [Google Scholar]
- 42.Hoof I, et al. NetMHCpan, a method for MHC class I binding prediction beyond humans. Immunogenetics 61, 1–13 (2009). [DOI] [PMC free article] [PubMed] [Google Scholar]
- 43.Lundegaard C, Lund O & Nielsen M Prediction of epitopes using neural network based methods. J Immunol Methods 374, 26–34 (2011). [DOI] [PMC free article] [PubMed] [Google Scholar]
- 44.Abelin JG, et al. Defining HLA-II Ligand Processing and Binding Rules with Mass Spectrometry Enhances Cancer Epitope Prediction. Immunity 51, 766–779 e717 (2019). [DOI] [PubMed] [Google Scholar]
- 45.Jurtz V, et al. NetMHCpan-4.0: Improved Peptide-MHC Class I Interaction Predictions Integrating Eluted Ligand and Peptide Binding Affinity Data. J Immunol 199, 3360–3368 (2017). [DOI] [PMC free article] [PubMed] [Google Scholar]
Associated Data
This section collects any data citations, data availability statements, or supplementary materials included in this article.
Supplementary Materials
Data Availability Statement
All requests for raw and analyzed data and materials will be promptly reviewed by the Belfer Office for Dana-Farber Innovations to verify if the request is subject to any intellectual property or confidentiality obligations. Patient-related data not included in the paper were generated as part of clinical trials and may be subject to patient confidentiality. Any data and materials that can be shared will be released via a Material Transfer Agreement. DNA and RNA sequencing data are available through dbGaP (https://www.ncbi.nlm.nih.gov/gap) with accession number phs001451.v2.p1. TCR sequencing data are available in Supplementary Tables 7 and 8.


