

Abstract
Skeletogenesis in the sea urchin embryo gives rise to a pair of intricate endoskeletal spicules. Deposition of these skeletal elements in the early larva is the outcome of a morphogenetic program that begins with maternal inputs in the early zygote and results in the specification of the large micromere-primary mesenchyme cell (PMC) lineage. PMCs are of considerable interest as a model system, not only to dissect the mechanism of specific developmental processes, but also to investigate their evolution and the unrivaled level of control over the formation of a graded, mechanically robust, yet single crystalline biomineral. The ability to study gene regulatory circuits, cellular behavior, signaling pathways, and molecular players involved in biomineralization is significantly boosted by the high level of autonomy of PMCs. In fact, in the presence of horse serum, micromeres differentiate into PMCs and produce spicules in vitro, separated from the embryonic milieu. PMC culture eliminates indirect effects that can complicate the interpretation of experiments in vivo, offers superior spatiotemporal control, enables PMC-specific readouts, and is compatible with most imaging and characterization techniques. In this chapter, we provide an updated protocol, based on the pioneering work by Okazaki and Wilt, for the isolation of micromeres and subsequent culture of PMCs, as well as protocols for fixation and staining for fluorescent microscopy, preparation of cell cultures for electron microscopy, and the isolation of RNA.
1. INTRODUCTION
Skeletogenesis in the sea urchin embryo is an important model system for the emergence of anatomy through morphogenetic processes (Ettensohn, 2013; Shashikant, Khor, & Ettensohn, 2018), and as a system to investigate the evolution of echinoderm development (Erkenbrack & Davidson, 2015; Ettensohn, 2009; Gao & Davidson, 2008; Sharma & Ettensohn, 2010). The lineage of the PMCs that secrete the spicules in euechinoids is clearly defined. Genomic regulation of cell specification is understood in terms of a highly detailed gene regulatory network (GRN) and many downstream effector genes have been identified (Ettensohn, 2009; Oliveri, Tu, & Davidson, 2008; Rafiq, Cheers, & Ettensohn, 2011). Parallel to specification, PMCs undergo a stereotypical sequence of morphogenetic events (Fig. 1). Briefly, key steps are an epithelial-mesenchymal transition (EMT), patterning, and cell-cell fusion that results in a syncytium. In the late gastrula stage, PMC syncytia begin secreting the endoskeleton.
FIG. 1.
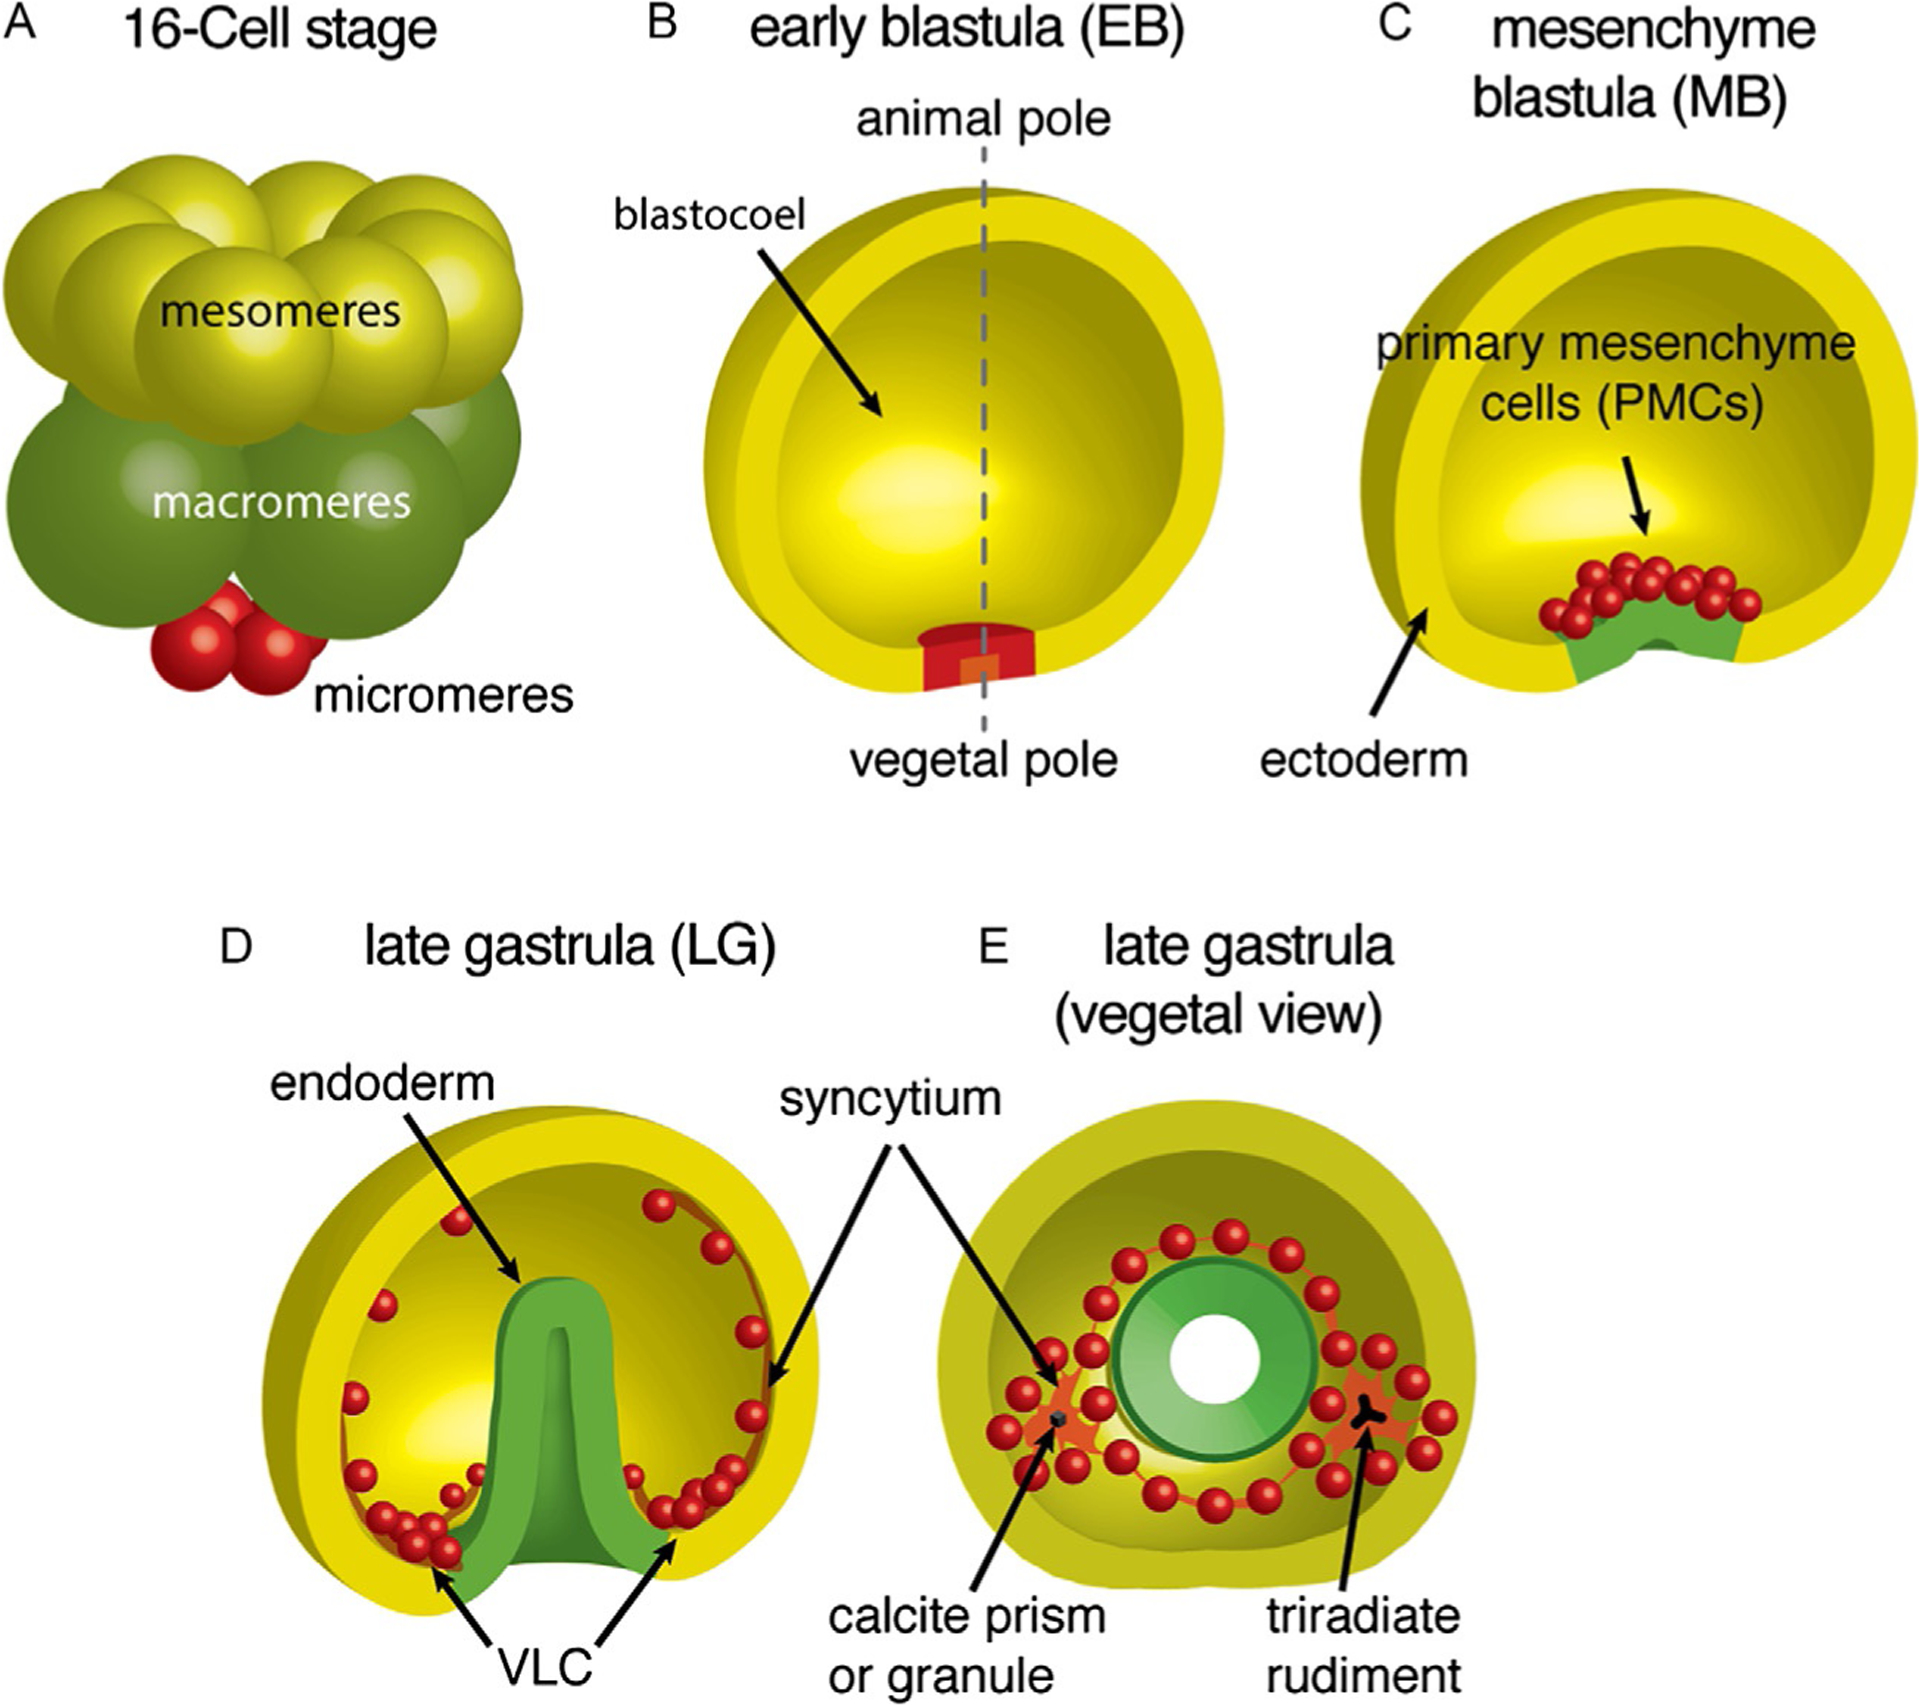
Morphogenetic behavior of the micromere-PMC lineage during early sea urchin embryo development (Schoenwolf, 2001). (A) Micromeres (red) are formed in the fourth, unequal cleavage. (B) Subsequent divisions result in 32 PMCs at the vegetal pole of the hollow blastula. (C) PMCs then ingress into the mesenchyme blastula (MB) in an epithelial-mesenchymal transition. (D and E) PMCs show directional migration, forming two ventrolateral clusters (VLCs) and a stereotypical pattern of strands in the late gastrula (LG). Cell-cell fusion leads to the formation of two syncytial masses. Synthesis of the endoskeleton inside each syncytium commences with the formation of a calcareous granule that grows into the triradiate spicule rudiments.
Skeletogenesis in the sea urchin embryo is a prime example of the unrivaled level of control organisms have attained over the precipitation of minerals. Specifically, the two mirror-symmetric endoskeletal spicules in the sea urchin embryo are single crystals of magnesium calcite (approximately Ca0.95Mg0.05CO3), yet have smoothly curving, rather than faceted surfaces (Berman et al., 1990; Lippmann, 1973). Their three-dimensional branching structure is precisely aligned with crystallographic lattice directions (Fig. 2) yet is thought to be created via transient amorphous precursors (Addadi, Raz, & Weiner, 2003; Politi et al., 2008; Tester et al., 2013). The spicule mineral occludes >200 proteins (Poustka, Wilt, & Mann, 2010), some of which are thought to be intimately involved in controlling phase transformations (Killian & Wilt, 2008; Wilt, 2005). The resulting composite, despite its rather low organic content (0.1 wt%), is considerably tougher than pure inorganic calcite (Emlet, 1982). The spicule grows in a bilayer-membrane delimited space that contains very little, if any, bulk water (Beniash, Addadi, & Weiner, 1999). This suggests that spicule growth occurs by adding packages of amorphous mineral; support for this hypothesis comes from recent cryo-SEM data (Killian & Wilt, 2017; Vidavsky et al., 2014, 2016; Vidavsky, Masic, Schertel, Weiner, & Addadi, 2015). However, many aspects of the spicule growth machinery remain poorly understood.
FIG. 2.
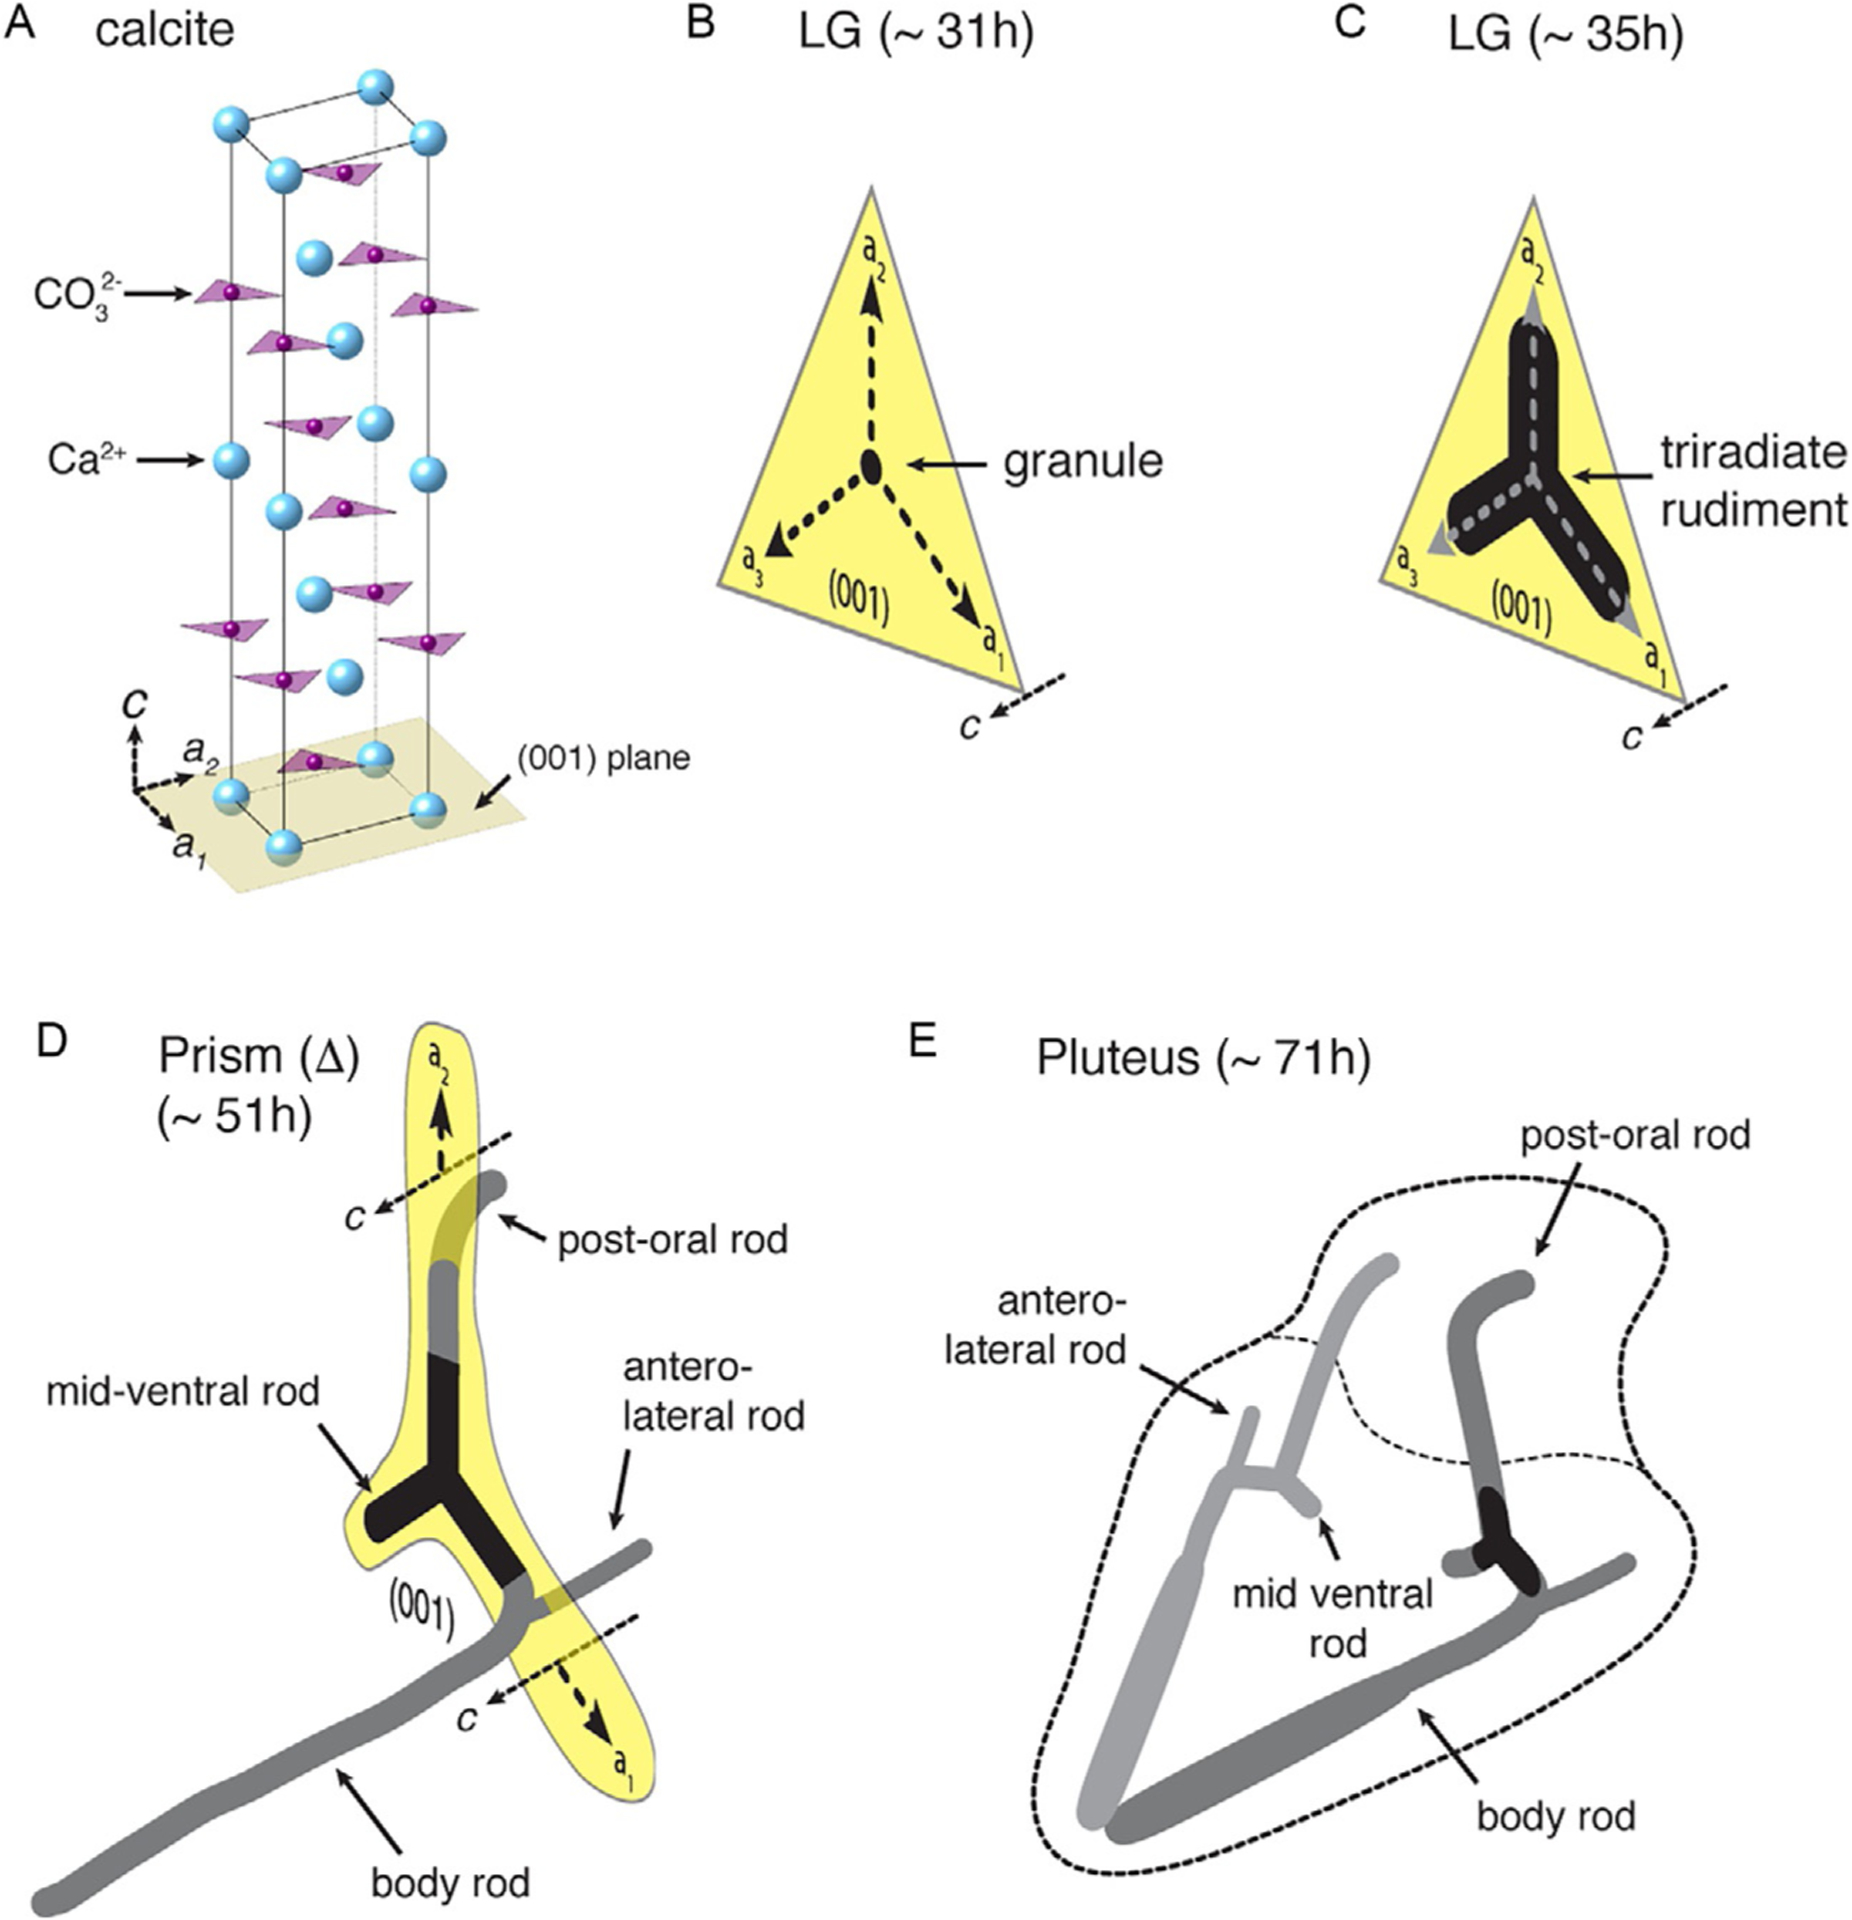
(A) Rendering of the crystal structure of calcite (CaCO3), the biomineral that constitutes >99% of the mass of sea urchin embryo spicules. In the c-axis direction, calcium and carbonate ions are arranged in alternating planes. During the development of S. purpuratus, a roughly spherical granule is deposited in the late gastrula (LG) stage, around 31 hpf (B). Over the next 4h, the granule grows along the crystallographic a-directions into the triradiate rudiment (C). By the prism stage (~51 hpf), one of the triradiate arms has branched and changed growth direction to the c-axis, and another has continued growth in the a-axis direction for longer and is only now in the process of changing direction (D). Further growth in the linear and radial directions result in the pluteus skeleton (E).
What makes the sea urchin system truly unique, however, is that the micromere-PMC lineage is largely autonomous in the construction of the skeleton (Armstrong & McClay, 1994). While extrinsic factors do not have a significant influence on the early skeletogenic gene regulatory network (Harkey & Whiteley, 1983; Page & Benson, 1992; Stephens, Kitajima, & Wilt, 1989), local, ectoderm-derived factors play an integral part in patterning and spicule growth (Armstrong, Hardin, & McClay, 1993; Duloquin, Lhomond, & Gache, 2007; Ettensohn, 1990; Ettensohn, Guss, Hodor, & Malinda, 1997; Kiyomoto & Tsukahara, 1991; Röttinger et al., 2008). Several such factors, including VEGF, FGF, and Univin, have been identified (Duloquin et al., 2007; Piacentino, Ramachandran, & Bradham, 2015; Röttinger et al., 2008). In addition, a role for thyroid hormone and integrin signaling is emerging (Taylor & Heyland, 2018). An important consequence of this high level of autonomy is that PMCs can be grown in vitro, outside their biological niche, and that they retain the capability to synthesize spicules in culture (Kitajima & Okazaki, 1980; Okazaki, 1975). In fact, cell behavior, including micromere division, differentiation into PMCs, migration, fusion to form the syncytium, deposition of the granule, and subsequent spicule growth all occur at the same time as the same events in the whole embryo (Okazaki, 1975). This autonomy is a highly desirable, though exceedingly rare, feature for biomineralizing tissues and has enabled bio-engineering single crystal growth (Fig. 3) (Wu, Park, & Joester, 2011). In vitro culture of PMCs is furthermore poised to help dissect signaling pathways, the role of effector genes, and the molecular mechanisms of skeletogenesis.
FIG. 3.
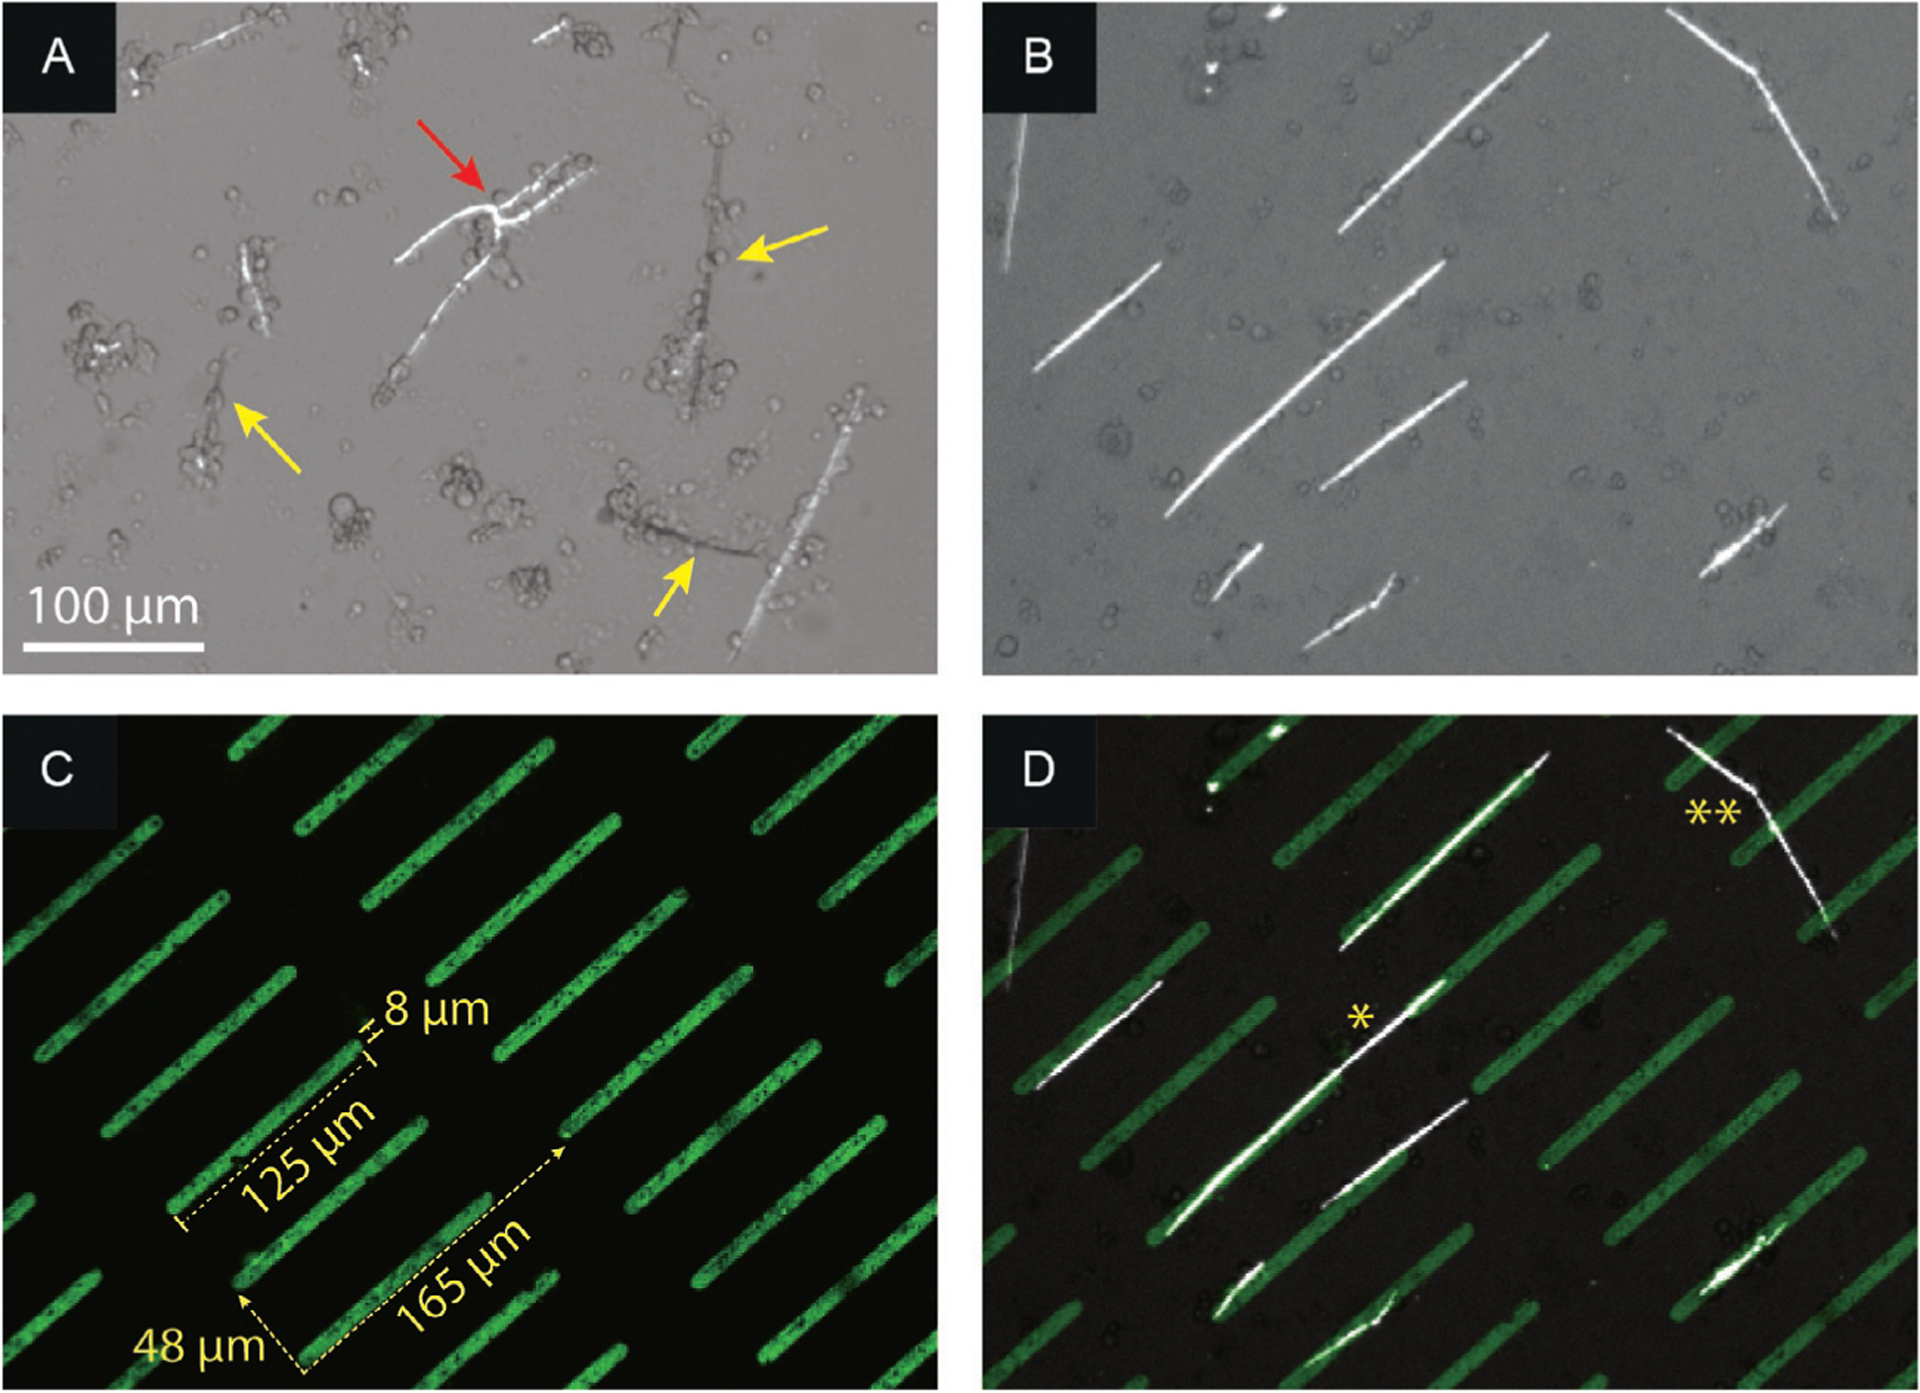
Spicules formed by S. purpuratus PMCs on (A) a nonpatterned surface and (B–D) Concanavalin A (ConA) linear array patterns. Under crossed polarizers, entire spicules brighten/extinguish (yellow arrow) as a whole, i.e., are single crystals; branching is occasionally observed (red arrow). (B) Polarized light microscope image showing parallel spicules on ConA pattern. (C) Fluorescent image of fluorescein-labeled ConA pattern (green) on FBS background. (D) Overlay of (B) and (C), showing the spicule-pattern alignment. Bridging can occur along (*) or at an angle (**) to the pattern direction, indicating that cells are able to communicate and/or migrate across the nonstick part of the pattern.
Reprinted with permission from Wu, C.-H., Park, A., & Joester, D. (2011). Bioengineering single crystal growth. Journal of the American Chemical Society, 133, 1658–1661.
It can be fundamentally challenging to separate, in the embryo, the impact of signaling on cell differentiation from the effect on cellular behavior such as motility, directed migration, and skeletal patterning (Adomako-Ankomah & Ettensohn, 2013). Inhibition of signaling may have indirect effects, such as gene expression and differentiation that is the consequence of perturbed cellular motility, and vice versa. Experiments using PMCs in vitro offer the advantage of eliminating such indirect effects. In addition, it is much more straightforward to control concentrations of signaling factors, inhibitors, and extracellular matrix components, and study the impact of spatial or temporal gradients of these factors.
For example, Karp and Solursh (1985) documented the effect of cytoskeletal inhibitors on PMC filopodia, and the migration of PMCs toward extracellular matrix obtained from mesenchyme blastulae. More recently, Sepúlveda-Ramírez, Toledo-Jacobo, Henson, and Shuster (2018) used inhibitors to take a closer look at the role of actin in filopodia number and length. Hwang and Lennarz (1993) employed Ca2+ channel blockers to study ion trafficking in PMC cultures. Knapp, Wu, Mobilia, and Joester (2012) discovered that VEGF has a dramatic concentration-dependent effect on the shape of spicules deposited by PMCs in vitro. Triradiates (i.e., branching spicules that closely resemble those initially deposited in the embryo) require a threshold concentration of VEGF. Below this concentration, markedly different spicule shapes are formed. Remarkably, the change in shape is accompanied by a change in the crystallographic growth direction of the spicule (Fig. 4).
FIG. 4.
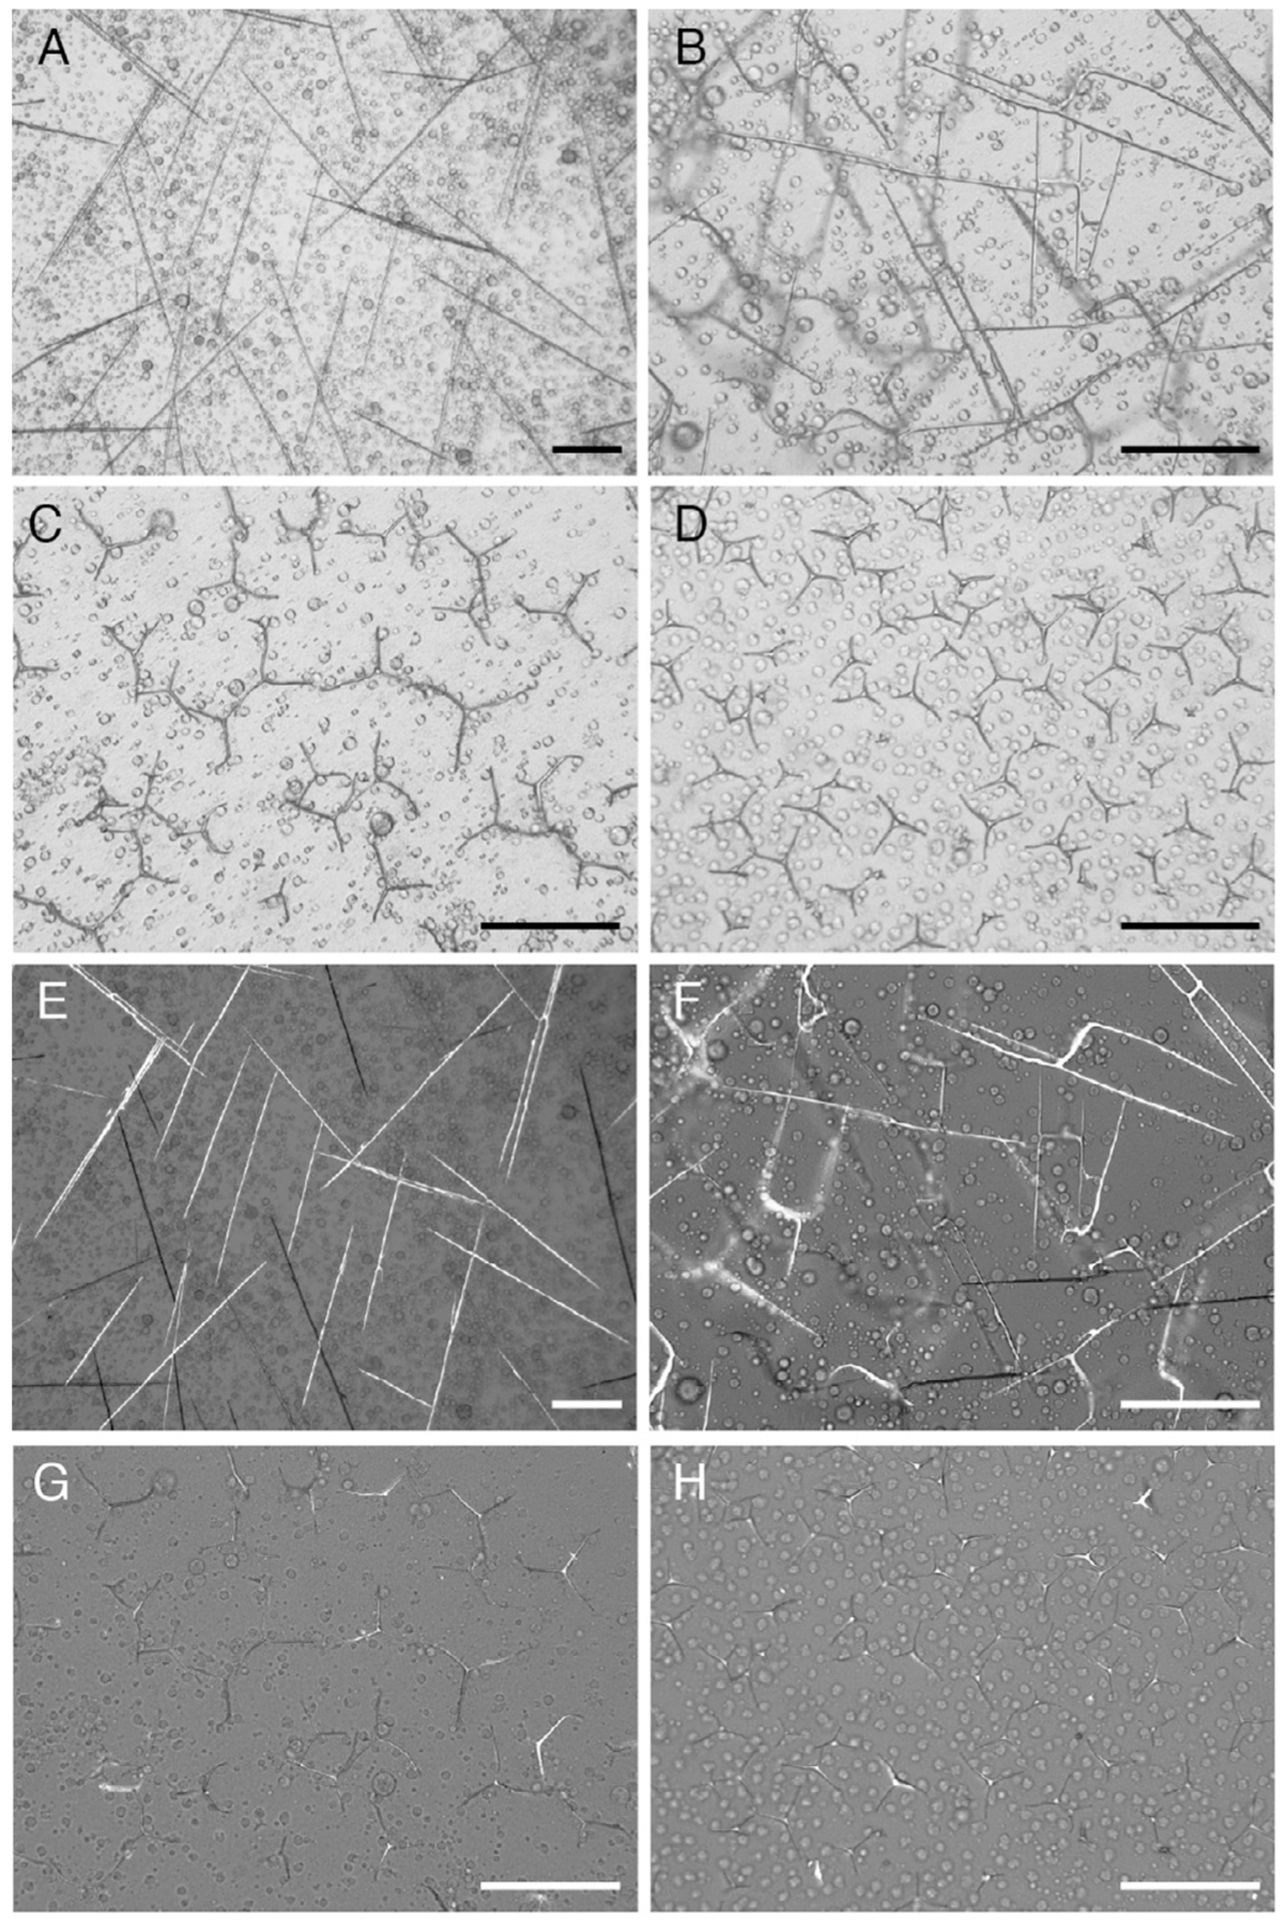
Dose-dependent effect of rVEGF on spicule morphology (Knapp et al., 2012; Wu, 2013). (A–H) S. purpuratus PMCs treated with increasing concentrations of recombinant VEGF (in ASW containing 4% FBS) show characteristic spicule shapes at 96 hpf in bright field (A), DIC (B–D), and corresponding polarized light microscopy images (E–H): linear rods (A, E: 5 μg mL−1); “h” and “H” shapes (B, F: 15 μg mL−1); large triradiates (C, G: 30 μg mL−1) and small triradiates (D, H: 120 μg mL−1). Note that concentration refers to total protein in raw lysates (BCA) of bacteria expressing rVEGF. Scale bar 100 μm.
In many cases, signaling will use canonical pathways and therefore involve genes products that are not PMC-specific. The ability to selectively read out the cellular response of in vitro-grown PMCs with high sensitivity, by transcriptomic, proteomic, or metabolomic approaches is therefore a powerful addition to conventional analysis of cellular behavior and spatiotemporal expression in the embryo. By definition, however, in vitro experiments are only ever approximations to the physiological situation and require in vivo work to validate proposed mechanisms.
2. ISOLATION AND CULTURE OF MICROMERES
2.1. HISTORICAL PERSPECTIVE AND ALTERNATIVES
Large scale isolation and culture of micromeres and their differentiation into mineralizing PMCs was first reported by Kayo Okazaki in a series of seminal papers (Kitajima & Okazaki, 1980; Okazaki, 1975). The original protocol was adapted to a number of North American species, further refined, and taught to many researchers by Fred Wilt (Benson, Smith, Wilt, & Shaw, 1990; Wilt & Benson, 2004; Wilt, Hamilton, Benson, & Kitajima, 2000). Alternatively, differentiated PMCs can be isolated by dissociation of embryos at later stages of development (Ettensohn & McClay, 1987. Rather than taking advantage of the difference in cell size at the 16-cell stage that is integral to the Okazaki-Wilt protocol, this approach uses the selective adhesion of PMCs to substrates coated with wheat germ agglutinin (WGA). In our hands, spiculogenesis is more robust in PMCs generated by the micromere route, presumably because the dissociation of 16-cell stage embryos can be performed under much more gentle conditions (Table 1) (Wilt & Benson, 2004).
Table 1.
Sea urchin species amenable to in vitro PMC culture.
| Hemicentrotus pulcherrimus | Kitajima and Okazaki (1980); Okazaki (1975); Wilt and Benson (2004) |
| Pseudocentrotus depressus | Okazaki (1975); Wilt and Benson (2004) |
| Anthocidaris crassispina | Ingersoll et al. (2003); Okazaki (1975) |
| Strongylocentrotus purpuratus | Wilt and Benson (2004) |
| Strongylocentrotus franciscanus | Wilt and Benson (2004) |
| Strongylocentrotus intermedius | Kipryushina and Odintsova (2011); Odintsova, Ageenko, Kipryushina, Maiorova, and Boroda (2015) |
| Strongylocentrotus nudus | Kipryushina and Odintsova (2011) |
| Arbacia punctulata | Wilt and Benson (2004) |
| Paracentrotus lividus | Wilt and Benson (2004) |
More recently, it has been shown that fluorescence-activated cell sorting (FACS) can be used to isolate PMCs from dissociated embryos that express a cell type-specific reporter transgene (Barsi, Tu, & Davidson, 2014). This, however, required heroic effort, as a low total average yield of 1.5% (~5800 cells) required injecting 12,000 embryos per replicate. It is not known whether PMCs so isolated will produce spicules in vitro. Micromeres and PMCs can further be isolated in small numbers by micromanipulation, as shown by Ettensohn, McClay, and others (Armstrong & McClay, 1994; Ettensohn & McClay, 1986; Miller, Fraser, & McClay, 1995). While this approach is most often used to transplant PMCs from one embryo to another, it has recently been demonstrated that fusion and migration of explanted PMCs can be studied in vitro (Adomako-Ankomah & Ettensohn, 2013). Obviously, the number of cells that can be explanted in this fashion is limited. Finally, opening the double repressor gate that controls PMC specification, by injection of pmar1 mRNA or hesC morpholino antisense oligonucleotide into the fertilized egg, results in production of several thousand PMCs per embryo (Oliveri, Davidson, & McClay, 2003; Revilla-I-Domingo, Oliveri, & Davidson, 2007). Spiculogenesis can, at least to some degree, be induced in P. lividus PMCs generated by this route by co-injection of vegf3 mRNA (Duloquin et al., 2007). While this approach could be very useful in that it allows genetic manipulation or the introduction of reporter genes, it has not been explored as a means to generate PMCs for further experiments.
2.2. OVERVIEW AND GENERAL REMARKS
Where larger numbers of cells are required, the Okazaki-Wilt protocol remains the most reliable access to PMCs in vitro. We present this protocol herein with some modifications that have worked well for us with S. purpuratus. Key steps of this protocol are the dissociation of 16-cell stage embryos and separation of micromeres from larger cells by sedimentation on a sucrose gradient. Note that all steps are carried out at 15°C in a climate-controlled room, and that developmental times reported here are thus based on this temperature.
This protocol requires at least 6–8 mL of eggs (packed, before fertilization). Depending on the quality of animals and time of the breeding season, intracoelomic injection of 2–3 females may not provide a sufficient volume; we typically obtain ~1 mL of eggs per female when we inject KCl. Therefore, we surgically remove the Aristotle’s lantern and squirt KCl directly into the body cavity to induce spawning, which can result in as much as 15 mL of eggs per female. This procedure sacrifices approximately 5 animals per micromere isolation experiment (2–3 females and 1–2 males to ensure genetic diversity), thus the need for a continuous supply of animals must be considered.
In our protocol, we specify the volume of artificial seawater (ASW) used to culture the embryos, as well as the initial volume of fertilized eggs. These volumes are convenient to work with and the protocol will generate a number of micromeres (approximately 300,000 micromeres per mL of eggs) that facilitates their isolation. Volumes can be adjusted, but we recommend maintaining the same ratio of ASW to eggs because adjusting the embryo density can alter development times.
It is absolutely imperative that the preparation of sucrose gradients is completed prior to dissociation of the embryos. Each gradient takes 30–45 min to pour. It is recommended to set up the gradient mixer and peristaltic pump to begin making the first gradient at least an hour before fertilization. Subsequent gradients can be set up between development points or while waiting for the embryos to sediment. Gradients are stable for several hours at 15°C, and much longer when stored on ice (approximately 4°C). We observe superior band separation when gradients are stored and used on ice.
Note that in order to induce spiculogenesis, the growth media have to be supplemented with horse serum (HS), ideally starting around 24hpf (Page & Benson, 1992). Not all horse sera are equally effective, and sera from other vertebrates often-times do not induce spiculogenesis. It is not known what factor(s) in horse serum is required. In the presence of recombinant Lp-Vegf3 (rVEGF), we have observed spiculogenesis in cultures of S. purpuratus PMCs treated with fetal bovine serum (Knapp et al., 2012). However, we find cultures are generally more robust when using HS, or HS+rVEGF rather than FBS. Matrigel has been reported as an alternative to HS (Benson & Chuppa, 1990), but we have had inconsistent success using it; it is also rather expensive.
In terms of culture substrates, cell culture plastic works very well. The elastomer PDMS, used frequently in microfluidic systems, is well tolerated (Wu et al., 2011). Glass substrates preferable for high resolution, polarized, or fluorescent light microscopy can be problematic. An acid wash, described below, is frequently required. Adhesion and migration of PMCs on glass substrates can be improved by coating with fibronectin (Adomako-Ankomah & Ettensohn, 2013; Karp & Solursh, 1985; Malinda, Fisher, & Ettensohn, 1995). Microcontact printing of WGA on glass substrates has been used successfully to pattern PMCs in vitro (Fig. 3 (Wu et al., 2011)).
Finally, a few words on contamination and purity. Contamination with bacteria, primarily from the gastrointestinal microbiota, is inevitable, but can usually be managed by sterile filtering of solutions and use of antibiotics. We occasionally see media turn cloudy, with growth of filamentous microorganisms, most likely fungi. We suspect contaminated serum may be a source. Given that this does not happen very often, and in view of possible side effects, we do not use antifungal agents. While not required, it is a good idea to set aside some embryos for a control culture. Monitoring developmental progress and timing in vivo is a good way to identify issues that arise from poor quality of embryos rather than from improper technique or bacterial/fungal contamination. In terms of cell purity, Wilt estimated that preparations contain 5–15% non-PMC cells from the sea urchin embryo. Based on a preliminary analysis of RNA-seq data and comparison of absolute expression levels (Fig. 5), we estimate that with the protocol presented herein, the fraction of non-PMC cells is likely below 1%.
FIG. 5.
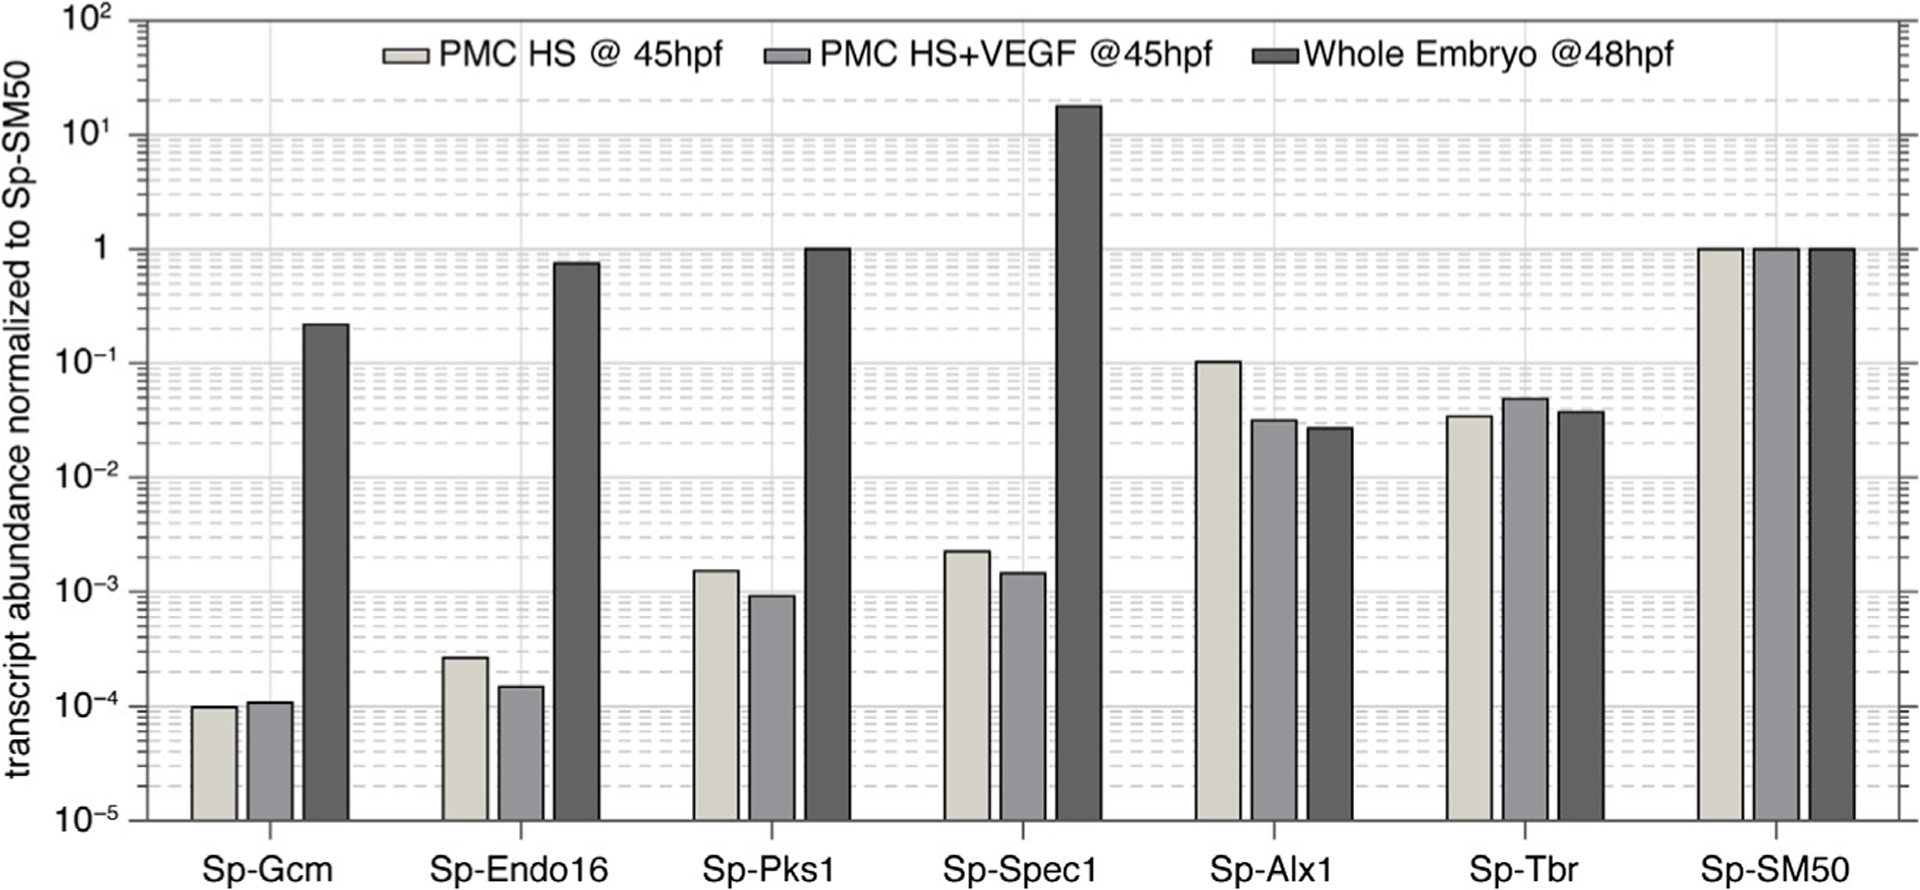
Comparison of the abundance of selected transcripts in PMCs in vitro (unpublished data) and in whole sea urchin embryos (Tu, Cameron, Worley, Gibbs, & Davidson, 2012). Markers for endoderm (Sp-Endo16), mesoderm (Sp-Gcm), aboral ectoderm (Sp-Spec1), and pigment cells (Sp-Pks1) are depleted by at least 3 orders of magnitude in vitro, while PMC markers (Sp-Alx1, Sp-Tbr, Sp-SM50) are present at comparable abundance. Note that abundance (in FPKM) was normalized to that of Sp-SM50.
2.3. MATERIALS
2.3.1. Chemicals
Unless otherwise noted, all reagents are stored at room temperature (22°C). Ethanol (200 proof, Decon Laboratories Inc., King of Prussia, PA); concentrated bleach (8.25% NaClO, The Clorox Company, Oakland, CA); NaCl (≥99.5%), MgSO4 (anhydrous, ≥99.5%), CaCl2·2H2O (≥99%), Na2SO4 (anhydrous, ≥99%), p-aminobenzoic acid (PABA, ≥99%, store at 4°C), sucrose (≥99.5%), gentamicin sulfate (≥590 μg/mg, store at 4°C), penicillin+streptomycin 100× stock solution (10,000 U/mL penicillin, 10,000 μg/mL streptomycin in 0.85% NaCl, 0.1 μm sterile filtered, store at −20°°C, Sigma-Aldrich, St. Louis, MO); MgCl2·6H2O (≥99%), KCl, (≥99%, Avantor, Radnor, PA); NaOH (≥99.1% Thermo Fisher Scientific, Waltham, MA); horse serum (sterile, heat inactivated, store at −20°C, Gibco (Cat #26050)/Thermo Fisher Scientific (Cat #26050088), Waltham, MA).
2.3.2. Solutions and buffers
Unless otherwise noted, all aqueous solutions are prepared with ultra-pure water (UPW, ρ = 18.2 MΩcm) dispensed by a Barnstead NanoDiamond UF+UV purification unit, sterile filtered using filter with 200 nm pore diameter, and stored at 15°C. As a rule, solutions are never autoclaved as autoclaved seawater is toxic to sea urchin embryos.
-
70% (v/v) ethanol
Used to sanitize the laboratory area and clean glassware.
-
KCl (0.50 M, 37.23 g/L)
Store in a 300-mL polypropylene squeeze/wash bottle for convenient use throughout the season.
Tris buffer (1 M, 121.14 g/L, titrated with 1.0 M NaOH to pH 8)
-
Artificial seawater (ASW) (Table 2)
Prepare at least 3 L, no earlier than 2–3 days before use. Typically, the pH will be near 7.6. If necessary for the experiment, add 1 part of Tris buffer (pH 8) to 100 parts of ASW. This should bring the pH to ~8. Store in a 4-L low density polyethylene (LDPE) carboy. Sterile filter and store in glass bottles (1-L or 3-L are convenient sizes) the day before use.
-
Calcium free seawater (CFSW) (Table 3)
Prepare at least 3.5 L 2–3 days before use and stored in a 4-L LDPE carboy. Sterile filter and store in glass bottles (1-L or 3-L are convenient sizes) the day before use.
-
Calcium-magnesium free seawater (CMFSW) (Table 4)
Prepare 3 L before use. Sterile filter and store in glass bottles for use throughout the season.
NaOH (1 M, 40 g/L)
-
PABA stock solution (250 mM, 34.29 g/L)
PABA is insoluble at neutral pH. Suspend PABA powder in water and adjust pH to 8.0 by addition of 1.0 M NaOH, while stirring. PABA should be completely dissolved. Store in a glass bottle covered in aluminum foil in a dark cabinet. Can be used for several months, but do not use across multiple seasons.
-
Sucrose stock solution (0.75 M, 256.73 g/L)
Prepare 350–400 mL the day before use.
-
Gentamicin sulfate stock solution (1 mg/mL)
Store at 4°C for same day use. Alternatively, aliquot and freeze at −20°C for later use.
-
Penicillin streptomycin stock solution
Thaw out 100× stock solution and divide into 10–20 mL aliquots. Store at −20°C.
-
“Heavy” sucrose solution
Dilute 300 mL (1 part) sucrose stock solution in 900 mL (3 parts) CFSW. Add 12 mL (1% (v/v)) of gentamicin sulfate stock solution. Prepare the day before use. 1200 mL is sufficient for at least six gradients.
-
“Light” sucrose solution
Dilute 30 mL (1 part) sucrose stock solution in 570 mL (19 parts) CFSW. Add 6 mL (1% (v/v)) of gentamicin sulfate stock solution. Prepare the day before use. 600 mL is sufficient for at least six gradients.
-
Horse serum (in our hands, horse serum purchased from Gibco (Cat #26050) works best)
Place original container in water bath at 55°C and incubate for 30 min. Put on ice. Once cooled, dialyze (12,000–14,000 Da molecular weight cutoff dialysis tubing, used according to manufacturer’s instructions) against 20 volumes of ASW at 15°C. Exchange ASW twice over 24 h. Aliquot (5 mL) and store at −20°C.
Table 2.
Reagents and concentrations to make ASW.
| Concentration | ||
|---|---|---|
| Compound | (mM) | (g/L) |
| NaCl | 480 | 28.32 |
| KCl | 10 | 0.77 |
| MgSO4 | 30 | 3.61 |
| MgCl2·6H2O | 27 | 5.48 |
| CaCl2·2H2O | 10 | 1.47 |
Table 3.
Reagents and concentrations to make CFSW.
| Concentration | ||
|---|---|---|
| Compound | (mM) | (g/L) |
| NaCl | 480 | 28.32 |
| KCl | 10 | 0.77 |
| MgSO4 | 30 | 3.61 |
| MgCl2·6H2O | 27 | 5.48 |
Table 4.
Reagents and concentrations to make CMFSW.
| Concentration | ||
|---|---|---|
| Compound | (mM) | (g/L) |
| NaCl | 480 | 28.32 |
| KCl | 10 | 0.77 |
| Na2SO4 | 60 | 8.52 |
2.3.3. Equipment
Disposables: sterile 50- and 200-mL Falcon tubes, sterile 0.2 μm 1-L poly(ether sulfone) filter units, polystyrene weighing boats, Corning 35 × 10 mm tissue culture dishes, 1-mL rubber pipette bulbs (Thermo Fisher Scientific, Waltham, MA); sterile polystyrene 10- and 20-mL serological pipettes (TPP, Trasadingen, Switzerland); sterile low-binding 100–1000 and 1–20 μL pipette tips (Midwest Scientific, Valley Park, MO); rubber bands; disposable 2-mL glass Pasteur pipettes, disposable 1-mL graduated polyethylene pipettes (VWR, Radnor, PA); Scotch tape (3 M, Maplewood, MN); dialysis tubing Spectra/Por (12,000–14,000 Da molecular weight cut-off, Repligen, Waltham, MA)
-
Glassware: beakers (3 × 50-mL, 6 × 400-mL, 3 × 600-mL), screw top bottles (1-L, 3-L), graduated cylinders (2 × 100-mL, 2 × 500-mL, 1-L, 2-L)
Never use any kind of detergent to clean surfaces of equipment that comes in contact with sea urchins, embryos, or primary mesenchyme cell cultures. Instead, rinse with 70% (v/v) ethanol and a brush, then rinse with deionized water and let dry at ambient temperature. Glassware can also be autoclaved (steam, 121°C for 30 min). Using glassware dedicated to this protocol reduces the chances of accidental introduction of detergents.
-
Gradient mixer
While there are gradient mixers that are available commercially, we use a custom-made model. Gradient mixers generally consist of two reservoirs, in our case 250-mL glass beakers (Fig. 6). The reservoirs are connected at the very bottom by a glass tube fitted with a Teflon stopcock. One of the beakers is fitted, also at the very bottom, with an outflow fitted with a Teflon stopcock. The gradient mixer is fixed to a stand using a clamp such that the beaker that has both an inflow and an outflow is suspended above a magnetic stir plate. A magnetic stir bar is placed in this beaker. The more concentrated (“heavy”) solution is placed in the beaker with the stir bar; the less concentrated (“light”) solution in the other one. The overall effect is that the heavy solution is increasingly diluted by the light solution.
4-L LDPE carboys with polypropylene spigot (Thermo Fisher Scientific, Waltham, MA)
Plastic tray large enough to hold six 400-mL beakers and 5–10 cm of ice (e.g., 35 cm × 15 cm × 35 cm)
2-L foam or plastic ice buckets
300-mL polypropylene plastic squirt bottle
RS-5883 surgical grade scissors (Thermo Fisher Scientific, Waltham, MA)
Dumoxel® 120 mm length tweezers (Electron Microscopy Sciences, Hatfield, PA)
Single-channel adjustable volume pipettes (100–1000, 20–200, 2–20 μL, Eppendorf, Hamburg, Germany)
-
Nylon mesh (55 μm, Sefar, Buffalo, NY)
This mesh size works well for S. purpuratus but may need to be adjusted for other species with different size eggs.
Inverted light microscope with 5×, 10×, and 20× objectives (Leica Microsystems, Wetzlar, Germany)
Cell counting chamber (Hausser Scientific Partnership, Horsham, PA)
Centrifuge 5810 R (with temperature control, swing-bucket rotor with four 500-mL buckets, conical 50- and 200-mL inserts, Eppendorf, Hamburg, Germany)
Portable Pipet-Aid® XP2 Pipette Controller (Drummond Scientific, Broomall, PA)
Pumpdrive 5201 peristaltic pump (Heidolph, Schwabach, Germany)
MR Hei-Mix L magnetic stir plate (Heidolph, Schwabach, Germany)
-
Dura-Mag 9 position digital stirrer (Chemglass Life Sciences, Vineland, NJ)
Other magnetic stir plates can be used, but multi-position plates are convenient. Avoid stir plates that get warm to the touch. Protect stir plates against spills: seawater greatly accelerates corrosion of metal parts. Stirring speed should be 60–80 rpm.
-
500-mL dimpled bottom spinner flasks (Chemglass Life Sciences, Vineland, NJ)
Stirring of embryo cultures with regular magnetic stir bars is not recommended because friction forces damage embryos. Dimpled spinner flasks minimize the forces but are quite pricey. Simple overhead stirrers can be built from 1 Hz clock motors (Fig. 7).
-
Vacuum aspirator with trap (Sigma Aldrich, St. Louis, MO) or build one as follows
Attach a 100–1000 μL pipette tip to a tube (e.g., Tygon® tubing with 1.3 cm outer diameter (oD) and 1.0 cm inner diameter (iD)) connected to the aspirator to conveniently vacuum up solutions. If necessary, cut the pipette tip to increase the flow rate. Keep concentrated bleach in the trap to disinfect any biological waste.
-
Fertilization membrane stripping tool
Remove the bottom of a 50-mL Falcon tube with a razor saw or knife to create a cylindrical tube. Stretch the Nylon mesh over one end and fix in place with a rubber band (Fig. 8).
-
Plastic baffles
Cut flat squares (2–3 cm edge length) from plastic weighing boats. Make sure that the baffles float on sucrose gradient, as some weighing boat plastics will sink. Do not reuse.
-
Micromere vacuum
We use this simple device to collect micromeres from sucrose gradients (Fig. 9). Two holes (1.5–2 mm diameter) are drilled into the screw cap of a 50 mL Falcon tube. Two plastic serological pipettes (1 mL) are fitted through the holes. One pipette is glued in place such that most of its length is above the cap. A pipette controller will be attached to this end. The other pipette is glued in place such that about half of its length is above the cap. A short length of tubing (e.g., Tygon®, 2–3 cm length, 2.5 mm iD, 3 mm oD) is attached to the bottom end of the latter pipette. A longer piece of tubing is attached to the top end. This piece of tubing will be used to collect micromeres from the gradient. Before using the micromere vacuum, screw modified cap onto a 50 mL Falcon tube and attach pipette controller.
FIG. 6.
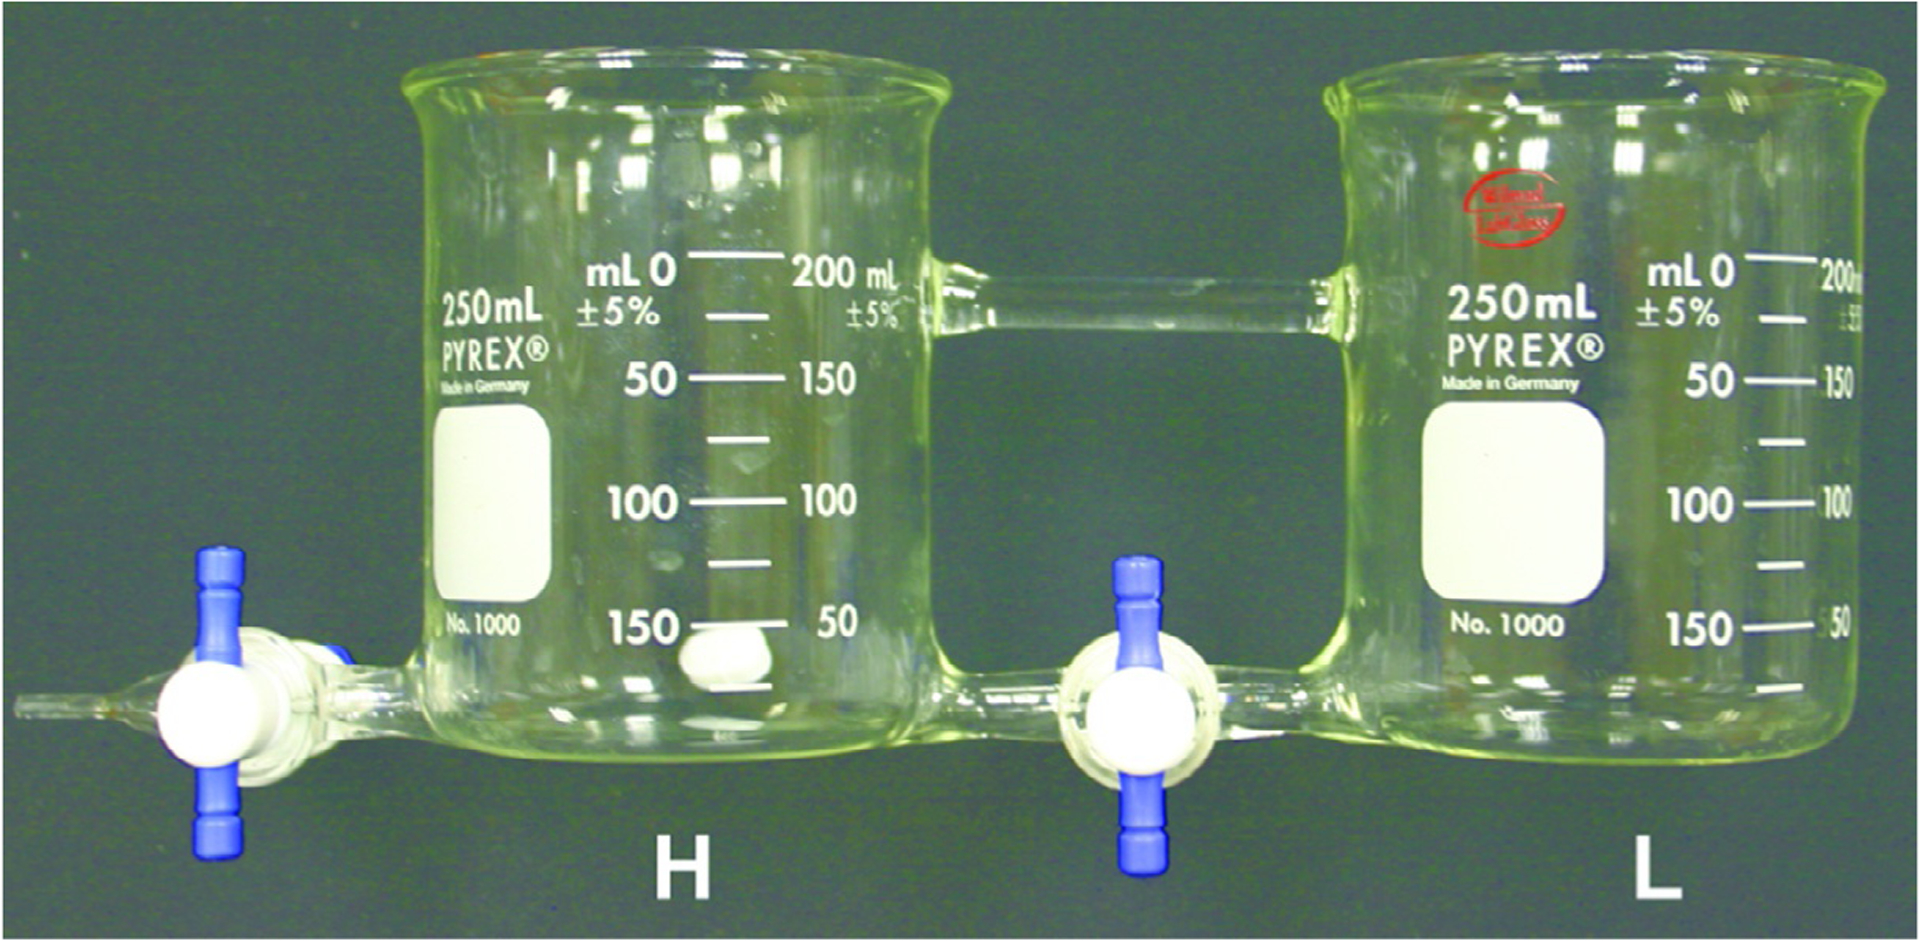
Gradient mixer custom-built from two 250-mL beakers. The heavy solution is placed in the beaker marked “H,” and the light solution is placed into the beaker marked “L.”
FIG. 7.
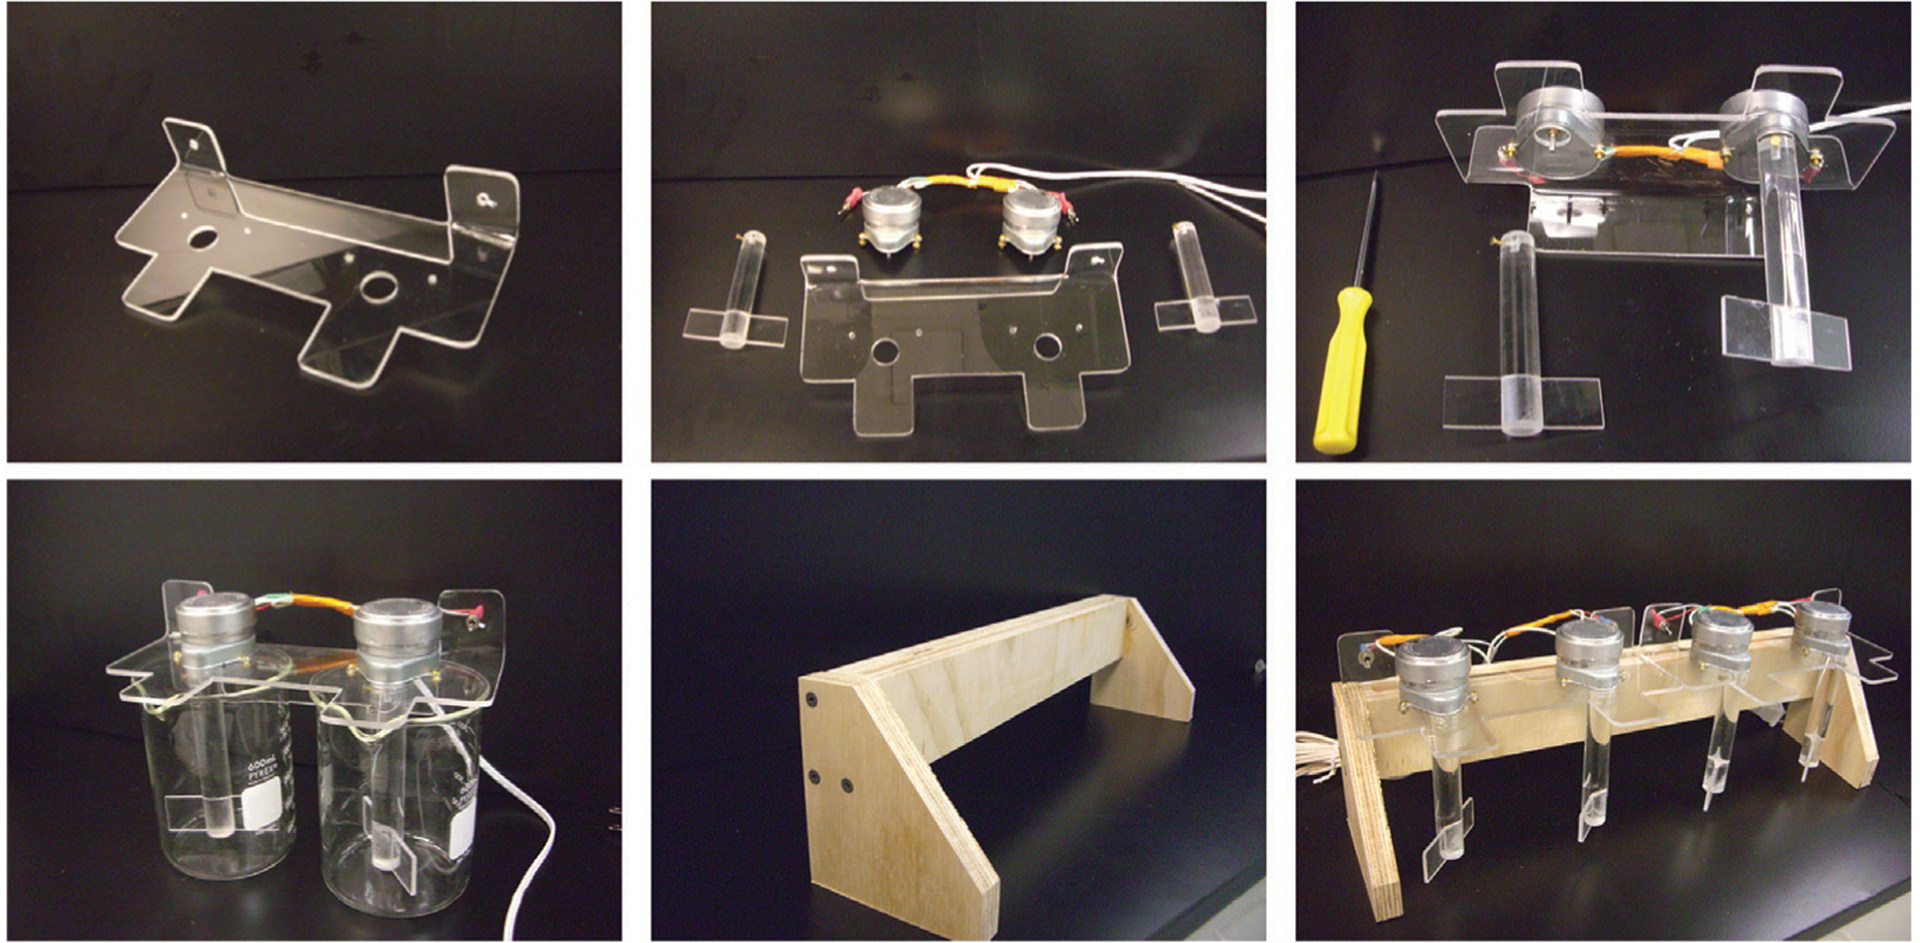
Inexpensive stirrers custom-built to stir embryo cultures at 1 Hz.
FIG. 8.
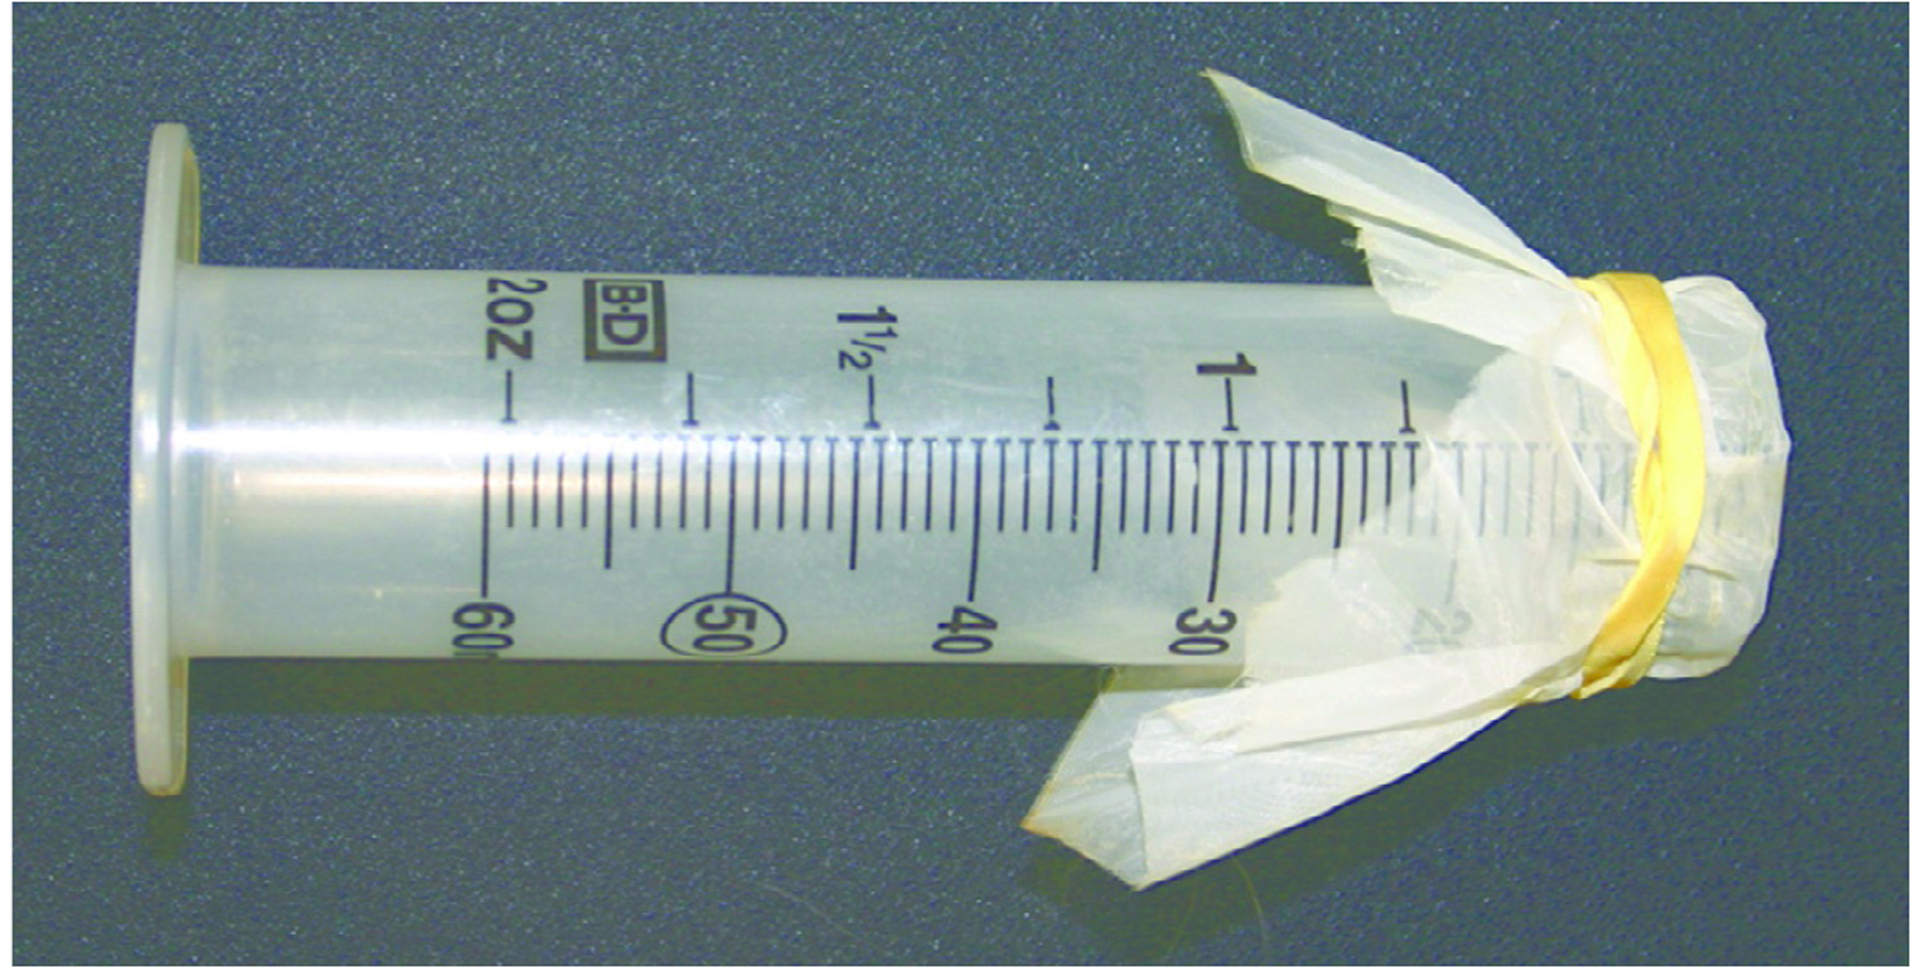
Fertilization membrane stripping tool made from a Nylon mesh tied with a rubber band to a cutoff 50-mL Falcon tube.
FIG. 9.

The “micromere vacuum.” Two holes are drilled into the cap of a 50-mL Falcon tube. Cutoff 1-mL serological pipettes are fitted through these holes and glued in as shown. Tubing is attached to one of the pipettes, and a pipette controller is fitted onto the other pipette.
2.4. INITIAL LABORATORY SETUP, IN THE 15°C CLIMATE-CONTROLLED ROOM
Wipe down the bench space with 70% (v/v) ethanol.
-
Assemble the spinner flasks. Fill each with 400 mL of ASW.
Spinner flasks will be used to fertilize eggs and culture embryos.
-
Fill a large plastic tray with ice. Place six 400-mL glass beakers in the ice. Ensure that beakers lie flat on the bottom of the tray, and that the ice covers at least the bottom half of the beakers.
Beakers will be used to pour and store sucrose gradients in Section 2.5.
Fill a foam bucket with ice. Place two to three uncapped 50-mL Falcon tubes (to collect sperm) and one capped Falcon tube containing 40 mL of ASW into the ice (for later dilution of sperm).
Fill two to three 50-mL glass beakers to the brim with ASW (for collection of eggs).
2.5. PREPARATION OF THE SUCROSE GRADIENTS
-
There should be six 400-mL glass beakers sitting on ice (see Section 2.4). Pour 100 mL of the heavy sucrose solution into each.
This will serve as the cushion for the gradient.
Close both stopcocks of the gradient mixer. Place 90 mL of the heavy solution and a magnetic stir bar into the beaker with one inflow and one outflow, and 90 mL of the light solution into the other beaker. Turn on the stirrer.
-
Tape the end of the tube connected to the outflow of the gradient mixer to the side of the beaker to ensure that the liquid flows down the side of the beaker (Fig. 10). Open the connecting stopcock and the outflow stopcock of the gradient mixer. Turn on peristaltic pump (4 mL/min) to create gradient on top of the cushion.
Each gradient takes approximately 45 min to prepare. See note in Section 2.2 regarding time commitment and strategy for pouring.
-
Remove the taped tubing and gently place the gradient back on ice.
Take care to avoid mechanical disturbances or dramatic temperature shifts that can disturb the gradient.
Use a pair of tweezers to carefully float one plastic baffle on top of each of the gradients.
Rinse the tubing out with deionized water to prevent sucrose from crystallizing and clogging the tubing.
FIG. 10.
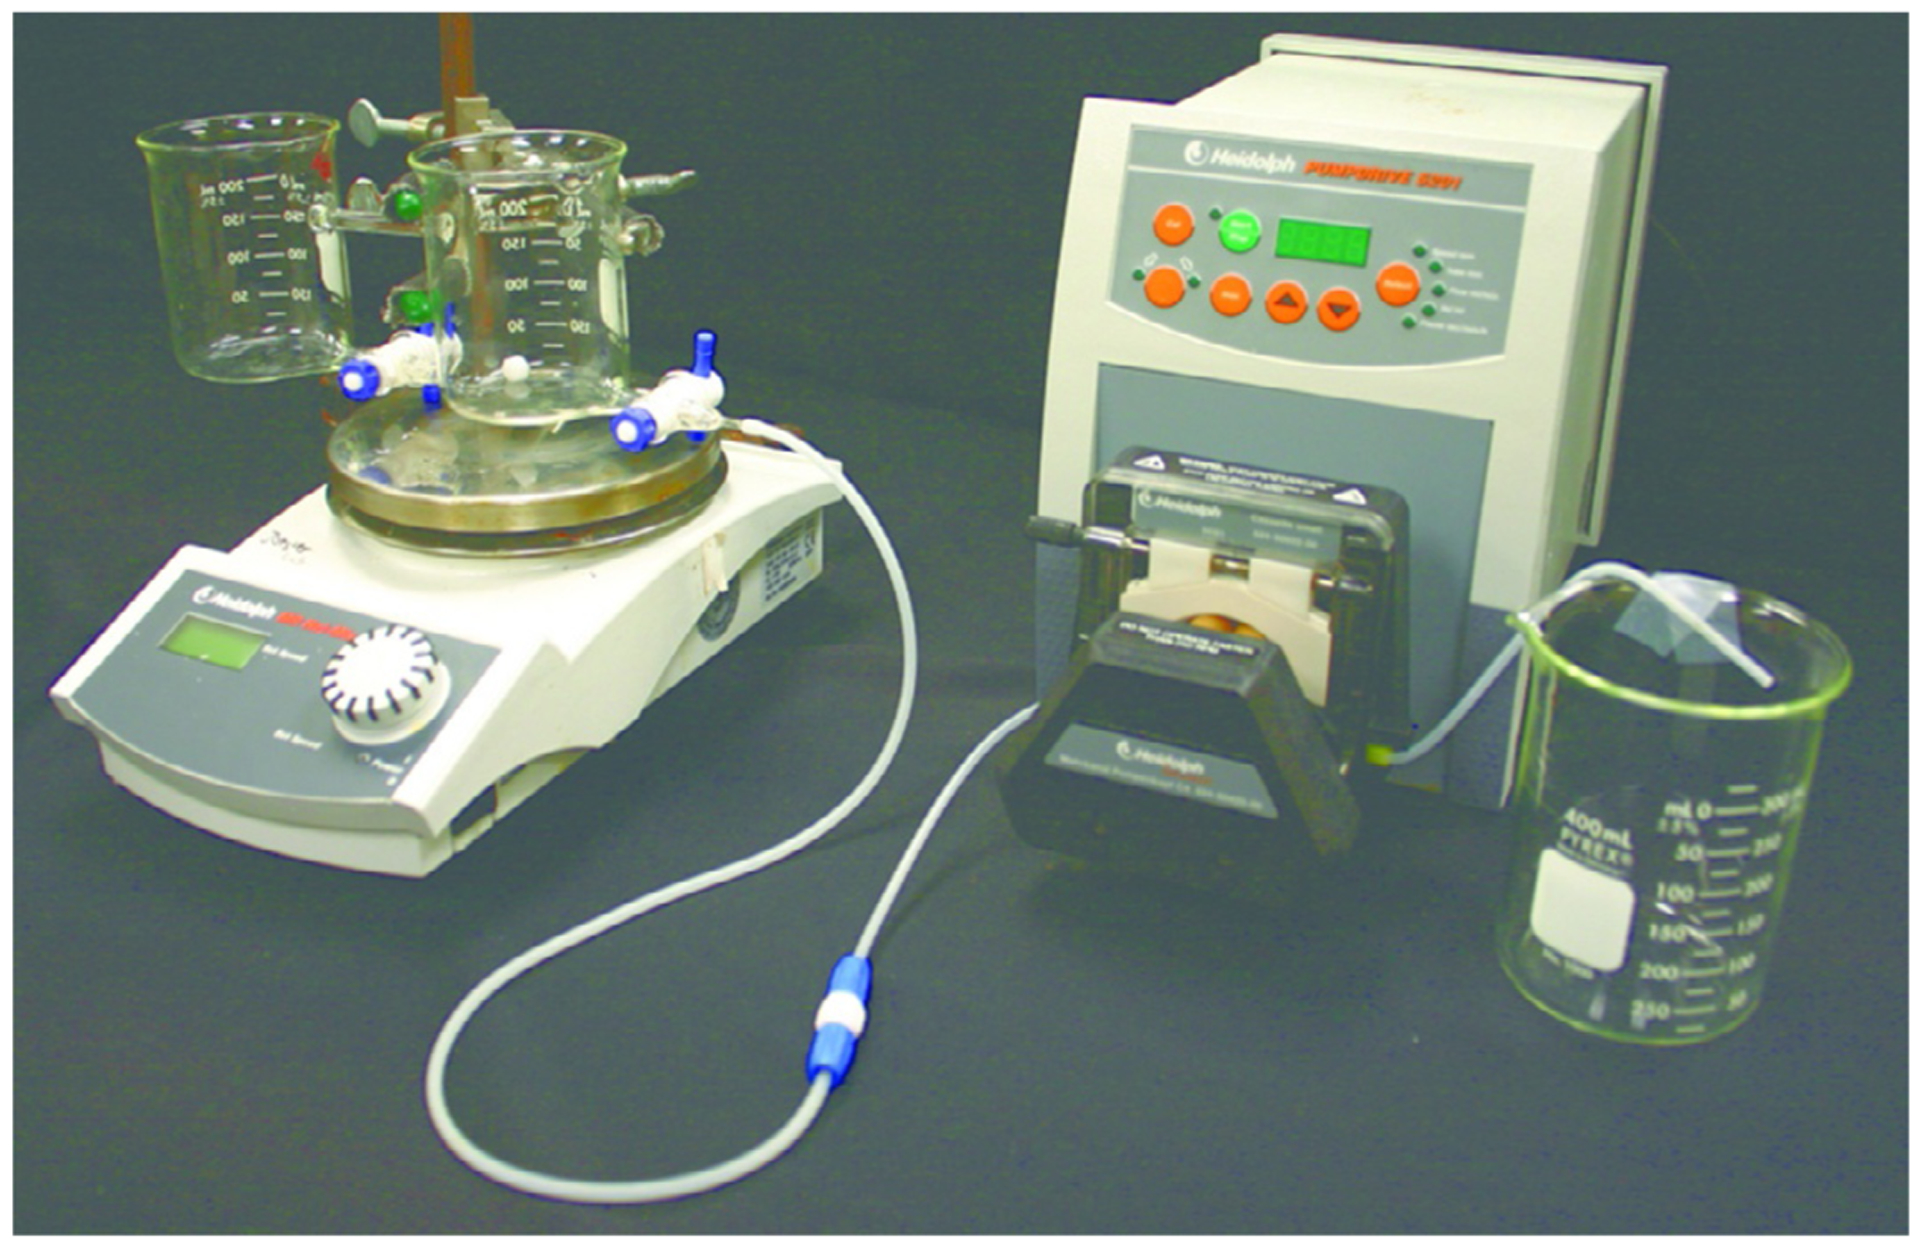
Setup of gradient mixer, peristaltic pump, and receiving beaker for gradient generation. Note that tubing from pump is fixed on the side of the beaker with tape to ensure that liquid runs down the inside wall of the beaker in a continuous, gentle stream. This minimizes mixing at the interface and thus improves gradient quality.
2.6. EMBRYO CULTURE UP UNTIL THE 4-CELL STAGE
2.6.1. Collection of gametes
Work over a sink or large glass beaker. Hold animals in one hand with the mouth facing up. With the other hand, insert one scissor blade into the ring of soft tissue between the perignathic girdle and the teeth. Use scissors to make a circular cut through the peristomal membrane, severing the muscles and ligaments connecting Aristotle’s lantern to the perignathic band.
Use a pair of tweezers to pull out Aristotle’s lantern, ripping the gut in the process.
Discard the coelomic fluid and use a squeeze bottle to squirt 2–3 mL of KCl solution into the body cavity. Gently swirl the fluid by moving the animal in a circular motion to wet the gonads.
Shedding should occur within 30 s. Eggs are orange and sperm are white. Place females, upside down, on the filled 50-mL beakers (they will shed faster if their gonopores are in contact with water), and males on the empty 50-mL Falcon tubes on ice. Shedding finishes after 10–20 min.
2.6.2. In vitro fertilization
Each spinner flask should already contain 400 mL ASW. Add 8 mL of PABA stock solution (final concentration ~5 mM) and stir.
-
Transfer eggs from beakers to a 50 mL Falcon tube. Wash with ASW. To do so, collect cells by centrifugation (100 × g for 2 min), remove supernatant by suction, and gently resuspend pellet in 50 mL ASW. Repeat once.
All centrifugation is carried out in a refrigerated centrifuge at 4–15°C. Alternatively, one can let eggs sediment at 1 × g instead.
Add 40 μL of sperm to the Falcon tube containing 40 mL ASW, cap, and invert the tube to mix, and put back on ice.
-
Add 2 mL of eggs to each of the spinner flasks (~0.5 mL eggs per 100 mL ASW+PABA), using a plastic Pasteur pipette.
Avoid using a pipette tip with a narrow diameter, as this can shear and rupture the eggs. Embryo cultures should be stirred continuously, at about 60 rpm.
-
Use a glass Pasteur pipette to add 10–15 mL of the diluted sperm solution to each spinner flask. Using a light microscope, check for appearance of the fertilization membrane. Make note of time or start timer. All future times are given in units of hours post-fertilization (hpf).
This is the point in time to set aside a number of embryos for a control culture if so desired. Refer to chapter “Procuring animals and culturing of eggs and embryos” by Adams et al., this volume, for details.
2.6.3. Weakening the hyaline membrane
-
At 0.5 hpf, pass each embryo culture through the Nylon mesh of the stripping tool, into 600-mL glass beakers. Using a light microscope, confirm that at least 90% of embryos have been stripped of their fertilization membrane. Else, repeat. After passing an embryo culture, wash the Nylon mesh, from the opposite direction the culture was passed through, with deionized water and then dip it in ASW. Allow cultures to settle at 1 × g for 20 min.
Embryos retaining their fertilization membrane will be nearly impossible to dissociate. It is possible to remove the fertilization membrane at the 4-cell or 8-cell stage but doing so risks damaging the embryos prior to the fourth cleavage division.
-
Remove two-thirds (~260 mL) of the supernatant by suction and replace with an equivalent volume of CFSW to lower the calcium concentration from 10 mM to 3.3 mM. Return each culture to its flask on the motor plate and stir.
In this step, we lower the calcium concentration to weaken the hyaline membrane.
-
At the 4-cell stage (approximately 2.5–3 hpf), collect the embryos by centrifugation (100 × g, 2 min). Remove, by suction, as much supernatant as possible without disrupting the pellet. Gently resuspend the embryos in 400 mL of CFSW. Return each embryo culture to its flask on the motor plate and stir.
Avoid any shearing action on the embryos from here on out, as dissociating them too early will lower the micromere yield.
2.7. EMBRYO DISSOCIATION AND ISOLATION OF MICROMERES
2.7.1. Dissociation of embryos
At the 16-cell stage (approximately 4.5–5 hpf), divide each culture into two equal volumes (e.g., two 200-mL Falcon tubes) for centrifugation (100 × g, 2 min). Remove supernatant by suction and gently resuspend each pellet in 50 mL CFSW. Transfer to 50-mL Falcon tubes.
-
Collect embryos by centrifugation (100 × g, 2 min). Remove supernatant by suction and gently resuspend in 50 mL CMFSW. Put on ice.
CMFSW is toxic to the embryos. Minimize damage by keeping tubes on ice in between tasks and work as quickly as possible without sacrificing laboratory finesse. Optionally, pre-chill CMFSW on ice prior to the 16-cell stage.
Collect embryos by centrifugation (100 × g, 2 min). Reduce supernatant to 10 mL, by suction. Resuspend and triturate using 10 mL serological pipette: aspirate and dispense the embryo suspension 8–10 times.
Confirm, using a light microscope, that at least 80% of the embryos have dissociated. If so, immediately resuspend the embryos in 50 mL CFSW in each separate 50-mL Falcon tube. In the rare case that dissociation is incomplete, collect embryos by centrifugation (100 × g, 2 min), resuspend in 40 mL CFSW, and gently invert the capped Falcon tube several times. Monitor the degree of dissociation, using a light microscope, and repeat as many times as necessary to achieve adequate dissociation (>80%).
Collect dissociated cells by centrifugation (450 × g, 5 min). Reduce supernatant in each tube to 10 mL, by suction. Resuspend embryos using a 10-mL serological pipette.
2.7.2. Isolation of micromeres
-
Remove gradients from ice. Gently layer 10 mL of suspended cells over the plastic baffle so that the gradient is not disrupted. Repeat for each gradient. Let the cells settle at 1 × g for 20–30 min.
An opaque layer of lysed cells should be on top, and the thin micromere band should be visible several millimeters beneath (Fig. 11). Larger cells and undissociated embryos form a much wider band beneath the micromere band.
-
Slowly collect 35–40 mL of solution from the micromere band with the micromere vacuum (Section 2.3; Fig. 9). To do so, connect the pipette controller and attach 50 mL Falcon tube to modified screw cap. Gently lower the collection tube into the gradient. Using the pipette controller, collect cells from the micromere band by gentle suction.
Be sure to turn off suction when passing through the layer of lysed cells on top of the gradient. Ideally remove only 10–15 mL at a time and avoid rapid lateral movements of the collection tube so as to not disturb the band too much. The micromere band will reform in 3–5 min. Even if the micromere band is difficult to see, good cell cultures can still be obtained by collecting media a few millimeters beneath the top opaque layer.
-
Immediately add one volume of 1.0 M CaCl2 per 100 volumes of collected micromere suspension, then cap and invert the tubes to mix.
Micromeres are now back in media where the concentration of Mg and Ca is back to normal seawater values.
Collect micromeres by centrifugation (450 × g, 5 min). Collect 30 mL of supernatant and set aside for use in Section 2.8. Reduce, by suction, remaining supernatant to ~7.5 mL. Resuspend the micromeres by triturating the solution using a 10-mL serological pipette, then combine all micromere suspensions into one 50-mL Falcon tube.
FIG. 11.
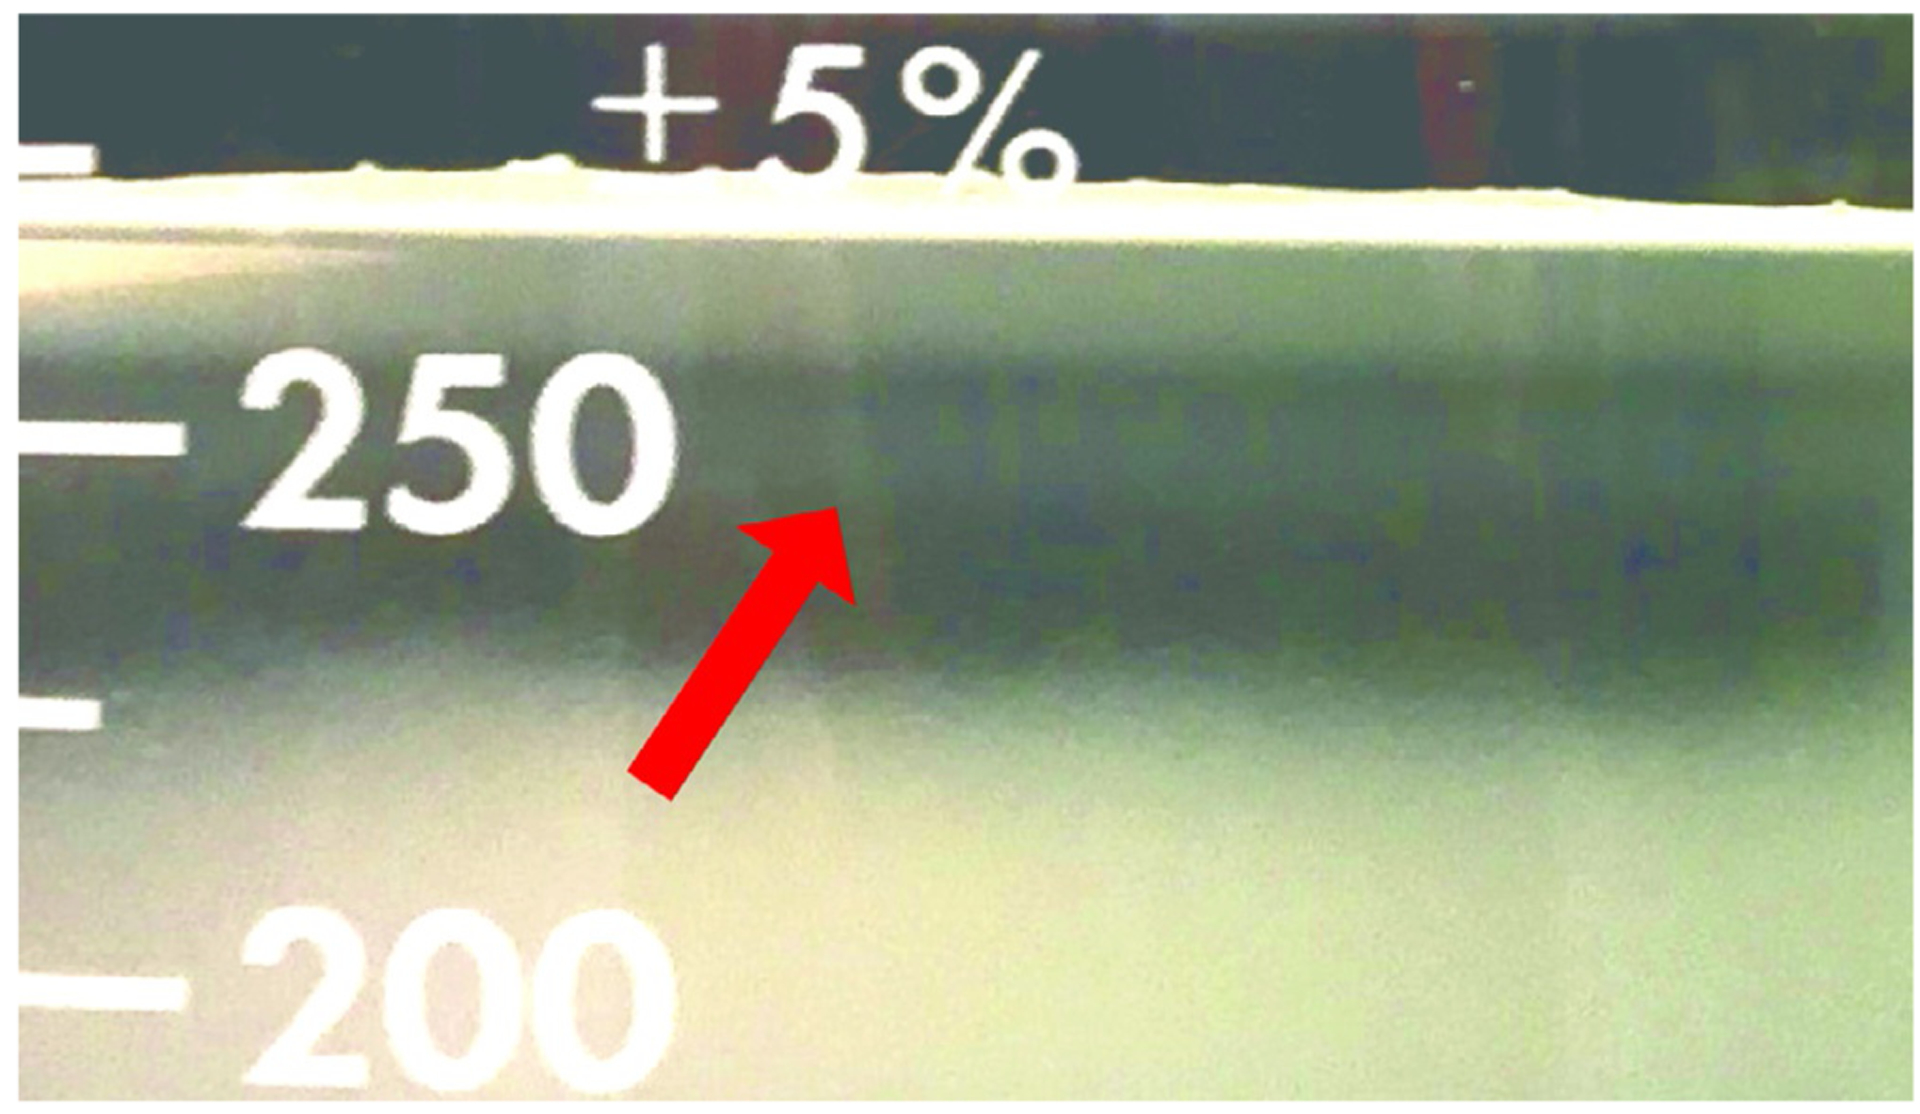
Sucrose gradient at 30 min after application of dissociated S. purpuratus embryos. The thin micromere band is visible at the 250 mL mark (arrow). The illumination is ambient, and the background is a black surface.
2.8. CULTURE OF MICROMERES AND PMCs
-
Determine micromere density using a hemocytometer. Adjust cell density if necessary. To dilute, add the appropriate volume of previously collected supernatant and gently mix. To concentrate, collect micromeres by centrifugation (450 × g, 5 min), reduce supernatant to the desired volume, and gently resuspend.
We find that a density of 50,000–75,000 cells/mL is convenient for plating the cultures.
-
Plate approximately 100,000 cells per 35 mm Petri dish. Add additional ASW to bring the total volume to 2 mL, if necessary. Cover Petri dish with lid and let micromeres settle and adhere for 1 h.
Cell density can be varied if a more or less dense culture is desired, although plating >250,000 cells per 35 mm plate will generally result in cell death from overcrowding. Match the total volume to the size of the Petri dish and monitor dishes periodically for evaporation.
-
Wash each plate twice with ASW+GPS. To do so, remove media by suction, using a 10–20 μL disposable pipette tip on the aspirator. Add 2 mL of ASW+GPS gently from the side of the plate, while rotating the plate so as not to dislodge the micromeres in one area. Repeat. Alternatively, a micropipette can also be used. Cover and incubate.
Be gentle when washing the plates, as it is quite easy to dislodge the micromeres. Leave a thin layer of liquid on top of the cells at all times, as removing all media can result in a meniscus force that will dislodge the micromeres. Do not allow cells to become dry under any circumstance.
-
At 24 hpf, wash the plates twice with ASW+GPS. This time gently swirl the plates before removing media. Debris and detached cells will collect in the middle of the plate. Aspirate media from the center, then add 2 mL ASW+GPS as in the previous step. Repeat. Cover and incubate.
By the 24 hpf time point, the micromeres should have differentiated into PMCs. Typically, you will see them cluster in groups of 3–8.
If using HS, thaw one 5-mL aliquot of heat-inactivated, dialyzed HS.
At 26 hpf, remove ASW+GPS and wash twice with the cell culture media of choice, e.g., 4% (v/v) HS in ASW+GPS.
-
Allow cultures to develop to the desired timepoint.
Typically, spiculogenesis begins at ~32 hpf, and spicules are well-developed by 48 hpf (Fig. 12). Cultures are viable to 96–108 hpf, but then turn morbid.
-
Different media can be added later if required by the experiment. The cell culture media is switched simply by washing twice with ASW+GPS, and twice with the desired media.
When adding small volumes of concentrated reagents such as inhibitors directly to the culture, avoid poisoning cells close to the point of addition by gently swirling the plates. Alternatively, mix the reagent and culture serum together prior to adding to the cell cultures.
FIG. 12.
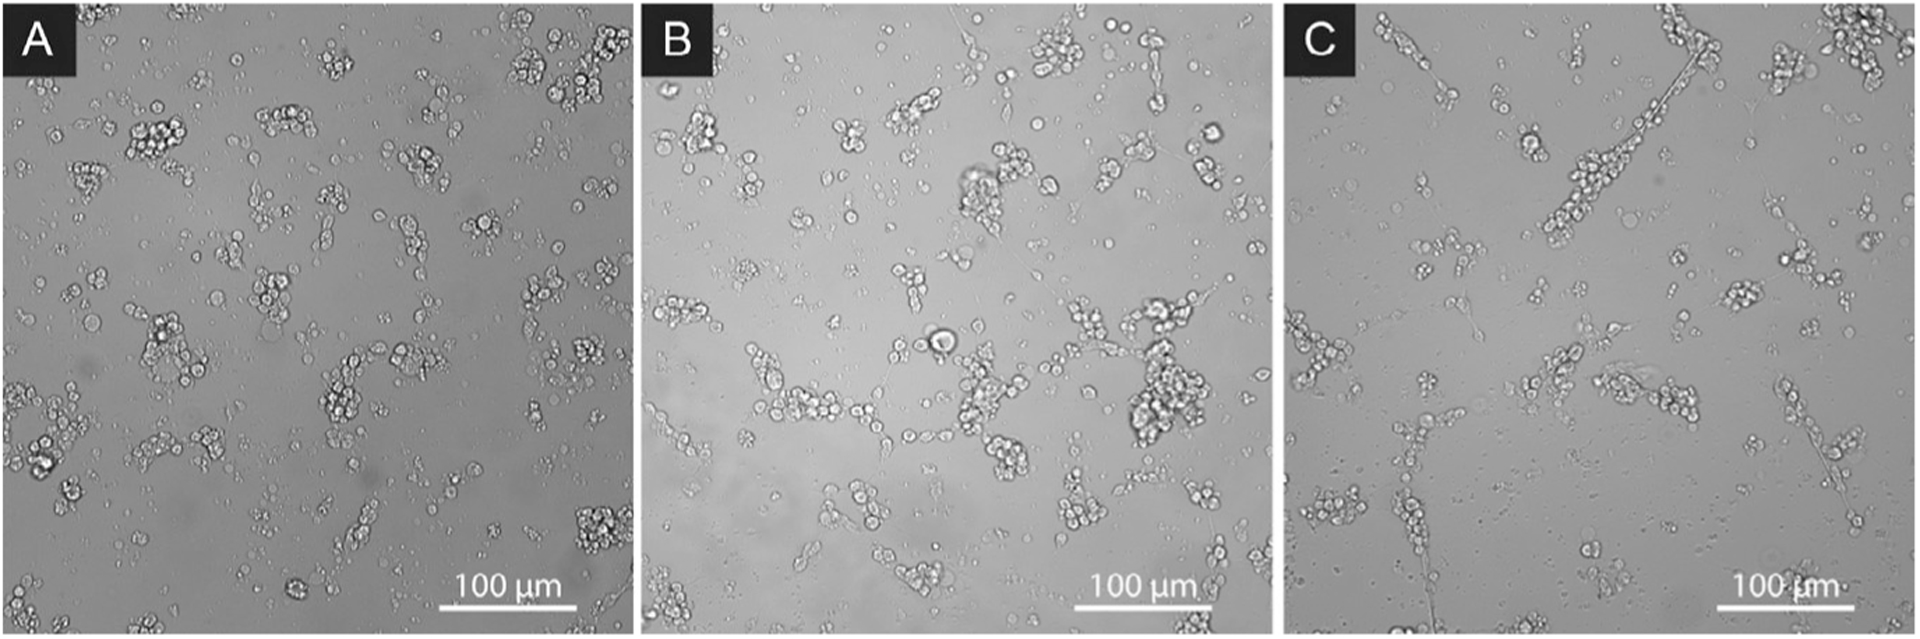
Typical appearance of S. purpuratus PMC cultures grown at 15°C in ASW+HS, at 32 hpf (A), 38 hpf (B), and 48 hpf (C), using bright field contrast.
3. FLUORESCENT STAINING AND IMAGING OF PRIMARY MESENCHYME CELL CULTURES
3.1. BACKGROUND
Fluorescent staining is of great importance for analysis of the time course and localization of proteins in cells and tissues. It has been widely used on whole embryos, and most methods that work on embryos can be adapted to PMC cultures. Nuclear stains such as DAPI or Hoechst 33342, membrane stains such as the FM or DiI series of dyes, cytoplasmic stains such as calcein-AM, and phalloidin-based stains of filamentous actin have all been used successfully (Hodor & Ettensohn, 1998; Miller et al., 1995). Primary antibodies raised against endogenous proteins of the sea urchin embryo are frequently used. Examples include the PMC-specific 6a9 monoclonal antibody against MSP-130 (Ettensohn & McClay, 1988), and antibodies against SM50, SM30, and PM27 (Urry, Hamilton, Killian, & Wilt, 2000). The specificity and binding of antibodies raised against highly conserved vertebrate proteins should be validated, but there are examples where such antibodies, for instance against actin or tubulin, work well (Sepúlveda-Ramírez et al., 2018). Finally, stains such as calcein and fluorescent conjugates of wheat germ agglutinin and dextran have been used to track endocytotic vesicles and biomineralization (Killian & Wilt, 2017; Vidavsky et al., 2014, 2016, 2015).
Fluorescently tagged fusion proteins generated by microinjection of engineered mRNAs into the embryo are fairly routine to study protein localization in vivo. It has only rarely been used to study PMCs in culture, because it currently requires extraction of small numbers of PMCs by microsurgery (Cheers & Ettensohn, 2005).
Here, we will only discuss a general procedure for fixation and permeabilization of PMC cultures and give the example of staining with rhodamine-phalloidin to image filamentous actin.
3.2. OVERVIEW AND GENERAL REMARKS
As there are a great number of fluorescent labels that can be used in many combinations, we will focus here on some general aspects of preparing PMC cultures for fluorescent staining. Very generally, one differentiates between stains that are compatible with live cells (e.g., calcein, calcein-AM, Hoechst 33324, FM and DiI) and those where cells have to be fixed and permeabilized (e.g., antibodies against intracellular proteins, phalloidin, DAPI). The choice of fixative, permeabilization method, and the sequence in which dyes are applied when multiplexing is desired are important, and depend strongly on the specific dyes used. Many times, manufacturers will give recommendations that will serve as a good starting point, but optimization is frequently necessary. Finally, when analyzing mineralizing PMCs, it is straightforward to demineralize if that is desired (see Section 4). Special care must be taken, however, to avoid mineral dissolution by maintaining a high pH and depressing calcite solubility by addition of calcium ions or by saturating wash solutions with calcium carbonate.
3.3. MATERIALS
3.3.1. Chemicals
Unless otherwise noted, all reagents are stored at room temperature (22°C). Note that many are considered hazardous and care must be taken to adhere to established laboratory safety protocols and to properly dispose of waste. Methanol (≥99.9%), HCl (10 M, 37% (w/w)), bovine serum albumin (BSA, ≥95%, Sigma Aldrich, St. Louis, MO); ProLong™ Gold Antifade Mountant, Triton™ X-100 (Thermo Fisher Scientific, Waltham, MA); paraformaldehyde (16% aqueous solution, catalog number 15710-S, Electron Microscopy Sciences, Hatfield, PA); CF568 Phalloidin conjugate dye (Catalog number 00044, Biotium, Fremont, CA).
3.3.2. Solutions and buffers
Unless otherwise noted, all aqueous solutions are prepared with ultra-pure water (UPW, ρ = 18.2 MΩcm) dispensed by a Barnstead NanoDiamond UF+UV purification unit, and stored at 15°C.
-
HCl (1 M)
Caution: Concentrated and 1 M hydrochloric acid is highly caustic.
-
Fixative: Paraformaldehyde (4% (v/v))
Caution: Paraformaldehyde is considered a carcinogen.
Triton™ X-100 (0.1% (v/v))
BSA (1% (w/v))
40× phalloidin conjugate stock solution in methanol (200 assays/mL, ~6.6 μM)
3.3.3. Equipment
Glass bottom dish (29 mm dishes with 20 mm bottom wells, In Vitro Scientific, Mountain View, CA)
Micro cover glass slips (18 × 18 mm, 0.13–0.17 mm thickness, VWR, Radnor, PA)
Mini incubator (VWR, Radnor, PA)
Single-channel adjustable volume pipettes (20–200 and 100–1000 μL, Eppendorf, Hamburg, Germany)
3.4. PREPARATION OF GLASS DISHES OR COVERSLIPS
If working with coverslips, place each in a 35 mm plastic Petri dish.
Add 3 mL 1 M HCl per Petri dish, or per 29 mm glass bottom dish.
Place the lid back on the Petri dish to prevent evaporation and incubate overnight at 55°C.
-
Decant HCl from dish and refill with UPW. Wash 10 times with UPW, followed by 2 times with ASW.
Coverslips can be stored in ASW for 4–5 days before use.
3.5. CELL CULTURE AND TREATMENT
Prepare micromeres as described in Section 2.
If using cover slips, place each in a 35 mm plastic Petri dish.
Seed cells at a density of approximately 100,000 cells per 35 mm Petri dish or glass bottom dish. Make sure to top media up to 2 mL, if necessary. Culture to desired stage as described in Section 2, treating cells as required for your experiment.
3.6. FIXATION AND PERMEABILIZATION
Wash cells twice with ASW.
Remove medium by suction and immediately add 2 mL of fixative. Incubate for 10 min at room temperature.
Remove fixative by suction. Wash two or more times with ASW.
Remove medium by suction and immediately add permeabilizing detergent. Incubate at room temperature for 30 min.
-
Wash two or more times with ASW.
Depending on your application, you may want to avoid dissolving the spicule mineral, or you may want to make sure it is completely dissolved. Avoiding dissolution is more difficult. Keeping the pH of all solutions above 7 and increasing calcium concentration are useful strategies to depress biomineral dissolution. Incubating at low pH, or with solutions containing EDTA or EGTA will quickly dissolve the mineral.
3.7. STAINING
-
For each coverslip to be stained, dilute 5 μL methanolic phalloidin conjugate stock solution into 200 μL ASW containing 0.1% BSA.
BSA is used to reduce nonspecific background staining. It may also be useful to pre-incubate fixed cells with ASW containing 1% BSA for 20–30 min prior to adding the phalloidin staining solution.
-
Directly add 200 μL of the staining solution on the coverslip and incubate for 20 min at room temperature.
To avoid evaporation, keep the coverslips inside a covered container during the incubation.
Wash two or more times with ASW.
If multiplexing/counterstaining stain with additional dyes such as Hoechst 33342 or DAPI for nuclei, this is the time.
For long-term storage, the cells should be mounted in ProLong® Gold reagent, according to the manufacturer’s instructions. Specimens prepared in this manner retain actin staining for at least 6 months when stored in the dark at 2–6°C.
3.8. IMAGING
Samples can be imaged using standard light microscopy techniques, using phase, polarized light, differential interference (DIC) and/or fluorescence contrast (Fig. 13). See chapter “Methods to label, isolate, and image sea urchin small micromeres, the primordial germ cells (PGCs)” by Campanale et al., this volume, for more detailed protocols. Polarized light is particularly useful if one is interested primarily in the biomineral. DIC resolves cells and filopodia well. Fluorescence contrast allows highlighting specific features, such as filamentous actin stained by phalloidin-conjugates.
FIG. 13.
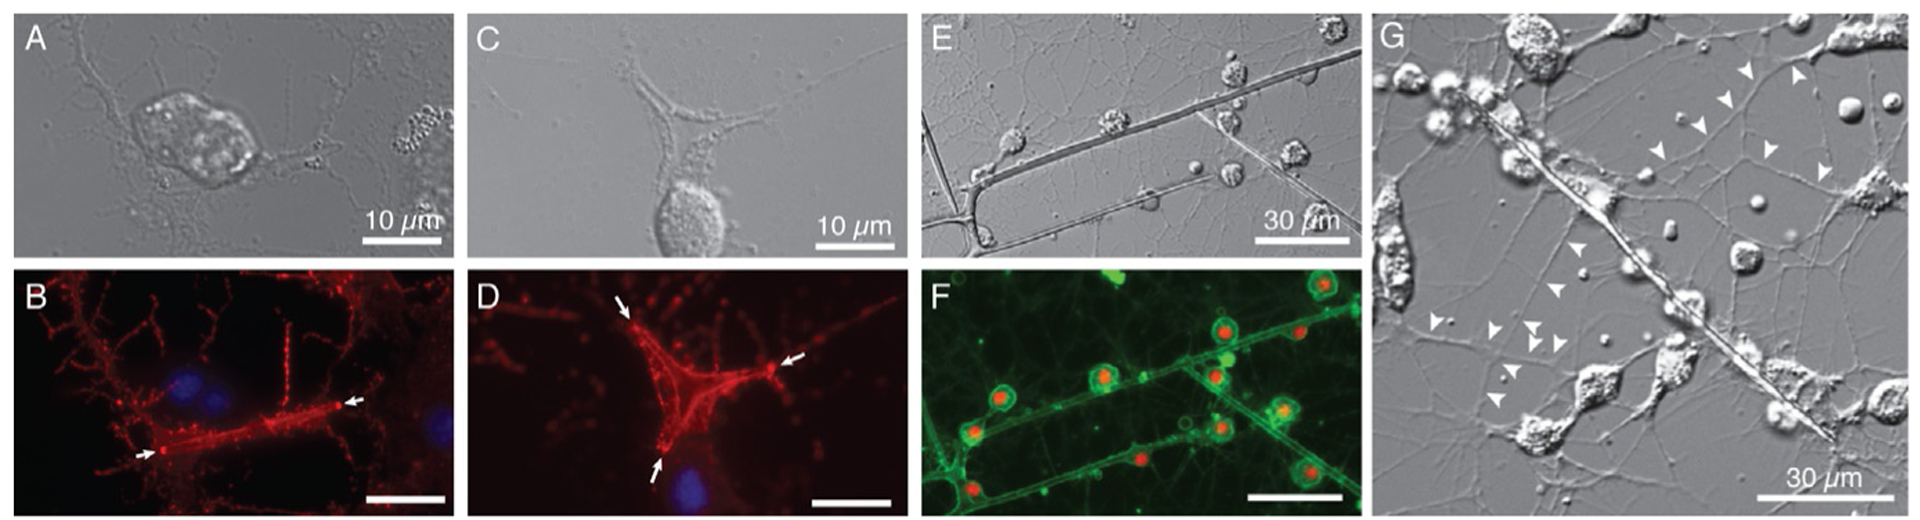
DIC (A, C, E, G) and false color composite of fluorescence images (B, D: f-actin in red (phalloidin-rhodamine) and nuclei in blue (Hoechst); F: membrane in green (FM 1–43), nuclei in red (Hoechst)) of S. purpuratus PMCs grown at low (A/B, G), high (C/D) and intermediate (E/F) rVEGF concentration. Note actin hotspots at growing spicule ends (arrowheads) in B, D; extensive filopodial networks in G (arrowheads).
4. PREPARATION OF PRIMARY MESENCHYME CELL CULTURES FOR ELECTRON MICROSCOPY
4.1. BACKGROUND
The dramatic morphogenetic events during the epithelial-mesenchymal transition in early development in the sea urchin embryo made it an attractive target for early ultrastructural studies using transmission electron microscopy (Balinsky, 1959; Gibbins, Tilney, & Porter, 1969; Hagstrom & Lonning, 1969; Millonig, 1970; Wolpert & Mercer, 1963). Research driven by developmental and cell biological questions, specifically the ingression of PMCs, their adhesion to and migration on the basal lamina, and the formation of a syncytium by cell fusion continued to fuel investigation of PMC ultrastructure in vivo (Amemiya, 1989; Anstrom & Raff, 1988; Katow & Solursh, 1980, 1981).
Rising interest in structural and mechanistic aspects of biomineralization then shifted focus toward spiculogenesis in PMCs (Beniash et al., 1999; Benson, Jones, Crise-Benson, & Wilt, 1983), and calcification by other cell types in adult sea urchins (Ameye, Compere, Dille, & Dubois, 1998; Ameye, Hermann, & Dubois, 2000; Markel, Roser, Mackenstedt, & Klostermann, 1986; Markel, Roser, & Stauber, 1989). Around the same time, careful analysis of the behavior, structure, and skeletogenesis in vitro established cultured PMC as a powerful model system. For instance, the role and localization of MSP-130, a cell surface glyco-protein involved in calcium transport has been explored by immuno-TEM (Decker, Morrill, & Lennarz, 1987).
Vesicular trafficking of proteins and mineral building blocks has been an area of interest since the very beginning (Gibbins et al., 1969). The SM50 and the SM30 family of spicule matrix proteins travel along the secretory pathway and are delivered to the spicule compartment (Ingersoll, McDonald, & Wilt, 2003). Interestingly, they show differential localization within the spicule compartment (Ingersoll et al., 2003; Kitajima & Urakami, 2000). Most recently, uptake and transport of calcium, membrane-impermeable dyes, and of several proteins in the plasma membrane (including MSP-130) to the spicule compartment has been demonstrated using a combination of fluorescence microscopy and ultrastructural analysis by focused ion beam-scanning electron microscopy (FIB-SEM) at cryogenic temperature (Killian & Wilt, 2017; Vidavsky et al., 2016).
Taken together, there is a long history, and strong present interest in ultrastructural analysis of PMC by electron microscopy. With functional (immuno)labeling of specific molecules being well established for transmission electron microscopy, and because of its wide availability, we focus here on sample preparation for conventional TEM. However, cryo-fixation and cryo-imaging arguably reveal any sample in its most pristine state, and may well be required for projects where preservation of very delicate structures or highly soluble materials is essential.
4.2. OVERVIEW AND GENERAL REMARKS
Sample preparation for ultrastructural TEM involves fixation, staining (post-fixation), dehydration, resin embedding, and sectioning. Optionally, sections can be stained further. Chemical fixation is generally straightforward, but care must be taken to match the osmotic strength of the fixative to that of seawater (~1000 mOsm/L).
Biominerals can easily dissolve during these processing steps, and in the resulting TEM micrographs there simply remains an empty (resin-filled) space with the same morphology as the biomineralized structure. In most instances, de-mineralization is favorable, as hard and brittle biominerals shatter easily during ultramicrotomy, and tend to tear thin sections. Fixation in the presence of chelators such as EDTA or EGTA, or a slightly acidic pH is usually sufficient to dissolve spicules deposited by PMCs in vitro. However, with proper attention to pH and calcium concentration in all aqueous solutions, it is possible to preserve the biomineral. To avoid loss of mineral during ultramicrotomy, it is advisable to float sections on a CaCO3-saturated solution or anhydrous glycerol. In the protocol discussed herein, spicules dissolve completely.
Cryofixation followed by freeze-substitution can help improve sample preservation and prevent loss of highly soluble organic and inorganic components (Ameye et al., 1998). While cryo-fixation of whole embryos requires high pressure freezing, PMC cultured directly on TEM grids can be plunge frozen as well (Decker et al., 1987). Vitreous water is then exchanged for an organic solvent, fixative, and stains at low temperature during freeze substitution (Ameye et al., 2000). Finally, the solvent is replaced with a resin, and the resin cured. Further processing by ultramicrotomy can be carried out at ambient temperature. Unfortunately, sectioning of such samples can be problematic because of the hard-soft contrast between the embedded soft tissue and the biomineral. Sectioning and imaging of cryo-frozen samples by cryo-FIB/SEM (Vidavsky et al., 2016), or by the cryo-TIGM process developed in our laboratory (Chang & Joester, 2015a, 2015b), circumvents these issues and offers supreme sample preservation, albeit at the price of reduced contrast and the inability to functionally label samples.
4.3. MATERIALS
4.3.1. Chemicals
Unless otherwise noted, all reagents are stored at room temperature (22°C). Ethanol (200 proof, Decon Laboratories Inc., King of Prussia, PA); NaCl (≥99.5%), MgSO4 (anhydrous, ≥99.5%), CaCl2·2H2O (≥99%), Na2SO4 (anhydrous, ≥99%), MgCl2·6H2O (≥99%), KCl (≥99%, Avantor, Radnor, PA); NaOH (≥99.1%, Thermo Fisher Scientific, Waltham, MA); paraformaldehyde (16% stock, EM grade), glutaraldehyde (25% stock, EM grade, stored at 4°C), OsO4 (4% (v/v), aqueous, stored at 4°C), uranyl acetate (powder), sodium citrate dihydrate (Na3C6H5O7·2H2O), Pb(NO3)2, EMbed812 resin (EMS, Hatfield, PA); acetone (≥99.5%, EMD Millipore, Billerica, MA).
4.3.2. Solutions and buffers
All aqueous solutions are prepared as noted with either deionized water (diH2O) or ultra-pure water (UPW, ρ = 18.2 MΩcm) dispensed by a Barnstead NanoDiamond UF+UV purification unit, sterile filtered, and stored at 15°C.
70% (v/v) aqueous ethanol
Artificial seawater (ASW, see Section 2.3.2)
NaOH (0.1 M, 4 g/L)
-
Fixative
Combine 1 mL of glutaraldehyde stock with 1.25 mL of paraformaldehyde stock and bring to a final volume of 10 mL with ASW. Adjust pH to ~8 using 0.1 M NaOH.
Prepare ~10 mL fixative per plate, immediately prior to use. Caution: Paraformaldehyde and glutaraldehyde are chemical hazards and should be handled in a fume hood, while wearing appropriate personal protective equipment.
-
OsO4 (2%, aqueous)
Mix 1 part OsO4 stock solution with 1 part diH2O.
Caution: Osmium tetroxide is toxic, volatile, and should be handled in a fume hood, while wearing appropriate personal protective equipment.
-
Uranyl acetate (2% (w/v), aqueous)
Caution: Uranyl acetate is toxic and radioactive and should be handled in a fume hood, while wearing appropriate personal protective equipment. Contact your local safety officer for disposal guidelines.
-
Reynold’s lead citrate (C12H10O14Pb3)
Suspend 1.33 g of lead nitrate in 30 mL of degassed diH2O in a 50 mL volumetric flask with a stopper. Add 1.76 g of sodium citrate. Shake vigorously for 2 min. Solution will be a milky white. Let stand 30 min with occasional shaking by inversion. Add 8 mL of NaOH (1 M, freshly made). Mix by slowly inverting the volumetric flask. The solution should clear. Bring up the volume to 50 mL. Store in a brown bottle wrapped in aluminum foil.
Caution: Reynold’s lead citrate is toxic and should be handled in a fume hood, while wearing appropriate personal protective equipment.
-
Degassed diH2O
Degas diH2O (750 mL) by boiling in a Erlenmeyer flask (1000 mL) for at least 30 min.
Use degassed diH2O for all solutions when preparing Reynold’s lead citrate to avoid precipitating lead carbonate.
4.3.3. Equipment
Disposables: Thermanox coverslips (13 mm diameter round), PES sterile filter units (0.2 μm pore size, 1 L volume), plastic Petri dishes (29 mm diameter, 90 mm diameter), pipette tips (10–100 μL), serological pipettes (5 mL, Fisher Scientific, Chicago, IL); Beem embedding capsules, formvar-coated copper 150 mesh TEM grids (EMS, Hatfield, PA); Parafilm, Whatman filter paper #4 (Sigma-Aldrich, St. Louis, MO)
pH meter
Cover slip holder for 9–13 mm cover slips (Tousimis, Rockville, MD)
Glassware: beakers (50 mL), volumetric flasks (10 mL, 50 mL)
Dewar or container for liquid nitrogen (any size)
Cryogen gloves
Oven (Model 3608, Labline)
Hot plate
Stereomicroscope (S4E, Leica)
Ultramicrotome (Ultracut S, Leica)
Diamond knife (Ultra 35°, Diatome)
Single-channel adjustable volume pipettes (100–1000, 20–200 μL, Eppendorf, Hamburg, Germany)
4.4. CELL CULTURE AND FIXATION
Follow protocol in Section 2 up to and including Section 2.8.
Place 13 mm diameter Thermanox plastic coverslips in the bottom of 29 mm diameter plates.
Seed PMCs at a density of approximately 100,000 cells per plate. Make sure to top media up to 2 mL, if necessary. Culture to desired stage as described in Section 2.
Immediately prior to fixation, prepare fixative solution. Incubate at temperature of PMC culture for 15 min.
At the desired time after fertilization, fix plates taking care to keep the cells submerged in some liquid, as meniscus forces can strip the cells off the plate. To do this, gradually replace media with fixative. For example, remove one-third of the volume of media, and then add volume of fixative equal to the volume removed. Swirl plate gently to mix. Next, remove two-third of the media, and replace with fixative. Finally, remove all media from the plate, and replace with 3 mL fixative. Always add fixative gently by pipetting down the sides of the plates.
Incubate cells in fixative for 1 h at 15°C. Store in fixative at 4°C overnight or until processing for TEM.
4.5. PROCESSING FOR TEM
Perform all subsequent steps in a fume hood unless otherwise noted. Gently remove coverslips from the well plate and stack in a cover slip holder. Place the holder in a glass beaker (10 mL).
Wash cover slips thrice with deionized water, letting the samples incubate for 1 h at room temperature after each wash.
After the final wash, remove holder from water and place in a glass beaker (10 mL) containing 8 mL 2% aqueous OsO4. Incubate for 1 h. Wash thrice with diH2O, letting the sample incubate in the wash solution for 1 h each time.
Dehydrate sample. To do so, transfer sample holder to a beaker containing a freshly-made solution of 30% (v/v) acetone in diH2O. Incubate for 30 min. Repeat this step using freshly made solutions of 50%, 70%, 90%, and 100% acetone. Finally, repeat the 100% acetone step once more.
-
Infiltrate sample with resin, still using the cover slip holder. To do so, transfer the holder from the beaker containing 100% acetone to a beaker containing a freshly made solution of 33% (v/v) resin in acetone. Incubate for 1 h. Repeat this step using freshly made solutions of 50%, 66%, and 100% resin, incubating for 2 h, overnight, and 1 h, respectively, each time transferring the samples to a new beaker. Repeat the final step twice more.
Caution: EMbed812 resin is toxic and a potential carcinogen until polymerized; it should be handled in a fume hood, using gloves. All waste should be polymerized before discarding.
Line a Petri dish (90 mm, plastic) with aluminum foil and place cover slips cell side up with a paper label under each cover slip. Remove lids from Beem embedding capsules (size 00), and fill capsules with fresh resin. Working quickly, invert capsules and, one by one, place on top of cover slips. Transfer the Petri dish into an oven and cure at 60°C for 24 h.
-
Submerge the blocks in liquid nitrogen (LN2) for several minutes. Wearing cryo-gloves, remove the blocks from LN2 and immediately snap off cover slips.
Caution: LN2 is extremely cold and handling blocks without cryo gloves will cause burns.
Identify regions of interest using a stereomicroscope. Trim the block face for sectioning using a razor blade. Create ultrathin sections for TEM using an ultramicrotome with a diamond knife and water bath.
Pick up sections on formvar-coated copper 150 mesh grids.
If post-staining is desired, float grids, section side down, on a 50 μL drop of aqueous uranyl acetate (2% (w/v)) on Parafilm for 10 min. Briefly rinse the grids with diH2O. Optionally, for lead staining, prepare a plastic Petri dish containing 5 NaOH pellets at the periphery to create a CO2-free atmosphere. Place the grids on a 50 μL drop of Reynold’s lead citrate on Parafilm within the dish for 7 min. Wash grids with CO2-free diH2O and let dry in air after wicking away excess moisture using filter paper.
4.6. IMAGING
Samples can be analyzed using conventional TEM or STEM in bright-field or dark-field modes (Fig. 14).
FIG. 14.

Electron microscope images of S. purpuratus PMCs grown in vitro, sectioned parallel to the cell culture substrate (“en face”). PMCs were treated with 4% (v/v) HS+300 ng/mL rVEGF (A, C) or 4% (v/v) HS (B), and were imaged at 48 hpf, using scanning TEM (STEM) and bright field contrast (A, C) or high angle annular darkfield (HAADF) contrast (B). Scale bar represents 2 μm.
5. ISOLATION OF RNA FROM PRIMARY MESENCHYME CELL CULTURES
5.1. BACKGROUND
Ernst, Hough-Evans, Britten, and Davidson (1980) isolated mRNA from micromere and embryo cultures and demonstrated that micromere mRNA is distinct from that of the 16-cell embryo. Harkey, Whiteley, and Whiteley (1988) created a cDNA library from polyadenylated RNAs isolated from PMCs in vitro, and discovered a number of transcripts specific to PMCs. Transcripts followed similar temporal expression patterns, thus providing further evidence of a unique skeletogenic transcriptome and regulation by transcript abundance. Zhu et al. (2001) extracted mRNA from PMC cultures, generating a library of expressed sequence tags (ESTs). The sequencing of the genome of S. purpuratus (Sodergren et al., 2006) transformed the field, and was quickly followed by the first transcriptomic analysis of the embryo in different developmental stages (Tu et al., 2012). A transcriptome of PMC isolated by FACS followed soon after (Barsi et al., 2014), yet required an extraordinary effort. We have very recently completed an RNA-seq analysis, comparing PMC treated in vitro with horse serum (HS, 4% (v/v) in artificial seawater), resulting in predominantly linear spicules, to PMC treated with 4% (v/v) HS+300 ng/mL rVEGF, resulting in triradiates (unpublished). As shown below, the amount of effort required for two treatment groups and four timepoints was miniscule compared to the experiment by Barsi and colleagues. However, while costs have come down considerably over the last 5years, they are still substantial.
5.2. OVERVIEW AND GENERAL REMARKS
This protocol is quite straightforward and uses a readily available kit optimized for small samples. In our hands, a yield of 2–3 μg of total RNA per 100,000 cells seeded is typical. RNA integrity is typically very high (RIN = 10). The amount of RNA recovered is sufficient to run many qPCR experiments (after reverse transcription to cDNA). At the current state of technology 250 ng to 1.5 μg total RNA is also sufficient to perform an RNA-seq analysis.
5.3. MATERIALS
5.3.1. Chemicals
NucleoSpin RNA XS Kit (Macherey-Nagel, Duren, Germany)
Ethanol (96–100%)
Ethanol (70% (v/v), aqueous)
5.3.2. Equipment
Disposables: 200-μL barrier tips, RNase free 1.5 mL Eppendorf tubes (Midwest Scientific, Valley Park, MO)
Single-channel adjustable volume pipettes (100–1000, 20–200 μL, Eppendorf, Hamburg, Germany)
SP Vortex Mixer (Baxter, Deerfield, IL)
Cell culture aspirator (see Section 2.3.3)
5.4. RNA PREP
-
After culturing cells in the appropriate medium for a desired period of time (as outlined in Section 2) remove all cell culture media by suction.
Incomplete removal of cell culture medium may reduce effectiveness of lysis buffer.
Directly add 200 μL of lysis buffer to each dish and swirl the plate.
Using a 200 μL pipette, aspirate and expel buffer several times to dislodge cells from the bottom of the plate.
Transfer the cells to an RNase free 1.5 mL Eppendorf tube. Vortex vigorously for 2–5 s.
Isolate RNA according to the manufacturer’s instructions.
ACKNOWLEDGMENTS
This work was supported by the National Science Foundation under Grants no. DMR-0805313, DMR-1106208, IOS-1456837, and DMR-1508399.
REFERENCES
- Addadi L, Raz S, & Weiner S (2003). Taking advantage of disorder: Amorphous calcium carbonate and its roles in biomineralization. Advanced Materials, 15, 959–970. [Google Scholar]
- Adomako-Ankomah A, & Ettensohn CA (2013). Growth factor-mediated mesodermal cell guidance and skeletogenesis during sea urchin gastrulation. Development, 140, 4214–4225. [DOI] [PubMed] [Google Scholar]
- Amemiya S (1989). Development of the basal lamina and its role in migration and pattern-formation of primary mesenchyme cells in sea-urchin embryos. Development, Growth & Differentiation, 31, 131–145. [DOI] [PubMed] [Google Scholar]
- Ameye L, Compere P, Dille J, & Dubois P (1998). Ultrastructure and cytochemistry of the early calcification site and of its mineralization organic matrix in Paracentrotus lividus (Echinodermata: Echinoidea). Histochemistry and Cell Biology, 110, 285–294. [DOI] [PubMed] [Google Scholar]
- Ameye L, Hermann R, & Dubois P (2000). Ultrastructure of sea urchin calcified tissues after high-pressure freezing and freeze substitution. Journal of Structural Biology, 131, 116–125. [DOI] [PubMed] [Google Scholar]
- Anstrom JA, & Raff RA (1988). Sea urchin primary mesenchyme cells—Relation of cell polarity to the epithelial-mesenchymal transformation. Developmental Biology, 130, 57–66. [DOI] [PubMed] [Google Scholar]
- Armstrong N, Hardin J, & McClay DR (1993). Cell-cell interactions regulate skeleton formation in the sea-urchin embryo. Development, 119, 833–840. [DOI] [PubMed] [Google Scholar]
- Armstrong N, & McClay DR (1994). Skeletal pattern is specified autonomously by the primary mesenchyme cells in sea urchin embryos. Developmental Biology, 162, 329–338. [DOI] [PubMed] [Google Scholar]
- Balinsky BI (1959). An electron microscopic investigation of the mechanisms of adhesion of the cells in a sea urchin blastula and gastrula. Experimental Cell Research, 16, 429–433. [DOI] [PubMed] [Google Scholar]
- Barsi JC, Tu Q, & Davidson EH (2014). General approach for in vivo recovery of cell type-specific effector gene sets. Genome Research, 24, 860–868. [DOI] [PMC free article] [PubMed] [Google Scholar]
- Beniash E, Addadi L, & Weiner S (1999). Cellular control over spicule formation in sea urchin embryos: A structural apporach. Journal of Structural Biology, 125, 50–62. [DOI] [PubMed] [Google Scholar]
- Benson S, & Chuppa S (1990). Differentiation in vitro of sea urchin micromeres on extracellular matrix in the absence of serum. Journal of Experimental Zoology, 256, 222–226. [Google Scholar]
- Benson S, Jones EME, Crise-Benson N, & Wilt F (1983). Morphology of the organic matrix of the spicule of the sea urchin larva. Experimental Cell Research, 148, 249–253. [DOI] [PubMed] [Google Scholar]
- Benson S, Smith L, Wilt F, & Shaw R (1990). The synthesis and secretion of collagen by cultured sea urchin micromeres. Experimental Cell Research, 188, 141–146. [DOI] [PubMed] [Google Scholar]
- Berman A, Addadi L, Kvick A, Leiserowitz L, Nelson M, & Weiner S (1990). Intercalation of sea urchin proteins in calcite: Study of a crystalline composite material. Science, 250, 664–667. [DOI] [PubMed] [Google Scholar]
- Chang IYT, & Joester D (2015a). Cryo-planing of frozen-hydrated samples using cryo triple ion gun milling (CryoTIGM (TM)). Journal of Structural Biology, 192, 569–579. [DOI] [PubMed] [Google Scholar]
- Chang IYT, & Joester D (2015b). Large area cryo-planing of vitrified samples using broad-beam ion milling. Microscopy and Microanalysis, 21, 1616–1621. [DOI] [PubMed] [Google Scholar]
- Cheers MS, & Ettensohn CA (2005). P16 is an essential regulator of skeletogenesis in the sea urchin embryo. Developmental Biology, 283, 384–396. [DOI] [PubMed] [Google Scholar]
- Decker GL, Morrill JB, & Lennarz WJ (1987). Characterization of sea urchin primary mesenchyme cells and spicules during biomineralization in vitro. Development, 101, 297–312. [DOI] [PubMed] [Google Scholar]
- Duloquin L, Lhomond G, & Gache C (2007). Localized VEGF signaling from ectoderm to mesenchyme cells controls morphogenesis of the sea urchin embryo skeleton. Development, 134, 2293–2302. [DOI] [PubMed] [Google Scholar]
- Emlet RB (1982). Echinoderm calcite—A mechanical analysis from larval spicules. Biological Bulletin, 163, 264–275. [Google Scholar]
- Erkenbrack EM, & Davidson EH (2015). Evolutionary rewiring of gene regulatory network linkages at divergence of the echinoid subclasses. Proceedings of the National Academy of Sciences of the United States of America, 112, E4075–E4084. [DOI] [PMC free article] [PubMed] [Google Scholar]
- Ernst SG, Hough-Evans BR, Britten RJ, & Davidson EH (1980). Limited complexity of the RNA in micromeres of sixteen-cell sea urchin embryos. Developmental Biology, 79, 119–127. [DOI] [PubMed] [Google Scholar]
- Ettensohn CA (1990). The regulation of primary mesenchyme cell patterning. Developmental Biology, 140, 261–271. [DOI] [PubMed] [Google Scholar]
- Ettensohn CA (2009). Lessons from a gene regulatory network: Echinoderm skeletogenesis provides insights into evolution, plasticity and morphogenesis. Development, 136, 11–21. [DOI] [PubMed] [Google Scholar]
- Ettensohn CA (2013). Encoding anatomy: Developmental gene regulatory networks and morphogenesis. Genesis, 51, 383–409. [DOI] [PubMed] [Google Scholar]
- Ettensohn CA, Guss KA, Hodor PG, & Malinda KM (1997). The morphogenesis of the skeletal system of the sea urchin embryo. In Collier J (Ed.), Vol. VIII. Progress in developmental biology. New York: Wiley and Sons. [Google Scholar]
- Ettensohn CA, & McClay DR (1986). The regulation of primary mesenchyme cell migration in the sea urchin embryo: Transplantations of cells and latex beads. Developmental Biology, 117, 380–391. [DOI] [PubMed] [Google Scholar]
- Ettensohn CA, & McClay DR (1987). A new method for isolating primary mesenchyme cells of the sea urchin embryo: Panning on wheat germ agglutinin-coated dishes. Experimental Cell Research, 168, 431–438. [DOI] [PubMed] [Google Scholar]
- Ettensohn CA, & McClay DR (1988). Cell lineage conversion in the sea urchin embryo. Developmental Biology, 125, 396–409. [DOI] [PubMed] [Google Scholar]
- Gao F, & Davidson EH (2008). Transfer of a large gene regulatory apparatus to a new developmental address in echinoid evolution. Proceedings of the National Academy of Sciences of the United States of America, 105, 6091–6096. [DOI] [PMC free article] [PubMed] [Google Scholar]
- Gibbins JR, Tilney LG, & Porter KR (1969). Microtubules in the formation and development of the primary mesenchyme in Arbacia punctulata: I. The distribution of microtubules. Journal of Cell Biology, 41, 201–226. [DOI] [PMC free article] [PubMed] [Google Scholar]
- Hagstrom BE, & Lonning S (1969). Time-lapse and electron microscopic studies of sea urchin micromeres. Protoplasma, 68, 271–288. [DOI] [PubMed] [Google Scholar]
- Harkey MA, & Whiteley AH (1983). The program of protein-synthesis during the development of the micromere primary mesenchyme cell-line in the sea-urchin embryo. Developmental Biology, 100, 12–28. [DOI] [PubMed] [Google Scholar]
- Harkey MA, Whiteley HR, & Whiteley AH (1988). Coordinate accumulation of five transcripts in the primary mesenchyme during skeletogenesis in the sea urchin embryo. Developmental Biology, 125, 381–395. [DOI] [PubMed] [Google Scholar]
- Hodor PG, & Ettensohn CA (1998). The dynamics and regulation of mesenchymal cell fusion in the sea urchin embryo. Developmental Biology, 199, 111–124. [DOI] [PubMed] [Google Scholar]
- Hwang SL, & Lennarz WJ (1993). Studies on the cellular pathway involved in assembly of the embryonic sea urchin spicule. Experimental Cell Research, 205, 383–387. [DOI] [PubMed] [Google Scholar]
- Ingersoll EP, McDonald KL, & Wilt FH (2003). Ultrastructural localization of spicule matrix proteins in normal and metalloproteinase inhibitor-treated sea urchin primary mesenchyme cells. Journal of Experimental Zoology Part A: Comparative Experimental Biology, 300, 101–112. [DOI] [PubMed] [Google Scholar]
- Karp GC, & Solursh M (1985). Dynamic activity of the filopodia of sea urchin embryonic cells and their role in directed migration of the primary mesenchyme in vitro. Developmental Biology, 112, 276–283. [DOI] [PubMed] [Google Scholar]
- Katow H, & Solursh M (1980). Ultrastructure of primary mesenchyme cell ingression in the sea urchin Lytechinus pictus. Journal of Experimental Zoology, 213, 231–246. [Google Scholar]
- Katow H, & Solursh M (1981). Ultrastructural and time-lapse studies of primary mesenchyme cell behavior in normal and sulfate-deprived sea urchin embryos. Experimental Cell Research, 136, 233–245. [DOI] [PubMed] [Google Scholar]
- Killian CE, & Wilt FH (2008). Molecular aspects of biomineralization of the echinoderm endoskeleton. Chemical Reviews, 108, 4463–4474. [DOI] [PubMed] [Google Scholar]
- Killian CE, & Wilt FH (2017). Endocytosis in primary mesenchyme cells during sea urchin larval skeletogenesis. Experimental Cell Research, 359, 205–214. [DOI] [PubMed] [Google Scholar]
- Kipryushina Y, & Odintsova N (2011). Effect of exogenous factors on the induction of spicule formation in sea urchin embryonic cell cultures. Russian Journal of Developmental Biology, 42, 342–348. [PubMed] [Google Scholar]
- Kitajima T, & Okazaki K (1980). Spicule formation in vitro by the descendants of the precocious mciromeres formed at the 8-cell stage of sea urchin embryo. Development, Growth & Differentiation, 22, 265–279. [DOI] [PubMed] [Google Scholar]
- Kitajima T, & Urakami H (2000). Differential distribution of spicule matrix proteins in the sea urchin embryo skeleton. Development, Growth & Differentiation, 42, 295–306. [DOI] [PubMed] [Google Scholar]
- Kiyomoto M, & Tsukahara J (1991). Spicule formation-inducing substance in sea urchin embryo. Development, Growth & Differentiation, 33, 443–450. [DOI] [PubMed] [Google Scholar]
- Knapp RT, Wu C-H, Mobilia KC, & Joester D (2012). Recombinant sea urchin vascular endothelial growth factor directs single-crystal growth and branching in vitro. Journal of the American Chemical Society, 134, 17908–17911. [DOI] [PubMed] [Google Scholar]
- Lippmann F (1973). Sedimentary carbonate minerals. New York: Springer. [Google Scholar]
- Malinda KM, Fisher GW, & Ettensohn CA (1995). Four-dimensional microscopic analysis of the filopodial behavior of primary mesenchyme cells during gastrulation in the sea urchin embryo. Developmental Biology, 172, 552–566. [DOI] [PubMed] [Google Scholar]
- Markel K, Roser U, Mackenstedt U, & Klostermann M (1986). Ultrastructural investigation of matrix-mediated biomineralization in echinoids (echinodermata, echinoida). Zoomorphology, 106, 232–243. [Google Scholar]
- Markel K, Roser U, & Stauber M (1989). On the ultrastructure and the supposed function of the mineralizing matrix coat of sea urchins (echinodermata, echinoida). Zoomorphology, 109, 79–87. [Google Scholar]
- Miller J, Fraser SE, & McClay D (1995). Dynamics of thin filopodia during sea urchin gastrulation. Development, 121, 2501–2511. [DOI] [PubMed] [Google Scholar]
- Millonig G (1970). A study on the formation and structure of the sea urchin spicule. Journal of Submicroscopic Cytology and Pathology, 2, 157–165. [Google Scholar]
- Odintsova NA, Ageenko NV, Kipryushina YO, Maiorova MA, & Boroda AV (2015). Freezing tolerance of sea urchin embryonic cells: Differentiation commitment and cytoskeletal disturbances in culture. Cryobiology, 71, 54–63. [DOI] [PubMed] [Google Scholar]
- Okazaki K (1975). Spicule formation by isolated micromeres of the sea urchin embryo. Integrative and Comparative Biology, 15, 567–581. [Google Scholar]
- Oliveri P, Davidson EH, & McClay DR (2003). Activation of pmar1 controls specification of micromeres in the sea urchin embryo. Developmental Biology, 258, 32–43. [DOI] [PubMed] [Google Scholar]
- Oliveri P, Tu Q, & Davidson EH (2008). Global regulatory logic for specification of an embryonic cell lineage. Proceedings of the National Academy of Sciences of the United States, 105, 5955–5962. [DOI] [PMC free article] [PubMed] [Google Scholar]
- Page L, & Benson S (1992). Analysis of competence in cultured sea urchin micromeres. Experimental Cell Research, 203, 305. [DOI] [PubMed] [Google Scholar]
- Piacentino ML, Ramachandran J, & Bradham CA (2015). Late Alk4/5/7 signaling is required for anterior skeletal patterning in sea urchin embryos. Development, 142, 943–952. [DOI] [PubMed] [Google Scholar]
- Politi Y, Metzler RA, Abrecht M, Gilbert B, Wilt FH, Sagi I, et al. (2008). Transformation mechanism of amorphous calcium carbonate into calcite in the sea urchin larval spicule. Proceedings of the National Academy of Sciences of the United States of America, 105, 17362–17366. [DOI] [PMC free article] [PubMed] [Google Scholar]
- Poustka AJ, Wilt FH, & Mann K (2010). Proteomic analysis of sea urchin (Strongylocentrotus purpuratus) spicule matrix. Proteome Science, 8, 33. [DOI] [PMC free article] [PubMed] [Google Scholar]
- Rafiq K, Cheers MS, & Ettensohn CA (2011). The genomic regulatory control of skeletal morphogenesis in the sea urchin. Development, 139, 579–590. [DOI] [PubMed] [Google Scholar]
- Revilla-I-Domingo R, Oliveri P, & Davidson EH (2007). A missing link in the sea urchin embryo gene regulatory network: hesC and the double-negative specification of micromeres. Proceedings of the National Academy of Sciences of the United States of America, 104, 12383–12388. [DOI] [PMC free article] [PubMed] [Google Scholar]
- Röttinger E, Sadumenont A, Duboc V, Besnardeau L, McClay D, & Lepage T (2008). FGF signals guide migration of mesenchymal cells, control skeletal morphogenesis and regulate gastrulation during sea urchin development. Development, 135, 353–365. [DOI] [PubMed] [Google Scholar]
- Schoenwolf GC (2001). Laboratory studies of vertebrate and invertebrate embryos (8th ed.). Upper Saddle River, NJ: Prentice Hall. [Google Scholar]
- Sepúlveda-Ramírez SP, Toledo-Jacobo L, Henson JH, & Shuster CB (2018). Cdc42 controls primary mesenchyme cell morphogenesis in the sea urchin embryo. Developmental Biology, 437, 140–151. [DOI] [PMC free article] [PubMed] [Google Scholar]
- Sharma T, & Ettensohn CA (2010). Activation of the skeletogenic gene regulatory network in the early sea urchin embryo. Development, 137, 1149–1157. [DOI] [PubMed] [Google Scholar]
- Shashikant T, Khor JM, & Ettensohn CA (2018). Global analysis of primary mesenchyme cell cis-regulatory modules by chromatin accessibility profiling. BMC Genomics, 19. [DOI] [PMC free article] [PubMed] [Google Scholar]
- Sodergren E, Weinstock GM, Davidson EH, Cameron RA, Gibbs RA, Weinstock GM, et al. (2006). The genome of the sea urchin Strongylocentrotus purpuratus. Science, 314, 941–952. [DOI] [PMC free article] [PubMed] [Google Scholar]
- Stephens L, Kitajima T, & Wilt F (1989). Autonomous expression of tissue-specific genes in dissociated sea-urchin embryos. Development, 107, 299–307. [DOI] [PubMed] [Google Scholar]
- Taylor E, & Heyland A (2018). Thyroid hormones accelerate initiation of skeletogenesis via MAPK (ERK1/2) in larval sea urchins (Strongylocentrotus purpuratus). Frontiers in Endocrinology, 9. [DOI] [PMC free article] [PubMed] [Google Scholar]
- Tester C, Wu C, Krejci MR, Mueller L, Park A, Lai B, et al. (2013). Time-resolved evolution of short- and long-range order during the transformation of amorphous calcium carbonate to calcite in the sea urchin embryo. Advanced Functional Materials, 23, 4185–4194. [Google Scholar]
- Tu Q, Cameron RA, Worley KC, Gibbs RA, & Davidson EH (2012). Gene structure in the sea urchin Strongylocentrotus purpuratus based on transcriptome analysis. Genome Research, 22, 2079–2087. [DOI] [PMC free article] [PubMed] [Google Scholar]
- Urry LA, Hamilton PC, Killian CE, & Wilt FH (2000). Expression of spicule matrix proteins in the sea urchin embryo during normal and experimentally altered spiculogenesis. Developmental Biology, 225, 201–213. [DOI] [PubMed] [Google Scholar]
- Vidavsky N, Addadi S, Mahamid J, Shimoni E, Ben-Ezra D, Shpigel M, et al. (2014). Initial stages of calcium uptake and mineral deposition in sea urchin embryos. Proceedings of the National Academy of Sciences of the United States of America, 111, 39–44. [DOI] [PMC free article] [PubMed] [Google Scholar]
- Vidavsky N, Addadi S, Schertel A, Ben-Ezra D, Shpigel M, Addadi L, et al. (2016). Calcium transport into the cells of the sea urchin larva in relation to spicule formation. Proceedings of the National Academy of Sciences of the United States of America, 113, 12637–12642. [DOI] [PMC free article] [PubMed] [Google Scholar]
- Vidavsky N, Masic A, Schertel A, Weiner S, & Addadi L (2015). Mineral-bearing vesicle transport in sea urchin embryos. Journal of Structural Biology, 192, 358–365. [DOI] [PubMed] [Google Scholar]
- Wilt FH (2005). Developmental biology meets materials science: Morphogenesis of biomineralized structures. Developmental Biology, 280, 15–25. [DOI] [PubMed] [Google Scholar]
- Wilt FH, & Benson SC (2004). Isolation and culture of micromeres and primary mesenchyme cells. Methods in Cell Biology, 74, 273–285. [DOI] [PubMed] [Google Scholar]
- Wilt FH, Hamilton P, Benson S, & Kitajima T (2000). Culture of micromeres of Strongylocentrotus purpuratus in vitro. Developmental Biology, 225, 212–213. [Google Scholar]
- Wolpert L, & Mercer EH (1963). An electron microscope study of the development of the blastula of the sea urchin embryo and its radial polarity. Experimental Cell Research, 30, 280–300. [DOI] [PubMed] [Google Scholar]
- Wu C-H (2013). Bioengineering single crystal growth. In Materials science and engineering. Northwestern University. PhD. [Google Scholar]
- Wu C-H, Park A, & Joester D (2011). Bioengineering single crystal growth. Journal of the American Chemical Society, 133, 1658–1661. [DOI] [PubMed] [Google Scholar]
- Zhu X, Mahairas G, Illies M, Cameron RA, Davidson EH, & Ettensohn CA (2001). A large-scale analysis of mRNAs expressed by primary mesenchyme cells of the sea urchin embryo. Development, 128, 2615–2627. [DOI] [PubMed] [Google Scholar]