

Abstract
Background:
Bone stress injuries (BSIs) are a major source of functional impairment in athletes of all sports, with many risk factors, including athlete characteristics and type of sport. In National Collegiate Athletic Association (NCAA) athletics, the stratification of programs into divisions with different characteristics and makeup has been identified as increasing the risk for certain kinds of injuries, but there have been no studies on the difference of BSI rates and characteristics between athletes in Division I (DI) and those in Divisions II and III (DII and DIII).
Purpose/Hypothesis:
To characterize the BSI rates in each division and compare the incidence and characteristics of BSIs within divisions. Our hypothesis was that BSI rates would be higher in DII and DIII athletes as compared with DI athletes.
Study Design:
Descriptive epidemiology study.
Methods:
Five years of recorded BSI data in collegiate athletes via the NCAA Injury Surveillance Program were examined for the academic years 2009-2010 to 2013-2014. BSI rates per 100,000 athlete-exposures (AEs) were compared for DI versus DII and DIII athletes using risk ratios and 95% CIs. Time lost to injury, time of season of injury, and class composition of injured athletes were also compared between divisions.
Results:
Over the 5 years studied, DII and DIII programs reported 252 BSIs more than 1,793,777 AEs (14.05 per 100,000 AEs), and DI programs reported 235 BSIs over 2,022,592 AEs (11.62 per 100,000 AEs). The risk ratio was significant for D1 versus DII and DIII (1.21; 95% CI, 1.01-1.44). There was a significant difference in time lost to injury in DI versus DII and DIII, χ2(5, n = 449) = 16.54; P = .006. When data were stratified by individual sport, there were no significant divisional differences in high-risk sports.
Conclusion:
In the current study, NCAA DII and DIII athletes had higher rates of BSI than their DI counterparts. As compared with DII and DIII athletes, the DI athletes had a significantly greater proportion of BSIs that did not result in absence from participation in sport.
Keywords: stress fracture, bone stress injury, NCAA
Bone stress injuries (BSIs) are frequent in sport, affecting athletes of all skill levels. 13,18,32 BSIs include a spectrum of disease, from an acute stress reaction to a late-stage stress fracture. 23,32 BSIs occur as a result of repetitive stress on injured bone with deficient elastic resistance, resulting in structural fatigue and localized bone pain. 9,23,32 The reported incidence of BSIs in collegiate athletes is significantly greater than that in high school athletes of the same sports, likely because of the greater intensity of training that occurs at the collegiate level. 4,25,27 Identified risk factors for stress fracture in collegiate athletes include repetitive-impact sport training (cross-country, gymnastics, and track and field), body mass index <19, insufficient calcium and vitamin D levels, and female sex. 1,25,31,32,34
There are 3 divisions of National Collegiate Athletic Association (NCAA) sports: Divisions I to III (DI-DIII). Prior sport-specific studies have shown significant differences in body composition, power, biomechanics, performance, and concussion rates when comparing college athletes in different divisions. 2,11,24,28,30 Other injuries, including anterior cruciate ligament injuries, 12 all knee ligament injuries, 20 and in-season football injuries, 6 were found to not significantly differ among DI, DII, and DIII athletes. In a 2007 study of overall injuries, DI athletes had a smaller relative risk of injury than DII and DIII athletes combined. 14 In spite of these divisional differences, the majority of sports injury research focuses either on DI sports or on all 3 divisions without differentiation among them. DII/DIII athletes and health professionals responsible for these athletes must thus extrapolate from data that are biased toward DI athletes to inform injury surveillance, prognosis, and management.
Prior research in NCAA athletes has examined the incidence of BSIs in specific sports, populations, and collegiate athletes as a whole. Risk factors for BSI and BSI impact on sports participation have been studied in DI athletes. Similar sport-specific data for DII/DIII athletics could better inform health professionals taking care of these athletes, which in turn could expedite diagnosis and help direct prevention efforts to mitigate BSIs. Avoiding delay in diagnosis is important, as delays have been associated with higher-grade BSI and longer recovery times. 8,21 We are not aware of any study that has evaluated NCAA BSIs based on divisional status or provided a detailed report of sport-specific injury rates in non-DI programs. As other musculoskeletal injuries have been shown to have divisional differences, the purpose of our study was to characterize the BSI rates in each division and to examine differences in incidence and characteristics of BSI within divisions. We hypothesized that there would be higher rates of BSI in DII/DIII athletes as compared with DI athletes.
Methods
The study was approved by the research review board of the NCAA. Data were obtained from the NCAA Injury Surveillance Program (NCAA-ISP) for all stress injuries for academic years 2009-2010 through 2013-2014. The NCAA-ISP has evolved in the past 20 years into an electronic data-collection system to gather information from colleges nationwide. 17 Information is amassed for each reported sports-related injury, including injury site, athlete characteristics, loss of activity attributed to injury, and type of injury. The criteria for reported injuries are as follows: injuries that “(1) occurred as a result of participation in an organized intercollegiate practice or competition, (2) required attention from an athletic trainer (AT) or physician, and (3) resulted in restriction of the student-athlete’s participation for 1 or more days beyond the day of injury.” 17 Beginning in the 2009-2010 academic year, non–time loss injuries were also monitored, defined as an “injury that was evaluated or treated (or both) by an AT or physician but did not result in restriction from participation for more than 1 day.” 17 Twelve men’s sports and 13 women’s sports are reported.
Injuries are voluntarily reported by ATs. Associated data for each injury include academic year, sport, NCAA division, event type (team practice vs scheduled game), basic and specific mechanism of injury, activity and location at time of injury, player position, player class year, and injury outcome (time lost to injury, specific injury code and body part affected, and chronicity of injury). ATs also report number of athlete exposures, defined as “1 student-athlete participating in 1 NCAA-sanctioned practice or competition in which he or she was exposed to the possibility of athletic injury, regardless of the time associated with that participation.” 17 This includes practices, games, and team-sponsored pre- and postseason activities.
The NCAA-ISP was queried for the following diagnoses: humeral stress fracture, pars stress fracture/reaction, pubis stress fracture, femoral stress fracture, medial tibial stress syndrome (shin splints), tibial stress fracture, fibular stress fracture, talar stress fracture, calcaneal stress fracture, cuboid stress fracture, navicular stress fracture, cuneiform stress fracture, metatarsal (1st) stress fracture, metatarsal (2-4) stress fracture, metatarsal (5th) stress fracture, stress reaction, and anterior tibial stress syndrome.
We elected to combine the DII and DIII data for several reasons. First, as noted, prior research has demonstrated athlete differences at the DI level versus the DII and DIII levels. Second, the support staff, budgets, and resources for athletics in DII and DIII are much closer to each other than to DI. Third, our data contained a much small number of documented injuries and athlete-exposures (AEs) at DII schools than either DI or DIII schools. Combining DII and DIII data resulted in AE sample sizes relatively more equal to DI data and allowed sport-specific comparisons.
Statistical Analysis
Relative risk was calculated to examine differences in BSIs between divisions by sport and sex. Relative risk was calculated by the following formula:
If the 95% CI for the risk ratio did not include the value of 1, the comparison was considered statistically significant.
Time lost attributed to injury is tracked in the NCAA-ISP and monitored by data quality control staff and automated systems. Time lost was analyzed to allow comparison between divisions regarding time to return to sport. To evaluate whether time lost to injury differed significantly between DI and DII/DIII athletes, injuries were separated into 6 categories: no time lost, 1 to 7 days, 8 to 14 days, 15 to 21 days, 22 to 28 days, and >28 days. Of the 487 injuries, 17 were reported with no associated time lost to injury and were thus excluded from this portion of the analysis. Initial statistical testing was performed with a chi-square test with significance set at P < .05. Subsequent pairwise testing was performed with a Fisher exact test with a Bonferroni correction, with significance set at α/n (.05/6 = .008).
Analysis of class composition of injuries in each division was accomplished with a chi-square test. Statistical significance was recognized as P < .05. Data were analyzed using Prism Version 8.0.0 (GraphPad).
Results
During the 5 academic years of 2009-2010 to 2013-2014, a total of 487 BSIs were reported to the NCAA during 3,816,369 AEs, for a combined rate of 12.76 BSIs per 100,000 AEs. DI was responsible for 235 injuries during 2,022,592 AEs (11.62 per 100,000 AEs). DII BSIs totaled 48 injuries over 532,774 AEs (14.84 per 100,000 AEs), and DIII BSIs totaled 204 injuries over 1,261,003 (16.18 per 100,000 AEs). The combined BSIs for DII and DIII were 252 over 1,793,777 AEs (14.05 per 100,000 AEs) (Table 1).
Table 1.
BSIs Stratified by Sport and NCAA Division a
| BSIs | AEs | Injury Rates per 100,000 AEs | |||||
|---|---|---|---|---|---|---|---|
| Sport | DI | DII/DIII | DI | DII/DIII | DI | DII/DIII | Risk Ratio, DII/DIII: DI (95% CI) b |
| All sports | |||||||
| Male | 90 | 91 | 1,260,027 | 1,078,425 | 7.14 | 8.44 | 1.18 (0.88-1.58) |
| Female | 145 | 161 | 762,565 | 715,352 | 19.01 | 22.51 | 1.18 (0.94-1.48) |
| Total | 235 | 252 | 2,022,592 | 1,793,777 | 11.62 | 14.05 | 1.21 (1.01-1.44) |
| Baseball: male | 5 | 1 | 74,754 | 103,238 | 6.69 | 0.97 | 0.14 (0.01-1.23) |
| Basketball | |||||||
| Male | 8 | 13 | 80,499 | 135,299 | 9.94 | 9.61 | 0.97 (0.4-2.33) |
| Female | 19 | 22 | 71,339 | 123,522 | 26.63 | 17.81 | 0.67 (0.36-1.23) |
| Total | 27 | 35 | 151,838 | 258,821 | 17.78 | 13.52 | 0.76 (0.46-1.25) |
| Cross-country | |||||||
| Male | 16 | 13 | 23,024 | 23,237 | 69.49 | 55.95 | 0.81 (0.38-1.67) |
| Female | 17 | 12 | 21,675 | 22,831 | 78.43 | 52.56 | 0.67 (0.31-1.4) |
| Total | 33 | 25 | 44,699 | 46,068 | 73.83 | 54.27 | 0.74 (0.43-1.23) |
| Field hockey: female | 1 | 2 | 30,580 | 6695 | 3.27 | 29.87 | 9.14 (0.82-100.76) |
| Football: male | 24 | 18 | 527,770 | 371,455 | 4.55 | 4.85 | 1.07 (0.57-1.96) |
| Gymnastics: female | 12 | 9 | 23,326 | 21,995 | 51.44 | 40.92 | 0.80 (0.33-1.88) |
| Ice hockey | |||||||
| Male | 1 | 1 | 163,098 | 120,033 | 0.61 | 0.83 | 1.36 (0.08-21.72) |
| Female | 0 | 0 | 54,509 | 58,653 | 0.00 | 0.00 | — |
| Total | 1 | 1 | 217,607 | 178,686 | 0.46 | 0.56 | 1.22 (0.07-19.47) |
| Lacrosse | |||||||
| Male | 9 | 10 | 88,339 | 72,136 | 10.19 | 13.86 | 1.36 (0.55-3.34) |
| Female | 9 | 15 | 67,447 | 38,100 | 13.34 | 39.37 | 2.95 (1.29-6.74) |
| Total | 18 | 25 | 155,786 | 110,236 | 11.55 | 22.68 | 1.96 (1.07-3.59) |
| Soccer | |||||||
| Male | 5 | 10 | 60,977 | 98,711 | 8.20 | 10.13 | 1.24 (0.42-3.61) |
| Female | 14 | 29 | 89,191 | 126,555 | 15.70 | 22.91 | 1.46 (0.77-2.76) |
| Total | 19 | 39 | 150,168 | 225,266 | 12.65 | 17.31 | 1.37 (0.79-2.36) |
| Softball: female | 8 | 13 | 71,225 | 90,200 | 11.23 | 14.41 | 1.28 (0.53-3.09) |
| Swimming | |||||||
| Male | 1 | 0 | 75,734 | 21,075 | 1.32 | 0.00 | — |
| Female | 3 | 0 | 92,670 | 16,341 | 3.24 | 0.00 | — |
| Total | 4 | 0 | 168,404 | 37,416 | 2.38 | 0.00 | — |
| Tennis | |||||||
| Male | 4 | 2 | 17,351 | 8310 | 23.05 | 24.07 | 1.04 (0.19-5.7) |
| Female | 4 | 4 | 92,670 | 29,090 | 4.32 | 13.75 | 3.19 (0.79-12.73) |
| Total | 8 | 6 | 110,021 | 37,400 | 7.27 | 16.04 | 2.21 (0.76-6.35) |
| Track and field: indoor | |||||||
| Male | 11 | 19 | 53,375 | 54,678 | 20.61 | 34.75 | 1.69 (0.8-3.54) |
| Female | 29 | 24 | 42,907 | 58,585 | 67.59 | 40.97 | 0.61 (0.35-1.04) |
| Total | 40 | 43 | 96,282 | 113,263 | 41.54 | 37.96 | 0.91 (0.59-1.4) |
| Track and field: outdoor | |||||||
| Male | 6 | 0 | 57,723 | 28,906 | 10.39 | 0.00 | — |
| Female | 19 | 7 | 38,451 | 32,660 | 49.41 | 21.43 | 0.43 (0.18-1.03) |
| Total | 25 | 7 | 96,174 | 61,566 | 25.99 | 11.37 | 0.44 (0.18-1.01) |
| Volleyball: female | 10 | 24 | 66,575 | 90,125 | 15.02 | 26.63 | 1.77 (0.84-3.7) |
| Wrestling: male | 0 | 4 | 37,383 | 41,347 | 0.00 | 9.67 | — |
a Bold signifies statistical significance (ie, 95% CI of the risk ratio did not include the value 1). AE, athlete-exposure; BSI, bone stress injury; DI, Division I; DII/DIII, Divisions II and III; NCAA, National Collegiate Athletic Association.
b When 1 or both divisions reported no BSIs, calculation of risk ratio and 95% CI was not possible (indicated by dashes).
The overall relative risk of BSI was significantly greater for DII/DIII athletes than for DI (Table 1). When stratified by sport, BSI relative risk was significantly increased for only lacrosse (Figure 1). When stratified by sex, male and female DII/DIII athletes had a higher BSI rates, but the increase as compared with DI was not statistically significant (Figures 2 and 3). Female DII/DIII athletes were significantly more likely to be diagnosed with a BSI in lacrosse, but when all sports were combined, the risk ratio was 1.18 and nonsignificant.
Figure 1.
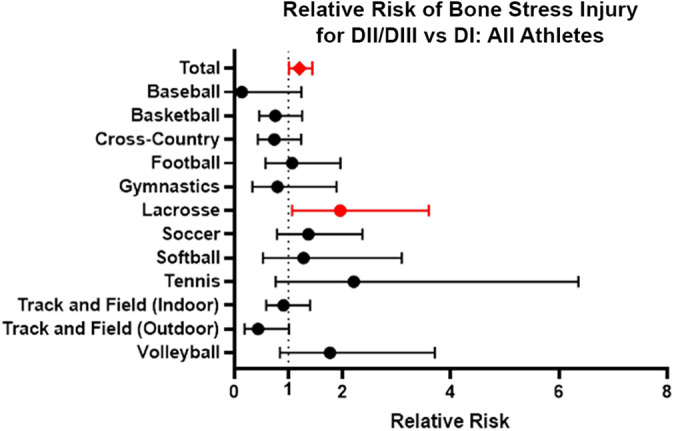
Relative risk of bone stress injury for all DII and DIII athletes versus DI athletes both overall and stratified by sport. The dots indicate relative risk, and the error bars indicate 95% CIs. Red indicates statistical significance (ie, 95% CI of the risk ratio did not include the value 1). DI-DIII, Divisions I-III.
Figure 2.
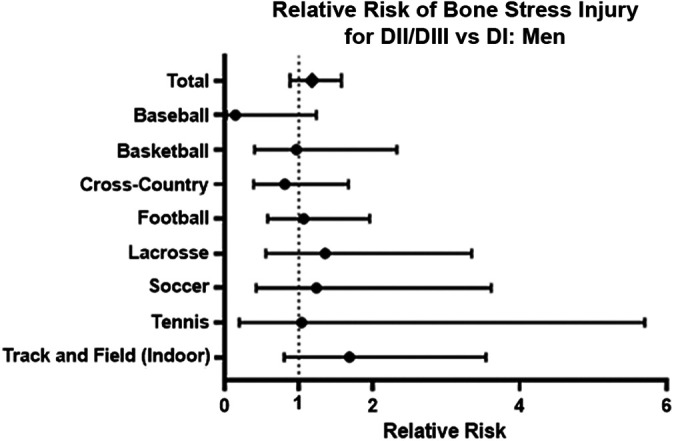
Relative risk of bone stress injury for all male DII and DIII athletes versus DI athletes both total and stratified by sport. The dots indicate relative risk, and the error bars indicate 95% CIs. Some sports are excluded, as the relative risk could not be calculated as the result of the incidence of 0 injuries in either DI or DII/DIII. DI-DIII, Divisions I-III.
Figure 3.
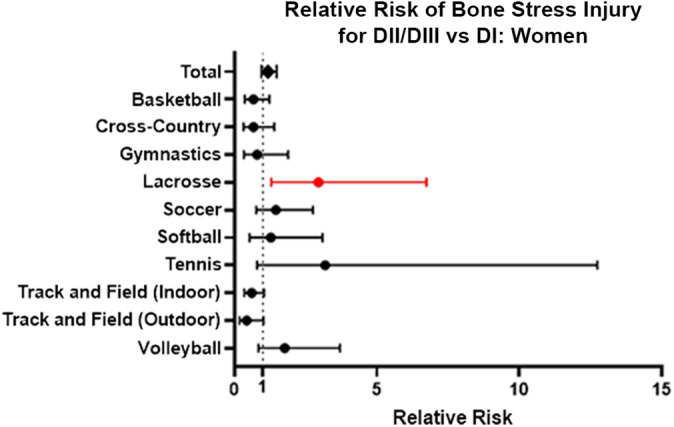
Relative risk of bone stress injury for all female DII and DIII athletes versus DI athletes both total and stratified by sport. The dots indicate relative risk, and the error bars indicate 95% CIs. Red indicates statistical significance (ie, 95% CI of the risk ratio did not include the value 1). Some sports are excluded, as the relative risk could not be calculated as the result of the incidence of 0 injuries in either DI or DII/DIII. DI-DIII, Divisions I-III.
DI and DII/DIII athletes were more likely to experience BSIs in the preseason than the regular season (risk ratio, 1.71 [95% CI, 1.31-2.23]; risk ratio, 1.98 [95% CI, 1.54-2.54], respectively). There was no significant difference in injury rates in the preseason versus regular season versus postseason between DI and DII/DIII athletes.
The distribution of time lost was significantly different between DI and DII/DIII athletes, χ2(5, n = 449) = 16.54; P = .006 (Figure 4). A significantly greater proportion of athletes in DI did not have any loss of playing time (160/216) as compared with DII/DIII athletes (136/233) (P < .001), and a significantly greater proportion of DII/DIII athletes (39/233) than DI athletes (17/216) (P = .006) missed between 1 and 7 days of playing time.
Figure 4.
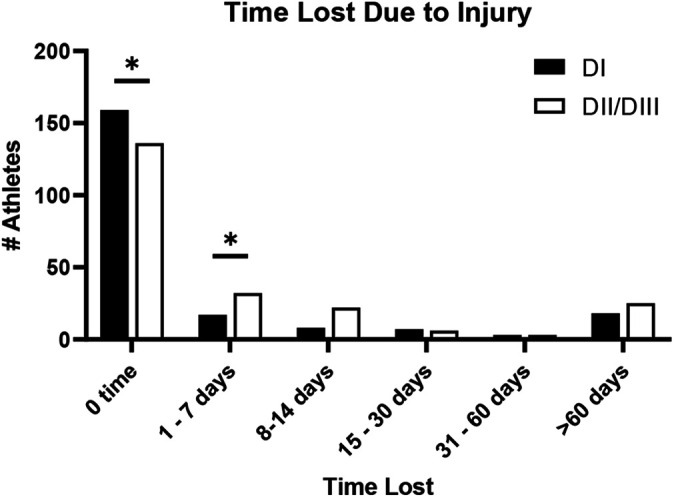
Time lost due to injury between DI and DII/DIII athletes. *P < (.05/n) = P < .008. DI-DIII, Divisions I-III.
The class composition of BSIs did not differ significantly between DI and DII/DIII athletes, χ2 (3, N = 424) = 4.41; P = .221. Combined, NCAA freshman athletes represented 36% of the total injuries; sophomores, 27%; juniors, 25%; seniors, 15%; and fifth year, 1% (Figure 5).
Figure 5.
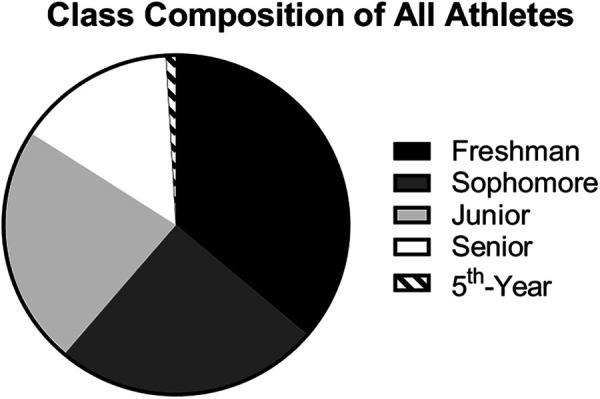
Class composition of all athletes diagnosed with bone stress injury.
Discussion
The purpose of this investigation was to compare the rate of BSI among NCAA DI athletes with their DII and DIII counterparts. Our most important finding is a significantly greater rate of BSI in DII and DIII athletes than DI athletes. This increased rate of BSI in DII and DIII athletes supports our hypothesis that BSI rates are higher than that for DI student athletes. Our hypothesis was based on the assumption that although the increased intensity of training load in DI programs would hypothetically increase the number of BSIs, this discrepancy would be offset to a greater degree by DII and DIII athletic programs’ relative athletic department resources and differences in athlete body composition. Our study findings are important because there is a relative lack of injury risk data in college athletes specific to DII/III, a gap that our study addresses. Moreover, as delay in BSI diagnosis has been associated with greater recovery time and higher-grade BSI, understanding risk in specific sports populations helps guide the sports medicine team; our results serve as a reminder that ATs, coaches, and athletes in all NCAA divisions should maintain a high clinical suspicion for BSIs and promptly work up suspected cases. Likewise, sports medicine staff should have a low threshold for early intervention for potential BSIs, including training modification, increased rest, targeted rehabilitation, and nutritional interventions. Furthermore, this study suggests a role for increased athlete and AT education in DII and DIII athletic programs in early identification of BSI to facilitate intervention. Although the impact of specific preventive measures is beyond the scope of our study, we recommend that athletic departments and their sports medicine programs, particularly those in DII and DIII, evaluate their incidence of BSIs and take proactive measures to increase sports medicine support and education regarding diagnosis, treatment, and prevention of BSIs.
When stratified by individual sport, the highest-risk groups for BSI (ie, women’s cross-country, women’s track, women’s gymnastics) did not differ significantly between divisions. 32 This finding indicates that the difference in BSI rates between divisions is driven by sports not associated with an especially high risk of BSI. This finding means that while intervention and prevention efforts to decrease BSIs across all NCAA divisions in high-risk sports (cross-country, track and field, and gymnastics) should continue, ATs and physicians for DII and DIII teams should be particularly cognizant of the risk in other sports not traditionally associated with BSIs.
The 1 sport that did demonstrate significantly elevated risk for BSI in DII/III athletes was lacrosse. As one of the nation’s fastest-growing sports, lacrosse offers a unique injury profile of participants, as injuries are similar to those of other contact sports but with a resemblance to injuries in other stick-wielding sports. 7 The varied training surfaces that this unique sport requires, especially since training occurs in the winter and competition in the spring, may act as a risk factor for stress fractures. 16 DII and DIII athletes may have reduced access to training surfaces, which may exacerbate BSIs. This significant value in women’s sports does contribute to the overall significance in combined women’s sports for increased risk of BSI in DII and DIII athletics.
In addition to the clinical impact of our findings, our study highlights a need for further research focused on injury epidemiology in the DII and DIII athlete populations, as their injury-risk profiles significantly differed from DI, which is the athlete population more commonly studied in sports medicine research. 35 There are known differences between divisions. DI programs benefit from increased resources for supporting training staff and funding continuous education. DII and DIII ATs have been shown to score lower on concussion guideline adherence than DI ATs, with respondents indicating a lack of funding or staffing to be the reason for not performing suggested baseline tests. 3 DI programs, on average, employ significantly more full-time certified ATs (6.1) than DII and DIII programs (3.2 and 2.8, respectively), even though the number of athletes per program is relatively equal among all 3 divisions. 10 Although there was no divisional difference in coaches’ perceptions of the quality of care provided by ATs, 5 DI programs with larger relative budgets are often able to hire more specialized staff. This translates into differences in study-supported training programs, although certification of coaching staff may play a greater role than divisional status. 15 These differences in resources per athlete and for each athletic program as a whole may affect the decreased rates of BSI in DI athletes versus DII and DIII, as better facilities and increased ratios of AT to athlete may translate into increased diagnostic capability and the ability to detect injuries before they progress into activity-restricting BSIs. Improved training surfaces and a greater number of specialized training staff may also be factors that affect BSI incidence. In addition, our findings lead us to suspect that there may be additional division-specific injury risks that future research could detect.
Various preventive strategies have been proposed, yet few have been validated in large studies and studied in collegiate athletes. Strategies include addressing abnormal biomechanics and considering shock-absorbing shoe inserts, 26 supplementing with daily calcium 19 and vitamin D, 33 ensuring adequate rest and a progressive increase in physical activity, 26 and modifying identified risk factors such as smoking and drinking >10 alcoholic drinks per week. 22 Athlete education can include the female athlete triad and subsequent increased risk of injury, proper nutrition and supplementation to optimize energy availability, and strength and conditioning programs to optimize biomechanics that prevent training overload (eg, incorporating strength training sessions in cross-country workouts to improve core strength and prevent decline in form that occurs with fatigue at the end of training sessions or races). 1 DII and DIII athletes, coaches, and ATs should consider the higher rates of BSIs and target education toward prevention and rapid diagnosis to avoid more severe injury, surgery, treatment complications, and long-term absence from activity.
By design, our research focused on the period after the 2009-2010 academic year. Data in the NCAA-ISP before the 2009-2010 academic year are subject to more significant limitations, such as nonautomated reporting systems, not automatically including injuries resulting in no time lost, not accounting for inactive players, and manual data quality control as opposed to automated verification. 17 We believe that reporting non–time loss injuries is important, as they provide some measure of how closely athletes are being evaluated for BSIs.
Interestingly, we found a significantly greater rate of no time loss in DI athletes. We suspect that multiple factors underpin this finding. First, given the higher level of competition, athletes may choose or be permitted to play through injury after a diagnosis of BSI. Additionally, early and aggressive identification in DI athletics potentially related to the greater presence of ATs may help sports medicine teams intervene early with training modifications and rehabilitation, allowing athletes to continue competing. Another possibility is that with a lesser presence of ATs, no time-loss injuries may not be reported as frequently in DII/DIII. In turn, some of these mild injuries may progress to more limiting injuries that the greater number of ATs and sport-specific ATs in DI may have been able to diagnose earlier as a less severe injury. Continued activity after BSI diagnosis can lead to worsening injury, increased pain, and chronic recurrence, thus affecting future athletic performance and underscoring the importance of this study. 8,21,29
We are aware of limitations to our study. There are inherent limitations in the use of the NCAA-ISP. Most notably, given the large number of ATs inputting injuries into the NCAA-ISP, there is heterogeneity in the data set. Likewise, documented BSIs in this data set represent a spectrum of injury—from clinical bony stress reactions that athletes played on to imaging-confirmed stress fractures, with the most severe cases likely requiring surgery—so there is a wide range of pathology indicated as being positive for BSI. While magnetic resonance imaging is the gold standard for confirming the presence of a stress fracture, 29 the NCAA-ISP does not require imaging confirmation to make this diagnosis. The NCAA-ISP makes available AEs, not the total number of athletes, and does not measure duration or intensity of each AE, each of which could affect BSI risk. In addition, injury reports to the NCAA-ISP are voluntary, and adherence rates may vary, especially for non-DI athletic programs. We suspect that the greater AT concentration and specialization and the greater training room and sports medicine team resources typical of DI programs increase the likelihood of identifying and reporting BSIs. Although there are nearly as many DII programs as DI, total AEs for DII schools were 76% lower than for DI programs, with more gaps in reported data, such as 3 years of unreported swimming data, 2 years of unreported men’s lacrosse, and 1 year of unreported cross-country data. We addressed this deficiency in part by combining DII and DIII data for our comparisons, although this prevents direct comparisons between DI and DIII athletes. Although there are differences between those divisions, the magnitude of difference in funding and resources provided to DI athletic programs far exceeds that of DII and DIII. We believe the comparatively small magnitude by which DII and DIII differ in this regard makes it acceptable to treat them as 1 group for the purpose of this study. There is potentially a confounding effect from athletes participating in multiple sports or in sports activity outside of their NCAA participation. However, through extensive personal and professional experience with NCAA and higher-level athletics, we believe that this effect is minimal. In addition, recent academic years have not yet been incorporated into the NCAA-ISP; therefore, data from the more distant past were used.
Conclusion
In the current study, NCAA DII and DIII athletes had higher rates of BSI than their DI counterparts. When data were stratified by individual sport, there were no significant divisional differences in high-risk sports. As compared with DII and DIII athletes, DI athletes had a significantly greater proportion of BSIs that did not result in absence from participation in sport.
Footnotes
Final revision submitted November 17, 2020; accepted January 3, 2021.
One or more of the authors has declared the following potential conflict of interest or source of funding: P.J. has received teaching fees from Konica Minolta Healthcare Americas. T.B.S. has received consulting fees from DJO Surgical and research support from Arthrex, Smith & Nephew, and Zimmer Biomet. AOSSM checks author disclosures against the Open Payments Database (OPD). AOSSM has not conducted an independent investigation on the OPD and disclaims any liability or responsibility relating thereto.
Ethical approval for this study was waived by Baylor College of Medicine.
References
- 1. Arendt E, Agel J, Heikes C, Griffiths H. Stress injuries to bone in college athletes: a retrospective review of experience at a single institution. Am J Sports Med. 2003;31:959–968. doi:10.1177/03635465030310063601 [DOI] [PubMed] [Google Scholar]
- 2. Barnes JL, Schilling BK, Falvo MJ, Weiss LW, Creasy AK, Fry AC. Relationship of jumping and agility performance in female volleyball athletes. J Strength Cond Res. 2007;21(4):1192–1196. doi:10.1519/R-22416.1 [DOI] [PubMed] [Google Scholar]
- 3. Buckley TA, Burdette G, Kelly K. Concussion-management practice patterns of National Collegiate Athletic Association Division II and III athletic trainers: how the other half lives. J Athl Train. 2015;50(8):879–888. doi:10.4085/1062-6050-50.7.04 [DOI] [PMC free article] [PubMed] [Google Scholar]
- 4. Changstrom BG, Brou L, Khodaee M, Braund C, Comstock RD. Epidemiology of stress fracture injuries among US high school athletes, 2005-2006 through 2012-2013. Am J Sports Med. 2015;43(1):26–33. doi:10.1177/0363546514562739 [DOI] [PubMed] [Google Scholar]
- 5. Cutrufello PT. Coaches’ perceptions of the quality of care provided by athletic trainers. J Sports Med Phys Fitness. 2019;59(3):530–535. doi:10.23736/S0022-4707.18.08688-7 [DOI] [PubMed] [Google Scholar]
- 6. Dick R, Ferrara MS, Agel J, et al. Descriptive epidemiology of collegiate men’s football injuries: National Collegiate Athletic Association Injury Surveillance System, 1988-1989 through 2003-2004. J Athl Train. 2007;42(2):221. [PMC free article] [PubMed] [Google Scholar]
- 7. Foss KDB, Le Cara E, Mccambridge T, Hinton R, Kushner A, Myer GD. Epidemiology of injuries in men’s lacrosse: injury prevention implications for competition level, type of play, and player position. Phys Sportsmed. 2017;45(3):224–233. doi:10.1080/00913847.2017.1355209 [DOI] [PubMed] [Google Scholar]
- 8. Fredericson M, Bergman AG, Hoffman KL, Dillingham MS. Tibial stress reaction in runners: correlation of clinical symptoms and scintigraphy with a new magnetic resonance imaging grading system. Am J Sports Med. 1995;23(4):472–481. doi:10.1177/036354659502300418 [DOI] [PubMed] [Google Scholar]
- 9. Fukushima Y, Ray J, Kraus E, Syrop IP, Fredericson M. A review and proposed rationale for the use of ultrasonography as a diagnostic modality in the identification of bone stress injuries. J Ultrasound Med. 2018;37(10):2297–2307. doi:10.1002/jum.14588 [DOI] [PubMed] [Google Scholar]
- 10. Gallucci AR, Petersen JC. The size and scope of collegiate athletic training facilities and staffing. J Athl Train. 2017;52(8):785–794. doi:10.4085/1062-6050-52.3.16 [DOI] [PMC free article] [PubMed] [Google Scholar]
- 11. Garstecki MA, Latin RW, Cuppett MM. Comparison of selected physical fitness and performance variables between NCAA Division I and II football players. J Strength Cond Res. 2004;18(2):292–297. doi:10.1519/R-13104.1 [DOI] [PubMed] [Google Scholar]
- 12. Harmon KG, Dick R. The relationship of skill level to anterior cruciate ligament injury. Clin J Sport Med. 1998;8(4):260–265. doi:10.1097/00042752-199810000-00002 [DOI] [PubMed] [Google Scholar]
- 13. Hayashi D, Jarraya M, Engebretsen L, et al. Epidemiology of imaging-detected bone stress injuries in athletes participating in the Rio de Janeiro 2016 Summer Olympics. Br J Sports Med. 2018;52(7):470–474. doi:10.1136/bjsports-2017-098189 [DOI] [PubMed] [Google Scholar]
- 14. Hootman JM, Dick R, Agel J. Epidemiology of collegiate injuries for 15 sports: summary and recommendations for injury prevention initiatives. J Athl Train. 2007;42(2):311–319. [PMC free article] [PubMed] [Google Scholar]
- 15. Judge LW, Bellar DM, Gilreath EL, et al. An examination of preactivity and postactivity stretching practices of NCAA Division I, NCAA Division II, and NCAA Division III track and field throws programs. J Strength Cond Res. 2013;27(10):2691–2699. doi:10.1519/JSC.0b013e318280c9ac [DOI] [PubMed] [Google Scholar]
- 16. Kang L, Belcher D, Hulstyn MJ. Stress fractures of the femoral shaft in women’s college lacrosse: a report of seven cases and a review of the literature. Br J Sport Med. 2005;39:902–906. doi:10.1136/bjsm.2004.016626 [DOI] [PMC free article] [PubMed] [Google Scholar]
- 17. Kerr ZY, Dompier TP, Snook EM, et al. National Collegiate Athletic Association Injury Surveillance System: review of methods for 2004-2005 through 2013-2014 data collection. J Athl Train. 2014;49(4):552–560. doi:10.4085/1062-6050-49.3.58 [DOI] [PMC free article] [PubMed] [Google Scholar]
- 18. Kiuru MJ, Pihlajamäki HK, Ahovuo JA. Bone stress injuries. Acta Radiol. 2004;45(3):317–326. doi:10.1080/02841850410004724 [DOI] [PubMed] [Google Scholar]
- 19. Lappe J, Cullen D, Haynatzki G, Recker R, Ahlf R, Thompson K. Calcium and vitamin D supplementation decreases incidence of stress fractures in female navy recruits. J Bone Miner Res. 2008;23(5):741–749. doi:10.1359/jbmr.080102 [DOI] [PubMed] [Google Scholar]
- 20. Loughran GJ, Vulpis CT, Murphy JP, et al. Incidence of knee injuries on artificial turf versus natural grass in National Collegiate Athletic Association American Football: 2004-2005 through 2013-2014 seasons. Am J Sports Med. 2019;47(6):1294–1301. doi:10.1177/0363546519833925 [DOI] [PubMed] [Google Scholar]
- 21. Nattiv A, Kennedy G, Barrack MT, et al. Correlation of MRI grading of bone stress injuries with clinical risk factors and return to play: a 5-year prospective study in collegiate track and field athletes. Am J Sports Med. 2013;41(8):1930–1941. doi:10.1177/0363546513490645 [DOI] [PMC free article] [PubMed] [Google Scholar]
- 22. Patel DS, Roth M, Kapil N. Stress fractures: diagnosis, treatment, and prevention. Am Fam Physician. 2011;83(1):39–46. [PubMed] [Google Scholar]
- 23. Pathria MN, Chung CB, Resnick DL. Acute and stress-related injuries of bone and cartilage: pertinent anatomy, basic biomechanics, and imaging perspective. Radiology. 2016;280(1):21–38. doi:10.1148/radiol.16142305 [DOI] [PMC free article] [PubMed] [Google Scholar]
- 24. Peterson BJ, Fitzgerald JS, Dietz CC, et al. Division I hockey players generate more power than division III players during on- and off-ice performance tests. J Strength Cond Res. 2015;29(5):1191–1196. doi:10.1519/JSC.0000000000000754 [DOI] [PubMed] [Google Scholar]
- 25. Rizzone KH, Ackerman KE, Roos KG, Dompier TP, Kerr ZY. The epidemiology of stress fractures in collegiate student-athletes, 2004-2005 through 2013-2014 academic years. J Athl Train. 2017;52(10):966–975. doi:10.4085/1062-6050-52.8.01 [DOI] [PMC free article] [PubMed] [Google Scholar]
- 26. Rome K, Handoll HH, Ashford RL. Interventions for preventing and treating stress fractures and stress reactions of bone of the lower limbs in young adults. Cochrane Database Syst Rev. 2005;2:CD000450. doi:10.1002/14651858.cd000450.pub2 [DOI] [PMC free article] [PubMed] [Google Scholar]
- 27. Roos KG, Marshall SW, Kerr ZY, et al. Epidemiology of overuse injuries in collegiate and high school athletics in the United States. Am J Sports Med. 2015;43(7):1790–1797. doi:10.1177/0363546515580790 [DOI] [PubMed] [Google Scholar]
- 28. Rosene JM, Raksnis B, Silva B, et al. Comparison of concussion rates between NCAA Division I and Division III men’s and women’s ice hockey players. Am J Sports Med. 2017;45(11):2622–2629. doi:10.1177/0363546517710005 [DOI] [PubMed] [Google Scholar]
- 29. Saunier J, Chapurlat R. Stress fracture in athletes. Joint Bone Spine. 2018;85(3):307–310. doi:10.1016/j.jbspin.2017.04.013 [DOI] [PubMed] [Google Scholar]
- 30. Smith R, Ford KR, Myer GD, Holleran A, Treadway E, Hewett TE. Biomechanical and performance differences between female soccer athletes in National Collegiate Athletic Association Divisions I and III. J Athl Train. 2007;42(4):470–476. [PMC free article] [PubMed] [Google Scholar]
- 31. Tenforde AS, Carlson JL, Chang A, et al. Association of the female athlete triad risk assessment stratification to the development of bone stress injuries in collegiate athletes. Am J Sports Med. 2017;45(2):302–310. doi:10.1177/0363546516676262 [DOI] [PubMed] [Google Scholar]
- 32. Tenforde AS, Kraus E, Fredericson M. Bone stress injuries in runners. Phys Med Rehabil Clin N Am. 2016;27(1):139–149. doi:10.1016/j.pmr.2015.08.008 [DOI] [PubMed] [Google Scholar]
- 33. Williams K, Askew C, Mazoue C, Guy J, Torres-McGehee TM, Jackson JB III. Vitamin D3 supplementation and stress fractures in high-risk collegiate athletes—a pilot study. Orthop Res Rev. 2020;12:9–17. doi:10.2147/ORR.S233387 [DOI] [PMC free article] [PubMed] [Google Scholar]
- 34. Wright AA, Taylor JB, Ford KR, Siska L, Smoliga JM. Risk factors associated with lower extremity stress fractures in runners: a systematic review with meta-analysis. Br J Sports Med. 2015;49(23):1517–1523. doi:10.1136/bjsports-2015-094828 [DOI] [PubMed] [Google Scholar]
- 35. Wright CJ, Abbey EL, Brandon BA, Reisman EJ, Kirkpatrick CM. Cardiovascular disease risk profile of NCAA Division III intercollegiate football athletes: a pilot study. Phys Sportsmed. 2017;45(3):280–285. doi:10.1080/00913847.2017.1345288 [DOI] [PubMed] [Google Scholar]