

Abstract
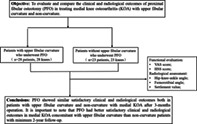
Objective
To evaluate and compare the clinical and radiographic outcomes of proximal fibular osteotomy (PFO) in treating medial knee osteoarthritis (KOA) patients with upper fibular curvature and non‐curvature.
Methods
A retrospective cohort study was performed. From January 2016 to January 2017, a total of 51 patients (nine males and 42 females) at a mean age of 63.7 years (range 48–79 years) with medial KOA who underwent PFO procedure at the Third Hospital of Hebei Medical University were included in the study. The patients were divided into the two groups, namely curvature group (28 patients, six males and 22 females, aged 62.6 ± 7.7 years) and non‐curvature group (23 patients, three males and 20 females, aged 64.5 ± 7.6 years). Perioperative parameters and Kellgren‐Lawrence classification were recorded and analyzed in the two groups, respectively. All patients were followed up at 1, 3, 6, and 12 months at the first year of post‐operation, and then every 6 months from the second year of post‐operation. A telephone survey with standard questionnaire survey, including Visual Analog Scale (VAS) score and Hospital for Special Surgery (HSS) scoring system, was used to evaluate postoperative clinical outcomes. Radiological results were assessed using the femorotibial angle (FTA), hip‐knee‐ankle angle (HKA), and settlement value of medial tibial platform (MTP) in the two groups.
Results
The average follow‐up periods of the curvature group and the non‐curvature group were 34.8 ± 6.1 and 33.9 ± 5.4 months, respectively. There were no significant differences between the two groups of demographic data in terms of number of patients, age, body mass index (BMI), gender, KOA side, and Kellgren‐Lawrence classification (P > 0.05). The VAS scores of the curvature group and non‐curvature group were (3.53 ± 1.62 vs 3.68 ± 1.43 at 1 month, 3.46 ± 0.79 vs 3.57 ± 0.66 at 3 months, and 2.43 ± 0.88 vs 2.83 ± 0.94 at 6 months, both P > 0.05), while significant differences were found from 12 months post‐operation (1.54 ± 0.72 vs 2.03 ± 0.85 at 12 months, and 1.04 ± 0.69 vs 1.74 ± 0.75 at 24 months, both P < 0.05). The HSS scores of the curvature group and non‐curvature group were (79.67 ± 5.14 vs 78.25 ± 6.37 at 1 month, 84.65 ± 3.76 vs 83.18 ± 3.64 at 3 months, and 86.27 ± 3.13 vs 85.49 ± 3.25 at 6 months, both P > 0.05), while significant differences were found from 12 months post‐operation (90.64 ± 4.32 vs 87.71 ± 5.63 at 12 months, and 92.93 ± 2.07 vs 90.06 ± 2.08 at 24 months, both P < 0.05). In addition, the FTA and settlement value of the curvature group were lower than the non‐curvature group (177.18 ± 1.52 vs 178.35 ± 1.86, and 5.29 ± 1.74 vs 6.49 ± 2.09, both P < 0.05) while the HKA were higher than the non‐curvature group (175.32 ± 2.34 vs 173.83 ± 2.64, P < 0.05) at the final follow‐up.
Conclusions
Medial KOA patients with upper fibular curvature is an optimal surgical indication for PFO surgery, with the advantages of pain relief, better functional recovery, and alignment correction.
Keywords: Comparison, Knee osteoarthritis, Medial compartment, Proximal fibular osteotomy, Upper fibular curvature
Medial compartment KOA associated with upper fibular curvature is an optimal surgical indication for proximal fibular osteotomy.
Patients who had medial compartment KOA associated with upper fibular curvature yield better clinical and radiological outcomes than those without upper fibular curvature.
Introduction
Knee osteoarthritis (KOA) is a common cause of chronic pain, limited range of motion, and physical disability among aged people, which lowers quality of life, brings about enormous socioeconomic burden, and has a great influence on activities of daily living 1 , 2 , 3 as it causes function disability. Previous literature has indicated that it occurs commonly in the medial compartment, as pressure bearing into the medial compartment was 2.2 times larger than the lateral compartment during level walking 4 , 5 . Actually, we concluded that upper fibular curvature is the adaptative change of medial compartment KOA with increasing age and Kellgren‐Lawrence grade based on Zhang's laws of dynamic deformation of bone 6 , especially for the elderly 7 , but little is known about the comparison of clinical and radiological outcomes between curvature and non‐curvature following proximal fibular osteotomy (PFO) in this population.
Medial compartment KOA, notably characterized by degeneration of the articular surface and osteophyte formation in the knee, is the most common variation of KOA which can lead to varus malalignment of the lower extremity and even loss of ability to walk. Cartilage wear and joint deformity are main characteristics of medial KOA. Therefore, surgical intervention including realigning malignment and joint arthroplasty are considered. Conventional opening‐wedge high tibial osteotomy (OWHTO) has become an effective surgical intervention for medial KOA with varus deformity and has been proven to be a well‐established method for younger patients with isolated medial KOA by shifting the mechanical axis from the overloaded medial joint compartment to the unaffected lateral compartment, thus postponing or avoiding knee joint replacement 8 . However, conventional OWHTO has been concomitant with an inadvertent increase in the posterior tibial slope and decrease in patellar height postoperatively, which may have an unfavorable effect on kinematics of the knee joint 9 , 10 . Furthermore, this procedure is an excessive surgery for mild varus deformity and may increase the risk of operative complications, including nonunion or delayed union of the osteotomy site, under‐ or overcorrection of the varus deformity, lateral hinge fracture, hardware irritation, neurovascular injuries, and infection 11 , 12 , 13 .
Various surgical techniques have been widely performed for medial KOA 14 , 15 , 16 , such as high tibial osteotomy, unicompartment knee arthroplasty (UKA), and total knee arthroplasty (TKA). However, the optimal treatment of medial KOA remains controversial and these surgical methods have several shortcomings. For example, TKA can cause wound infection, deep venous thrombosis, and pulmonary embolus 17 , 18 . It can also cause polyethylene wear, periprosthetic fracture, and septic or aseptic prosthesis loosening 19 , resulting in increased revision rates and high expenditure. Our previous studies demonstrated that PFO is generally accepted as a safe and reliable procedure with low cost and satisfactory clinical functional outcomes. In addition, PFO is becoming increasingly popular in patients with early‐stage medial KOA due to lower complication rates, shorter hospital stays, and simple surgical procedure 20 , 21 , 22 . In 2014, Yazdi et al. 23 first reported that PFO results in a decrease in the medial compartmental pressure and an increase in the lateral compartmental pressure. The decreased contact pressure on the cartilage of the medial compartment following correction of malalignment lowers the risk of degradation of articular cartilage and improves function outcome. Therefore, PFO technique represented a promising therapeutic option in joint preserving for stepwise treatment of medial KOA.
Importantly, PFO eliminated the fibular support for lateral tibial plateau and assisted in the correction of the varus deformity, which can redistribute the loading force into the knee joint and reduce pain significantly 24 . Several studies have demonstrated that PFO yields satisfactory results for KOA even in advanced KOA based on the theory of non‐uniform settlement 25 . Chen et al. 26 demonstrated a 19.7% decrease of the loading forces on the medial region of the medial tibial plateau and identified that PFO can be a better treatment option within 1‐year follow‐up in pain alleviation, alignment correction and gait improvement than drugs with conservative treatment in early stages of medial KOA. Whereas the good clinical benefit of PFO is well‐described in most previous studies, it remains controversial as to what are the best surgical indications for PFO in patients with medial KOA. Moreover, their studies have some limitations, which included being retrospective with a short‐term follow‐up, and no comparative study has investigated the differences in clinical and radiological outcomes between upper fibular curvature and non‐curvature with medial KOA.
We retrospectively analyzed 51 patients with mild to moderate medial KOA who underwent PFO procedure in our department at the Third Hospital of Hebei Medical University for a minimum follow‐up of 2 years. The purpose of the present study was to: (i) evaluate and compare the therapeutic effects of PFO in the treatment of medial KOA patients with upper fibular curvature and non‐curvature; (ii) to reveal the optimal indication for PFO procedure; (iii) to investigate discrepancies of outcomes of PFO in different fibular morphology; and (iv) to further guide clinical treatment with the results of this study.
Materials and Methods
Ethics Statement
This study was approved by the Ethical Committee of the Third Hospital of Hebei Medical University and was conducted in accordance with the Declaration of Helsinki. All patients provided written informed consent to their participation in this study.
Patient Selection
This research was a retrospective cohort study of patients who were diagnosed with medial KOA and underwent PFO surgery from January 2016 to January 2017. All patients were followed up at 1, 3, 6, and 12 months for the first year after surgery, and then every 6 months from the second year. Inclusion criteria were as follows: (i) patients with symptomatic knee pain and were diagnosed with medial compartment KOA based on American Rheumatism Association clinical and radiographic criteria 27 ; (ii) patients who underwent PFO surgery; (iii) the morphology of the upper fibular with curvature were considered as the comparison; (iv) patients with complete follow‐up outcomes and a follow‐up time of a minimum of 2 years; (v) the study was designed as a retrospective comparative study. Exclusion criteria were as follows: (i) knee instability; (ii) post‐traumatic arthritis or inflammatory joint disease; (iii) knee range of motion <100° and a flexion contracture of >10°; (iv) patients who had previous knee surgery; (v) patients who were lost to follow‐up; (vi) incomplete clinical data.
A total of 51 patients, comprising nine males and 42 females, were included in the final cohort. Patient demographics from medical records, including age, body mass index (BMI), gender, affected side, and Kellgren‐Lawrence (K‐L) classification were recorded. The patients were subsequently divided into the upper fibular curvature group and non‐curvature group according to the upper fibular morphology with curvature and non‐curvature.
Surgical Technique
Anesthesia and Position
All patients were positioned supine on a radiolucent operating table with knees flexed to 30° and a pneumatic tourniquet placed on the proximal thigh after the induction of general anesthesia.
Approach and Exposure
First, the fibular head was palpated and marked accurately using a syringe needle. To avoid iatrogenic injury of the peroneal nerve and tibial attachments of the soft tissue lesions, the lateral straight longitudinal skin incision of the osteotomy level was located in the area of approximately 6–8 cm inferior to the fibular head. The fascia was then incised in line with the septum between the peroneus and soleus, the muscles were separated, and the fibular was exposed. A 2‐cm segment of the proximal fibular was removed with the use of an oscillating saw. Following the resection of the proximal fibular, we applied the gelatin sponges into the ends of the fibular and sutured the muscles, fascia, and skin separately.
Postoperative Management
The two groups received the same rehabilitation program. On the first day after surgery, all patients were allowed to walk with full weight‐bearing and return to normal life as soon as possible.
Outcome Measurements
Measurements of Hip‐Knee‐Ankle Angle (HKA)
The HKA was defined as the angle calculated by intersecting the line between femoral mechanical axis (from the center of the femoral head to the central point of the tibial spines) and tibial mechanical axis (from the center of the tibial spines to the center of the ankle). Neutral lower‐limb alignment was considered if the HKA angle was between 177° and 183°. Varus alignment was defined as HKA if less than 177°, and valgus alignment was defined as HKA if greater than 183°.
Measurements of Femorotibial Angle (FTA)
The FTA was defined as the angle between the femoral anatomical axis and the tibial anatomical axis, which was an important radiographical parameter to evaluate varus or valgus malalignment.
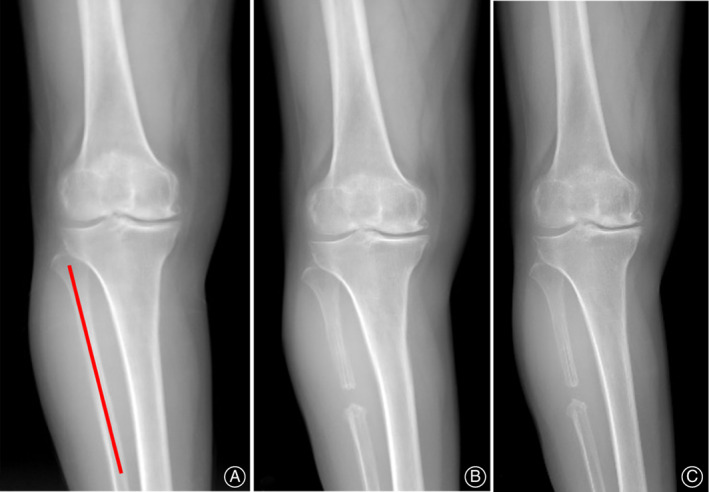
Measurements of Settlement Value
The settlement value was defined as the distance (white dashed line) from the medial edge of platform to a tangential line (yellow line) which is perpendicular to the mechanical axis of the tibial (red line), which can quantitatively indicate the severity of varus deformity.
Figure 1 illustrated the methods of measurements in the above‐mentioned radiographic parameters. All radiological parameters were obtained with the assistance of picture archiving and communication systems (PACS; Science & Technology General Company of Hebei Medical University, Shijiazhuang, China). The radiographs were evaluated by two observers (H.Z.H and Z.Z.W), independently of each other, to measure the K‐L classification, HKA, FTA, and settlement value. One observer repeated the measurements after 2 weeks.
Fig. 1.

(A)The hip‐knee‐angle angle (HKA) of the lower extremity is the angle calculated by intersecting the line between femoral mechanical and tibial mechanical axes; (B) The femorotibial angle (FTA) was defined as the lateral angle between the femoral anatomical axis and the tibial anatomical axis; (C) The settlement value of medial tibial platform (dashed line) was defined as a perpendicular distance from the medial edge of platform to a tangential line (yellow line) which is perpendicular to the mechanical axes of the tibial (red line).
Visual Analog Pain score
The visual analogu pain score (VAS) was used to evaluate the pain of the knee joint of the patients at every follow‐up during non‐weight bearing level walking. The VAS total scores were 10 points, in which 0 points indicated no pain; 1–3 points indicated mild pain; 4–7 points indicated moderate pain; and 7–10 points indicated severe pain.
Hospital for Special Surgery Knee Scores
The Hospital for Special Surgery (HSS) is a knee scoring system that was used to evaluate knee function before and after knee surgeries in the adult population. The HSS score system was 100 points, which consisted of six aspects: pain (30 points), functional activity (22 points), range of motion (18 points), muscle strength (10 points), flexion deformity (10 points), and knee stability (10 points). The HSS scores were based on the following cut points: excellent (≥85), good (70–84), fair (60–69), and poor (<60).
Statistical Analysis
SPSS software (version 25.0, IBM Corp., USA) was performed for statistical analysis. All parameters were tested for normality distribution by Kolmogorov–Smirnov test. When the criteria for normality were met, a Student's t‐test was conducted for comparison of differences with relevant data. Mean ± standard deviation (SD) was calculated for the different measurements and presented for continuous variables. Categorical data were presented as numbers or percentages. Chi‐square tests and Fisher's exact test were used to compare the difference for categorical variables. Statistical significance was set at P < 0.05.
Results
Follow‐Up
All patients were followed up at 1, 3, 6, and 12 months in the first year post‐operation, and every 6 months from the second year. A telephone survey with standard questionnaire survey, which included VAS score and HSS score, was used to evaluate patients' postoperative functional recovery and pain relief. The average follow‐up periods of curvature and non‐curvature groups were 34.8 ± 6.1 and 33.9 ± 5.4 months, and no significant difference was found between the two groups (P > 0.05). Typical cases are shown in Fig. 2 and Fig. 3.
Fig. 2.
Typical case of non‐curvature associated with upper fibular in a 62‐year‐old female patient with medial KOA (K‐L grade‐II) on the right side. (A) Weight‐bearing AP radiographs before surgery; (B) Weight‐bearing AP radiographs after surgery; (C) Weight‐bearing AP radiographs at final follow‐up.
Fig. 3.

Typical case of upper fibular curvature in a 58‐year‐old female patient with medial KOA (K‐L grade‐II) on the left side. (A) Weight‐bearing AP radiographs before surgery; (B) Weight‐bearing AP radiographs after surgery; (C) Weight‐bearing AP radiographs at final follow‐up.
General Results
The general demographic data of included patients were described in Table 1. Overall, there were 28 patients in the curvature group and 23 patients in the non‐curvature group, and there was no significant differences in terms of age ([62.6 ± 7.7] years vs [64.5 ± 7.6] years, P = 0.398), BMI ([27.9 ± 2.9] kg/m2 vs [27.1 ± 2.5] kg/m2, P = 0.093), gender (male/female, [6/22] vs [3/20], P = 0.434), side (left/right, [18/10] vs [10/13], P = 0.137), and K‐L classification (Grade II/ Grade III, [13/15] vs [13/10], P = 0.473).
TABLE 1.
Comparison of demographic data between the two groups of patients
| Demographics | Curvature group | Non‐curvature group | P‐value |
|---|---|---|---|
| Number of patients | 28 | 23 | ‐ |
| Age (years) | 62.6 ± 7.7 | 64.5 ± 7.6 | 0.398 |
| BMI (kg/m2) | 27.9 ± 2.9 | 27.1 ± 2.5 | 0.093 |
| Gender (%) | 0.434 | ||
| Male | 6 (21.4) | 3 (4.1) | |
| Female | 22 (78.6) | 20 (18.9) | |
| Side (%) | 0.137 | ||
| Left | 18 (64.3) | 10 (43.5) | |
| Right | 10 (35.7) | 13 (56.5) | |
| K‐L classification (%) | 0.473 | ||
| Grade II | 13 (46.4) | 13 (56.5) | |
| Grade III | 15 (53.6) | 10 (43.5) | |
| Follow‐up time (months) | 34.8 ± 6.1 | 33.9 ± 5.4 | 0.579 |
Radiological Evaluation
The FTA of the two groups were presented in Table 2. The FTA at pre‐operation and 1 month post‐operation for the curvature group were (181.14° ± 2.03°) and (179.25° ± 1.60°), and (180.83° ± 2.42°), (179.22° ± 1.99°) for the non‐curvature group, respectively. There was no significant difference between the two groups at the two fixed time points (P > 0.05). However, the FTA at final follow‐up post‐operation of the curvature group and non‐curvature group were (177.18° ± 1.52°) and (178.35° ± 1.86°), and significant difference was found between the two groups (P < 0.05).
TABLE 2.
Comparison of radiological outcomes of the two groups
| Radiological parameters | Curvature (n = 28) | Non‐curvature (n = 23) | P‐value |
|---|---|---|---|
| FTA (°) | |||
| Pre‐operation | 181.14 ± 2.03 | 180.83 ± 2.42 | 0.614 |
| 1 month after operation | 179.25 ± 1.60 | 179.22 ± 1.99 | 0.949 |
| Post‐operation at final follow‐up | 177.18 ± 1.52 | 178.35 ± 1.86 | 0.021 * |
| HKA (°) | |||
| Pre‐operation | 171.21 ± 2.94 | 171.83 ± 3.41 | 0.494 |
| 1 month after operation | 172.89 ± 2.15 | 172.96 ± 3.14 | 0.932 |
| Post‐operation at final follow‐up | 175.32 ± 2.34 | 173.83 ± 2.64 | 0.038 * |
| Settlement value of MTP (mm) | |||
| Pre‐operation | 8.54 ± 2.49 | 8.83 ± 2.58 | 0.687 |
| 1 month after operation | 7.32 ± 2.32 | 7.53 ± 2.45 | 0.751 |
| Post‐operation at final follow‐up | 5.29 ± 1.74 | 6.49 ± 2.09 | 0.029 * |
FTA, femorotibial angle; HKA, hip‐knee‐ankle angle; MTP, medial tibial plateau.
The difference is significant.
The HKA of the two groups were shown in Table 2. The HKA at pre‐operation and 1 month post‐operation for the curvature group were (171.21° ± 2.94°) and (171.83° ± 3.41°), and (172.89° ± 2.15°), (172.96° ± 3.14°) for the non‐curvature group, respectively. There was no significant difference between the two groups at the two fixed time points (P > 0.05). However, the HKA at final follow‐up post‐operation of the curvature group and non‐curvature group were (175.32° ± 2.34°) and (173.83° ± 2.64°), and significant difference was found between the two groups (P < 0.05).
The settlement values of the two groups were presented in Table 2. The settlement value at pre‐operation and 1 month post‐operation for the curvature group were (8.54 ± 2.49 mm) and (8.83 ± 2.58 mm), and (7.32 ± 2.32 mm), (7.53 ± 2.45 mm) for the non‐curvature group, respectively. There was no significant difference between the two groups at these two time points (P > 0.05). However, the settlement value at final follow‐up post‐operation of the curvature group and non‐curvature group were (5.29 ± 1.74 mm) and (6.49 ± 2.09 mm), and significant difference was found between the two groups (P < 0.05).
Functional Evaluation
Visual Analog Scale
The VAS scores of the two groups were shown in Table 3. The preoperative VAS scores of the curvature group and the non‐curvature group were 7.25 ± 1.91 and 6.91 ± 2.08, and no significant difference was found between the two groups. The VAS scores at 1, 3, and 6 months post‐operation for the curvature group were 3.53 ± 1.62, 3.46 ± 0.79 and 2.43 ± 0.88, and 3.68 ± 1.43, 3.57 ± 0.66, and 2.83 ± 0.94 for the non‐curvature group, respectively, and no significant difference was found between the two groups at these time points (P > 0.05). However, the VAS scores for the curvature group and the non‐curvature group were 1.54 ± 0.72 and 2.03 ± 0.85 at 12 months, and 1.04 ± 0.69 and 1.74 ± 0.75 at 24 months post‐operation and significant difference was found in the VAS score between the two groups from 12 months post‐operation (P < 0.05).
TABLE 3.
Comparison of clinical outcomes between the two groups of patients
| Variables | Curvature (n = 28) | Non‐curvature (n = 23) | P‐value |
|---|---|---|---|
| VAS score | |||
| Pre‐operation | 7.25 ± 1.91 | 6.91 ± 2.08 | 0.551 |
| 1 month after operation | 3.53 ± 1.62 | 3.68 ± 1.43 | 0.730 |
| 3 months after operation | 3.46 ± 0.79 | 3.57 ± 0.66 | 0.629 |
| 6 months after operation | 2.43 ± 0.88 | 2.83 ± 0.94 | 0.124 |
| 12 months after operation | 1.54 ± 0.72 | 2.03 ± 0.85 | 0.031 * |
| 24 months after operation | 1.04 ± 0.69 | 1.74 ± 0.75 | 0.001 * |
| HSS score | |||
| Pre‐operation | 58.43 ± 9.83 | 59.17 ± 7.74 | 0.769 |
| 1 month after operation | 79.67 ± 5.14 | 78.25 ± 6.37 | 0.382 |
| 3 months after operation | 84.65 ± 3.76 | 83.18 ± 3.64 | 0.163 |
| 6 months after operation | 86.27 ± 3.13 | 85.49 ± 3.25 | 0.388 |
| 12 months after operation | 90.64 ± 4.32 | 87.71 ± 5.63 | 0.041 * |
| 24 months after operation | 92.93 ± 2.07 | 90.06 ± 2.08 | 0.001 * |
HSS, Hospital for special surgery knee score; VAS, Visual analog scale.
The difference is significant.
Hospital for Special Surgery Knee Score
The HSS scores of the two groups were shown in Table 3. The preoperative HSS scores of the curvature group and the non‐curvature group were 58.43 ± 9.83 and 59.17 ± 7.74, and no significant difference was found between the two groups. The HSS scores at 1, 3, and 6 months post‐operation for the curvature group were 79.67 ± 5.14, 84.65 ± 3.76, and 86.27 ± 3.13, and 78.25 ± 6.37, 83.18 ± 3.64, and 85.49 ± 3.25 for the non‐curvature group, respectively, and no significant difference was found between the two groups at these time points (P > 0.05). However, the HSS scores for the curvature group and the non‐curvature group were 90.64 ± 4.32 and 87.71 ± 5.63 at 12 months, and 92.93 ± 2.07 and 90.06 ± 2.08 at 24 months post‐operation and significant difference were found in the HSS score between the two groups from 12 months post‐operation (P < 0.05).
Discussion
The present study compared the therapeutic effects of PFO procedure in treating medial KOA patients with upper fibular curvature and non‐curvature. Our results showed that the upper fibular curvature group was superior to the non‐curvature group in regard to VAS scores and HSS scores in the middle‐ to long‐term stages post‐operation, while no significant difference was found in the early stages of post‐operation. Furthermore, upper fibular curvature achieved better radiological outcomes than the non‐curvature group in the long‐term stages post‐operation.
Less Trauma and Satisfactory Short‐Term Clinical Outcomes
Although there are many joint‐preserving procedures to postpone total knee arthroplasty in KOA patients, PFO is still a minimally invasive surgical procedure and an innovative technique for symptomatic varus KOA with lower expenditure, knee biomechanics improvement, fewer complications, and rapid functional recovery 28 , 29 . Several studies have demonstrated the practicability and potential benefits of PFO in the treatment of medial KOA. Nie et al. 24 reported a significant decrease of 19.7% in stress distribution of the medial region of the tibial plateau after PFO. In a retrospective study of 156 patients with medial compartment KOA, Yang et al. 20 found significant difference regarding the postoperative lateral joint spaces, which were smaller than those measured preoperatively.
In the present study, our results showed that pain relief, function improvement, and more neutral alignment could be achieved both in the curvature and non‐curvature group at post‐operation. At fixed follow‐up time points, we observed the pain was significantly relieved in both groups following PFO surgery. These findings were consistent with other published studies of PFO for medial KOA. Additionally, the pain relief in the curvature group was better than that for the non‐curvature group at 12 months post‐operation, which suggested upper fibular curvature associated with medial KOA was an optimal surgical indication for PFO. Continuous improvement of function could be observed in terms of the HSS scores for patients receiving PFO. Although the HSS scores improved in both groups at post‐operation, the HSS scores in the upper fibular curvature group were better than those the non‐curvature group from 12 months post‐operation.
Alignment Correction
With regard to improvement of FTA, HKA, and settlement value following PFO, mean FTA, HKA, and settlement value of the curvature group were (177.18° ± 1.52°), (175.32° ± 2.34°), and (5.29 ± 1.74 mm) at 24 months post‐operation, respectively. Dong et al. 30 showed that settlement value of MTP is negatively related with the HKA angle and positively related with K‐L grade, which is comparable to our results. In 1997, Cooke et al. 31 reported that the HKA is between 178.5° and 179.0° in healthy adults with a neutral lower‐limb alignment. Nie et al. 24 found that a more neutral alignment was achieved with a mean of 1.80°, which increased FTA within 6 months after PFO operation. Yang et al. 30 assessed radiographic changes in medial compartment KOA after PFO. They reported that the mean FTA improved from (182.7° ± 2.0°) preoperatively to (179.4° ± 1.8°) at the final follow‐up. Stanley et al. 32 examined the effect of OWHTO with a mean increase of 8.6° of HKA. Nevertheless, it should also be noted that in both groups, we did not achieve the desired correction degrees postoperatively in our study. This is probably because of the large varus degrees from a proportion of patients included in this study preoperatively. Therefore, a partial limitation with PFO is patients with unexpected residual varus deformity compared with high tibial osteotomy for medial compartment KOA.
Medial KOA Associated with Upper Fibular Curvature is an Optimal Indication for PFO
Previous studies have reported that fibular curvature is mainly associated with traumatic tibial fractures 33 , 34 , 35 . However, our published studies demonstrated that upper fibular curvature was associated with greater fibular axial loading forces and was taken as an anatomical adaptation of the progression of medial compartment KOA 7 . The increased curvature of the upper fibular, the more significant the effect of lateral fibular support and the better outcomes of PFO were achieved. Such findings suggested that medial compartment KOA was closely associated with the theory of non‐uniform settlement. Patients with increased upper fibular curvature following PFO operation could be expected to receive better clinical and radiological outcomes.
Strengths and Limitations
Despite the good clinical and radiological outcomes found in this study, there were also some limitations in this study. First, this research was a retrospective cohort study, and some selection bias may have occurred. Second, the number of patients was relatively small. Further study with a long‐term period of follow‐up and more regular follow‐up time points should be provided to better understand clinical benefits of PFO. However, to the best of our knowledge, this is the first study of comparison on clinical and radiological outcomes between medial compartment KOA patients with upper fibular curvature and non‐curvature following PFO. We recommended PFO may be regarded as an optimal indication for medial compartment KOA associated with upper fibular curvature.
Conclusions
In conclusion, this study demonstrated that PFO showed satisfactory clinical and radiological outcomes in both groups with a minimum of 2‐years follow‐up. Furthermore, patients associated with upper fibular curvature who received PFO can have a better clinical and radiological outcome in the long‐term stages of post‐operation compared to patients without upper fibular curvature.
Xiang‐tian Deng, Hong‐zhi Hu, and Zhong‐zheng Wang contributed equally to this work.
Disclosure: No conflict of interest exists.
Grant Sources: This study was funded by the Major Research Plan of National Natural Science Foundation of China (91949203).
Contributor Information
Xiao‐dong Cheng, Email: 350144946@qq.com.
Ying‐ze Zhang, Email: zyz050051@163.com.
References
- 1. Lapsley HM, March LM, Tribe KL, Cross MJ, Brooks PM. Living with osteoarthritis: patient expenditures, health status, and social impact. Arthritis Rheum, 2001, 45: 301–306. [DOI] [PubMed] [Google Scholar]
- 2. Reginster JY. The prevalence and burden of arthritis. Rheumatology (Oxford), 2002, 41: 3–6. [PubMed] [Google Scholar]
- 3. Vos T, Flaxman AD, Naghavi M, et al. Years lived with disability (YLDs) for 1160 sequelae of 289 diseases and injuries 1990‐2010: a systematic analysis for the global burden of disease study 2010. Lancet, 2012, 380: 2163–2196. [DOI] [PMC free article] [PubMed] [Google Scholar]
- 4. Kutzner I, Heinlein B, Graichen F, et al. Loading of the knee joint during activities of daily living measured in vivo in five subjects. J Biomech, 2010, 43: 2164–2173. [DOI] [PubMed] [Google Scholar]
- 5. Radin EL, Parker HG, Pugh JW, Steinberg RS, Paul IL, Rose RM. Response of joints to impact loading. 3. Relationship between trabecular microfractures and cartilage degeneration. J Biomech, 1973, 6: 51–57. [DOI] [PubMed] [Google Scholar]
- 6. Wang J, Chen W, Hou ZY, Lyu HZ, Zhu YB, Zhang YZ. Law of dynamic deformation of bone. Chin Med J (Engl), 2019, 132: 2636–2637. [DOI] [PMC free article] [PubMed] [Google Scholar]
- 7. Wang J, Lv HZ, Chen W, Fan MK, Li M, Zhang YZ. Anatomical adaptation of fibula and its mechanism of proximal partial Fibulectomy associated with medial compartment knee osteoarthritis. Orthop Surg, 2019, 11: 204–211. [DOI] [PMC free article] [PubMed] [Google Scholar]
- 8. Schuster P, Gesslein M, Schlumberger M, et al. Ten‐year results of medial open‐wedge high Tibial osteotomy and Chondral resurfacing in severe medial osteoarthritis and Varus Malalignment. Am J Sports Med, 2018, 46: 1362–1370. [DOI] [PubMed] [Google Scholar]
- 9. Kastner N, Sternbauer S, Friesenbichler J, et al. Impact of the tibial slope on range of motion after low‐contact‐stress, mobile‐bearing, total knee arthroplasty. Int Orthop, 2014, 38: 291–295. [DOI] [PMC free article] [PubMed] [Google Scholar]
- 10. Kloos F, Becher C, Fleischer B, et al. High tibial osteotomy increases patellofemoral pressure if adverted proximal, while open‐wedge HTO with distal biplanar osteotomy discharges the patellofemoral joint: different open‐wedge high tibial osteotomies compared to an extra‐articular unloading device. Knee Surg Sports Traumatol Arthrosc, 2019, 27: 2334–2344. [DOI] [PubMed] [Google Scholar]
- 11. Han SB, In Y, Oh KJ, Song KY, Yun ST, Jang KM. Complications associated with medial opening‐wedge high Tibial osteotomy using a locking plate: a multicenter study. J Arthroplasty, 2019, 34: 439–445. [DOI] [PubMed] [Google Scholar]
- 12. Sprenger TR, Doerzbacher JF. Tibial osteotomy for the treatment of varus gonarthrosis. Survival and failure analysis to twenty‐two years. J Bone Joint Surg Am, 2003, 85: 469–474. [PubMed] [Google Scholar]
- 13. Kirgis A, Albrecht S. Palsy of the deep peroneal nerve after proximal tibial osteotomy. An anatomical study. J Bone Joint Surg Am, 1992, 74: 1180–1185. [PubMed] [Google Scholar]
- 14. Birmingham TB, Giffin JR, Chesworth BM, et al. Medial opening wedge high tibial osteotomy: a prospective cohort study of gait, radiographic, and patient‐reported outcomes. Arthritis Rheum, 2009, 61: 648–657. [DOI] [PubMed] [Google Scholar]
- 15. Dettoni F, Bonasia DE, Castoldi F, Bruzzone M, Blonna D, Rossi R. High tibial osteotomy versus unicompartmental knee arthroplasty for medial compartment arthrosis of the knee: a review of the literature. Iowa Orthop J, 2010, 30: 131–140. [PMC free article] [PubMed] [Google Scholar]
- 16. Murray DW. Mobile bearing unicompartmental knee replacement. Orthopedics, 2005, 28: 985–987. [DOI] [PubMed] [Google Scholar]
- 17. Amin NH, Speirs JN, Simmons MJ, Lermen OZ, Cushner FD, Scuderi GR. Total knee Arthroplasty wound complication treatment algorithm: current soft tissue coverage options. J Arthroplasty, 2019, 34: 735–742. [DOI] [PubMed] [Google Scholar]
- 18. Brockman BS, Maupin JJ, Thompson SF, Hollabaugh KM, Thakral R. Complication rates in Total knee Arthroplasty performed for osteoarthritis and post‐traumatic arthritis: a comparison study. J Arthroplasty, 2020, 35: 371–374. [DOI] [PubMed] [Google Scholar]
- 19. Hinman AD, Prentice HA, Paxton EW, Kelly MP. Modular Tibial stem use and risk of revision for aseptic loosening in cemented primary Total knee Arthroplasty. J Arthroplasty, 2020. [DOI] [PubMed] [Google Scholar]
- 20. Yang ZY, Chen W, Li CX, et al. Medial compartment decompression by fibular osteotomy to treat medial compartment knee osteoarthritis: a pilot study. Orthopedics, 2015, 38: e1110–e1114. [DOI] [PubMed] [Google Scholar]
- 21. Liu B, Chen W, Zhang Q, et al. Proximal fibular osteotomy to treat medial compartment knee osteoarthritis: preoperational factors for short‐term prognosis. PloS One, 2018, 13: e197980. [DOI] [PMC free article] [PubMed] [Google Scholar]
- 22. Qin D, Chen W, Wang J, et al. Mechanism and influencing factors of proximal fibular osteotomy for treatment of medial compartment knee osteoarthritis: a prospective study. J Int Med Res, 2018, 46: 3114–3123. [DOI] [PMC free article] [PubMed] [Google Scholar]
- 23. Yazdi H, Mallakzadeh M, Mohtajeb M, Farshidfar SS, Baghery A, Givehchian B. The effect of partial fibulectomy on contact pressure of the knee: a cadaveric study. Eur J Orthop Surg Traumatol, 2014, 24: 1285–1289. [DOI] [PubMed] [Google Scholar]
- 24. Nie Y, Ma J, Huang Z, et al. Upper partial fibulectomy improves knee biomechanics and function and decreases knee pain of osteoarthritis: a pilot and biomechanical study. J Biomech, 2018, 71: 22–29. [DOI] [PMC free article] [PubMed] [Google Scholar]
- 25. Utomo DN, Mahyudin F, Wijaya AM, Widhiyanto L. Proximal fibula osteotomy as an alternative to TKA and HTO in late‐stage varus type of knee osteoarthritis. J Orthop, 2018, 15: 858–861. [DOI] [PMC free article] [PubMed] [Google Scholar]
- 26. Chen G, Xu B, Xie J, et al. Comparison of clinical and biomechanical outcomes between partial Fibulectomy and drug conservative treatment for medial knee osteoarthritis. Biomed Res Int, 2019, 2019: 4575424. [DOI] [PMC free article] [PubMed] [Google Scholar]
- 27. Altman R, Asch E, Bloch D, et al. Development of criteria for the classification and reporting of osteoarthritis. Classification of osteoarthritis of the knee. Diagnostic and therapeutic criteria Committee of the American Rheumatism Association. Arthritis Rheum, 1986, 29: 1039–1049. [DOI] [PubMed] [Google Scholar]
- 28. Wang X, Wei L, Lv Z, et al. Proximal fibular osteotomy: a new surgery for pain relief and improvement of joint function in patients with knee osteoarthritis. J Int Med Res, 2017, 45: 282–289. [DOI] [PMC free article] [PubMed] [Google Scholar]
- 29. ZeYu HY, Xu B, Shen B, Kraus VB, Pei F. Evidence and mechanism by which upper partial fibulectomy improves knee biomechanics and decreases knee pain of osteoarthritis. J Orthop Res, 2018. [DOI] [PMC free article] [PubMed] [Google Scholar]
- 30. Dong T, Chen W, Zhang F, Yin B, Tian Y, Zhang Y. Radiographic measures of settlement phenomenon in patients with medial compartment knee osteoarthritis. Clin Rheumatol, 2016, 35: 1573–1578. [DOI] [PubMed] [Google Scholar]
- 31. Cooke D, Scudamore A, Li J, Wyss U, Bryant T, Costigan P. Axial lower‐limb alignment: comparison of knee geometry in normal volunteers and osteoarthritis patients. Osteoarthritis Cartilage, 1997, 5: 39–47. [DOI] [PubMed] [Google Scholar]
- 32. Stanley JC, Robinson KG, Devitt BM, et al. Computer assisted alignment of opening wedge high tibial osteotomy provides limited improvement of radiographic outcomes compared to flouroscopic alignment. Knee, 2016, 23: 289–294. [DOI] [PubMed] [Google Scholar]
- 33. Navarro‐Holgado P, Carpintero‐Benitez P, Prieto‐Tarradas C. Acute traumatic fibular bowing associated with ankle fracture. Eur J Trauma Emerg Surg, 2008, 34: 188–190. [DOI] [PubMed] [Google Scholar]
- 34. Karkabi S, Reis ND. Fibular bowing due to tibial shortening in isolated fracture of the tibia: failure of late segmental fibulectomy to relieve ankle pain. Arch Orthop Trauma Surg, 1986, 106: 61–63. [DOI] [PubMed] [Google Scholar]
- 35. Manoli AN. Traumatic fibular bowing with tibial fracture: report of two cases. Orthopedics, 1978, 1: 145–148. [PubMed] [Google Scholar]