

Abstract
Objective
To compare the accuracy of combined independent risk factors in assessing the risk of hip fractures in elderly women.
Methods
Ninety elderly females who sustained hip fractures (including femoral neck fractures and intertrochanteric fractures) and 110 female outpatients without a hip fracture were included in our cross‐sectional study from 24 November 2017 to 20 May 2019. The age of subjects in the present study was ≥65 years, with the mean age of 78.73 ± 7.77 and 78.09 ± 5.03 years for women with and without elderly hip fractures, respectively. Bone mineral density (BMD), Beta‐carboxy terminal telopeptide (β‐CTX), N‐terminal/mid region (N‐MID), and 25(OH)D levels were analyzed. A novel evaluation model was established to evaluate combined indicators in assessing hip fractures in elderly women.
Results
Compared with the control group, taller height (155.68 ± 6.40 vs 150.97 ± 6.23, P < 0.01), higher levels of β‐CTX (525.91 ± 307.38 vs 330.94 ± 289.71, P < 0.01), and lower levels of total hip BMD (0.662 ± 0.117 vs 0.699 ± 0.111, P = 0.022), femoral neck BMD (0.598 ± 0.106 vs 0.637 ± 0.100, P = 0.009), and 25(OH)D (15.67 ± 7.23 vs 29.53 ± 10.57, P < 0.01) were found in the facture group. After adjustment for confounding factors, logistic regression analysis revealed that 25(OH)D (adjusted OR 0.837 [95% CI 0.790–0.886]; P < 0.01), femoral neck BMD (adjusted OR 0.009 [95% CI 0.000–0.969]; P = 0.048) and height (adjusted OR 1.207 [95% CI 1.116–1.306]; P < 0.01) remained risk factors for hip fractures in elderly women. Then a model including independent risk factors was established. A DeLong test showed the area under the receiver operator characteristic (ROC) (Area under the curve [AUC]) of 25(OH)D was significantly greater than that for femoral neck BMD (P < 0.01) and height (P < 0.01). The AUC of model including 25(OH)D and height was significantly greater than that of other combinations (P < 0.01).
Conclusion
25(OH)D, femoral neck BMD and height were associated with the occurrence of hip fractures in elderly women even after adjustment for confounding factors, and a model including 25(OH)D and height could provide better associated power than other combinations in the assessment of elderly hip fractures.
Keywords: Bone mineral density, Bone turnover markers, Combined indicators, 25(OH)D, Osteoporotic hip fracture
A novel evaluation model was established to evaluate combined indicators in assessing hip fracture in elderly women. The results found that the model including 25(OH)D and height could provide better associated power than other combinations in the assessment of elderly hip fracture.
Introduction
With aging societies around the world, the incidence of hip fracture in elderly populations is also increasing. In fact, the number of hip fractures in the elderly is expected to reach 6.3 million in 2050 1 . Additionally, it is estimated that medical expenditures for hip fracture in China will reach US$60 billion in 2020 and US$240 billion by 2040, which results in enormous burden to individuals, families and society. Hip fractures in the elderly are defined as those involving the femoral neck and intertrochanter in patients ≥65 years of age, which are frequently caused by low‐energy trauma (such as fall from standing height). These fractures have also been termed ‘osteoporotic fractures’ and characterized by bone mass reduction and microstructural destruction. Such changes are likely to lead to decreasing bone strength and consequent increases in fracture risk. Due to poor physical conditioning and more underlying disease and co‐morbidity, treatment of these fractures in this population remains a clinical dilemma given that on one hand, prolonged time in bed brought by non‐operative treatment is disastrous for an increased number of complications and mortality and, on the other, operative treatment (including internal fixation and arthroplasty) is also prone to various failures owing to osteoporosis, which in turn exacerbates damage. To prevent or, at least mitigate, risk for fractures, it is crucial to identify indices most associated with hip fracture. Bone mineral density (BMD) measured by dual‐energy X‐ray absorptiometry (DXA) is the basis of definition of osteoporosis according to World Health Organization. Although BMD has been verified to be related to osteoporotic fractures in the literature 2 , osteoporosis (T‐score < −2.5) is frequently absent in the majority of elderly individuals who sustain hip fracture 3 , 4 , 5 , 6 . Additionally, BMD is a static indicator, which cannot reflect bone turnover status at the time of measurement 7 , 8 . As such, BMD is clearly not suitable as a sensitive indicator in monitoring fractures. In recent years, investigators have devoted more attention to bone turnover markers (BTMs), which have been demonstrated as potential indicators of the risk for hip fracture in elderly patients because they are easy to measure and can reflect bone metabolic status in real time. Bone turnover comprises two processes: bone formation of osteoblasts and bone resorption of osteoclasts. During resorption, the components of bone tissue are metabolized and released into the bloodstream and urine. Osteoblasts then secrete small osteoid molecules to start the process of bone formation. The level of bone turnover activity can be assessed by measuring the concentration of such metabolites in the blood 9 . Some researchers found that higher levels of BTMs, particularly levels of resorption markers, are usually considered to be associated with increased fracture risk 10 , 11 . However, controversy persists about whether BTMs are associated with hip fracture in the elderly 12 , 13 , 14 , 15 , 16 , 17 , 18 . The reasons for this controversy may be attributed to study design (i.e., prospective or retrospective), sample size, differences in metabolic indices selected, and whether a sufficient number of confounding factors of bone metabolism have been taken into account. As a blood‐based biochemical index, BTMs can be affected by many factors including age, sex, drug use, metabolic disease, circadian rhythm, and exercise level. Recent studies tend to investigate the relationship between BTMs and the incidence of hip fractures in elderly women rather than men because no significant differences were found in baseline levels among men in any age groups. However, the value of BTMs accelerates rapidly after menopause, according to deficient estrogen, which means active bone turnover could have greater impact on elderly postmenopausal women 19 .
Vitamin D (25[OH]D) status is also closely related to bone turnover 20 . The role vitamin D plays is to maintain plasma calcium, phosphate and bone mineral homeostasis. Bone resorption and bone formation are stimulated or inhibited by vitamin D activities in the skeleton. Osteoblasts, osteocytes and osteoclasts can all respond to vitamin D through the nuclear vitamin D receptor directly or by metabolizing 25‐hydroxyvitamin D to 1,25‐dihydroxyvitamin D to activate the vitamin D receptor and modulate gene expression. Vitamin D deficiency (<20 ng/mL) may lead to secondary hyperparathyroidism, which accelerates bone remodeling, bone loss and subsequent increased fracture risk 21 . Many studies have found that adequate vitamin D levels could prevent—or at least mitigate—the incidence of fractures 22 , 23 . Besides, other baseline indicators, like height, are also associated with the incidence of elderly hip fractures 24 . Therefore, elderly hip fractures should be comprehensively studied.
Although previous studies have confirmed many risk factors that are associated with the incidence of hip fracture in the elderly, but limited study has investigated the relationship between combined indicators and hip fracture in elderly women. We hypothesized that combined indicators could provide better performance in assessing the risk of hip fracture in elderly women. The purpose of the present study, therefore, was to identify the independent indicators for elderly hip fracture first, and then figure out the exact relationship between different indicators. Finally, to combine them to evaluate their accuracy in the incidence of hip fracture in Chinese elderly women.
Materials and Methods
Inclusion and Exclusion Criteria
Inclusion Criteria
The inclusion criteria were as follows: (i) postmenopausal women age ≥65 years old 19 ; (ii) patients experienced hip fractures (including femoral neck and intertrochanteric fractures), which were caused by low‐energy trauma (e.g., accidental falls), all patients had good levels of activity before fracture (a total score of Parker Mobility Scale ≥8); (iii) control group with good levels of activity (a total score of Parker Mobility Scale ≥8) presented to orthopedists for physical examination; (iv) BMD of lumbar spine and hip, serum levels of BTMs (β‐CTX and N‐MID) and 25(OH)D were measured and analyzed; and (v) cross‐sectional study.
Exclusion Criteria
Exclusion criteria: (i) participants with supplementary history of calcium, vitamin D and anti‐osteoporosis drugs; (ii) previous history of hip fracture, dementia or stroke; and (iii) those with metabolic‐related diseases (including thyroid disease, renal insufficiency, diabetes) or tumors.
Study Design
Ultimately, 90 female patients who sustained hip fractures were included in the case group and 110 female outpatients without hip fractures were included in the control group. All patients were educated about the purpose of the study and provided informed consent to participate. The study protocol was reviewed by the Ethics Committee of Shanghai Sixth People's Hospital (Shanghai, China; approval number, 2017–152), and successfully registered with the China Clinical Trial Center, registration number ChiCTR‐ONC‐17013389.
Clinical Assessment
Body Mass Index (BMI)
BMI is a person's weight (kg) divided by the square of height (m), which is commonly used to measure body fatness and health. Normal reference of BMI is between 18.5 and 24 kg/m2. A BMI of less than 18.5 kg/m2 and more than 24 kg/m2 are considered underweight and overweight, respectively.
Bone Mineral Density (BMD)
BMD is a major determinant of bone strength and fracture risk. In the present study, BMD of lumbar spine and contralateral (nonfractured) proximal femur were measured by DXA (Lunar Corp, Madison, WI, USA). The value of BMD was expressed as g/cm3, which is an absolute value. T score is a relative value, and the normal reference is between −1 and +1, T value between −2.5 and −1 is defined as osteopenia, when T < −2.5 SD was defined as osteoporosis.
25‐Hydroxyvitamin D (25[OH]D)
The active form of vitamin D (i.e., 1,25[OH]2D) is synthesized from 25(OH)D in the kidney. However, the half‐life of 1,25(OH)2D is extremely short and is not suitable for assessing vitamin D status in the body 25 . Because 25(OH)D is believed to reflect the activity of 1,25(OH)2D, 25(OH)D was measured to represent vitamin D status in the body. Vitamin D status can be classified as deficient (<20 ng/mL), insufficient (20–30 ng/mL) or sufficient (≥30 ng/mL) according to serum 25(OH)D concentration 26 . Serum concentrations of 25(OH)D was estimated using a commercially available electrochemiluminescence kit (E601, Roche Diagnostics, Basel, Switzerland).
Beta‐Carboxy Terminal Telopeptide (β‐CTX)
β‐CTX is a special product of cathepsin K‐mediated osteolysis and released during the direct digestion of bone with cathepsin K and represents the process of bone resorption 27 . Serum concentrations of β‐CTX was estimated using a commercially available electrochemiluminescence kit (E601, Roche Diagnostics, Basel, Switzerland). β‐CTX was measured the morning at fasting status after patients were admitted to hospital 11 , 28 , 29 . β‐CTX of control group was also measured at fasting status in the morning.
N‐Terminal/Mid Region (N‐MID)
Osteocalcin is the most abundant non‐collagen protein in bone matrix, and is secreted into the systemic circulation by osteoblasts during the process of bone formation. However, the half‐life of osteocalcin is very short; as such, its degradation form, N‐MID, is more clinically useful as a marker of bone formation 30 . Serum concentrations of N‐MID were estimated using a commercially available electrochemiluminescence kit (E601, Roche Diagnostics, Basel, Switzerland). N‐MID was measured the morning at fasting status after patients were admitted to hospital 11 , 28 , 29 . N‐MID of the control group was also measured at fasting status in the morning.
Parker Mobility Scale
The Parker Mobility Scale consists of three questions, each valued 0–3 points. Based on the sum of the mobility assessment in three different situations (be able to get about the house, be able to leave the house, and be able to shop), the total score is between 0 and 9. For each of the three situations the mobility must be scored: no difficulty (3 points), with an aid (2 points), with help from another person (1 point) or not at all (0 points). The highest total score of 9 indicates the best mobility.
Statistical Analysis
Data are expressed as mean and standard deviation (SD). First, however, data normality of each group was tested. The variables were then tested using the independent samples t‐test or Mann–Whitney test, and qualitative data were compared using the chi‐squared test. The paired t‐test was performed on BMD data from the femoral neck and intertrochanteric region in patients with femoral neck or intertrochanteric fractures, and those in the control group. Spearman's correlation analysis was then performed on the total sample to analyze possible relationships between the variables. Logistics regression analysis was performed to determine independent risk factors (using BTMs, 25[OH]D and BMD as continuous variables). Finally, risk factors were analyzed using receiver operator characteristic (ROC) curve analysis. The accuracy of each indicator was judged according to the area under the curve (AUC). The DeLong test was used to compare AUC values for the different variables. An evaluation model was then established by combining independent indicators in an attempt to achieve better performance. Data analysis was performed using SPSS (version 25.0, IBM Corporation, Armonk, NY, USA) and MedCalc (version 19.0, MedCalc Software bv, Ostend, Belgium); differences with P < 0.05 were considered to be statistically significant.
Results
General Data and Baseline Characteristics
Demographic information for the case and control groups and baseline data of the test variables are summarized in Table 1. Analysis revealed that individuals in the case (i.e., fracture) group were significantly taller than those in the control group (155.68 cm vs 150.97 cm; P < 0.01). The mean level of 25(OH)D in the case group was significantly lower than in the control group (15.67 ng/mL vs 29.53 ng/mL; P < 0.01). Regarding BTMs, the concentration of the osteoclast indicator β‐CTX in the case group was significantly higher than in the control group (525.91 ng/L vs 330.94 ng/L; P < 0.01). In terms of BMD and t‐score, mean total hip BMD and femoral neck BMD of the case group were significantly lower than in the control group (0.662 g/cm2 vs 0.699 g/cm2, P = 0.022 and 0.598 g/cm2 vs 0.637 g/cm2, P = 0.009, respectively). T‐scores for overall hip and femoral neck in the case group were also significantly lower than in the control group (−2.4 vs −2.1, P = 0.022 and −2.6 vs −2.3, P = 0.001, respectively).
TABLE 1.
Baseline data of indicators
| Characteristic | Fracture group (n = 90) | Control group (n = 110) | P value |
|---|---|---|---|
| Age (years) | 78.73 (7.77) | 78.09 (5.03) | 0.50 |
| Height (cm) | 155.68 (6.40) | 150.97 (6.23) | <0.01 |
| Weight (kg) | 54.04 (8.65) | 52.79 (9.66) | 0.340 |
| BMI (kg/m2) | 22.29 (3.25) | 23.15 (3.97) | 0.101 |
| β‐CTX (ng/L) | 525.91 (307.38) | 330.94 (289.71) | <0.01 |
| N‐MID (ng/mL) | 15.21 (6.09) | 14.47 (7.11) | 0.435 |
| 25(OH)D (ng/mL) | 15.67 (7.23) | 29.53 (10.57) | <0.01 |
| <20 ng/mL | 71 (78.89%) | 22 (20.00%) | <0.01 |
| ≥20 ng/mL | 19 (21.11%) | 88 (80.00%) | <0.01 |
| Total hip BMD (g/cm2) | 0.662 (0.117) | 0.699 (0.111) | 0.022 |
| Femoral neck BMD (g/cm2) | 0.598 (0.106) | 0.637 (0.100) | 0.009 |
| Intertrochanteric BMD (g/cm2) |
0.506 (0.107) (n = 85) |
0.518 (0.099) (n = 87) |
<0.01 |
| Lumbar spine BMD (g/cm2) | 0.831 (0.148) | 0.829 (0.183) | 0.940 |
| Total hip T‐score | −2.4 (0.91) | −2.1 (0.87) | 0.022 |
| Femoral neck T‐score | −2.6 (0.82) | −2.3 (0.80) | 0.001 |
| Lumbar spine T‐score | −2.3 (1.26) | −2.2 (1.55) | 0.872 |
β‐CTX, C‐terminal telopeptide of type‐1 collagen; N‐MID, N‐MID fragment.
The chi‐squared test revealed that the percentage of patients with vitamin D deficiency in the case group was significantly higher than that in control group (78.89% vs 20.00%, P < 0.01). There were no significant differences between the case and control groups in terms of the osteoblast indicator N‐MID, lumbar spine BMD, lumbar T‐score, age, body weight, and body mass index (15.21 ng/mL vs 14.47 ng/mL, P = 0.435; 0.831 g/cm2 vs 0.829 g/cm2, P = 0.940; −2.3 vs ‐2.2, P = 0.872; 78.73 vs 78.09, P = 0.500; 54.04 kg vs 52.79 kg, P = 0.340 and 22.29 kg/m2 vs 23.15 kg/m2, P = 0.101, respectively).
Comparison of Femoral Neck BMD and Intertrochanteric BMD in Different Groups
The paired samples t‐test revealed that BMD of the femoral neck in the femoral neck fracture group (0.601 g/cm2 vs 0.508 g/cm2, P < 0.01), intertrochanteric fracture group (0.609 g/cm2 vs 0.511 g/cm2, P < 0.01), and control group (0.640 g/cm2 vs 0.518 g/cm2, P < 0.01) was always greater than that for the intertrochanteric region (Fig. 1).
Fig. 1.
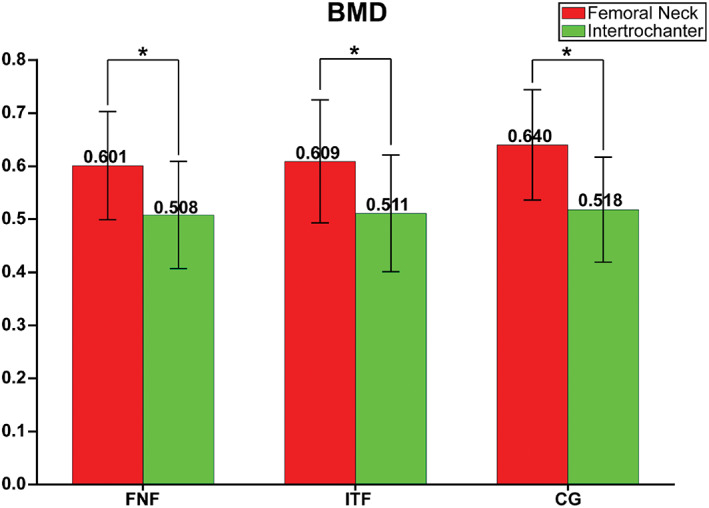
Paired t‐test showed BMD of Femoral neck was significantly higher than that of intertrochanter in Femoral neck fracture patients, intertrochanteric fracture patients and healthy controls, which means BMD is less likely to be associated with the exact type of hip fracture. *P < 0.01; CG, Control group; FNF, Femoral neck fracture; ITF, Intertrochanteric fracture.
Spearman Correlation Analysis of Variables
Considering overall data of the case and control groups, Spearman correlation analysis revealed that 25(OH)D was significantly correlated with marker of bone resorption (β‐CTX) (r = −0.425, P < 0.01), marker of bone formation (N‐MID) (r = −0.237, P = 0.001), and overall hip (r = 0.189, P = 0.007) and femoral neck (r = 0.211, P = 0.003) BMD. Moreover, age was also significantly correlated with femoral neck (r = −0.303, P < 0.01) and total hip (r = −0.348, P < 0.01) BMD. In addition, there was also a significant correlation between the osteoclast indicator β‐CTX and osteoblast indicator N‐MID (r = 0.697, P < 0.01), and total hip BMD (r = −0.219, P < 0.01) (Table 2).
TABLE 2.
Correlation between indicators in total population
| Variables | Age | β‐CTX | N‐MID | 25(OH)D | Femoral neck BMD | Total hip BMD | Lumbar spine BMD |
|---|---|---|---|---|---|---|---|
| Age | — | 0.114 | 0.068 | −0.109 | −0.303** | −0.348** | −0.014 |
| β‐CTX | 0.114 | — | 0.697** | −0.425** | −0.072 | −0.219** | −0.083 |
| N‐MID | 0.068 | 0.697** | — | −0.237** | −0.122 | −0.277** | −0.122 |
| 25(OH)D | −0.109 | −0.425** | −0.237** | — | 0.211** | 0.189** | −0.037 |
| Femoral neck BMD | −0.303** | −0.072 | −0.122 | 0.211** | — | 0.798 | 0.551** |
| Total hip BMD | −0.348** | −0.219** | −0.277** | 0.189** | 0.798** | — | 0.573** |
| Lumbar spine BMD | −0.014 | −0.083 | −0.122 | −0.037 | 0.551** | 0.573** | — |
β‐CTX, C‐terminal telopeptide of type‐1 collagen; N‐MID, N‐MID fragment.
P < 0.01.
Logistic Regression Analysis of 25[OH]D, β‐CTX, N‐MID and BMD
The results of binary logistics regression revealed that 25(OH)D (crude odds ratio [OR] 0.838 [95% confidence interval 0.797–0.880]; P < 0.01), β‐CTX (crude OR 1.002 [95% CI 1.001–1.003]; P < 0.01), femoral neck BMD (crude OR 0.025 [95% CI 0.001–0.421]; P = 0.01) and height (crude OR 1.127 [95% CI 1.072–1.186]; P < 0.01) were associated with hip fracture in elderly women. After adjustment for confounding factors, 25(OH)D (adjusted OR 0.837 [95% CI 0.790–0.886]; P < 0.01), femoral neck BMD (adjusted OR 0.009 [95% CI 0.000–0.969]; P = 0.048) and height (adjusted OR 1.207 [95% CI 1.116–1.306]; P < 0.01) remained risk factors for hip fracture in elderly women (Table 3).
TABLE 3.
Logistic regression of each indicator
| Model 1 (crude) | Model 2 (adjusted) | |||
|---|---|---|---|---|
| Variables | OR (95% CI) | P value | OR (95% CI) | P value |
| Age | 1.016 (0.972 – 1.061) | 0.480 | 1.036 (0.965 – 1.112) | 0.326 |
| Weight | 1.015 (0.985 – 1.046) | 0.339 | 0.988 (0.936 – 1.042) | 0.644 |
| Height | 1.127 (1.072 – 1.186) | <0.01 | 1.207 (1.116 – 1.306) | <0.01 |
| β‐CTX | 1.002 (1.001 – 1.003) | <0.01 | 1.001 (1.000 – 1.002) | 0.153 |
| N‐MID | 1.017 (0.975 – 1.061) | 0.435 | 0.948 (0.896 – 1.004) | 0.068 |
| 25(OH)D | 0.838 (0.797 – 0.880) | <0.01 | 0.837 (0.790 – 0.886) | <0.01 |
| Femoral neck BMD | 0.025 (0.001 – 0.421) | 0.01 | 0.009 (0.000 – 0.969) | 0.048 |
β‐CTX, C‐terminal telopeptide of type‐1 collagen; N‐MID, N‐MID fragment; adjusted for age, height and weight.
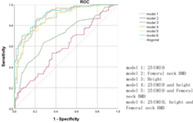
Accuracy of Combined Indicators in Assessing Elderly Hip Fractures
Finally, a novel evaluation model was established by combining independent indicators in an attempt to achieve better performance (Model 1: 25[OH]D; Model 2: Femoral neck BMD; Model 3: Height; Model 4: 25[OH]D and height; Model 5: 25[OH]D and femoral neck BMD; Model 6: 25[OH]D, height and femoral neck BMD). ROC curve analysis was used to compare the accuracy of indicators in elderly women who sustained fractures, with AUCs for models 1, 2, 3, 4, 5 and 6 were 0.867, 0.586, 0.706, 0.898, 0.867 and 0.905 respectively (Table 4). The DeLong test revealed that the AUC for Model 1 was significantly greater than for Model 2 (P < 0.01) and Model 3 (P < 0.01). There was no significant difference in AUC between Model 2 and Model 3 (P = 0.06). AUC for Model 4 was significantly greater than for Model 1(P = 0.02) and Model 5(P = 0.03). There was no significant difference in AUC between Model 4 and Model 6 (P = 0.36) (Table 5). The cut‐off value for 25(OH)D was calculated to be 19.21 ng/mL.
TABLE 4.
Correlation models of elderly hip fracture
| Model | Included indicators | Sensitivity (%) | Specificity (%) | AUC (95%CI) |
|---|---|---|---|---|
| 1 | 25(OH)D | 77.8 | 81.8 | 0.867 (0.818–0.916) |
| 2 | Femoral neck BMD | 53.3 | 63.6 | 0.586 (0.507–0.665) |
| 3 | Height | 63.3 | 71.8 | 0.706 (0.633–0.778) |
| 4 | 25(OH)D and height | 86.7 | 78.2 | 0.898 (0.856–0.940) |
| 5 | 25(OH)D and Femoral neck BMD | 70.0 | 88.2 | 0.867 (0.818–0.916) |
| 6 | 25(OH)D, height and Femoral neck BMD | 84.4 | 79.1 | 0.905 (0.865–0.945) |
P value is the result of Delong test between 25(OH)D and different models.
AUC, area under the curve; β‐CTX, C‐terminal telopeptide of type‐1 collagen; N‐MID, N‐MID fragment.
TABLE 5.
Pairwise comparison of ROC curves
| Z statistic | P value | |
|---|---|---|
| Model 1 – Model 2 | 6.438 | <0.01 |
| Model 1 – Model 3 | 3.454 | <0.01 |
| Model 2 – Model 3 | 1.871 | 0.06 |
| Model 1 – Model 4 | 2.351 | 0.02 |
| Model 1 – Model 5 | 0.027 | 0.98 |
| Model 1 – Model 6 | 2.571 | <0.01 |
| Model 4 – Model 5 | 2.163 | 0.03 |
| Model 4 – Model 6 | 0.917 | 0.36 |
| Model 5 – Model 6 | 2.611 | <0.01 |
AUC, area under the curve; β‐CTX, C‐terminal telopeptide of type‐1 collagen; N‐MID, N‐MID fragment. Model 1, 25(OH)D; Model 2, Femoral neck BMD; Model 3, Height; Model 4, 25(OH)D and Height; Model 5, 25(OH)D and Femoral neck BMD; Model 6, 25(OH)D, Height and Femoral neck BMD.
Discussion
Single Indicator as a Risk Factor of Elderly Hip Fractures
BMD has long been considered to be an important indicator of hip fracture risk in elderly women. The present study demonstrated that total hip BMD, femoral neck BMD, and corresponding T‐score in elderly women with hip fracture were significantly lower than those in the control group, while no significant difference was detected in lumbar BMD, which is consistent with previous meta‐analysis 31 . This indicated that, in elderly women who sustained hip fracture, BMD of the hip was significantly reduced, which in turn, led to a predisposition to hip fracture 32 . Therefore, it is necessary to devote close attention to the local changes in hip BMD in elderly women, which may prevent or, at least mitigate, the occurrence of hip fracture in the elderly. However, it is less likely to be associated with the exact type of hip fracture because BMD of the intertrochanteric region was always significantly lower than that of the femoral neck in all three groups (i.e., femoral neck, intertrochanter, and control).
Results of the present study revealed that neither β‐CTX nor N‐MID was related to the incidence of hip fracture in the elderly after adjustment for confounding factors, which is consistent with previous prospective study 13 . However, our result was inconsistent with that of Fan et al. 12 . One possible reason for the differences may be the sampling time. In our patients, blood samples were all obtained on the next morning at fasting status after fractures, while theirs were collected within 1 week after admission in the study by Fan et al.12 . As time progresses, the impact of fracture on bone turnover is increasingly obvious 28 . Therefore, the concentration of BTMs may be severely affected by fracture status, which would lead to an acceleration in the bone turnover process, resulting in an increase in β‐CTX and N‐MID levels. Our results do not support the use of β‐CTX and N‐MID as independent risk factors in elderly hip fractures.
Vitamin D deficiency is very common in postmenopausal women. The present study demonstrated that 25(OH)D levels in the case group were significantly lower than those in the control group, which suggests that the 25(OH)D level is also associated with hip fracture in elderly women 12 , 25 , 33 , 34 . In addition, the AUC for 25(OH)D was significantly higher than that of femoral neck BMD and height, indicating that 25(OH)D may be a more dependable and effective indicator in the assessment of hip fracture in elderly Chinese women. In the present study, we selected participants with age paired to eliminate the impact of age on each indicator. We found that height of people in case group was significantly taller than that in control group, and weight was similar between groups, which is consistent with previous a study 24 . The association between body height and elderly hip fracture may be due to the risk of hip fracture was increased by the great potential energy of the fall 35 . Furthermore, femoral moment arm of a taller person is greater than that of a shorter person, which might result in less force needed to break the hip 36 .
Relationship Between Different Indicators
The relationship between vitamin D and BTMs or vitamin D and BMD has been explored in many studies 21 , 37 , 38 . Spearman correlation analysis was used because some variables in the present study (e.g., β‐CTX) were not normally distributed. The results revealed that 25(OH)D was negatively correlated with β‐CTX and N‐MID, which suggests that 25(OH)D levels could affect the levels of relevant BTMs 12 . In addition, the present study also found that 25(OH)D was positively correlated with total hip and femoral neck BMD, which is consistent with previous studies 39 , 40 . These results demonstrated that 25(OH)D is more associated with hip fracture in the elderly women. However, Garnero et al. and Seamans et al. found no correlation between vitamin D levels and BTMs in their research 21 , 41 . This can partially be explained by racial differences in vitamin D status. In a study investigating vitamin D status among Chinese, Indians, and Malays living in Malaysia, researchers found that Malays and Indians are more vulnerable to vitamin D deficiency than the Chinese, which is possibly because darker‐skinned individuals require more sunlight to synthesize vitamin D in the skin 42 , 43 . The study subjects in the present study were all elderly Chinese women, which is completely different from that in the studies by Garnero et al. and Seamans et al. Therefore, further studies are needed to explore the actual relationship between vitamin D and BTMs (i.e., vitamin D and BMD) in different ethnic groups.
Combined Indicators in the Assessment of Elderly Hip Fracture Risk
The aim of the present study was to compare the accuracy of combined independent risk factors in assessing the risk for hip fracture in elderly women. Here, we presented indicators associated with elderly hip fracture and established an evaluation model combined independent indicators in attempts to achieve better evaluative power. The results showed that accuracy was significantly improved when 25(OH)D was combined with height, indicating that the combined indicators of 25(OH)D and height were more reliable than other combinations in assessing the risk of hip fracture in elderly women. According to the evidenced‐based evaluation model, model including 25(OH)D and height may be clinically useful in the assessment of elderly hip fracture even without BMD of hip.
Strengths and Limitations
Strengths included the fact that indicators were measured within 24 h after fractures to eliminate the possible impact of fracture on each indicator. Different from previous research, a large number of factors affecting the accuracy of BTMs measurement were taken into account in the present study (see the ‘Materials and Methods’ section for details).
The present study has some limitations. First, we only measured β‐CTX and N‐MID, so the results could not apply to other BTMs, more BTMs like procollagen type I N propeptide (PINP) and N‐terminal crosslinking telopeptide of type I collagen (NTX‐ I) should be further investigated. Second, the present study found that height was associated with the incidence of the elderly hip fractures, but biomechanical mechanism behind it is still uncertain and needs to be further studied. Third, parathyroid hormone (PTH), which could affect the value of 25(OH)D was not included. Fourth, the inherent limitation of cross‐sectional study should be considered and the sample size is relatively small. Therefore, multi‐center, prospective studies should be conducted in the future.
Conclusion
Based on the results of the present study, BMD of the hip in elderly women with hip fracture was significantly lower than that of control patients without hip fracture, while no significant difference about lumbar spine BMD was found between them. 25(OH)D, femoral neck BMD and height were associated with the occurrence of hip fracture in elderly women, and models including 25(OH)D and height were more reliable than other combinations in the assessment of elderly hip fracture even without total hip BMD. β‐CTX and N‐MID proved not to be independent risk factors for hip fracture in elderly women. The relationship between vitamin D and BTMs is still controversial, further studies are needed to explore the actual relationship in different ethnic groups.
Grant Sources: W.‐T.J. received funding from the National Key Research and Development Program of China (No. 2018YFC1106300), Shanghai Municipal Education Commission ‐ Gaofeng Clinical Medicine Grant Support (Grant No. 20172026), and Shanghai Talents Development Fund (Grant No. 2017035).
Disclosure: The author reports no conflicts of interest in this work.
Wei‐tao Jia and Sheng‐bao Chen are corresponding co‐authors.
Authorship declaration: All authors listed meet the authorship criteria according to the latest guidelines of the International Committee of Medical Journal Editors, and all authors are in agreement with the manuscript.
References
- 1. Cooper C, Campion G, Melton LJ. Hip fractures in the elderly: a world‐wide projection. Osteoporos Int, 1992, 2: 285–289. [DOI] [PubMed] [Google Scholar]
- 2. Curtis EM, Harvey NC, D'Angelo S, et al. Bone mineral content and areal density, but not bone area, predict an incident fracture risk: a comparative study in a UKprospective cohort. Arch Osteoporos, 2016, 11: 39. [DOI] [PMC free article] [PubMed] [Google Scholar]
- 3. Siris ES, Chen YT, Abbott TA, et al. Bone mineral density thresholds for pharmacological intervention to prevent fractures. Arch Intern Med, 2004, 164: 1108–1112. [DOI] [PubMed] [Google Scholar]
- 4. Sornay‐Rendu E, Munoz F, Garnero P, Duboeuf F, Delmas PD. Identification of osteopenic women at high risk of fracture: the OFELY study. J Bone Miner Res, 2005, 20: 1813–1819. [DOI] [PubMed] [Google Scholar]
- 5. Schuit SC, van der Klift M, Weel AE, et al. Fracture incidence and association with bone mineral density in elderly men and women: the Rotterdam study. Bone, 2004, 34: 195–202. [DOI] [PubMed] [Google Scholar]
- 6. van Daele PL, Seibel MJ, Burger H, et al. Case‐control analysis of bone resorption markers, disability, and hip fracture risk: the Rotterdam study. BMJ, 1996, 312: 482–483. [DOI] [PMC free article] [PubMed] [Google Scholar]
- 7. Takahashi M, Kushida K, Hoshino H, Ohishi T, Inoue T. Evaluation of bone turnover in postmenopause, vertebral fracture, and hip fracture using biochemical markers for bone formation and resorption. J Endocrinol Invest, 1997, 20: 112–117. [DOI] [PubMed] [Google Scholar]
- 8. Dirschl DR, Piedrahita L, Henderson RC. Bone mineral density 6 years after a hip fracture: a prospective, longitudinal study. Bone, 2000, 26: 95–98. [DOI] [PubMed] [Google Scholar]
- 9. Eastell R, Szulc P. Use of bone turnover markers in postmenopausal osteoporosis. Lancet Diabetes Endocrinol, 2017, 5: 908–923. [DOI] [PubMed] [Google Scholar]
- 10. Johansson H, Odén A, Kanis JA, et al. A meta‐analysis of reference markers of bone turnover for prediction of fracture. Calcif Tissue Int, 2014, 94: 560–567. [DOI] [PubMed] [Google Scholar]
- 11. Shiga T, Tsuji Y, Fujioka M, Kubo T. Risk factors for hip fracture in Japanese elderly women with osteoporosis: applicability of biochemical markers in bone turnover. Geriatr Gerontol Int, 2009, 9: 69–74. [DOI] [PubMed] [Google Scholar]
- 12. Fan J, Li N, Gong X, He L. Serum 25‐hydroxyvitamin D, bone turnover markers and bone mineral density in postmenopausal women with hip fractures. Clin Chim Acta, 2018, 477: 135–140. [DOI] [PubMed] [Google Scholar]
- 13. Dai Z, Wang R, Ang LW, Yuan JM, Koh WP. Bone turnover biomarkers and risk of osteoporotic hip fracture in an Asian population. Bone, 2016, 83: 171–177. [DOI] [PMC free article] [PubMed] [Google Scholar]
- 14. Crandall CJ, Vasan S, LaCroix A, et al. Bone turnover markers are not associated with hip fracture risk: a case‐control study in the Women's Health Initiative. J Bone Miner Res, 2018, 33: 1199–1208. [DOI] [PMC free article] [PubMed] [Google Scholar]
- 15. Gerdhem P, Ivaska KK, Alatalo SL, et al. Biochemical markers of bone metabolism and prediction of fracture in elderly women. J Bone Miner Res, 2004, 19: 386–393. [DOI] [PubMed] [Google Scholar]
- 16. Bauer DC, Garnero P, Harrison SL, et al. Biochemical markers of bone turnover, hip bone loss, and fracture in older men: the MrOS study. J Bone Miner Res, 2009, 24: 2032–2038. [DOI] [PMC free article] [PubMed] [Google Scholar]
- 17. Takahashi M, Naitou K, Ohishi T, Nagano A. Comparison of biochemical markers of bone turnover and bone mineral density between hip fracture and vertebral fracture. J Clin Densitom, 2003, 6: 211–218. [DOI] [PubMed] [Google Scholar]
- 18. Ivaska KK, Gerdhem P, Väänänen HK, Akesson K, Obrant KJ. Bone turnover markers and prediction of fracture: a prospective follow‐up study of 1040 elderly women for a mean of 9 years. J Bone Miner Res, 2010, 25: 393–403. [DOI] [PubMed] [Google Scholar]
- 19. Yoshimura N, Muraki S, Oka H, Kawaguchi H, Nakamura K, Akune T. Biochemical markers of bone turnover as predictors of osteoporosis and osteoporotic fractures in men and women: 10‐year follow‐up of the Taiji cohort. Mod Rheumatol, 2011, 21: 608–620. [DOI] [PubMed] [Google Scholar]
- 20. Morris HA. Vitamin D activities for health outcomes. Ann Lab Med, 2014, 34: 181–186. [DOI] [PMC free article] [PubMed] [Google Scholar]
- 21. Garnero P, Munoz F, Sornay‐Rendu E, Delmas PD. Associations of vitamin D status with bone mineral density, bone turnover, bone loss and fracture risk in healthy postmenopausal women. OFELY Study Bone, 2007, 40: 716–722. [DOI] [PubMed] [Google Scholar]
- 22. Lips P, Gielen E, van Schoor NM. Vitamin D supplements with or without calcium to prevent fractures. Bonekey Rep, 2014, 3: 512. [DOI] [PMC free article] [PubMed] [Google Scholar]
- 23. Ryan JW, Reinke D, Kogawa M, et al. Novel targets of vitamin D activity in bone: action of the vitamin D receptor in osteoblasts, osteocytes and osteoclasts. Curr Drug Targets, 2013, 14: 1683–1688. [DOI] [PubMed] [Google Scholar]
- 24. Chen FP, Fu TS, Lin YC, Fan CM. Risk factors and quality of life for the occurrence of hip fracture in postmenopausal women. Biom J, 2018, 41: 202–208. [DOI] [PMC free article] [PubMed] [Google Scholar]
- 25. Torbergsen AC, Watne LO, Wyller TB, et al. Vitamin K1 and 25(OH)D are independently and synergistically associated with a risk for hip fracture in an elderly population: a case control study. Clin Nutr, 2015, 34: 101–106. [DOI] [PubMed] [Google Scholar]
- 26. Holick MF. Vitamin D deficiency. N Engl J Med, 2007, 357: 266–281. [DOI] [PubMed] [Google Scholar]
- 27. Garnero P, Ferreras M, Karsdal MA, et al. The type I collagen fragments ICTP and CTX reveal distinct enzymatic pathways of bone collagen degradation. J Bone Miner Res, 2003, 18: 859–867. [DOI] [PubMed] [Google Scholar]
- 28. Vasikaran S, Eastell R, Bruyère O, et al. Markers of bone turnover for the prediction of fracture risk and monitoring of osteoporosis treatment: a need for international reference standards. Osteoporos Int, 2011, 22: 391–420. [DOI] [PubMed] [Google Scholar]
- 29. Walsh JS, Henriksen DB. Feeding and bone. Arch Biochem Biophys, 2010, 503: 11–19. [DOI] [PubMed] [Google Scholar]
- 30. Rosenquist C, Qvist P, Bjarnason N, Christiansen C. Measurement of a more stable region of osteocalcin in serum by ELISA with two monoclonal antibodies. Clin Chem, 1995, 41: 1439–1445. [PubMed] [Google Scholar]
- 31. Johnell O, Kanis JA, Oden A, et al. Predictive value of BMD for hip and other fractures. J Bone Miner Res, 2005, 20: 1185–1194. [DOI] [PubMed] [Google Scholar]
- 32. Kanis JA. Diagnosis of osteoporosis and assessment of fracture risk. Lancet, 2002, 359: 1929–1936. [DOI] [PubMed] [Google Scholar]
- 33. Cauley JA, Lacroix AZ, Wu L, et al. Serum 25‐hydroxyvitamin D concentrations and risk for hip fractures. Ann Intern Med, 2008, 149: 242–250. [DOI] [PMC free article] [PubMed] [Google Scholar]
- 34. Holvik K, Ahmed LA, Forsmo S, et al. Low serum levels of 25‐hydroxyvitamin D predict hip fracture in the elderly: a NOREPOS study. J Clin Endocrinol Metab, 2013, 98: 3341–3350. [DOI] [PubMed] [Google Scholar]
- 35. Hayes WC, Myers ER, Morris JN, Gerhart TN, Yett HS, Lipsitz LA. Impact near the hip dominates fracture risk in elderly nursing home residents who fall. Calcif Tissue Int, 1993, 52: 192–198. [DOI] [PubMed] [Google Scholar]
- 36. Flicker L, Faulkner KG, Hopper JL, et al. Determinants of hip axis length in women aged 10‐89 years: a twin study. Bone, 1996, 18: 41–45. [DOI] [PubMed] [Google Scholar]
- 37. Kharroubi A, Saba E, Smoom R, Bader K, Darwish H. Serum 25‐hydroxyvitamin D and bone turnover markers in Palestinian postmenopausal osteoporosis and normal women. Arch Osteoporos, 2017, 12: 13. [DOI] [PMC free article] [PubMed] [Google Scholar]
- 38. Tan KM, Saw S, Sethi SK. Vitamin D and its relationship with markers of bone metabolism in healthy Asian women. J Clin Lab Anal, 2013, 27: 301–304. [DOI] [PMC free article] [PubMed] [Google Scholar]
- 39. Sahota O, Masud T, San P, Hosking DJ. Vitamin D insufficiency increases bone turnover markers and enhances bone loss at the hip in patients with established vertebral osteoporosis. Clin Endocrinol, 1999, 51: 217–221. [DOI] [PubMed] [Google Scholar]
- 40. Kruger MC, Chan YM, Lau LT, et al. Calcium and vitamin D fortified milk reduces bone turnover and improves bone density in postmenopausal women over 1 year. Eur J Nutr, 2018, 57: 2785–2794. [DOI] [PubMed] [Google Scholar]
- 41. Seamans KM, Cashman KD. Existing and potentially novel functional markers of vitamin D status: a systematic review. Am J Clin Nutr, 2009, 89: 1997s–2008s. [DOI] [PubMed] [Google Scholar]
- 42. Hawkins RC. 25‐OH vitamin D3 concentrations in Chinese, Malays, and Indians. Clin Chem, 2009, 55: 1749–1751. [DOI] [PubMed] [Google Scholar]
- 43. Clemens TL, Adams JS, Henderson SL, Holick MF. Increased skin pigment reduces the capacity of skin to synthesise vitamin D3. Lancet, 1982, 1: 74–76. [DOI] [PubMed] [Google Scholar]