

Abstract
Introduction
Behavioral variant frontotemporal dementia (bvFTD) can be computationally divided into four distinct anatomic subtypes based on patterns of frontotemporal and subcortical atrophy. To more precisely predict disease trajectories of individual patients, the temporal stability of each subtype must be characterized.
Methods
We investigated the longitudinal stability of the four previously identified anatomic subtypes in 72 bvFTD patients. We also applied a voxel‐wise mixed effects model to examine subtype differences in atrophy patterns across multiple timepoints.
Results
Our results demonstrate the stability of the anatomic subtypes at baseline and over time. While they had common salience network atrophy, each subtype showed distinctive baseline and longitudinal atrophy patterns.
Discussion
Recognizing these anatomically heterogeneous subtypes and their different patterns of atrophy progression in early bvFTD will improve disease course prediction in individual patients. Longitudinal volumetric predictions based on these anatomic subtypes may be used as a more accurate endpoint in treatment trials.
Keywords: anatomic subtypes, behavioral variant frontotemporal dementia, disease progression, gray matter atrophy, longitudinal magnetic resonance imaging, neurodegenerative disease
1. INTRODUCTION
Behavioral variant frontotemporal dementia (bvFTD) is a clinically, neuroanatomically, and pathologically heterogeneous syndrome 1 , 2 , 3 , 4 most commonly caused by aggregation of two types of frontotemporal lobar degeneration (FTLD) pathology, FTLD‐tau and FTLD‐TDP. 5 Though neuropathological characteristics do not reliably predict distinct bvFTD clinical features, there is a specific correspondence between clinical symptoms and underlying neuroanatomy. 6 , 7 , 8 , 9 Pathognomonic symptoms of the bvFTD syndrome, including early decline of social behavior and personal conduct, such as loss of empathy, 10 , 11 , 12 coldness, 13 , 14 and compulsiveness, 15 correspond to neurodegeneration in specific cingulo‐insular and temporal lobe regions. However, both the symptom constellations and the underlying dysfunction in the associated intrinsically connected networks (ICNs) differ substantially across bvFTD patients. 3 Thus, using patterns of anatomy to categorize patients into distinct, stable, clinical subtypes of bvFTD is likely to elucidate specific mechanisms and vulnerabilities in the affected regions. Particularly if these anatomic bvFTD subtypes remain distinct over the disease course, such classification would yield an improved taxonomy to help clinicians better predict the longitudinal progression of an individual patient's atrophy and clinical symptoms.
In a recent cross‐sectional study, 3 we used a clustering algorithm to examine whether bvFTD patients can be grouped into different anatomic subtypes based on their pattern of volume loss at presentation. This approach revealed four bvFTD subtypes demonstrating highly divergent patterns of cortical and subcortical atrophy, predominantly in the salience (SN) 16 , 17 and semantic‐appraisal/limbic (SAN) 18 , 19 intrinsically connected networks, and corresponding to different patterns of clinical symptoms. Three of the four bvFTD subtypes showed distinct patterns of cortical atrophy in frontotemporal regions with modest to significant subcortical involvement, including two SN‐predominant subtypes (frontotemporal [SNFT] and frontal [SNF]) and a temporal lobe predominant SAN subtype. The fourth subtype showed significant subcortical atrophy with minimal cortical involvement (Subcortical).
In this follow‐up study, we included a sample of bvFTD patients (n = 72) with multiple timepoints, and investigated the temporal stability of these anatomic subtypes with disease progression. We first derived each patient's subtype identity at each timepoint and then examined whether each patient's anatomic subtype at baseline remained consistent throughout follow‐up, also demonstrating the reproducibility of the clustering approach in this sample. We then used a longitudinal voxel‐wise mixed model approach to identify the typical pattern of atrophy progression within each bvFTD subtype over time. We hypothesized that patients’ subtype as identified at baseline would remain stable over time, and that each of the four bvFTD subtypes would show a distinct pattern of cortical and subcortical atrophy progression, particularly in the SN and SAN.
RESEARCH IN CONTEXT
Systematic Review: The authors reviewed all peer‐reviewed articles on cross‐sectional and longitudinal gray matter atrophy in patients with behavioral variant frontotemporal dementia (bvFTD) that were available on PubMed. Two cross‐sectional studies have shown the presence of anatomic subtypes of bvFTD based on patterns of cortical and subcortical atrophy. No previous study has investigated whether these subtypes show temporal stability or distinct patterns of longitudinal atrophy.
Interpretation: Our findings show that the four anatomic subtypes of bvFTD are replicable, are stable over the course of disease progression, and reflect divergent patterns of longitudinal atrophy. This knowledge will help clinicians and clinical researchers to better predict and track individual patients’ disease progression.
Future directions: Although our study further disentangles the neuroanatomical heterogeneity of bvFTD, future studies still are needed to investigate whether the temporally stable anatomic subtypes are characterized by divergent functional and white matter signatures or behavioral phenotypes.
HIGHLIGHTS
Behavioral variant frontotemporal dementia (bvFTD) comprises four anatomic subtypes.
Three subtypes are characterized by frontotemporal atrophy and one by subcortical atrophy.
The temporal stability of the subtypes as disease advanced ranges from 79% to 100%.
Each subtype has a divergent pattern of longitudinal cortico‐subcortical atrophy.
Evidence of stable bvFTD subtypes will help predict individual disease progression.
2. MATERIAL AND METHODS
2.1. Participants
In this retrospective observational study, we enrolled 72 patients who were seen at the University of California, San Francisco (UCSF) Memory and Aging Center between 1998 and 2016 and who were diagnosed with bvFTD according to the International bvFTD Criteria Consortium (FTDC) revised guidelines. 20 The patient sample included 50 patients from our previous cross‐sectional study, 3 adding longitudinal data and 22 new patients. All patients underwent a complete clinical history, neurological examination, neuropsychological evaluation, and structural brain imaging. Patients’ diagnoses were determined by a multidisciplinary team of neurologists, neuropsychologists, and nurses, after thorough neurological, neuroimaging, and neuropsychological assessments. For inclusion, all patients were required to have at least two consecutive structural images performed on the same magnetic resonance imaging (MRI) scanner, which resulted in a total number of 205 observations across all patients. In addition, all patients had clinical data, including Clinical Dementia Rating (CDR), CDR plus NACC FTLD behavior and language domains sum of boxes, 21 , 22 and Mini‐Mental State Examination (MMSE) 23 as proxies of disease severity, if data were available within 90 days of structural imaging. CDR plus NACC FTLD sum of boxes were acquired through a structured caregiver interview and MMSE score was obtained through face‐to‐face cognitive testing. For our longitudinal analysis investigating whether the bvFTD subtypes showed different patterns of atrophy at baseline and over time, for comparison we included longitudinal data from 27 healthy controls (79 observations). The eligibility criteria for the healthy control group included normal cognitive performance (MMSE score ≥ 27) and normal brain imaging, as well as absence of neurological, psychiatric, or other major medical illnesses. Demographic and clinical characteristics of patients and healthy controls are presented in Table 1. All participants gave their consent to participate and to share data. The study was approved by the UCSF Institutional Review Board Human Research Protection Program.
TABLE 1.
Demographic and clinical characteristics of each bvFTD subtype
| Means ± SD | Controls (n = 27) | SNF Subtype (n = 19) | SNFT Subtype (n = 15) | SAN Subtype (n = 15) | SUB Subtype (n = 23) |
|---|---|---|---|---|---|
| Age – y | 62.7 ± 8.7 | 61.3 ± 9.6 | 63.7 ± 5.6 | 62.9 ± 9.3 | 62.0 ± 9.6 |
| Female sex – no. (%) | 11 (40.8) | 9 (47.4) | 5 (33.3) | 4 (26.7) | 9 (39.1) |
| Education – y | 16.8 ± 1.8 | 16.0 ± 2.7 | 15.9 ± 2.8 | 15.4 ± 3.0 | 16.4 ± 3.8 |
| CDR | 0 ± 0 | 1.3 ± 0.6 | 1.4 ± 0.7 | 1.0 ± 0.5 | 0.9 ± 0.6 |
| CDR plus NACC FTLD sum of boxesa | – | 9.7 ± 3.8 | 10.1 ± 3.6 | 6.9 ± 2.3 | 6.7 ± 3.8 |
| MMSEa | 29.4 ± 0.8 | 23.6 ± 5.1 | 19.3 ± 8.3 | 24.1 ± 5.5 | 26.4 ± 2.6 |
| Age at disease onseta | – | 54.6 ± 10.2 | 57.6 ± 5.9 | 56.7 ± 5.8 | 54.3 ± 12.7 |
| Average time interval between two scans | 2.39 ± 1.48 | 1.48 ± 0.74 | 1.42 ± 0.50 | 1.54 ± 1.17 | 2.67 ± 1.85 |
Notes: Group means and standard deviations were derived using the first assessment of each participant. One‐way analysis of variance (ANOVA) and Tukey's post hoc comparisons showed no significant group differences in age, education, and average time interval between two scans between controls and each subtype, as well as among the four subtypes. Chi‐square tests showed that the sex distribution between controls and the four subtypes, and among the four subtypes, did not significantly differ from each other. One‐way ANOVA and Tukey's post hoc comparisons showed no significant group differences in CDR, CDR FTLD sum of boxes, and age of disease onset between the bvFTD subgroups. The total number of observations for the patient group was 205; number of patients with two timepoints = 37; number of patients with three timepoints = 18; number of patients with four or more timepoints = 17. The total number of observations for the healthy control group was 79; number of controls with two timepoints = 4; number of controls with three timepoints = 21; number of controls with four or more timepoints = 2.
Group comparisons were performed only across patient groups.
Abbreviations: bvFTD, behavioral variant frontotemporal dementia; CDR, Clinical Dementia Rating Scale; CDR plus NACC FTLD, CDR plus Behavior and Language domains from the NACC FTLD Module; MMSE, Mini‐Mental State Examination; SAN, semantic‐appraisal network predominant atrophy; SD, standard deviation; SNF, salience network frontal predominant atrophy; SNFT, salience network frontotemporal predominant atrophy; SUB, subcortical predominant atrophy.
2.2. Neuroimaging
All patients underwent a unified structural MRI acquisition protocol at UCSF (1.5 Tesla: 17% of bvFTD group; 3 Tesla: 74% of bvFTD group, 100% of healthy controls; 4 Tesla: 9% of bvFTD group). We used the Neuromorphometrics brain atlas (http://www.neuromorphometrics.com) to define 18 frontal and temporal regions of interest (ROIs) found in the SN and SAN. The ROIs included the anterior insula (AI), anterior cingulate cortex (ACC), bilateral temporal poles, subcallosal area, basal forebrain, gyrus rectus, posterior orbital gyrus, frontal operculum, and amygdala. For each patient, we calculated the mean gray matter volume of each ROI.
2.2.1. Cluster analysis with baseline scans
To replicate the four bvFTD anatomic subtypes in this enriched sample of patients (n = 72), we used their baseline scan to perform the same data‐driven analytic approach as in our previous study (n = 52). 3 For this analysis, we used each patient's first structural scan and included all 18 SN and SAN ROIs. In brief, we performed a cluster analysis using the evalclusters function of the Matlab (MathWorks) statistical toolbox, which is based on the kmeans clustering algorithm that partitions data into mutually exclusive clusters and returns the index of the cluster to which it has assigned each observation. We specified the clustering evaluation criterion as “gap” and used squared Euclidean distance as the distance metric.
2.2.2. Logistic regression analysis with longitudinal dataset
To investigate the degree to which each patient's subtype at baseline remained stable over time, we performed a polytomous logistic regression model across all 72 patients and timepoints. The model was performed independently for each subject and each follow‐up scan, thus there was no difference between subjects with one and subjects with multiple follow‐up visits. We determined the cluster assignment for each patient and follow‐up scan using the Matlab statistical toolbox function mnrval. A polytomous logistic regression analysis models a multinomial regression for nominal outcomes and estimates the category probabilities for each outcome (i.e., each cluster identity). For each patient and timepoint, the model used the volume estimates of the 18 ROIs and predicted the probability of the patient falling into each of the four clusters. The cluster identity that was predicted with the highest probability was identified as the cluster assignment at each of the follow‐up scans.
2.2.3. Voxel‐wise linear mixed‐effects (LME) model analysis with longitudinal dataset
We used each patient's and healthy control's voxel‐wise intercept to compare each subtype's average atrophy pattern at baseline with the control group. In addition, to determine the typical longitudinal atrophy pattern for each anatomic subtype over time, we derived each participants’ voxel‐wise slope of change using a hierarchical Bayesian LME model. 24 In brief, the model rested upon two hierarchical levels: (1) single‐subject trajectory and (2) group's trajectory. The trajectory was described as a degree polynomial; for example, the j‐th timepoint of subject i had a gray matter density in one voxel such as , which was fitted using a design matrix where was the subject's age at the timepoint j acquisition day. and were the first‐level vectors of parameters and noise. The complete model was: ; and corresponded to the first‐level design matrix and noise. The second level was modeled by , where , , and corresponded to the second‐level design matrix, parameters, and noise. At each level, the noise distribution was drawn from a centered Gaussian: , where was the hierarchical level u covariance matrix.
To compare the baseline atrophy pattern of each subtype with the other three subtypes, we used the same LME model as described above to derive each subject's voxel‐wise slope and to identify the voxels in which the rate of atrophy was significantly different among the four subtypes. A mask was then created by binarizing the family‐wise error corrected (P < 0.05 based on threshold free cluster enhancement) F‐test of the subtype differences by applying FSL‐randomize with 5000 permutations. 25 , 26 , 27 LME models were run within the mask to determine the subtype that caused the group difference in a particular voxel.
3. RESULTS
3.1. Demographic and clinical characteristics
Seventy‐two patients (45 men [62.5%], 27 women [37.5%]) were included in the study, with mean age of 62.4 ± 9 years at the first scan. The mean CDR score was 1.1 ± 0.6 and the mean MMSE score was 23.7 ± 5.9, showing that the cohort was generally at an early stage of disease. The CDR plus NACC FTLD sum of boxes was available only in a subset of patients (n = 58), and the mean score was 8.32 ± 3.9. As shown in Table 1, the healthy controls and the subtypes were matched with regard to age, sex, education, and time interval between two follow‐up scans. The SNFT subtype had significantly lower MMSE score (23.6 ± 5.1) than the Subcortical subtype (26.4 ± 2.6). However, the subgroups did not significantly differ with regard to any other demographic or clinical variables, including age at disease onset (see Table 1). In addition, LME model analyses showed that the rate of clinical disease progression measured by both CDR and MMSE did not significantly differ among the four subtypes.
3.2. The four bvFTD subtypes are replicated
Using the same data‐driven cluster approach as in our previous study, 3 we replicated the four subtypes in the current, partially overlapping, sample of patients with bvFTD (Figure 1A). Consistent with our prior work, a voxel‐wise approach (intercept of hierarchical Bayesian LME model) demonstrated that at baseline the four subtypes were associated with divergent patterns of cortical atrophy but overlapping subcortical (thalamus, striatum) atrophy (Figure 1B). Showing the same patterns as previously observed, 3 (1) one subtype (SNFT) showed predominantly frontotemporal volume loss in the SN and SAN with significant subcortical involvement. (2) The second subtype (SNF) was associated predominantly with atrophy in frontal lobe regions of the SN and in subcortical regions with relative sparing of temporal lobe regions represented in the SAN. (3) The third subtype (SAN) was characterized by volume loss in temporal lobe regions of the SAN with mild involvement of subcortical regions. (4) The fourth subtype (Subcortical) showed only mild subcortical (thalamus, caudate) atrophy with very mild, inconsistent cortical atrophy.
FIGURE 1.

A, Brain region of interest volumes from the salience (SN) and semantic‐appraisal/limbic (SAN) networks of all behavioral variant frontotemporal dementia (bvFTD) patients were modeled using a principal components analysis, and then a cluster analysis was performed to identify any subgroups. Replicating our previous study, at baseline the groups separated into four distinct clusters, corresponding to four bvFTD subtypes (salience network frontotemporal predominant atrophy [SNFT], salience network frontal predominant atrophy [SNF], SAN, and Subcortical). B, The atrophy patterns of the four subtypes were replicated in this new sample using a voxel‐wise linear mixed‐effects (LME) model. Consistent with our previous study, each subtype showed a unique pattern of cortical and subcortical atrophy at baseline. The SNFT subtype demonstrated cortical atrophy in both the frontal and temporal lobes as well as subcortical atrophy in the caudate and thalamus. The SNF subtype was associated predominantly with atrophy in frontal regions of the SN and in subcortical (caudate, thalamus) regions. Patients with the SAN subtype had atrophy in the temporal but not frontal lobe and mild subcortical atrophy. The Subcortical subtype was characterized by thalamic and caudate atrophy, with very mild cortical volume loss. C, When longitudinal characteristics were examined in the same voxel‐wise LME analysis by comparing each bvFTD subtype to a healthy control group, it revealed that the cortical subtypes had distinct patterns of progressive atrophy in widespread regions of the frontal, temporal, parietal, and occipital lobes, as well as in subcortical regions. Though the Subcortical subtype was characterized by predominantly subcortical atrophy at baseline, its pattern of progressive cortical and subcortical atrophy was similar to the cortical subtypes but did not include the temporal lobe
3.3. The bvFTD subtypes remain stable over time
We used a polytomous logistic regression model and the 18 SN and SAN ROIs to determine the probability that each baseline bvFTD subtype assignment would remain stable at subsequent scans. Figure 2 shows the subtype identities for all patients at each timepoint. The overall prediction probability of the logistic regression model was 94% ± 1.2, and the model revealed that 84.7% of patients across all subtypes remained within the same subtype identity between baseline and follow‐ups. Specifically, 100% of patients whose subtype identity was SNFT at baseline were also classified as SNFT at each subsequent scan (Figure 2A, 2B). The large majority of patients assigned to one of the other three subtypes at baseline (SNF, SAN, Subcortical) were assigned to the same subtype identity at baseline and subsequent follow‐ups, with the highest percentage revealed in the Subcortical subtype (87%), followed by the SAN (80%) and SNF (79%) subtypes (Figure 2C, 2E, 2G). While the SNFT group had no patients with a time interval of more than 2 years, potentially contributing to the perfect longitudinal consistency of classification in this subtype, in the other three subtypes patients’ longest interval ranged up to 6.6 years but there was still a high level of consistency (Figure 2B, 2D, 2F, 2H). Figure 2 also shows that each subtype demonstrated a highly consistent assignment probability at baseline, which was a replication from our data‐driven clustering algorithm described in our previous investigation. 3 In addition, Figure 2 shows that a very high fraction of the follow‐up scans were also assigned with high probability rates to their cluster identities, speaking to the stability of the clusters.
FIGURE 2.
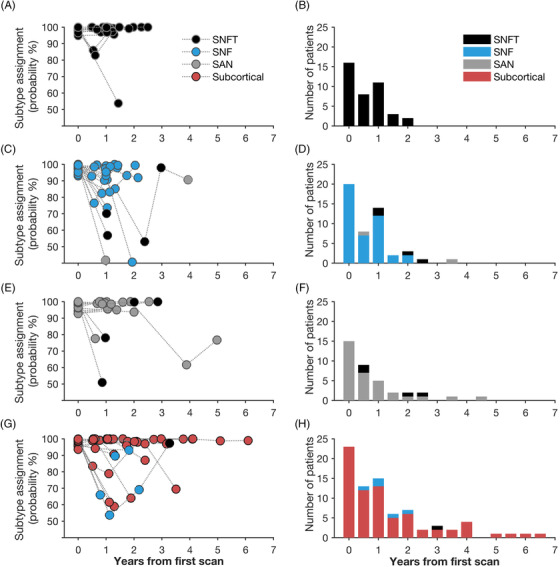
A polytomous logistic regression model of patients’ cluster identity at all timepoints revealed that depending on subtype, the majority of patients remained within the same subtype identity over the course of disease progression. (A & B) All patients with the salience network frontotemporal predominant atrophy (SNFT) subtype had the same subtype identity at baseline and subsequent follow‐ups. Temporal stability was also observed in the large majority of patients with the other subtypes:87% in the Subcortical subtype (G & H), 80% in the semantic‐appraisal network predominant atrophy (SAN) subtype (E & F), and 79% in the salience network frontal predominant atrophy (SNF) subtype (C & D). This high level of consistency across multiple timepoints was observed in subtypes including patients with both short (2 years in the SNFT subtype, A & B) and long time intervals (6.6 years in the Subcortical subtype, G & H) between the first and last scan
3.4. Similarities and differences in progressive atrophy in the bvFTD subtypes
First, to show similarities across groups, we examined each subtype separately by using the slope of the hierarchical Bayesian LME model to determine each subtype's rate of change in volume loss compared to the healthy control group. Structures that fairly consistently showed progressive atrophy over time across the cortical subtypes (SNFT, SNF, SAN) included the frontal (dorsolateral prefrontal cortex, AI, ACC) and temporal lobe (temporal pole, amygdala), caudate, thalamus, as well as the parietal lobe (Figure 1C). The subcortical subtype showed progressive change in gray matter atrophy in similar frontal and parietal regions as the cortical subtypes, though there was no temporal lobe involvement (Figure 1C). There was no significant relationship between change in atrophy and disease severity over time across the patient sample and within each subtype. Second, we performed a spatial co‐localization analysis that directly compared all subtypes, mapping the voxels that showed change over time across all subtypes compared to the healthy control group (Figure 3, pink‐colored regions). Our results revealed overlapping atrophy with disease progression in small clusters in the bilateral insula, ACC, and caudate across all four subtypes. Because the Subcortical subtype showed less extensive atrophy over time than the other subtypes, we also performed the co‐localization analysis across the cortical SNFT, SNF, and SAN subtypes. This analysis demonstrated overlapping atrophy in similar but more extensive clusters than the previous four‐group analysis, including the bilateral anterior and posterior insula, the ACC, and the caudate (Figure 3, blue‐colored regions).
FIGURE 3.

All behavioral variant frontotemporal dementia (bvFTD) subtypes show a common core of progressive atrophy in regions of the salience network (SN). A spatial co‐localization analysis revealed that all four subtypes demonstrated change over time in overlapping voxels in the bilateral insula, anterior cingulate cortex (ACC), and caudate (pink color). When the analysis was performed only across the cortical (salience network frontotemporal predominant atrophy [SNFT], salience network frontal predominant atrophy [SNF], semantic‐appraisal network predominant atrophy [SAN]) subtypes, the same bilateral regions (insula, ACC, caudate) were revealed but the clusters were bigger (blue color)
Next, to describe the differences in longitudinal atrophy progression across the four subtypes, we used separate LME models to compare each subtypes’ voxel‐wise change in volume over time with the atrophy progression calculated across the other three subtypes (i.e., a series of one vs. three comparisons). Our results revealed that compared to the other three subtypes, the SNFT subtype showed a significantly greater degree of volume loss in the bilateral posterior insula, cerebellum, and occipital lobe over time (Figure 4). The SNF subtype was associated with the most extensive overall longitudinal volume loss compared to the other subtypes combined, and affected regions included the left lateral and mesial temporal lobe, caudate, ACC, and thalamus. The SAN subtype showed more parietal volume loss than the other groups. The Subcortical subtype showed milder atrophy progression than the cortical subtypes, with relative preservation particularly in the bilateral temporal and parietal lobes, as well as in the caudate and thalamus.
FIGURE 4.
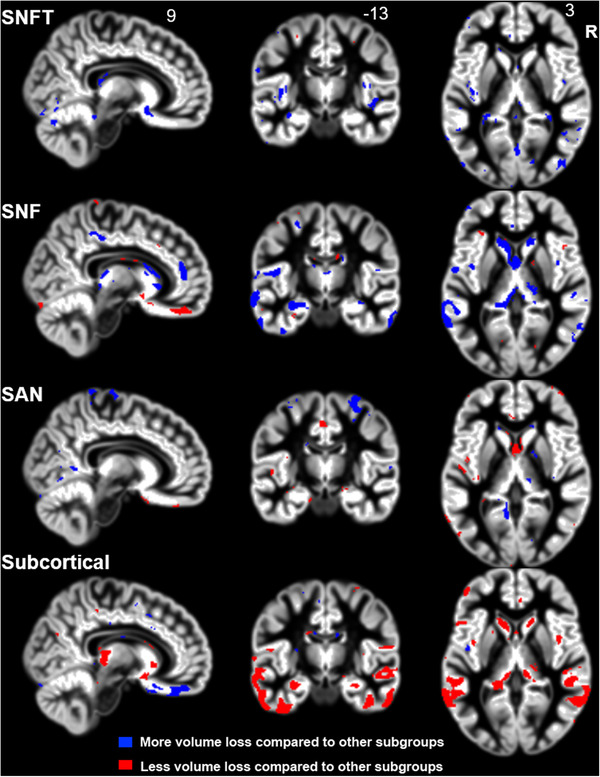
Each subtype shows a unique pattern of longitudinal atrophy compared to the other three subtypes. The salience network frontotemporal predominant atrophy (SNFT) group showed significantly more atrophy in small clusters in the bilateral posterior insula and in posterior brain regions (cerebellum, occipital lobe) than the other subtypes. The salience network frontal predominant atrophy (SNF) subtype was associated with the most extensive spread of atrophy longitudinally, and the most affected regions included the left temporal lobe and the caudate. Patients with the semantic‐appraisal network predominant atrophy (SAN) subtype showed more atrophy in the parietal lobe compared to the other subtypes. The subcortical subtype demonstrated milder volume loss over time than the cortical subtypes, with progressive atrophy occurring predominantly in the temporal and parietal lobes as well as in subcortical regions (thalamus, caudate).
4. DISCUSSION
This study demonstrates that the four bvFTD subtypes are replicable, remain remarkably stable over time, and are associated with divergent patterns of atrophy and rates of progression. The cortical subtypes are each associated with a distinct cortical and subcortical atrophy pattern at baseline and longitudinally. By contrast, patients with the Subcortical subtype show only mild subcortical (thalamic, striatal) atrophy at initial evaluation, and their rate of atrophy progression is less extensive than in the cortical subtypes. Though each subtype is characterized by a unique pattern of volume loss, we also found overlap for all four subtypes in which they demonstrated progressive atrophy in regions of the SN, known to be the first to degenerate in bvFTD. 28 This evidence of both the anatomic stability within each subtype and the anatomic heterogeneity among subtypes provides more precise information supporting the prediction of individual disease trajectories. Anatomical predictions in individual patients are needed to identify patients at risk for poor clinical outcomes and to assess treatment efficacy in disease‐modifying FTD clinical trials.
Understanding the clinical, anatomical, and pathological heterogeneity of bvFTD is essential to improve early diagnosis and treatment of affected patients. However, the majority of previous studies have investigated research questions in which patients with bvFTD have been considered a homogenous group. In this study, several analyses provide evidence that bvFTD is better classified into distinct anatomically heterogeneous groups, which differ both at baseline and in pattern of atrophy progression. First, our previously identified subtypes were replicated at baseline in a larger sample of patients and with a different, voxel‐wise LME model method, demonstrating generalizability of the anatomic clustering approach. Second, our results show that each subtype remains stable over time, with probabilities ranging from 79% to 100% depending on bvFTD anatomic subtype. Third, our voxel‐wise LME analysis revealed that the four bvFTD subtypes are associated with distinct patterns of atrophy over time, with subtype differences found in bilateral posterior (cerebellum, occipital) regions (SNFT), in the left mesial and lateral temporal lobe (SNF), in the parietal lobe (SAN), and in subcortical (caudate, thalamus) regions (SNF, Subcortical). Finally, we found that the subtypes differ with regard to the severity of atrophy both at baseline and follow‐ups. The Subcortical subtype showed milder atrophy both at initial evaluation and with disease progression than the cortical subtypes, whereas the SNF subtype showed the most extensive longitudinal atrophy among all subtypes. We previously examined the distributions between subtype and FTLD pathology in a subset of 24 pathology‐proven patients assessed by an extensive post mortem assessment at UCSF. This work demonstrated that despite the focality of atrophy in the four subtypes, they were neuropathologically diverse. 3 Based on this, our findings suggest that the location of atrophy at baseline may be a better predictor of how atrophy will progress with disease than the underlying pathology. Using this neuroanatomic classification for bvFTD can be valuable for clinicians and clinical researchers because the classification may help them correctly diagnose bvFTD patients despite wide differences in the pattern and degree of gray matter atrophy, and more precisely predict the disease progression of individual patients, including location and severity of atrophy. Our results also suggest that more precise classification of atrophy patterns at baseline and subsequent follow‐ups may be useful when defining endpoints in clinical trials for patients with different bvFTD subtypes. 29
The current findings, added to our previous work, 3 provide evidence for a stable Subcortical subtype with only mild cortical involvement at baseline and a milder atrophy course with disease progression, which is a novel classification that extends beyond the findings of a previous study that revealed four cortical subtypes. 30 This highlights that damage to subcortical regions of key FTD brain networks is sufficient to cause a full‐blown bvFTD syndrome, demonstrating the importance of both subcortical regions and cortico–subcortical connections for the development of behavior changes in patients with bvFTD. 31 , 32 , 33 , 34 , 35 Because our study did not include behavioral data, the question of whether the Subcortical subtype is associated with milder symptom progression over time and longer disease duration needs to be investigated in future studies. The importance of subcortical regions in the disease progression of bvFTD has been demonstrated in another study showing that FTD patients show more subcortical (striatal, thalamic) atrophy over time compared to patients with AD. 36
Despite the anatomic heterogeneity seen in the four subtypes, our co‐localization analysis showed that all subtypes are associated with progressive atrophy in the AI and ACC, which are the first sites of neurodegeneration in bvFTD. 28 , 37 , 38 The AI is the limbic sensory region and the ACC the limbic motor region of the SN, which together guide behavior based on the most homeostatically relevant signals from the body and the environment. 17 , 39 Thus, our results show that despite different atrophy patterns at baseline and over time, the four bvFTD subtypes show overlapping SN atrophy, adding to existing evidence that this is the common etiology for the pathognomonic and progressive changes in behavior that are the core features of bvFTD. 40 , 41 , 42 , 43
5. LIMITATIONS AND CONCLUSIONS
The goal of our study was to investigate the anatomic stability of four previously identified bvFTD subtypes, and to examine differences in the longitudinal atrophy patterns. A limitation of our work is that we did not yet investigate longitudinal brain–behavior relationships, thus we cannot draw any conclusions about the correspondence of each subtype's pattern of progressive gray matter volume loss and their clinical presentation over time. This study also focused only on gray matter volume in these patients, thus additional analyses of white matter connectivity differences, and a multimodal analysis of the functional and behavioral sequelae of these structural changes, is warranted to fully characterize these subtypes. Additional replication of the four anatomic subtypes of bvFTD in a completely independent sample of bvFTD patients will also be valuable to further confirm their generalizability.
Overall, we conclude that the bvFTD syndrome is not a single entity, but clusters into four anatomically stable subtypes, each characterized by a unique pattern and degree of cortical and subcortical atrophy at baseline and over time. Our findings support the network view of brain functions, showing that neurodegeneration in distinct hubs of a network can cause the same bvFTD phenotype. In addition, compared to previous research, our results provide a more nuanced picture of the anatomical heterogeneity of disease progression in bvFTD, which may help to better predict the anatomical trajectories of individual patients with one of the four baseline atrophy patterns. This knowledge can be used both in neurological practice and clinical trials to predict an individual patient's atrophy progression to more precisely identify the impact of new disease‐modifying therapies.
CONFLICTS OF INTEREST
The authors have declared no conflicts of interest.
ACKNOWLEDGMENTS
We thank all participants for their contribution to this research. This study was supported by grants R01AG029577 (Dr. Rankin), P01AG019724 (Dr. Miller), K08AG058749 and F32AG050434‐01A1 (Dr. Ranasinghe) from the NIH, and grant 2014‐A‐004‐NET (Dr. Kramer) and 2015‐A‐034‐FEL, 2019‐A‐013‐SUP (Dr. Ranasinghe) from the Larry L. Hillblom Foundation.
Ranasinghe KG, Toller G, Cobigo Y, et al. Computationally derived anatomic subtypes of behavioral variant frontotemporal dementia show temporal stability and divergent patterns of longitudinal atrophy. Alzheimer's Dement. 2021;13:e12183. 10.1002/dad2.12183
Kamalini G. Ranasinghe and Gianina Toller share first authorship.
REFERENCES
- 1. Hu WT, Mandrekar JN, Parisi JE, et al. Clinical features of pathologic subtypes of behavioral‐variant frontotemporal dementia. Arch Neurol. 2007;64:1611. 10.1001/archneur.64.11.1611. [DOI] [PubMed] [Google Scholar]
- 2. Whitwell JL, Przybelski SA, Weigand SD, et al. Distinct anatomical subtypes of the behavioural variant of frontotemporal dementia: a cluster analysis study. Brain J Neurol. 2009;132:2932‐2946. [DOI] [PMC free article] [PubMed] [Google Scholar]
- 3. Ranasinghe KG, Rankin KP, Pressman PS, et al. Distinct subtypes of behavioral variant frontotemporal dementia based on patterns of network degeneration. JAMA Neurol. 2016;73:1078‐1088. [DOI] [PMC free article] [PubMed] [Google Scholar]
- 4. Rohrer JD. Behavioural variant frontotemporal dementia—defining genetic and pathological subtypes. J Mol Neurosci. 2011;45:583‐588. [DOI] [PubMed] [Google Scholar]
- 5. Mackenzie IR, Neumann M. Molecular neuropathology of frontotemporal dementia: insights into disease mechanisms from postmortem studies. J Neurochem. 2016;138:54‐70. [DOI] [PubMed] [Google Scholar]
- 6. Cerami C, Dodich A, Canessa N, et al. Neural correlates of empathic impairment in the behavioral variant of frontotemporal dementia. Alzheimers Dement. 2014;10:827‐834. [DOI] [PubMed] [Google Scholar]
- 7. Kumfor F, Irish M, Hodges JR, Piguet O. Discrete neural correlates for the recognition of negative emotions: insights from frontotemporal dementia. PLoS One. 2013;8:e67457. [DOI] [PMC free article] [PubMed] [Google Scholar]
- 8. Shany‐Ur T, Lin N, Rosen HJ, Sollberger M, Miller BL, Rankin KP. Self‐awareness in neurodegenerative disease relies on neural structures mediating reward‐driven attention. Brain J Neurol. 2014;137:2368‐2381. [DOI] [PMC free article] [PubMed] [Google Scholar]
- 9. Sturm VE, Sollberger M, Seeley WW, et al. Role of right pregenual anterior cingulate cortex in self‐conscious emotional reactivity. Soc Cogn Affect Neurosci. 2013;8:468‐474. [DOI] [PMC free article] [PubMed] [Google Scholar]
- 10. Carr AR, Mendez MF. Affective empathy in behavioral variant frontotemporal dementia: a meta‐analysis. Front Neurol. 2018;9. 10.3389/fneur.2018.00417. [DOI] [PMC free article] [PubMed] [Google Scholar]
- 11. Dermody N, Wong S, Ahmed R, Piguet O, Hodges JR, Irish M. Uncovering the neural bases of cognitive and affective empathy deficits in Alzheimer's disease and the behavioral‐variant of frontotemporal dementia. J Alzheimers Dis. 2016:1‐16. [DOI] [PubMed] [Google Scholar]
- 12. Rankin KP, Gorno‐Tempini ML, SC Allison, et al. Structural anatomy of empathy in neurodegenerative disease. Brain J Neurol. 2006;129:2945‐2956. [DOI] [PMC free article] [PubMed] [Google Scholar]
- 13. Sollberger M, Stanley CM, Wilson SM, et al. Neural basis of interpersonal traits in neurodegenerative diseases. Neuropsychologia. 2009;47:2812‐2827. [DOI] [PMC free article] [PubMed] [Google Scholar]
- 14. Sollberger M, Neuhaus J, Ketelle R, et al. Interpersonal traits change as a function of disease type and severity in degenerative brain diseases. J Neurol Neurosurg Psychiatry. 2011;82:732‐739. [DOI] [PMC free article] [PubMed] [Google Scholar]
- 15. Perry DC, Whitwell JL, Boeve BF, et al. Voxel‐based morphometry in patients with obsessive‐compulsive behaviors in behavioral variant frontotemporal dementia. Eur J Neurol. 2012;19:911‐917. [DOI] [PMC free article] [PubMed] [Google Scholar]
- 16. Menon V, Uddin LQ. Saliency, switching, attention and control: a network model of insula function. Brain Struct Funct. 2010;214:655‐667. [DOI] [PMC free article] [PubMed] [Google Scholar]
- 17. Seeley WW, Menon V, Schatzberg AF, et al. Dissociable intrinsic connectivity networks for salience processing and executive control. J Neurosci. 2007;27:2349‐2356. [DOI] [PMC free article] [PubMed] [Google Scholar]
- 18. Seeley WW, Zhou J, Kim EJ. Frontotemporal dementia: what can the behavioral variant teach us about human brain organization?. The Neuroscientist. 2011. 18 4:373–385.. [DOI] [PubMed] [Google Scholar]
- 19. Yeo BT, Krienen FM, Sepulcre J, et al. The organization of the human cerebral cortex estimated by intrinsic functional connectivity. J Neurophysiol. 2011;106:1125‐1165. [DOI] [PMC free article] [PubMed] [Google Scholar]
- 20. Rascovsky K, Hodges JR, Kipps CM, et al. Diagnostic criteria for the behavioral variant of frontotemporal dementia (bvFTD): current limitations and future directions. Alzheimer Dis Assoc Disord. 2007;21:S14‐S18. [DOI] [PubMed] [Google Scholar]
- 21. Knopman DS, Weintraub S, Pankratz VS. Language and behavior domains enhance the value of the clinical dementia rating scale. Alzheimers Dement J Alzheimers Assoc. 2011;7:293‐299. [DOI] [PMC free article] [PubMed] [Google Scholar]
- 22. Miyagawa T, Brushaber D, Syrjanen J, et al. Utility of the global CDR® plus NACC FTLD rating and development of scoring rules: data from the ARTFL/LEFFTDS Consortium. Alzheimers Dement. 2020;16:106‐117. [DOI] [PMC free article] [PubMed] [Google Scholar]
- 23. Folstein MF, Robins LN, Helzer JE. The mini‐mental state examination. Arch Gen Psychiatry. 1983;40:812‐812. [DOI] [PubMed] [Google Scholar]
- 24. Ziegler G, Penny WD, Ridgway GR, Ourselin S, Friston KJ, Alzheimer's Disease Neuroimaging Initiative. Estimating anatomical trajectories with Bayesian mixed‐effects modeling. Neuroimage. 2015;121:51‐68. [DOI] [PMC free article] [PubMed] [Google Scholar]
- 25. Winkler AM, Ridgway GR, Webster MA, Smith SM, Nichols TE. Permutation inference for the general linear model. Neuroimage. 2014;92:381‐397. [DOI] [PMC free article] [PubMed] [Google Scholar]
- 26. Jenkinson M, Beckmann CF, Behrens TEJ, Woolrich MW, Smith SMFSL. FSL. Neuroimage. 2012;62:782‐790. [DOI] [PubMed] [Google Scholar]
- 27. Smith SM, Nichols TE. Threshold‐free cluster enhancement: addressing problems of smoothing, threshold dependence and localisation in cluster inference. Neuroimage. 2009;44:83‐98. [DOI] [PubMed] [Google Scholar]
- 28. Seeley WW, Crawford R, Rascovsky K, et al. Frontal paralimbic network atrophy in very mild behavioral variant frontotemporal dementia. Arch Neurol. 2008;65:249‐255. [DOI] [PMC free article] [PubMed] [Google Scholar]
- 29. Staffaroni AM, Ljubenkov PA, Kornak J, et al. Longitudinal multimodal imaging and clinical endpoints for frontotemporal dementia clinical trials. Brain. 2019;142:443‐459. [DOI] [PMC free article] [PubMed] [Google Scholar]
- 30. Whitwell JL, Przybelski SA, Weigand SD, et al. Distinct anatomical subtypes of the behavioural variant of frontotemporal dementia: a cluster analysis study. Brain. 2009;132:2932‐2946. [DOI] [PMC free article] [PubMed] [Google Scholar]
- 31. Jakabek D, Power BD, Macfarlane MD, et al. Regional structural hypo‐and hyperconnectivity of frontal–striatal and frontal–thalamic pathways in behavioral variant frontotemporal dementia. Hum Brain Mapp. 2018;39(10): 4083‐4093. [DOI] [PMC free article] [PubMed] [Google Scholar]
- 32. Lee SE, Khazenzon AM, Trujillo AJ, et al. Altered network connectivity in frontotemporal dementia with C9orf72 hexanucleotide repeat expansion. Brain J Neurol. 2014;137:3047‐3060. [DOI] [PMC free article] [PubMed] [Google Scholar]
- 33. Lee SE, Sias AC, Kosik EL, et al. Thalamo‐cortical network hyperconnectivity in preclinical progranulin mutation carriers. NeuroImage Clin. 2019;22:101751. [DOI] [PMC free article] [PubMed] [Google Scholar]
- 34. Piguet O, Å Petersén, Yin Ka Lam B, et al. Eating and hypothalamus changes in behavioral‐variant frontotemporal dementia. Ann Neurol. 2011;69:312‐319. [DOI] [PMC free article] [PubMed] [Google Scholar]
- 35. Toller G, Brown J, Sollberger M, et al. Individual differences in socioemotional sensitivity are an index of salience network function. Cortex J Devoted Study Nerv Syst Behav. 2018;103:211‐223. [DOI] [PMC free article] [PubMed] [Google Scholar]
- 36. Landin‐Romero R, Kumfor F, Leyton CE, Irish M, Hodges JR, Piguet O. Disease‐specific patterns of cortical and subcortical degeneration in a longitudinal study of Alzheimer's disease and behavioural‐variant frontotemporal dementia. Neuroimage. 2017;151:72‐80. [DOI] [PubMed] [Google Scholar]
- 37. Seeley WW. Anterior insula degeneration in frontotemporal dementia. Brain Struct Funct. 2010;214:465‐475. [DOI] [PMC free article] [PubMed] [Google Scholar]
- 38. Seeley WW, Crawford RK, Zhou J, Miller BL, Greicius MD. Neurodegenerative diseases target large‐scale human brain networks. Neuron. 2009;62:42‐52. [DOI] [PMC free article] [PubMed] [Google Scholar]
- 39. Craig AD. How do you feel – now? The anterior insula and human awareness. Nat Rev Neurosci. 2009;10:59‐70. [DOI] [PubMed] [Google Scholar]
- 40. Binney RJ, Pankov A, Marx G, et al. Data‐driven regions of interest for longitudinal change in three variants of frontotemporal lobar degeneration. Brain Behav. 2017;7:e00675. 10.1002/brb3.675. [DOI] [PMC free article] [PubMed] [Google Scholar]
- 41. Brambati SM, Renda NC, Rankin KP, et al. A tensor based morphometry study of longitudinal gray matter contraction in FTD. Neuroimage. 2007;35:998‐1003. [DOI] [PMC free article] [PubMed] [Google Scholar]
- 42. Lam BY, Halliday GM, Irish M, Hodges JR, Piguet O. Longitudinal white matter changes in frontotemporal dementia subtypes. Hum Brain Mapp. 2014;35:3547‐3557. [DOI] [PMC free article] [PubMed] [Google Scholar]
- 43. Möller C, Hafkemeijer A, Pijnenburg YAL, et al. Different patterns of cortical gray matter loss over time in behavioral variant frontotemporal dementia and Alzheimer's disease. Neurobiol Aging. 2016;38:21‐31. [DOI] [PubMed] [Google Scholar]