

Abstract
Ventilation-perfusion matching, the regional matching of the flow of fresh gas to flow of deoxygenated capillary blood, is the most important mechanism affecting the efficiency of pulmonary gas exchange. This article discusses the measurement of matching with three broad classes of techniques: (i) those based in gas exchange, such as the multiple inert gas elimination technique (MIGET); (ii) those derived from imaging techniques such as single-photon emission computed tomography (SPECT), positron emission tomography (PET), magnetic resonance imaging (MRI), computed tomography (CT), and electrical impedance tomography (EIT); and (iii) fluorescent and radiolabeled microspheres. The focus is on the physiological basis of these techniques that provide quantitative information for research purposes rather than qualitative measurements that are used clinically. The fundamental equations of pulmonary gas exchange are first reviewed to lay the foundation for the gas exchange techniques and some of the imaging applications. The physiological considerations for each of the techniques along with advantages and disadvantages are briefly discussed.
Introduction
Many lung diseases are characterized by reduced gas exchange efficiency, manifest as an increase in the alveolar-arterial difference for oxygen (AaDO2). Although the AaDO2 can be increased by diffusion limitation of oxygen transport and shunt, ventilation-perfusion matching, such that regions of the lung that receive fresh gas also receive deoxygenated capillary blood, is the most important mechanism affecting gas exchange (334). This is because diffusion limitation is rarely observed in resting individuals with lung disease, the exception being in interstitial lung disease (170). In healthy subjects, diffusion limitation is typically only observed during high-intensity exercise at sea level in some highly trained athletes or in normal subjects during heavy exercise at high altitude or in hypoxia (176, 267, 309, 325). Shunt can occur as a result of intracardiac or intrapulmonary shunts, but significant shunt is much less common than mismatch (see Ref. 158 for review). Impaired matching is a hallmark of many lung diseases including chronic obstructive pulmonary disease (COPD) (321), pulmonary hypertension (214), asthma (322), pulmonary edema (245), pulmonary fibrosis (4), and acute respiratory distress syndrome (259).
Gas exchange in a single lung unit is determined by ratio of the unit (“compartment”) and the absolute amounts of associated ventilation and blood to that unit (269). In a real lung, there are many units, each with a different ratio—including the extremes—units of dead space that are ventilated but not perfused (including anatomical dead space from the conducting airways); and in some individuals, units with shunt that are perfused but not ventilated. In the healthy lung, the overall ratio is close to 1 and the oxygen content of room air (20.9 mL/100 mL air) is similar to that of the capacity of the blood to carry oxygen (~20.6 mL/100 mL blood). This necessitates almost equal volumes of air and blood reaching the gas exchange portions of the lung (252). The concentration of oxygen and carbon dioxide in end-capillary blood leaving the lung is the blood flow weighted sum of the individual oxygen and carbon dioxide contents from each individual lung unit. Similarly, the alveolar O2 and CO2 contents are the ventilation-weighted sum of the individual gas concentrations leaving the lung. Even in the presence of diffusion equilibrium, when ventilation and perfusion are not perfectly matched the net result is a difference between alveolar and arterial partial pressure of oxygen.
The goal of this article is to provide a physiologic understanding of the basis of techniques that can be used to measure matching. It is not exhaustive, undoubtedly, some techniques have been missed and others incompletely described. The focus of this article is on techniques allowing at least semi-quantitative measurement of mismatch, that are suitable for research, rather than qualitative techniques that are used for clinical studies. There are several techniques allowing the quantification of mismatch and these fall into three broad categories: Gas exchange techniques, those derived from imaging, and microsphere techniques. The choice of technique will depend on the population under study (human, animal), and the specific research question. Table 1 lists the broad categories of techniques discussed including some advantages and disadvantages of each. For a glossary of terms and an explanation of nomenclature used in pulmonary physiology see Refs 200, 298.
Table 1.
A list of the advantages and disadvantages of the techniques
| Type | Technique (s) | Advantages | Disadvantages |
|---|---|---|---|
| Gas exchange | O2/CO2 analysis |
|
|
| Intrabreath R Shunt Bohr Fowler dead space |
|
|
|
| MIGET |
|
|
|
| Imaging | SPECT |
|
|
| PET |
|
|
|
| MRI |
|
|
|
| CT |
|
|
|
| EIT |
|
|
|
| Microspheres | Fluorescent or radioactive |
|
|
Gas Exchange Methods
General considerations and theoretical basis of gas exchange
As a foundation for understanding the gas exchange techniques, some of the fundamental equations governing gas exchange are briefly reviewed. The reader is referred elsewhere for more detail (82, 160, 301). The analysis of Rahn and Fenn (258) identified the relationships between alveolar gas concentrations and the associated ratio under steady state conditions. Below, these are written for oxygen, but it is important to note that these can be applied to any gas such as CO2 or inert gases. The minute volume of oxygen taken up from the inspired air is described in terms of the volume inhaled minus the volume exhaled, that is
| (1) |
where is inspired and is expired ventilation, respectively, FIO2 is the fractional concentration in inspired gas, and FEO2 is the fractional concentration in expired gas. This equation is an expression of mass balance of oxygen: the amount of oxygen taken up by the body must equal the difference between what enters the lung in inspired air and what leaves the lung in expired air. Since dead space in the lung is not involved in gas exchange, simplifying this relationship by expressing it in terms of alveolar ventilation and the fractional concentration of O2 in alveolar gas, FAO2, makes sense. If the assumption is made that is equal to (i.e. that the respiratory exchange ratio is equal to 1) this equation becomes:
| (2) |
Equation (2) can be rearranged to:
| (3) |
Note that this equation is only true for the condition where the respiratory exchange ratio is 1. This is because does not equal except when the respiratory exchange ratio is 1, because carbon dioxide is evolving into the alveolar space and oxygen is being taken up to the bloodstream. This effect is small and can be neglected for the purposes of this discussion. For example, when the respiratory exchange ratio is 0.8, and with normal resting values of and , then . This is an error of approximately 1% when considering a resting ventilation of approximately 6 L/min, well under the precision of experimental measurement.
Mass balance for oxygen means that any oxygen leaving the lung as expressed in Eq. (3) appears in the blood. This mass conservation equation known as the Fick principle describes the uptake of oxygen into the blood as:
| (4) |
where is the cardiac output, is the oxygen concentration in end-capillary blood (i.e. leaving the lungs) and is the oxygen concentration in mixed venous blood (i.e. entering the lungs). If the lungs are in steady state, the amount of oxygen leaving the lungs in Eq. (3) must be balanced by the oxygen entering blood in Eq. (4), so that:
| (5) |
This can be rearranged in terms of the ventilation-perfusion ratio as follows:
| (6) |
or expressed in terms of partial pressures:
| (7) |
where k is a proportionality constant. At 37 °C, k equals 8.63. k = 7.60 × (273+ T)/273 where T is body temperature. This conversion factor takes into account the fact that those alveolar gas variables are typically expressed as BTPS (body temperature, ambient pressure, saturated) while blood variables are expressed as STPD (standard temperature pressure, dry).
As mentioned earlier these equations can be equally written for CO2 elimination. Equation (5) rewritten for CO2 becomes:
| (8) |
Equation (6) becomes:
| (9) |
And Eq. (7) becomes:
| (10) |
Equations (7) and (10) show that the ratio and alveolar PO2 and PCO2 are all inextricably linked: In the absence of diffusion limitation (so is in full equilibration with alveolar O2) and a known mixed venous and inspired O2 concentration, and a known oxygen hemoglobin dissociation curve, alveolar PO2 and CO2 are determined by the ratio. Conceptually, this is easiest to think of in terms of the two extremes of matching: In a region of the lung with very low ventilation relative to perfusion approaching shunt, the alveolar PO2 would approach mixed venous, whereas a region of the lung with very high ventilation relative to perfusion approaching dead space the alveolar PO2 would approach inspired (Figure 1). mismatch gives rise to an alveolar-arterial difference for oxygen, even when in individual lung units alveolar gas and end-capillary blood are in equilibrium, because the alveolar PO2 in the individual units is weighted by their individual ventilation whereas end-capillary PO2 is weighted by their perfusion. As shown in Figure 1, the partial pressures of oxygen changes markedly between a ratio of 0.1 and 10. PO2 changes little outside these limits. For example, below a ratio of 0.1, the PO2 is very close to the mixed venous O2. Above a ratio of 10 (and certainly above 100), it is close to inspired PO2. The familiar equation (Eq. 7) applies not only to a single homogenous unit of lung with and representing local alveolar ventilation and blood flow but is also true of the entire lung with and then representing total alveolar ventilation and blood flow.
Figure 1.

The relationship between the partial pressure of oxygen and carbon dioxide and ratio. When the ratio is low, the partial pressures approach that of mixed venous blood. When the ratio is high, the partial pressure is close to inspired. Note that there is little change in PO2 when the ratio is less than 0.1 or greater than 10. Redrawn, with permission, from West JB. 1977 (332).
Although discussed above for oxygen, this is equally true for carbon dioxide, and also (as expanded upon below) for inert gases. Implicit in this equation is the assumption that there is no limitation of diffusion for the gas of interest, meaning that the alveolar gas and end-capillary partial pressures of the gas are equal. While this is almost certainly true of the inert gases used in inert gas elimination technique (MIGET), and most likely true for CO2 (320) (except perhaps for some rare circumstances) this is sometimes not true for oxygen, and thus is the basis for the detection of diffusion limitation for oxygen with MIGET (125, 309). It is worth noting that CO2 is also affected by ventilation-perfusion inequality (77) but because of the difference between the oxygen and carbon dioxide dissociation curves unlike oxygen a high ratio region will eliminate much more carbon dioxide compared to oxygen uptake and thus partially compensate (see Ref. 333).
The Bohr and Haldane effects mean that O2 and CO2 cannot be considered independently, the oxygen concentration in blood is affected by the effect of CO2 and pH on the affinity of hemoglobin for oxygen (Bohr effect) and the ability of hemoglobin to carry CO2 is affected by local oxygen (Haldane effect). Thus, these equations must be solved jointly taking this into account.
Gas exchange methods: analysis of oxygen and carbon dioxide
The respiratory exchange ratio is the ratio of carbon dioxide produced, , to oxygen consumed, . Equation (8) can be expressed in terms of partial pressures and combined with Eq. (4) to give an estimate of ratio as:
| (11) |
where 8.63 is K the proportionality constant discussed previously. This equation is called the ventilation-perfusion ratio equation. Rahn (257) and Riley and Cournand (269–271) furthered the analysis by making the assumption that if the oxygen leaving the alveolar gas was counterbalanced by its uptake in the blood and the same was true of CO2, the ratio of in gas and blood must also be equal, that is that Rgas = Rblood. Starting from an assumed value of R, O2/CO2 combinations associated with a given FIO2/FICO2 for lung units are calculated. The mixed venous blood O2 and CO2 at the same R are estimated and an iterative approach is used to determine a common dataset for the gas side and the blood side. This is repeated for different values of R to generate a table of O2, CO2, and R values. From these O2 and CO2 contents can be calculated along with the associated ratios. This is the basis of monitoring the change in R during an exhalation as a means of assessing the underlying distribution as discussed below (Figure 2).
Figure 2.

The O2 CO2 diagram. The relationship between oxygen and carbon dioxide partial pressures in alveolar gas or capillary blood. The points along this line are determined by the ratio. The blue dots indicate mixed venous (0) and inspired (∞) points as well as a normal mean ratio (1.3) for the lung as a whole. Note the marked curvilinear behavior of the plot. Redrawn, with permission, from Rahn H and Fenn WO. 1955 (258).
Intrabreath R
As an individual slowly exhales from vital capacity to residual volume, the concentrations of O2 and CO2 measured at the mouth change (Figure 3). First pure dead space gas is cleared, followed by a mixture of dead space gas and alveolar gas. Later, pure alveolar gas is expired, but this is also not uniform since well-ventilated lung units will empty first, followed by more poorly ventilated lung regions. As the lung volumes become low, gas concentrations also change because of airways closure in dependent lung regions that are close to residual volume. Further, as expiration proceeds, ongoing gas exchange serves to alter the concentrations of O2 and CO2.
Figure 3.

Respiratory exchange ratio (R) measured at the mouth with a rapid-response analyzer during a slow exhalation from vital capacity to residual volume. The change in R during a slow exhalation from total lung capacity is described in four phases. First pure dead space gas is cleared, with R indeterminant (Phase I). In Phase II, R rapidly rises as the dead space is mixed with alveolar gas. As the expiration progresses, dead space is cleared further and gas exchange is ongoing throughout the maneuver with oxygen being removed and CO2 being added. R progressively falls (Phase III) since more oxygen is being consumed than carbon dioxide is being produced. The final phase (Phase IV) is a terminal rise associated with dependent airways closure in lung regions that are close to residual volume. Phase III is also characterized by marked cardiogenic oscillations reflecting the effect of the heartbeat on pulmonary blood flow and lung mechanics. Modified, with permission, from Prisk GK, et al. 2003 (251).
One of the earliest techniques to evaluate matching relied on the analysis of the change in instantaneous respiratory exchange ratio (intrabreath R). The intrabreath R technique for determining , relies on evaluation of R during a slow vital capacity maneuver, and was developed by West et al. (337), later modified by Guy and colleagues (119, 251).
Returning to Eq. (1) and expressing it for both O2 and CO2:
| (12) |
| (13) |
The respiratory exchange ratio, the ratio of to , can be expressed as:
| (14) |
Since in steady state conditions, there is no nitrogen exchange, that is
| (15) |
we can express in terms of and N2 as:
| (16) |
And substituting into Eq. (14) and collecting terms
| (17) |
When inspired CO2 is negligible (usual case) and can be dropped from the equation, this can be converted to partial pressures and expressed as:
| (18) |
where PECO2 is the mixed expired partial pressure of CO2, PIO2 is the inspired partial pressure of O2, and PEN2 and PIN2 are the mixed expired and mixed inspired partial pressures of nitrogen.
Equation (18) describes the relationship between mixed expired concentrations of O2, CO2, and N2. However, this relationship can also be used to describe the relationship between the instantaneous expired concentrations. The subject exhales slowly from total lung capacity while the concentrations of nitrogen, oxygen, and carbon dioxide are monitored at the mouth. The gas concentrations are converted to respiratory exchange ratio using Eq. (18) but substituting the instantaneous gas concentrations. This is then plotted against the expired gas volume (Figures 3 and 4).
Figure 4.

Intrabreath R and iVQ as a function of lung volume measured at the mouth during a slow exhalation from total lung capacity. The data from Figure 3 showing the change in R during a slow exhalation from total lung capacity are replotted in the top tracing (thin line). Dotted lines represent the modeled R assuming differing ratios. The thick tracing represents the intrabreath (iV/Q) derived by interpolating measured R line between the three dotted modeled R lines. Reused, with permission, from Prisk GK, et al. 2003 (251).
Even in a perfectly homogeneous lung without mismatch, the relationship between intrabreath R and volume is curvilinear and is described in four phases (Figure 3). At the onset of the maneuver, R is undetermined (Phase I), with the clearance of dead space and initial partial pressure of CO2 in the expired gas is low and the inspired PO2 is high. This followed by an abrupt rise in R as dead space is mixed with alveolar gas (Phase II). Once dead space is cleared, gas exchange continues throughout the maneuver with oxygen being removed and CO2 being added to an ever-decreasing lung volume. Since under resting conditions, more oxygen is being consumed than carbon dioxide is being produced R again progressively falls, as expiration progresses (Phase III). Phase III is also characterized by marked oscillations reflecting the effect of the mechanical action of the heart or lung tissue and perhaps pulmonary blood flow. The final phase (Phase IV) is a terminal rise associated dependent airways closure.
A simulated one-compartment model of the lung (119, 251) can be constructed taking into account these effects and matching the subject’s residual volume and estimating tissue volume, ventilation, cardiac output, and gas exchange. From this, the mixed venous and alveolar gas concentrations can be calculated for this uniform lung and by varying the assumed value of cardiac output, multiple isopleths can be constructed for this model relationship with each representing a single ratio. In reality, even a normal lung is never perfectly uniform, and the measured R versus volume deviates from that described by a single modeled isopleth. The measured R can be transformed on a point by point basis to a versus volume plot by interpolation between the modeled collection of isopleths and the measured distribution (Figure 4). The onset of airway closure (Phase IV of the expirogram, seen as a terminal rise) is identified and the slope of the versus volume plot is determined, over Phase III—that is exclusive of the initial rise seen as dead space is rapidly cleared and this terminal rise, using least square regression.
Heterogeneity can be expressed in several ways: since there is often nonlinearity in the plots of R and modeled versus volume Phase III of the expirogram is divided into two halves (Figure 5). The slopes of the two best fit lines to the R versus volume plot, one corresponding to the first half of the Phase III and one to the second half, are used as a metric of heterogeneity. In addition, the maximum range of values for the measured data can be calculated as an index of heterogeneity (119, 251).
Figure 5.

Determination of iVQ slope as a measure of heterogeneity. The intrabreath ratio (iV/Q) obtained by interpolating the measured intrabreath R with the modeled R isopleths from Figure 4 showing the region of Phase III. A line is fitted to the two halves of Phase III by least squares regression (thick line). The slope of the first half of phase three has been shown to correlate with heterogeneity measured by MIGET and become steeper with methacholine administration (251). The solid vertical bar represents the intrabreath VA/Q, iV/Q range over Phase III, and this is also used as an index of heterogeneity but is only weakly associated with MIGET metrics of heterogeneity. Reused, with permission, from Prisk GK, et al. 2003 (251).
This technique has been compared to the multiple MIGET in dogs under baseline conditions and after exposure to methacholine challenge (251). There were modest, but significant correlations between the first 1∕2 of the slope of the measured versus volume and the MIGET indices , and AaDO2 and PaO2. The advantages of the technique are the noninvasive nature and its simplicity, requiring only the ability to monitor exhaled O2 and CO2 with rapid response analyzers and expired volume. This means that it can be employed under may conditions, such as different postures, and in challenging research environments. This technique has even been used to measure ventilation-perfusion matching during spaceflight (250)! Disadvantages of the technique include the lack of spatial information and relatively modest correlations with the MIGET derived indices. Since it is a method that relies on information from the ventilation side of relationships it has limited sensitivity to regions of low ratio because the poorly ventilated lung units contribute little to the expired gas. Unsurprisingly, the technique is insensitive to shunt because these units are unventilated (by definition) and thus contribute nothing at all to the expirogram.
Measurement of shunt and dead space
While not a means of measuring mismatch per se, dead space and shunt represent two compartments in the distribution affecting gas exchange. For completeness sake, common gas exchange techniques for measurement of dead space and shunt are included here.
Shunt
More than 70 years ago, Berggren (33) described the use of 100% oxygen to quantify shunt by measuring arterial and pulmonary mixed venous oxygen contents and calculating the alveolar partial pressure of oxygen. The assumption is made that by breathing 100% oxygen for long enough, any hypoxemia arising from mismatch will be overcome, as blood leaving regions of low ratio will be fully oxygenated greatly reducing if not eliminating any venous admixture. Also, breathing 100% oxygen means that any diffusion limitation of oxygen transport will be overcome, thus the only source of deoxygenated blood in the arterial circulation is from blood that bypassed the gas exchanging regions of the lung, that is, from a shunt (although a small extent of venous admixture from very low units may be present).
Total cardiac output is the sum of blood that passed through ventilated regions of the lung and that that was shunted :
| (19) |
By mass balance the oxygen content in arterial blood must be the sum of the fully oxygenated blood leaving the lung, that is pulmonary end-capillary blood and the shunted deoxygenated mixed venous blood each weighted by their respective flows:
| (20) |
Substituting for for , this can be rearranged to give
| (21) |
Since the effects of diffusion limitation and low ratio on the arterial blood are eliminated it is also assumed that blood leaving the pulmonary capillaries is in equilibrium with alveolar gas and the calculated PAO2 is used in the calculation of .
Bohr dead space
Seminal work by Bohr (37) defined the relationship between alveolar ventilation, carbon dioxide production, and dead space. Returning to Eq. (13):
| (22) |
Since inspired CO2 normally is negligible this simplifies to:
| (23) |
Since gas exchange occurs in the alveoli [this is not strictly true because highly soluble gases such as ethanol, λ > 1700, and acetone, λ 300 to 400 (160, 175), undergo gas exchange in the airways (141)] this, by mass balance, gives:
| (24) |
Since
| (25) |
This can be combined with Eq. (24) to become
| (26) |
This can be expressed in terms of partial pressures of CO2 and if PaCO2 is assumed to be equal to PACO2 then fractional dead space can be calculated using measured arterial PCO2 and mixed expired CO2. If and respiratory frequency are known, then these can be converted to a dead space volume. This substitution of PaCO2 for PACO2 is known as the Enghoff modification of the Bohr equation. In using this, it should be recognized that this has the potential to introduce error: In the presence of a right to left shunt, the high concentration of CO2 in shunted blood means that the PaCO2 will exceed the PACO2 rendering this assumption invalid (304).
Fowler dead space
Fowler (87) described the plot of nitrogen concentration versus expired volume over the course of expiration following a breath of pure oxygen (Figure 6) in three phases and used this to determine dead space. While Fowler referred to this dead space as “physiologic dead space” the measure is closer to anatomic dead space.
Figure 6.

Single breath nitrogen washout and Fowler dead space. (a) A schematic drawing of an expirogram showing the change in expired nitrogen measured at the mouth following the inspiration of pure oxygen. Initially, there is no nitrogen, as the previously inspired pure oxygen is cleared (Phase I). There is rapid rise in nitrogen concentration as resident gas partially mixed with oxygen is expired (Phase II). Phase III is a relative plateau in nitrogen, reflecting the mixing of inspired oxygen with resident gas (87–89), and the slope of this reflects ventilation heterogeneity (314). Phase IV is a terminal rise in nitrogen concentration again representing dependent airways closure. The red box indicates the portion of the plot represented in (b). (b) A schematic of the expirogram in a normal subject with little Phase III slope. The concentration of nitrogen in the Phase III plateau (top dotted blue line) is used as the concentration of alveolar nitrogen. The area under the curve divided by the volume expired is used as the concentration of mixed expired nitrogen to solve the Bohr equation for dead space. The simplified graphical method uses the straight line along Phase III and a vertical line intersecting Phase II (red line) such that the two areas A and B defined by this are equal. The intersection of the red line with the x-axis is dead space. This approach is problematic in patients with lung disease because ventilation heterogeneity, which is almost always present, means that there will be a significant upward slope in Phase III and thus difficulty in estimating alveolar nitrogen (88).
When a tidal volume sized breath of pure oxygen is inspired, the oxygen has the effect of displacing dead space gas, as the gas remaining in the dead space is inspired into the alveoli. In addition, some of the oxygen mixes with air in the distal airspaces. At the start of expiration, there will be no nitrogen, because the previously inspired pure oxygen is undiluted in the dead space (Phase I). This is followed by a rapid rise in nitrogen concentration as resident gas partially mixed with oxygen is expired (Phase II). The transition between the exhalation of pure oxygen to alveolar gas is not a square wave function because amongst other reasons, not all the airways comprising dead space have the same path length, or are of the same size; thus, the airways are cleared at different times. The final phase (Phase III) in Fowler’s description was a relative plateau in nitrogen concentration which was the dilution of the resident nitrogen in the alveoli by the inspired oxygen (see Figure 6) (87–89). A Phase IV is also described (although not originally by Fowler) which is a terminal rise in nitrogen concentration again representing dependent airways closure.
In the calculation of Fowler’s dead space, the concentration of nitrogen in the Phase III plateau is used as the concentration of alveolar nitrogen. The area under the nitrogen-volume curve was divided by the volume expired during the maneuver and used as the concentration of mixed expired nitrogen. The Bohr dead space equation, Eq. (26), was solved for dead space. This measure of dead space was simplified by Fowler to solve it graphically (Figure 6). This method used a straight line along Phase III and a vertical line intersecting Phase II such that the two areas so defined were equal. The volume where the vertical line intersected with the x-axis (expired volume) was recorded as dead space.
The initial measures were made in normal subjects and thus there was very little ventilation heterogeneity and the plateau in Phase III was relatively flat. If there was a small slope in Phase III, the nitrogen concentration was back extrapolated to the end of Phase II to determine an alveolar concentration; this approach is problematic in patients, because ventilation heterogeneity means that there will be a significant upward slope in nitrogen (88). Indeed, this rise in Phase III has been used as an index of ventilation heterogeneity (see Ref. 314 for review).
Multiple inert gas elimination technique
Although somewhat technically complicated, the MIGET is based on fundamental principles of pulmonary gas exchange and simple equations of mass balance that were outlined in Eqs. (1–7) in the first part of this manuscript. MIGET uses relationships between arterial, expired, and mixed venous concentrations of trace amounts of marker gases dissolved in saline and infused intravenously, to solve for the distribution of ventilation-perfusion ratio in multiple gas exchange units. These marker gases are inert meaning that they do not participate in chemical reactions in the blood and have linear proportional relationships between solubility, concentration, and partial pressure. If cardiac output is measured independently, the pulmonary arterial catheter can be omitted, and mixed venous concentrations calculated from arterial and expired concentrations using the Fick principle (Eq. 4). The inert gases in solution are infused in a peripheral vein and after allowing time for equilibration, arterial and pulmonary mixed venous blood samples are obtained from indwelling arterial and pulmonary arterial catheters. Mixed-expired air samples are obtained by expired gas sampling from a heated mixing chamber. After the blood samples undergo equilibration with nitrogen and extraction, the concentrations of the inert gases are measured in all samples using gas chromatography and the extent of ventilation-perfusion inequality and shunt can be quantified. In addition, the amount of diffusion limitation of oxygen transport can be estimated.
Although the discussion of MIGET below may seem to be disproportionally detailed, this level of detail is warranted, given its stature as a quantitative method that is arguably the gold standard for quantifying ventilation-perfusion relationships. In addition, some of the principles presented in this section are revisited later in other sections. A detailed discussion of MIGET including the underlying theory and methods as well as a review of the MIGET literature has been recently published (160) and the reader is referred there for detailed information.
MIGET theory
The previous sections of this manuscript focused on respiratory gas exchange (O2 and CO2) but these principals of mass balance can be applied to any gas. With this in mind, Eq. (7) can be rewritten for an inert gas (x) as follows:
| (27) |
Since here we are concerned with an inert gas that is infused into venous blood and then eliminated through the lungs (this is how the MIGET technique is used, but other measures using inert gases rely on gas uptake, see then section on imaging methods), the subject is not inspiring the gas, so PI is zero and the equation can be simplified to:
| (28) |
As mentioned earlier, inert gases have a linear relationship between partial pressure (P) and concentration (C) in the blood and the slope of this relationship is the solubility, β:
| (29) |
Substituting Eq. (29) into Eq. (28) gives:
| (30) |
The blood:gas partition coefficient (λ) of an inert gas x, is the ratio of concentrations of the gas in blood and in gas when the gas and blood are in physical-chemical equilibrium and thus have the same partial pressure and:
| (31) |
In the absence of diffusion limitation for inert gases, , and substituting λ for k·β Eq. (30) can be simplified to an equation that forms the basis of MIGET:
| (32) |
The ratio is defined as the retention of the inert gas x being eliminated by the lungs whereas the ratio is the excretion of the gas (more about excretion later). By infusing inert gases dissolved in either dextrose or saline and subsequently measuring retention, excretion and λ, for a single gas, then a single ratio can be estimated. When data from multiple gases of differing solubility are used to give information, a distribution of ventilation and perfusion to compartments of different ratio can be generated. Figure 7 shows a plot of the relationship between retention and λ for a hypothetical uniform lung with a single ratio. This plot is simply solving Eq. (32) for inert gases of different λ. It can be seen that very low solubility gases (small λ) are almost completely eliminated, whereas gases of high solubility (large λ) undergo very little elimination. Gases of intermediate solubility fall somewhere in the middle.
Figure 7.

Retention of inert gases of differing solubility used in MIGET. Retention, the ratio of arterial concentration to mixed venous concentration of inert gases of differing blood-gas partition coefficient (λ) in a homogeneous lung without mismatch a mean ratio of 1. The plot is constructed by solving Eq. (32) for gases of differing λ. The six gases shown are ones commonly used in MIGET and cover most of the retention curve. Redrawn, with permission, from Hopkins SR and Wagner PD. 2017 (160).
The same plot can be constructed for a range of ratios (Figure 8), and it can be appreciated that the shape of the relationship is identical but displaced to the left for low ratios and to the right for high ratios. It is worth noting on this plot that the point where retention is 0.5 occurs when in this hypothetical homogeneous lung. Of course, a perfectly uniform, homogeneous lung does not exist; and in the presence of inequality, blood leaving lung regions of different ratio will produce a mixed arterial blood retention curve that is the flow-weighted average of the different retention curves (Figure 8). MIGET measures the retention and excretion composite curves and uses this to perform an inverse calculation to determine the underlying distribution consistent with this composite curve (more details about this given below).
Figure 8.

Retention of inert gases in lung units of differing ratio. (A) Individual Inert gas retention curves for a three-compartment lung with three different ratios, 0.1, 1.0, and 10. Similar to Figure 7, the plot is constructed by solving Eq. (32) for gases of differing λ, and now, different ratios. The plot for ratio of 0.1 and 10 have the same shape as the one for the ratio of 1 but are displaced a decade higher and lower. Note that when retention is 0.5 (dotted horizontal black line), (colored arrows) for each curve. (B) A three-compartment lung with the same ratios (dashed lines) as in (A) with equal blood flow to each compartment. The composite retention curve for this three-compartment lung is the flow weighted average of each individual curve (black solid line).
As mentioned above, the assumption with MIGET is that there is no diffusion limitation for inert gases, and in a perfectly homogenous lung PA = Pa, so retention and excretion are equal. However, because mixed expired gases (not alveolar gases) are sampled for the MIGET calculations, the ratio of mixed expired gas partial pressure (PE) to mixed venous blood, , is typically referred to as “excretion.” For this reason, the excretion curve has the additional complication of anatomical dead space, which serves to dilute the alveolar gas partial pressure of the inert gases, and lowers the position of the excretion curve:
| (33) |
where PD is the dead space partial pressure and is dead space ventilation. Since in inspired gas P, the partial pressure of the inert gas in inspired air (and therefore dead space) is zero this simplifies to:
| (34) |
Note that this is just Eq. (24) generalized for an inert gas and rearranged. reflects a ventilation-weighted and dead space diluted average of the individual alveolar gas partial pressures, and therefore differs from retention which is the blood-flow weighted average of the individual alveolar gas partial pressures. This is analogous to the alveolar-arterial difference for oxygen, which arises because the alveolar concentration is the ventilation weighted averages of the regional PO2 whereas the arterial concentration reflects the perfusion-weighted averages. While both retention and excretion measures contain the same underlying information, the effect of random experimental error relative to the magnitude of the measurement differs between the two measures. Retention gives greater sensitivity to detect regions of low ratio while excretion shows greater sensitivity to high ratio. Retention is better than excretion for detecting low areas because the relative contribution to mixed arterial blood is greater than to mixed expired gas because, by definition, blood flow is higher than alveolar ventilation in low areas.
Inert gas retention and excretion
As mentioned previously, in a perfectly homogenous lung without shunt or dead space the retention and excretion curves would overlie one another. This is true whether excretion is calculated from or since in this case dead space is absent and the weighting of ventilation and perfusion is identical in a uniform lung. However, such a lung does not exist and the relationship between the two can be expressed using the Fick principle assuming the absence of inert gas in the inspired gas (inert gas elimination) as
| (35) |
Dividing by
| (36) |
| (37) |
and
| (38) |
| (39) |
The 50-compartment model of the distribution
MIGET measures the retention and excretion composite curve for six inert gases and determines the underlying distribution consistent with the composite curve. A list of the gases commonly used in MIGET and their associated λ are given in Table 2. The retention (and excretion of gases) of differing solubility is the flow-weighted composite curve of the six inert gases across multiple ratios. The six gases are chosen because they have a range of values of λ (shown previously in Figure 7) spanning approximately 0.001 to 100 at roughly equal intervals and for their lack of chemical reactions in blood as well as lack of toxicity (323).
Table 2.
The Six Inert Gases Used in MIGET and Their Blood-Gas Partition Coefficients (λ)
| Gas | Blood-gas partition coefficient (approximate) |
|---|---|
| SF6 | 0.005 |
| Ethane | 0.1 |
| Cyclopropane | 0.5 |
| Isoflurane | 2.0 |
| Diethyl ether | 12.0 |
| Acetone | 300.0 |
MIGET uses a standard set of 50 ratios, and from the composite retention and excretion cures for each of six gases determines how cardiac output and total ventilation are distributed among all 50 of these compartments in any given case by expanding on the relationships defined in the equations above. The 50 compartments include on the low ratio side a shunt compartment with a ratio of zero, a compartment that is the lowest experimentally distinguishable from shunt ( ratio = 0.005) and on the high side the highest ratio distinguishable from dead space ( ratio 100) and a dead space compartment ( ratio=infinity). The remaining compartments are equally distributed on a natural log scale between 0.005 and 100. Parenthetically, as discussed later that indices termed “Log standard deviation,” Log, SD, of the ventilation and perfusion versus distribution are measures of heterogeneity. However, this nomenclature is somewhat misleading because the standard deviation of the distribution is actually expressed on the natural Log (Ln) scale, even though the typical MIGET graphical output plots the and versus on a Log10 scale.
It is important to recognize that in any one of the 50 compartments retention=excretion (once dead space is taken into account), but because they have different weightings (ventilation weighted in the case of excretion and perfusion weighted in the case of retention) retention for the lung as a whole is greater than excretion except in the theoretical case of a homogenous lung without dead space. The division into 50 compartments was initially made empirically. Fifty compartments provide sufficient resolution to provide a continuum between 0.005 and 100 so that important information is not lost, while not being too computationally cumbersome (160).
Quantifying the distribution and heterogeneity from the 50-compartment model
Compartmental information derived from a MIGET analysis is given in Figure 9. As might be expected from the previous theoretical discussion, the distribution is plotted as two curves—the distribution of ventilation to different ratio compartments, and the distribution of perfusion to the same compartments. At the two extremes of this distribution are the shunt compartment (compartment 1), and the dead space compartment (compartment 50). These are excluded from calculations that describe the “main” distribution and are reported separately.
Figure 9.

Recovered distributions from a normal subject (A) and a patient with COPD (B). The normal subject has a smooth and unimodal distribution of and versus ratio, with a mean slightly greater than 1. There is no shunt (compare to Figure 10) or low or high regions and by convention the dead space compartment is omitted from the distribution plots. This patient with COPD has a tri-modal distribution with regions of low ratio and regions of high ratio. Again, shunt is absent, and a large shunt is not typically observed in COPD patients. Modified, with permission, from Hopkins SR and Wagner PD. 2017 (160) and Wagner PD, et al. 1977 (321).
The fundamental equation on which MIGET is based (Eq. 32) shows that in the case of shunt where is zero (i.e. the compartment is perfused but not ventilated) retention is 1 for a gas of any λ as the blood containing the infused inert gases traverses from the venous circulation to the arterial circulation without undergoing gas exchange in the lungs. In the case of dead space where the ratio is infinity (i.e. the compartment is ventilated but not perfused) air devoid of inert gas is inhaled into alveoli that have no blood flow and thus cannot add inert gas from blood to alveolar gas and thus the retention of gas of any λ is zero.
In practical terms, MIGET reports shunt as all of the blood flow to compartments with a ratio less than 0.005 and dead space ventilation as that to compartments with a ratio above 100. Inspection of Figure 1 (previously) which shows the relationship between PO2 and ratio supports this approach, since the PO2 of blood in a region with a ratio less than 0.005 is virtually identical to the PO2 in mixed venous blood. Similarly, the alveolar PO2 in a lung region with a ratio of 100 is not significantly different from inspired gas once it is saturated with water vapor. It is also worth noting that based on simulations (76), it is difficult to resolve (because of experimental error) compartments that are lower in ratio, than the λ of the least soluble gas, SF6 (λ ~0.005). Conversely, it has been shown that it is not possible to resolve compartments that are higher than the 100, close to the λ of the most soluble gas (acetone, λ ~300). From a physiological standpoint, this is not an important limitation because units above a ratio of 100 effectively behave as dead space with respect to gas exchange.
The blood flow and ventilation to the shunt and dead space are typically reported as fractions of total cardiac output and ventilation. This takes care of the two extremes of the distribution, leaving the “main” distributions of ventilation versus ratio and perfusion versus ratio to be characterized. The simplest approach bins blood flow and ventilation into 5 additional bins, aside from dead space (>100) and shunt (<0.005) decades, that is 0.005 to 0.01, 0.01 to 0.1, 0.1 to 1, 1 to 10, 10 to 100, thus offering information about shunt, low regions, normal lung, high regions, and dead space. While potentially useful, this approach does not take into account simple displacements of the overall ratio, such as would occur if overall ventilation or cardiac output were altered.
A distribution recovered using MIGET from a healthy normal human subject is smooth, unimodal and symmetrical, whereas this may not be the case in lung disease such as a patient with COPD, as seen in Figure 9. Figure 10 shows a distribution from a normal subject with additional quantitative data typically obtained from MIGET indicated. The ratio where the mean of each of the and versus distributions is located (i.e. the first moment) is typically referred to as the mean of and the mean of respectively. The second moment about the mean offers information about the heterogeneity of the distribution. The LogSD, refers to the standard deviation, Log Scale, of the versus distribution and similarly the LogSD, is the standard deviation, Log Scale, of the versus distribution. These metrics are a measure of dispersion where the larger the number the greater the extent of mismatch. Further information on the calculation of this parameter can be found in Ref. 160. Values for normal lungs and moderately and severely abnormal lungs are given in Table 3. Additional metrics for describing heterogeneity that do not depend on the fit to a 50-compartment model have been described (140, 160) but are not as commonly used.
Figure 10.

Quantitative data obtained from the MIGET 50-compartment model. The distribution of ventilation and perfusion are plotted as a function of ratio. In this case, the distributions are smooth and unimodal with the mean of both distributions close to 1. The width of the distributions represented by the standard deviation on a log scale (LogSD) of the distributions is used as an index of heterogeneity, with representing the heterogeneity in the ventilation versus distribution and in the perfusion versus distribution. Shunt and dead space are represented as single points at a ratio less than 0.005 and greater than 100, respectively. Typically, dead space is omitted from these plots because the ventilation to this compartment is so large relative to the other compartments.
Table 3.
Normal Values for Selected MIGET Derived Parameters of Heterogeneity
| Variable | Normal range |
|---|---|
| Fractional dead space | 0.20–0.40 |
| Shunt fraction | <0.01 |
| Mean of Q | 0.80–1.00 |
| LogSD, Q | 0.30–0.60 |
| Mean of V | 0.80–1.00 |
| LogSD, V | 0.30–0.65 |
Reused, with permission, from Hopkins SR and Wagner PD. 2017 (160).
Quantification of diffusion limitation of O2 and CO2
The time for a gas in capillary blood to rise from the mixed venous to alveolar partial pressure (i.e. the time for diffusion equilibrium) depends on two properties of the gas—its solubility in the hemoglobin-free alveolar blood-gas barrier and its capacity to be carried in the blood. For oxygen the solubility in the blood-gas barrier is low and capacity to be carried in the blood is high because of the hemoglobin binding. This combination of low solubility combined with high binding capacity means that oxygen takes longer than most gases to equilibrate, just as filling a large bucket using a hose with a low water flow rate takes longer than if the bucket were smaller or the fill rate were greater. Thus, oxygen is a diffusion-limited gas, and the transfer of oxygen into the capillary blood may be diffusion limited in some instances. However, inert gases, unlike oxygen and carbon dioxide, inert gases do not participate in chemical reactions such as with hemoglobin and also have similar solubilities in both the blood-gas barrier and blood. For this reason, they are invulnerable to diffusion limitation of transport across the blood-gas barrier. Put another way, situations, where inert gases are diffusion limited, are incompatible with life!
This property of inert gases can be exploited to yield information about diffusion limitation of oxygen transport (125, 126, 309). To do this the 50-compartment distribution (including shunt) is used to predict an arterial PO2 (and CO2). This is done by using the alveolar ventilation, blood flow, ratio to each of the 50 compartments and the measured (or calculated from measured values of cardiac output, oxygen consumption, arterial O2 content, and the Fick equation) mixed venous values for the respiratory gases entering the 50 compartments. This allows a calculation of the oxygen content of the blood exiting each compartment. For example, in the first compartment (i.e. the shunt compartment), a 1% shunt would contribute blood that has an O2 content that is the same as mixed venous as its contribution to the blood leaving the compartment. Since the blood flow to each compartment is known, a flow weighted sum of all of the O2 contents leaving the 50 compartments gives a “predicted” oxygen content that ONLY takes into account the measured shunt and inequality. This is converted to PO2 using well-known algorithms (338) giving a “predicted PO2.” In the presence of diffusion limitation, the arterial PO2 measured experimentally will be less than this predicted value.
A limitation of this approach is that especially while breathing hyperoxic gas, random errors in both measured and predicted PO2 increase, because on the flat portion of the oxygen-hemoglobin dissociation curve, small differences in content represent large differences in PO2. For this reason, diffusion limitation is not assessed during hyperoxia and is most accurately assessed during hypoxia. A further limitation is that post-pulmonary shunts (from the bronchial circulation Thebesian veins) lower the experimentally measured arterial PO2 as they perfuse the airways and portions of the heart and return deoxygenated blood into the systemic circulation. The same does not happen to inert gases because there is no further exchange of gas after the blood exits the lungs, and thus the predicted PO2 will not take this into account. The net result is a small increase in the difference between the measured and predicted PO2, which does not represent diffusion limitation for oxygen.
In outlining the theoretical basis of MIGET a great deal of detail has been omitted, but this is the basic principle underlying MIGET. Further information on the mathematical underpinnings can be found in Ref. 160.
Overview of experimental details of MIGET measurements
A complete description of the conduct of a MIGET experiment is beyond the scope of this article and the reader is referred elsewhere (160). Briefly, MIGET experiment requires the continuous infusion of saline or dextrose containing the six inert gases in solution into a peripheral vein, and after waiting an appropriate time for a steady state equilibrium, pulmonary mixed venous and arterial blood samples and mixed expired gas samples are collected. Once the samples are obtained, blood samples undergo equilibration with nitrogen to extract inert gases into the gas phase and together with the mixed expired samples there are analyzed by gas chromatography. If an independent measure of cardiac output is made, and mixed venous concentrations calculated from the expired and arterial concentrations, then mixed venous sampling is not required. This means that an indwelling arterial cannula and a peripheral venous cannula are required at a minimum. In human subjects, the radial or the brachial artery in the nondominant arm is typically used for the collection of arterial blood samples for measurement of respiratory gases and inert gas samples, and the venous cannula for infusion is placed in the opposite arm.
The subject breathes through a mouthpiece connected to a heated nonrebreathing valve and into heated expired tubing and mixing box. Heating prevents loss of soluble gases into water vapor in the expired gas. The typical mixing chamber for a MIGET study is copper: plastic chambers cannot be used because of concerns related to sulfur hexafluoride (SF6), which, while highly insoluble in blood, is soluble in plastics. The inert gases are dissolved in sterile 0.9% sodium chloride or 5% dextrose solution and infusion is then infused at an empirically determined rate in milliliter per minute equivalent to approximately 1/4 of the ventilation rate in liter per minute for at least 20 min at rest to reach steady state. Since the convective flow rates are high during exercise only 5 min is required for steady state. Typically, 4 mixed expired gas samples and two arterial blood samples, obtained in gas-tight glass syringes, are collected for each time point or condition. The inert gases from the blood samples are extracted into the gaseous phase by equilibration with nitrogen. The concentrations of six inert gases in mixed expired gas and arterial blood are measured using gas chromatography. In addition to measuring the relative concentrations of the inert gases in mixed expired gas and arterial (and mixed venous) blood, the blood-gas partition coefficient, λ, for each of the inert gases is determined for each subject, because this may vary substantially between individuals (347).
Once the blood samples and expired gases are analyzed by gas chromatography these together with measures of ventilation, oxygen/carbon dioxide consumption/production and body temperature, barometric pressure, room temperature, hemoglobin, hematocrit, arterial blood PO2, pCO2, and pH are entered into a computer algorithm for calculation of retention, excretions, the data fitting the 50-compartment model (see below) as well as data used in indirectly determining the amount of diffusion limitation (if present) for oxygen and carbon dioxide. Further details on these technical aspects can be found in Ref. 160.
Advantages and disadvantages of MIGET
MIGET has been in use for over 40 years and is arguably the gold standard for measuring ventilation-perfusion mismatch and the associated effects on gas exchange. In addition to recovering a distribution, MIGET also allows quantification of dead space, and shunt, as well as assessment of diffusion limitation for oxygen transport in the pulmonary capillary. It can be applied in humans, and animals under a great variety of conditions: under anesthesia (70, 71, 132), at high altitude (31, 245, 325) and during exercise (125, 148, 151, 157, 267). Once the necessary equipment is on hand a MIGET experiment is relatively inexpensive to conduct. All of these factors combined mean that MIGET has been used in hundreds of studies worldwide (reviewed in Ref. 160).
However, although there is nothing particularly technically difficult about any one aspect of the MIGET experiment, the combined experiment with infusion of inert gases, blood and expired gas sampling and all the ancillary measurements, as well as the gas chromatography to recover the inert gas concentrations, takes on a much larger footprint. There must be meticulous attention to detail particularly in collecting and processing the inert gas samples and ensuring steady state conditions of measurement. As typically implemented (i.e. with expired gas sampling, arterial and venous catheters for blood samples and an independent measure of cardiac output), MIGET is moderately invasive although certain types of MIGET experiments (particularly population studies) are able to use venous blood sampling without the requirement of arterial blood samples (see Ref. 324). Technical demands, combined with the invasive nature, have limited clinical use of MIGET. In addition to these constraints, the 50-compartment model only allows inequality to be expressed as distributions of ventilation or of perfusion to the different compartments. This means that portions of the lung could have a low ratio either because ventilation to that region is relatively low or perfusion is relatively high. These possibilities cannot be distinguished and have implications for the management of patients.
There are several assumptions underlying the theoretical basis of MIGET. This first of these is the assumption of steady state conditions and mass balance, and when MIGET studies are conducted care is taken to ensure steady state or at least quasi-steady-state conditions. A second assumption is there is no diffusion limitation for inert gases, an assumption that is supported by the fact that, unlike oxygen, the ratio of solubilities in alveolar wall (α) and the blood (β) for inert gases is close to 1 (320). The ratio of these two solubilities (α/β) in the blood defines, for any gas, the rate of diffusion equilibration (244), and the ratio of α/β for oxygen is some 30 times lower. Another assumption is that any interaction of inert gases with the airways can be neglected such that alveolar gas concentrations can be inferred from expired gas. This last assumption is not true for highly soluble gases such as ethanol (λ ~1200) and may not be strictly true for acetone (λ ~300) and bronchial blood flow increases the excretion of soluble gases by the airway mucosa (15). Finally, although MIGET is informative at describing gas exchange defects it does not indicate where these are spatially located. Particularly in the case of procedures such as lung volume reduction surgery for emphysema patients, or for monitoring changes reflecting local disease progress being able to localize gas exchange abnormalities would be highly desirable.
Imaging Methods
General considerations
There are several issues that are common to all imaging techniques. One problem is that unlike many other organs, the lung is in motion as the subject breathes. Gating, the timing of the acquisition to the respiratory cycle, the cardiac cycle, or both, may be required if a long image acquisition is required to ensure adequate signal. Alternately, data collection must be very rapid, such as with computed tomography (CT) scanning or some kinds of positron emission tomography (PET) and magnetic resonance imaging (MRI) sequences so that it can be accomplished within a breath-hold. If not, blurring and motion must be accepted in the images. Although the duration of breath-holding is longer at total lung capacity (35) for many types of imaging this decreases signal, as the volume of air in the lung is greatly increased. Certain MRI sequences as discussed below, are acquired at functional residual capacity (FRC), which is the normal resting volume of the lung, and thus more physiologically normal. While this improves the signal-to-noise ratio (SNR), acquisition times are limited to less than 30 s in healthy normal subjects and may need to be shorter by 50% in patients with lung disease.
A measure of the amount of detail contained in an image for all imaging techniques is resolution—that is the minimal distance of two separate points at which the technique can still identify them as separate entities. This in turn will affect quantification, and is relevant particularly for measures of heterogeneity. Resolution is determined by the specific properties of the type of acquisition, such as the hardware used to acquire the image, the voxel size, and the signal-to-noise properties of the acquisition. Acquisitions that have inherently low signal to noise require a lower resolution or must be acquired for a longer duration, so that the signal in a voxel is adequate. In the lung, an additional complication is that motion either from respiratory motion or cardiac motion will affect the local spatial encoding of imaged signal. There is a tendency in the imaging world to think that higher resolution is always better; however, this is not the case in the lung, where the resolution of the imaging technique may be higher than the inherent spatial scale of the physiological process being imaged.
Another issue, that is affected by resolution of the acquisition is termed the partial volume effect. Partial volume refers to the fact that the measurement of signal in a voxel is not independent of its surrounding voxels—signal is lost into and gained from adjacent voxels. This leads to signal averaging and an effective spatial resolution that is larger than the nominal resolution from the voxel size. Partial volume effects may be particularly problematic near the boundaries of the lung with the diaphragm, the chest wall, and other tissues: there may be apparent loss of signal into regions outside the lung, or alternately signal from outside the lung may produce higher signal than that from lung parenchyma.
Radioisotopes
Imaging techniques have been used for decades in the lung to measure the distribution of ventilation and perfusion. Early studies using radioisotopes (17, 27, 163, 335) have yielded important insights into regional function of the human lung. These early works led to the observation that there was a gravitational influence on pulmonary blood flow (17, 335) and to the zone model of pulmonary perfusion (336). In these early studies, radiolabeled tracers were either inhaled (163) or dissolved in saline and injected intravenously during a breath-hold. Imaging was conducted using external radiation counters giving regional information on a gross scale about the distribution of ventilation and perfusion (331, 335, 336). With the development of the gamma camera, imaging using radioactive tracers has fallen into two broad techniques, PET and single-photon emission computed tomography (SPECT). These techniques are widely used clinically, and a great deal of functional imaging studies of the lung have also been conducted. It is not possible within the scope of this article to list all possible isotopes and techniques, and the focus is on the techniques that are used quantitatively to assess regional matching.
Single-photon emission computed tomography
General considerations
Single-photon emission computed tomography (SPECT) measures ventilation or perfusion and reconstructs a three-dimensional image (242, 243) by injecting or inhaling a gamma-emitting source, typically bound to a vehicle and imaging the photons emitted as these compounds undergo decay. A gamma camera that detects the emitted photon is used to acquire multiple “projections” (two-dimensional images), from different angles that are then reconstructed into a 3-D data set using computer algorithms that may then be evaluated. 99mTechnetium is the most commonly used compound and has a long history of use in medical application including applications outside the lung. Other compounds include 81mKrypton, 133Indium, and 133Xenon. Ventilation and perfusion can be separately imaged, and the measures combined to give ratio information. Alternately ventilation and perfusion can be simultaneously imaged using isotopes of differing photon energies to quantify ventilation-perfusion matching (as discussed below), a technique known as dual-isotope single-photon emission computed tomography (243, 285). Compounds such as 81mKrypton (232) and 133Xenon (7, 16) can also be administered as a steady-state intravenous infusion (much as inert gases are dissolved in saline and infused in steady state). In this case, regional is calculated from the elimination characteristics of the tracer.
In transmission scans, the photon source is external and is part of the acquisition system, while in emission scans, the source of photons is through the radioactive decay of elements injected into the area of study. In SPECT scanning since the emitted photon is scattered and attenuated by local tissue interactions, this must be corrected in order for the technique to be quantitative: the tissue induced scattering affects the signal from the photon because it alters the direction of travel and the energy of the photon. These effects are dependent on tissue (i.e. lung, chest wall, heart), the energy of the photon used and the distance that the photon must travel before interacting with the gamma camera. Typically, transmission tomography is used to obtain data for the attenuation correction (7, 8, 285). A transmission scan involves the acquisition of an attenuation (density) map of the imaged subject. This is done by exposing the subject to an external radiation source and imaging the photons transmitted through the tissues of the body. When measuring regional ratios, if radionuclides that have similar emission characteristics or the same compound (such as 81mKrypton, see below) is used to measure both ventilation and perfusion attenuation and scatter affect both measurements equally. In this case, attenuation maps are not required.
An alternate approach for attenuation correction uses a SPECT-CT scanner to acquire a volumetric density map to perform a SPECT attenuation reconstruction (118). The proposed advantage of combined scanners in a single bore is that the functional data from SPECT can be mapped to the structural CT data with minimal registration, since the body position is the same between the two acquisitions. Thus, the only registration required is to correct for the fact that the CT scan is acquired during a breath-hold and the SPECT images is acquired during free breathing (see below). The use of transmission scans or SPECT-CT for attenuation corrections increases the exposure of the subject to additional ionizing radiation, further limiting the number of measurements that can be made with SPECT.
In the case of dual-isotope techniques, it is essential to correct for the additional interference that scattered photons from different emission energies (different isotopes) exerts on the image—a phenomenon called “down scattering.” In addition, the images from each photon energy need to be separately calibrated and corrected. See Ref. 285 for a detailed discussion of these issues affecting quantification. An additional correction must be made, irrespective of technique, for the radioactive decay of the tracer over the course of the measurement.
The acquisition time for SPECT images are on the order of several minutes and so the subject must breathe quietly during the acquisition and the image is affected by respiratory motion that differs in different parts of the lung. This is because gravitationally dependent lung is better ventilated than nondependent lung (334). This has the effect of complicating the accuracy of the registration with the transmission scan and also may smear the recovered image. Respiratory gating is possible but will increase the acquisition time and is not widely used.
Since SPECT quantifies relative alveolar ventilation, corrections must be made if quantitative measures are desired. This can be done by measuring dead space on each subject with classical techniques such as the Fowler method (see the previous discussion under gas exchange methods) as well as total ventilation and respiratory frequency, so that total alveolar ventilation can be calculated and apportioned regionally depending on the relative distribution of the tracer. Similarly, since SPECT measures relative perfusion, as for ventilation, cardiac output must be separately measured for quantification. This can be accomplished with soluble gas uptake measurements (28), impedance cardiography (189), indicator dilution such as green dye (164), thermodilution (97), direct Fick (102), or any number of physiological techniques. These distinctions between relative ventilation (and perfusion) and absolute ventilation (and perfusion) are important because they affect the overall ratio of the lung. In the presence of significant mismatch, the effect on gas exchange will be minimized if the overall ratio is shifted (by exercise, mechanical ventilation, etc.) to the right and higher overall ratios. Conversely, the effect of mismatch on gas exchange will be accentuated if mean position is shifted toward a lower overall ratio such as would accompany an increase in cardiac output without an increase in ventilation.
SPECT measures of ventilation
Inhaled radiolabeled aerosols
One approach to measuring ventilation with SPECT involves the administration of aerosolized particles. Either the radioisotope (such as 133Xenon or 99mTechnetium DTPA) is aerosolized, or an aerosol of radioactive nanoparticles, such as carbon nanoparticles containing 99mTechnetium, is administered via mouthpiece or mask. The aerosolized particles distribute in the lung according to local ventilation such that areas of the lung that receive fresh gas receive more of the tracer, and thus will show greater signal intensity on the acquired image. Several mechanisms affect the distribution of inhaled particles including impaction from inertial forces, sedimentation by gravitational forces, and Brownian diffusion (24, 25, 60, 311). Inhaled particles are also affected by turbulent mixing in the airways, electrostatic charge interactions, and interception. Inhomogeneity of aerosol size will affect the local delivery of tracer because the effects listed above affect different particle sizes differently (Figure 11) and alter the favored sites of particle retention in the airways. For example, the inertia of large aerosol particles (>5 μm diameter) means that they are not able to follow rapid changes in the direction of airflow (at airway bifurcations or in the switch from inspiration to expiration) and are more likely to impact the airway wall. Since rapid flow occurs in the first few airway generations this is the main site of deposition of larger particles. Aerosol particles (1–8 μm diameter) also undergo gravitational sedimentation, thus particles in the 5 to 8 μm diameter experience both sedimentation and impaction while small particles (<0.5 μm diameter) penetrate deeper into the lungs and distribute by Brownian diffusion. Since sedimentation by gravity and Brownian diffusion take time, smaller particles tend to deposit by these mechanisms deeper into the lung where the residence time is longer (60).
Figure 11.

Site of particle deposition in the airways by particle size. These complex relationships between particle diameter and site of deposition highlight the importance of the selection of appropriate particle or aerosol size for measurements of alveolar ventilation. Technigas® graphite particles are 0.005 to 0.2 μm (24, 303) and thus are an optimum size. Care must be taken to keep nebulized liquids such as 99mTc-DTPA at an aerosol diameter less than 2 μm (24). Aerosolized fluorescent microspheres used in destructive tissue techniques are approximately 1 μm (11). Adapted, with permission from Tsuda A, et al. 2013 (311).
Additional factors affect the distribution of the radiolabeled aerosol into the ventilated portions of the lung. The amount of radiolabel in aerosolized liquids is proportional to the volume of the droplet and thus may vary depending on aerosol size. Aerosolized liquids are not uniform spheres, so particle shape also affects deposition as irregular shapes affect their aerodynamic behavior. Aerosols composed of liquids become larger as they travel down the humidified airways because they are hydrophilic. All of these factors affect the deposition characteristics of nebulized and aerosolized radiolabeled and thus great care must be taken so that there is not significant deposition in the nasopharynx or conducting airways rather than the distal airways where gas exchange takes place (24, 25, 60). For these reasons, the performance of nebulizers should be assessed, and the droplet size kept at 2 μm or less.
99mTechnetium is the workhorse of nuclear medicine and 99mTechnetium-DTPA (diethylenetriaminepentaacetic acid) is the most common aerosol used in ventilation imaging. 99mTechnetium-DTPA is cleared from the lungs by transepithelial diffusion across the alveolar wall with a biological half-life that varies with several factors, ranging from over an hour in healthy nonsmokers to typically less than 30 min in smokers (24, 220). Thus, clearance of this tracer can provide information about epithelial integrity (230). However, in quantitative measures of ventilation, this uncertainty about the biological half-life is undesirable as it may distort the recovered images.
Technegas® is an aerosol of graphite particles in 0.005 to 0.2 μm size range (24), which are labeled with 99mTechnetium. From Figure 11, it can be appreciated that the particle size is well suited for alveolar deposition. Since the particle size is very small relative to aerosols typically used in imaging, the problem of impaction in the central airways is much less. The deposition characteristics of Technegas approach that of the inhaled noble gases (discussed below) and the ventilation measurements provide similar results (14, 54, 58). Unlike nebulized liquids, Technegas does not have the problem of growing in size in the airways because it is hydrophobic, not hydrophilic. Rather the particles tend to aggregate if not used promptly after generation, although this has improved by refinements of the generation process since the initial introduction of the compound (219). The biological half-life of Technegas is over 5 days, and the inhaled particles are slowly cleared by resorption (24). Technegas is produced by heating graphite and pertechnetate in 100% argon. Argon is used because the presence of oxygen at the time of Technegas generation produces Pertechnegas. Pertechnegas radiolabel clears the alveolar space so rapidly that it can be used as a marker of blood-gas barrier permeability (220). However, this characteristic is undesirable for the measurement of ventilation since it will distort the acquired images. At the time of writing (2019), Technegas is not currently available in the United States because it is not FDA approved, but is undergoing clinical trials and is available in the European Union countries, Canada, and many other countries.
Inhaled radiolabeled noble gas
There are two noble gases that are currently used to image ventilation: 81mKrypton (83) and 133Xenon. Since the 81mKrypton and 133Xenon are delivered as gases this avoids the issues associated with deposition of aerosols or particles in the central airways. 81mKrypton is not available in the United States and is not as widely used as 133Xenon (233). As a noble (inert) gas 81mKrypton is produced from Rubidium (81Ru) generation with an extremely short physical half-life of 13 s (84), meaning that the signal declines faster from decay than by expiration of the inhaled gas. This property can be exploited by having the subject inhale multiple breaths to achieve a steady state, and then the image is acquired. Well-ventilated lung will have more signals at steady state, and thus the imaged distribution of radiolabel will be proportional to the local ventilation.
The amount of isotope in a lung region depends on tracer delivery (i.e. the inspired concentration per unit volume and alveolar ventilation) and the loss of counts due to ventilatory washout and radioactive decay (83, 129). This can be written as:
| (40) |
where is alveolar ventilation, CI is the inspired tracer concentration per unit volume, CA is the alveolar concentration per unit volume, λdecay is the radioactive decay constant of the tracer and NA is the total number of isotope molecules in the alveolus. Typically, in the imaging world, this decay constant is referred to simply as λ. However, it is referred to here as λdecay so it is not confused with the blood-gas partition coefficient for gases also designated as λ as used elsewhere in this manuscript.
To convert concentrations in the alveolus (CA) to the total number of counts the total volume of gas (VolA) in the alveolus must be taken into account
| (41) |
and substituting
| (42) |
It should be noted that the term is the ratio of fresh gas delivery to the resident volume (gas) of the alveolus, so this term is specific ventilation. Since the λdecay for 81mKrypton is large, the denominator is dominated by the high value for λdecay (approximately double or triple that of the regional ventilation) and the signal is more dependent on ventilation rather than specific ventilation.
The ratio of NA regional/Ntotal (i.e. the ratio of regional counts to the total counts in the lung) is given as:
| (43) |
Again this is dominated by λdecay for 81mKrypton in both the numerator and denominator, which is the same in both. Hence:
| (44) |
81mKrypton lends itself to dual-isotope imaging because the gamma energy of 81mKrypton is 193 keV (24) whereas 99mTechnecium has an energy of 140 keV (241–243). Thus, 81mKrypton can be combined with 99mTechnecium macroaggregated albumin (see below) to image ventilation and perfusion in a combined fashion. Infusion of 81mKrypton can also be used to measure perfusion (see below). The short physical half-life of 81mKrypton, unlike 133Xenon (see below) has the benefit that investigators are not exposed to significant radiation, which is not the case for 133Xenon. However, it has the disadvantage that very poorly ventilated lung (slow space) may not receive the isotope before it has undergone decay, thus these regions may be underestimated (350).
133Xenon with a photon energy of 81 keV is more widely used in North America but has limited availability in the European Union. 133Xenon is a product of 235Uranium decay and has a physical half-life of over 5 days and thus the amount of decay over the course of acquiring an image is very small. The subject first breathes into a breathing circuit containing small amounts of 133Xenon and continues tidal breathing until equilibrium is established; images are obtained which reflect the regional distribution of gas volume in the lung (67). The subject is switched to breathing room air and clearance of the inhaled tracer is imaged with dynamic SPECT (repetitive 30-s image acquisitions) to evaluate washout of the gas (67). Well-ventilated lung will washout the gas more quickly and thus this information can be used for calculation of ventilation. Alternately single breath studies alone are used in clinical imaging but will not offer resolution of poorly ventilated lung units, and cannot be used quantitatively (305). The long physical half-life of 133Xenon has the disadvantage that investigators will be exposed to the radiation present in the exhaled gas from the subject (201).
SPECT measures of perfusion
Injected radiolabeled macroaggregated albumin
Pulmonary perfusion measurements with SPECT typically involve the injection of 99mTechnetium- or 113mIndium labeled macroaggregated albumin [99mTc-MAA, 133mIn-MAA (241–243)]. The choice of tracer depends on what isotope is being used to evaluate ventilation. 113mIndium with a photon energy of 392 keV can also be prepared with macroaggregated albumin (238, 242) used in a similar fashion to 99mTechnetium-MAA.
Macroaggregated albumin particles, although not uniform in size (typically 10–150 μm) are generally too large to pass through the capillary bed, and thus lodge in small pulmonary arterioles and pulmonary capillaries. These lodged particles are distributed in proportion to local blood flow. If measures of cardiac output are made the measures can be converted into absolute measures of regional perfusion. As for all imaging methods, the resulting perfusion distribution will express perfusion per volume element, and thus any distortion of the underlying tissue architecture (such as from the weight of gravity) will affect the measurements (152) unless accounted for in some manner. Using SPECT Petersson et al. (240) showed that this effect can be rather large, with gravitationally dependent lung showing apparently greater perfusion irrespective of the posture of tracer administration.
When 99mTechnetium is used to image both ventilation and perfusion, instead of a dual-isotope study, the ventilation imaging should be done first. This is because it is easier to deliver a larger dose intravenously, than by aerosol, and the counting rate of the second study must be some three to four times larger than the first, if the same isotope is used.
Infused radiolabeled noble gases in solution
Much in the same way that inert gases in the gaseous phase can be dissolved and infused for MIGET, radiolabeled noble gases such as 81mKrypton and 33Xenon can be dissolved in saline and infused to measure function (83, 84, 232). For example, 81mKrypton has a blood-gas partition coefficient (λ, or solubility) of approximately 0.05 (162, 232), in between SF6 (λ ~0.005) and ethane (λ ~0.1) used in MIGET (160). When dissolved in 5% dextrose or 0.9% saline, and continuously infused to steady state, 81mKrypton can be used to measure perfusion by making the assumption, that because of the low solubility, it is largely excreted into the alveolar space as it passes through the lung, where it is cleared by ventilation and radioactive decay. The equation expressing this is identical to Eq. (40) except written for infused gas (129):
| (45) |
where is alveolar ventilation, CI is the tracer concentration per unit volume, CA is the alveolar concentration per unit volume, λdecay is the radioactive decay constant of the tracer and NA is the total number of isotope molecules in the alveolus, as before. This can be normalized and expressed as a percentage of the total counts as shown for the ventilation measurement (see Ref. 129 for explanation) such that the number of counts expresses relative perfusion, that is
| (46) |
Measurement of regional ratio with SPECT
The techniques listed above can be combined to measure regional ratio. For example, regional ratio can be measured by using the two techniques using 81mKrypton described above sequentially. 81mKrypton is administered both by inhalation and infusion sequentially (67) then regional matching can be assessed as (129):
| (47) |
Alternately dual-isotope single-photon emission computed tomography can be used to measure both simultaneously. Finally, compounds such as 81mKrypton (232) or 133Xenon (7, 165) can be used to measure both ventilation and perfusion within a single study.
Dual-isotope single-photon emission computed tomography
As mentioned above, 81mKrypton and 99mTechnecium lend themselves to dual-isotope imaging because the gamma energy differs sufficiently that the two isotopes can be distinguished (285, 286). This type of approach has the advantage that it shortens the acquisition time, and the two images are already registered, so no registration correction is required (239). 99mTechnecium-macroaggregated albumin is infused and then a dual-isotope acquisition is conducted during inhalation of 81mKrypton or 133Xenon. The two sets of projected images (i.e., each isotope, ventilation, and perfusion) are individually corrected for scattering and attenuation as well as for the appearance of photons from one isotope appearing in the energy window used for detecting the other (286). This is particularly a problem with the acquisition of the lower energy isotope where a larger number of the photons emitted by the higher energy isotope will appear in the energy window used to image lower energy isotope, a phenomenon termed “downscatter.” Another combination that has been used for imaging regional is to use injected 113mIndium macroaggregated albumin to measure perfusion combined with 99mTechnecium-Technegas for ventilation imaging ((242, 285) see Figure 12). This technique has been validated against MIGET with good results (243).
Figure 12.

SPECT measurement of . Dual-isotope SPECT with 133mIn-MAA albumin was used to measure perfusion (top) and Technegas® to measure ventilation (bottom). Data were acquired on a SPECT CT system, which allows for attenuation correction, and the underlying CT image can be seen in gray surrounding the colored lung field. The left-hand images are the axial projection, the center images are coronal and right-hand ones sagittal. The color scale represents relative intensity (i.e., ventilation or perfusion). Reused, with permission, from Petersson J, et al. 2007 (242).
Infused radiolabeled noble gases
Another method relies on the use of 133Xenon to measure both ventilation and perfusion (7). This technique is similar to the PET method using 13Nitrogen detailed below. As mentioned earlier, xenon is an inert gas that has relatively low solubility in blood (λ ~0.5). This characteristic means that if it is infused in solution intravenously during a breath-hold it will first distribute to the lung in proportion to local perfusion. Following the breath-hold when the subject resumes tidal breathing, the tracer will be eliminated proportionally to regional alveolar ventilation. This can be written as a simple equation of mass balance in the same manner as for the MIGET technique as:
| (48) |
This is nothing more than a statement that the volume of gas delivered to the lungs, that is the blood flow times the content is balanced by the amount leaving in expired ventilation plus the amount remaining in the arterial blood where CA is the concentration in alveolar gas, and it is a restatement of the equations earlier dealing with the fundamentals of gas exchange. This can be rearranged to give
| (49) |
The mixed venous concentration can be calculated from measurements in the right ventricle, and the regional CA is calculated from the measured 33Xenon in the lung after correcting for the amount of resident gas in the region from the transmission density scan, with using a assumed λ. There are other issues related to the estimation of the mixed venous concentration such that this technique is not fully quantitative (see Ref. 7 for discussion). Additionally, as for other inert gases, λ for Xenon varies between will vary between individuals with blood lipids, hemoglobin, and protein concentrations (347). For this reason, solubility for each inert gas is measured in each subject in MIGET experiments. If this is not done for Xenon any variability in the λ for an individual from the assumed value will contribute error.
Advantages and disadvantages
There are some significant advantages to SPECT imaging (see Ref. 239) and related gamma scintigraphy techniques. The techniques are widely available, and when particles are used to label ventilation or blood flow it is possible to evaluate measures in the upright posture by administering tracer upright before moving to supine posture for imaging. In addition, gamma scintigraphy techniques have been used in a variety of physiological conditions such as under anesthesia and mechanical ventilation (229), and during hypergravity (21, 61). Data are acquired during tidal breathing, which is easier for the subject than with some other techniques. With dual-isotope studies, ventilation and perfusion are measured at the same time so no registration is required. Some of the disadvantages of SPECT include, that as typically implemented, SPECT measures are semi-quantitative and expressed as relative to the overall mean perfusion (assigned value of 1.0) and thus are not sensitive to changes that result in overall changes in one distribution relative to the other. The resolution of the images depends on the radioisotope used but are generally lower than other techniques such as MRI or PET (239). Since the gamma camera rotates around the subject to acquire data, and the acquisition time is long, respiratory gating is not possible. SPECT ventilation/perfusion images are typically acquired during tidal breathing, leading to blurring. When elimination of 133Xenon is used to measure both ventilation and perfusion, ventilation to regions distal to a vascular obstruction will not be measured, because no tracer will be delivered to the alveolar space. Finally, while the radiation dose with a single acquisition or either ventilation or blood flow data is acquired is relatively modest, this can rise significantly when repeated studies are planned, or when measurements are the focus (see Table 4).
Table 4.
Approximate Radiation Effective Dose Associated with Selected SPECT, PET and CT Measures
| Modality | Measurement | Compound | Approximate effective radiation dose (mSv) | Refs |
|---|---|---|---|---|
| SPECT | Ventilation | 99mTc-DTPA | 0.2 | (216, 287) |
| SPECT | Ventilation | 99mTc-Technegas | 0.6 | (287) |
| SPECT | Ventilation | 133Xe | 0.5 | (216) |
| SPECT | Perfusion | 99mTc-MAA | 2.0 | (216) |
| SPECT | Perfusion | 81mKr | 0.16 | (255) |
| SPECT | 133Xe | 1.1 | (287) | |
| Dual isotope SPECT | 99mTc-Technegas/113In | 3.3 | (285) | |
| PET | Ventilation | 68Ga-Galligas | 1.1 | (23) |
| PET | Perfusion | 68Ga-MAA | 3.6 | (23) |
| PET | VA/Q | 13N | 0.2 | (225) |
| CT | Attenuation | - | 2.5 | (23) |
| Dual energy CT | Ventilation | Xe | 4.1–4.8 | (146) |
| 4DCT | Perfusion | Iodinated contrast | 4.2 | (95) |
| Dual energy CT | Perfused blood volume | Iodinated contrast | 3.5 | (95) |
The approximate effective radiation dose for some types of imaging procedures. The effective radiation dose takes into account the sum of organ doses of a particular type of radiation exposure, which is a function of the type of radiation, and the duration of exposure. In the case of tracers, the half-life and rate of clearance, are also important. The effective radiation dose will vary with the individual and the exact imaging conducted.
Positron Emission Tomography
Related techniques to measure regional ventilation and perfusion use positron emission tomography or PET. This technique also relies on the decay of a radiotracer particle. However, the PET radiotracer produces positrons (an antiparticle of an electron) on decay (225, 266) whereas in SPECT the emitted particle is a photon. After emission, these positrons travel a short distance in tissue (the distance depends on the specific radiotracer) before decelerating to point where they collide with electrons in tissue. This collision annihilates both particles, but the offshoot is the emission of two annihilation photons. These photons have equal energy and travel in opposite directions to external detectors. Like SPECT, once the photons reach external detectors the photons emit light in interaction with a scintillator, material that luminesces when excited by ionizing radiation. This emitted light is then detected by photomultiplier tubes or silicon avalanche photodiodes. PET differs from SPECT in that only photons arriving to the detectors in opposite direction pairs, and thus have arisen from the same annihilation event of the emitted positron, are counted. Measuring these coincident pairs of annihilations allows a 3D map of the infused or inhaled radioisotope concentration to be constructed. Since the tissue density in the lung is low compared to other tissues the photons travel further before they are annihilated, and for this reason, the resolution in the lung is lower than in images of other tissues. Similar to SPECT, transmission scans must be obtained to correct these emission scans for attenuation and scatter. Common radioisotopes used in lung PET imaging are 13N-Nitrogen, 68Gallium, and H215O.
PET imaging of ventilation and perfusion: PET to measure ventilation
68Gallium is a positron emitter that can be used to measure both ventilation and perfusion (13, 23, 40, 48, 186). The half-life is 68 min and like 99mTechnecium it can be attached to aerosolized particles to measure ventilation. In fact, the same generator used to create Technegas can also be used to create an aerosol of graphite particles with 68Gallium, called Galligas®, although the amount of lead shielding in the generator must be increased to shield from the higher energy photon. The same physiological issues related toparticle deposition discussed above will obviously affect the deposition of the tracer. Since the half-life of 68Gallium is shorter than 99mTechnecium, images can be obtained under different conditions on the same day, which is difficult with 99mTechnecium where acquisition is typically 48 h (or more) apart. The increased sensitivity of the PET detectors over SPECT means that a lower dose of radioactivity can be used (23) (Table 4).
13N-Nitrogen can also be used to measure regional ventilation and the low solubility for nitrogen in blood means that it lends itself to combined imaging (224) as discussed below. To measure ventilation, 13N-Nitrogen can be inhaled continuously until steady state is reached and then the washout of the tracer can be imaged (169). Regions of the lung with high specific ventilation will washout the tracer more quickly and consequently the signal intensity will fall more rapidly. Unless respiratory gating is implemented, the regions of the lung closer to the diaphragm and anterior chest wall may show apparently high specific ventilation that is actually caused by the effects of partial volume on the signal intensity in these peripheral voxels. Alternately, ventilation can also be computed following a bolus injection (310)—as discussed below.
PET to measure perfusion
One isotope used to measure perfusion with PET is 68Gallium labeled macroaggregated albumin. As for SPECT imaging, using macroaggregated albumin, the labeled tracer is injected intravenously, and the labeled particles lodge in the pulmonary circulation in proportion to regional blood flow. Alternately, tracer kinetics can be used to measure regional perfusion using H215O (218, 292). The compound is infused intravenously over a period of about a minute. This is done during a breath-hold to allow a time-activity curve to be constructed as the bolus traverses the lungs (218). This bolus is modeled as distributing freely between both intravascular and extravascular compartments before exiting the circulation. The concentration of the tracer exiting the lung is equal to the tissue concentration divided by the tissue-blood equilibrium partition coefficient for H215O. The input concentration into the pulmonary circulation is measured by measuring the activity in a region of interest in the right heart. This is used to calculate the regional blood flow (183, 184) using the Kety model (see Ref. 218 for details). Validation of H215O-PET against 68Gallium-macroaggregates of albumin (218, 292) has shown good agreement.
Tracer Kinetics to measure regional ratio
The tracers used, particularly 13N-Nitrogen, mean that PET lends itself to the combined imaging of ventilation and perfusion. This is because of the low solubility of nitrogen in water and blood (λ ~0.02). The earlier techniques (44, 264–266) that relied on the continuous infusion of 13N-Nitrogen dissolved in saline and analysis based on Eq. (49) can be applied to measure the elimination of nitrogen with PET, and thus solved for regional ratio.
More recently, a different administration of 13N-Nitrogen and analysis of tracer kinetics has been applied (Figure 13). To acquire perfusion a bolus of 13N-Nitrogen (radioactive half-life ~10 min) dissolved in saline is injected intravenously. The homogenous mixing of the tracer in the blood entering the pulmonary circulation results in its delivery to lung regions in proportion to regional blood flow. The tracer has low solubility in blood and so it quickly evolves into the alveolar space. If imaged during a breath-hold and during the first pass of the tracer through the lung, the local concentration reflects local perfusion (223, 224, 266, 317, 318). Following resumption of breathing the nitrogen that has evolved into the alveolar space is cleared proportionally to the regional specific ventilation: Regions with high specific ventilation will clear tracer rapidly whereas regions of low specific ventilation will be slow to clear the tracer. The kinetics of the clearance has been modeled as a two (317) or three-compartment kinetic model [(Figure 13) see Ref. 96 for details] for quantification of specific ventilation and ventilation/perfusion ratios. Essentially the tracer kinetics in a voxel is modeled as either as a single compartment where behavior within the voxel is uniform, a double compartment (where there is heterogeneity within a voxel) (317) or as a compartment where the tracer was cleared by shunted blood (96). This technique, when applied to estimates of ventilation-perfusion distributions, has shown good ability to predict arterial blood gases compared to the measured values (317). Example images from an animal study (sheep) in a normal animal and after pulmonary embolism, saline lung lavage, and bronchoconstriction are shown in Figure 14.
Figure 13.

13N-Nitrogen tracer kinetics. (A) Washout of 13N-Nitrogen plotted on a log scale showing activity versus time in a voxel exhibiting uniform behavior modeled and as a single compartment. The compound is injected during an apnea, and the tracer is delivered to the alveolus in proportion to regional blood flow thus the plateau in activity at the time of the first appearance, is proportional to regional perfusion in the voxel. Then, as the subject begins breathing, the tracer in the alveolus will washout proportional to regional specific ventilation and the slope of the washout is equal to . The area under the curve (light blue) is proportional to the ratio of perfusion/specific ventilation . (B) Washout of 13N-Nitrogen plotted on a log scale showing activity versus time in a voxel exhibiting two-compartment behavior, with compartment one having high specific ventilation (rapidly clearing) and compartment 2 having low specific ventilation. During washout, compartment 1 clears tracer rapidly and the initial slope (slope 1) of the activity versus time plot is quite steep. The total blood flow in the voxel is again reflected in the plateau but is apportioned between the two compartments based on the back extrapolated point to the onset of the second compartment washout. The is distributed for compartment 1 as shown in light blue and for compartment 2 as shown in gray. Adapted, with permission, from Vidal Melo MF, et al. 2003 (317).
Figure 14.

Example axial images from a 13 N Nitrogen PET animal study (sheep) in a normal animal and in one representative animal after each of pulmonary embolism, saline lung lavage, and bronchoconstriction. Slices in each condition are arranged from apical to basal. The animals are prone in all except the lung lavage condition. In the first column, regional perfusion images are shown representing activity during the apnea portion of the data collection for each condition. Regions of reduced perfusion (dark areas) are seen in the pulmonary embolism and lung lavage conditions. The second column shows images obtained at the end of the washout lung images. Note higher tracer activity in the lung lavage and bronchoconstriction conditions. The third column shows the time-activity plots for each condition. The peak occurring early, followed by a plateau indicates the presence of significant intrapulmonary shunt in the lung lavage condition. Reprinted, with permission, from Vidal Melo MF, et al. 2003 (317).
Advantages and disadvantages
There are several advantages of PET: PET has improved resolution and shortened imaging time compared to SPECT (30). Another advantage of 13N-Nitrogen-PET is that radiation exposure is reduced compared to 99mTechnecium-MAA-SPECT or dual-isotope imaging both because of a shorter physical half-life and because of the very rapid elimination in expired air of some tracers such as of 13N-Nitrogen. A move to PET-CT scanners allows correction for lung motion during breathing and for attenuation factors (48). Like SPECT, blood flow is measured as per unit lung volume, however, while regional ventilation is typically measured as regional specific ventilation (i.e. per alveolar volume). These can be corrected for by assessing local alveolar gas volume. Since infused-saline 13N-Nitrogen PET relies on the delivery of the tracer via the pulmonary circulation, ventilated lung distal to a vascular obstruction (such as a pulmonary embolus) will not be imaged. Inhaled 13N-Nitrogen PET should be used for direct quantification of ventilation in such cases (213). As for SPECT, partial volume effects can affect quantification and it should be noted that the entire thorax is not contained in the field of view and thus the whole lung is not imaged. Like SPECT when tracer kinetics are used to evaluate the elimination of 13N-Nitrogen for measurement of regional ratio, ventilation to regions distal to a vascular obstruction will not be measured. Data are typically reported without correction for lung tissue gradients, although it is possible to correct for regional lung density with PET-CT scanners. Unlike MRI, PET tracers involve radiation, which limits the number of evaluations and also the study population. PET is also relatively expensive especially compared to SPECT, CT scanning, or gas exchange techniques.
Magnetic resonance imaging
Magnetic resonance imaging uses a combination of a static magnetic field, magnetic field gradients, and radiofrequency (RF) pulses to create signal that can be imaged (see Ref. 47 for a summary). Some nuclei such as 1Hydrogen, or 3Helium, have an intrinsic component of angular momentum known as spin, which creates a magnetic moment. When placed in a strong magnetic field, these nuclei show a net alignment of their magnetic moments, termed M0, along the axis of the superimposed magnetic moment of the static magnetic field (B0). When a RF pulse is then applied, this temporarily disturbs the magnetic moment of nuclei, tipping them away from B0 (Figure 15). Such pulses are described in terms of their flip angle (α) such as a 90∘ pulse which tips the magnetic moment of nuclei entirely into a plane perpendicular to the direction of the static magnetic field, the transverse plane. Once tipped, the nuclei’s magnetic moment, precesses, or rotates, about the axis of the static magnetic field, like a spinning top producing a free induction decay signal (FID). Changes in the alignment of magnetization in the traverse direction change the local magnetic flux, and using a receiver coil, this creates the imaged signal.
Figure 15.

The basic magnetic resonance experiment. (A) In the presence of a strong magnetic field (B0) protons show a net alignment of their magnetic moments (M0) along the axis of B0, with the magnitude of M0 proportional to the local proton density. (B) With a radiofrequency (RF) excitation pulse, the protons are tipped out of their alignment in a plane perpendicular to the static magnetic field, with the flip angle (α) describing the extent to which the net magnetization is tipped relative to B0. (C) This new alignment of the protons has a longitudinal component (ML) and a transverse component (MT), in red. The precession of the transverse component along the axis of B0 creates a signal which can be detected. (D) Immediately after the excitation pulse, protons gradually relax to their equilibrium alignment (M0) and the transverse magnetization decays, and the longitudinal magnetization is recovered with two separate time constants: T1 is the time constant for recovery of longitudinal magnetization and T2, the time constant for the decay of transverse magnetization. Adapted, with permission, from Buxton RB. 2009 (47).
After the RF pulse is applied, two simultaneous processes occur with the magnetic moment: (i) the longitudinal component of the magnetization relaxes back to its equilibrium alignment along the direction of the magnetic field, and (ii) the transverse component of the magnetization loses coherences and fans out. These two processes are mathematically represented by two exponential time constants, T1 which describes the recovery of longitudinal magnetization and T2, the time constant for the loss of coherence of the transverse magnetization. Other magnetic fields are superimposed over the static magnetic field and these gradient fields are constructed to vary in a linear fashion over space. Unlike nuclear magnetic resonance (NMR) spectroscopy, MRI uses gradient magnetic fields to measure and create images of the spatial distribution of nuclei with a specific resonance (e.g. density), such as 1Hydrogen and 3Helium (47) where the local intensity in the image is altered by the regional decay rate of the transverse (T2) and longitudinal (T1) magnetization. In fact, the traverse magnetization decays from interactions at the atomic or molecular level and because of inhomogeneity in either the extrinsic magnetic field, the applied gradient fields that allow the signal to be located spatially or because of local inhomogeneities arising from tissue interactions. This has the effect that the observed T2 is less than expected from atomic/molecular interactions and is called or the apparent T2 (47).
There are three widely used pulse sequences: gradient echo, spin echo, and inversion recovery sequences. For gradient echo sequences, the magnitude of the magnetic resonance signal decreases according to effects immediately after a RF pulse with the individual magnetic moment of nuclei become out of phase with one another and are no longer creating a coherent signal. The dependence means that the signal decays very rapidly (especially in the lung), and local magnetic field inhomogeneity increases the apparent rate of decay. One approach to deal with rapid dephasing is to add additional RF pulses to create an “echo” of the first pulse and reverse the phasing effects, such that the signal decay is due to T2 effects only. This is known as a spin echo pulse sequence if the additional radio frequency pulses are 180∘. The third type of common pulse sequence is an inversion recovery sequence. This sequence uses a 180∘ pulse to invert magnetization in the opposite direction to B0. Following this inversion, the longitudinal magnetization recovers toward its equilibrium state at a rate determined by T1. After a delay termed the inversion time, TI, a 90∘ pulse, is applied to tip the magnetization into the traverse plane, where it can be imaged with either a spin echo or gradient echo sequence. Different delay times can be exploited to enhance certain image characteristics as described below in the section on imaging perfusion (47).
The lung is inherently difficult to image with MRI. Acquisitions tend to be long, and they often cannot be completed within a breath-hold. In the lung, the is extremely short, largely because of inhomogeneity created in the local magnetic field created by air/fluid interfaces (the lung is mostly air-fluid interfaces!). Conventional structural MRI largely images protons, specifically protons in hydrogen atoms of water molecules, and has been developed for solid organs with a high water content. These imaging sequences fall short for imaging lung function and structure due to the short and the low water content. However, specialized MRI sequences (38, 134, 283) and/or the use of inhaled hyperpolarized gas and injected contrast agents can overcome these issues.
Receiver coils placed over the torso may improve the signal-to-noise characteristics of the image. However, when torso coils are used for image acquisition, if the absolute signal (as opposed to a local change in signal intensity) is used for quantification this introduces error that must be accounted for: portions of the tissue that are closer to the coil elements will return greater signal than tissue that is further away. This has the effect that the SNR ratio in an image will have heterogeneity due to coil size and placement imparting an error to quantification. One approach to correction [see Henderson et al. (134) for details] assumes that the image obtained from the body coil built into the scanner is uniform. This is exploited by obtaining paired gradient echo images one with the torso coil and one with body coil, to create a coil sensitivity function, which is essentially constant across all measurements for a given subject, by dividing the pairs of smoothed images. Images acquired with the torso coil that rely on absolute signal intensity for quantification such as those from arterial spin labeling (ASL) (see below) are then corrected by multiplying by the sensitivity profile on a voxel-by-voxel basis (134). To obtain quantitative data, manufacturing reconstruction algorithms that are often automatically implemented to improve subjective image quality must be disabled, as they will affect the results.
Ventilation
Specific ventilation imaging (SVI) using O2-enhanced imaging
Oxygen-enhanced ventilation imaging has been used qualitatively for some time (20, 66, 168, 202, 227, 231, 246, 346). When a hyperoxic gas mixture is breathed, oxygen is delivered to and then dissolved in the airway and alveolar walls. As the oxygen contacts the lung tissue this shortens the longitudinal relaxation time, T1 (203, 205, 208, 209). This has the effect of increasing the local MRI signal when measured with an appropriately timed inversion recovery pulse sequence. More recently, the change in signal intensity in response to oxygen breathing has been exploited to measure the washin of oxygen by acquiring breath-by-breath T1-weighted images while the subject alternately breathes air and 100% O2 in a block design. After each switch of inspired O2, as time goes on, each lung unit will move toward a new equilibrium with the new inspired pO2 level, air of 100% oxygen as the case may be. The rate at which this happens depends on the volume of fresh gas delivered to the unit divided by the volume of gas in the unit at the end of the tidal breath (functional residual capacity), i.e. the specific ventilation. Voxels with high specific ventilation reach the new equilibrium faster than units that are less ventilated (Figure 16). Thus, measurement of this equilibration time as measured by the change in the MR signal provides a measurement of specific ventilation for each voxel. In essence, this is a spatially resolved multiple breath washout study (314), where the imaged signal is the washin and washout of oxygen rather than the washout of nitrogen.
Figure 16.

The basis of the specific ventilation imaging experiment. Top: Schematic depiction of specific ventilation of two lung units. The unit on the right has a large change in volume, ΔV, during inspiration compared to V0, the end-expiratory (local FRC) volume of the unit, and thus a high specific ventilation, SV, defined as the ratio ΔV/V0. The unit on the right has a relatively low specific ventilation. Bottom: Since the change in volume is large relative to the resting volume in the high specific ventilation unit the initial concentration of oxygen C0, at end expiration rises rapidly when the subject breathes 100% oxygen. The high specific ventilation unit equilibrates faster (continuous line, SV = 0.8) than the lower specific ventilation unit (dashed line, SV = 0.2). Reused, with permission, from Sa RC, et al. 2010 (283).
Images are acquired using inversion recovery single-shot fast spin echo sequence (282, 283). For a single slice image, the image is acquired after an inversion pulse with a delay time (1100 ms) selected to produce a maximal signal difference between air and O2 breaths (50). Multiple slice imaging, covering most of one lung field, has been implemented where the preparation time (TI) is unique for each slice in the acquisition. Geier et al. (100) have shown that with 4 imaging slices acquired at TI = 1100, 1335, 1570, and 1805 ms, there is adequate air/oxygen contrast allowing the washin characteristics to be determined across each slice. In theory, up to nine 2D-slices can be acquired, each slice acquired with an inversion time (TI) within the range that provides adequate air-oxygen contrast, covering most of the lung. However, in practical terms, SAR (the specific absorption rate, an index of the RF power delivered to tissue) considerations combined with the actual contrast to noise, limits acquisition to 3 to 4 slices. Images are obtained at end-expiration (FRC) in blocks of 20 while breathing air and then 20 while breathing 100% O2 alternating for 5 cycles. An example of the change in signal intensity in a single voxel is shown in Figure 17.
Figure 17.

Time series of signal intensity for a single voxel during a specific ventilation experiment. When the subject changes from breathing air to oxygen, the T1 is shortened and the signal intensity increases. The dashed line change indicates the change in FIO2, termed the driving function. Units with higher specific ventilation equilibrate faster; thus, signal intensity more closely follows the driving function than for units with lower specific ventilation. The time required for the signal to reach a new equilibrium is the rise time and is measured as the time delay which maximizes the correlation of the time course of the signal from each voxel with the driving function (after accounting for delay in delivering the new FIO2 to the mouth. The correlation delay for each voxel is converted to specific ventilation based on modeling voxels of differing specific ventilation. Reused, with permission, from Sa RC, et al. 2010 (283).
The data analysis is described in detail in Ref. 282. Briefly, the breath-by-breath signal intensity of 50 ideal lung units with specific ventilation between 0.05 and 10, equally spaced in log space is simulated for the “driving function,” that is the square wave block design representing the changes in inspired O2. Regional specific ventilation is determined voxel-by-voxel by correlating the time course of the MR measured regional signal intensity with the 50 simulated responses, with maximal correlation determining the specific ventilation of the voxel. This modeling approach to generating a “lookup” table of SV assumes that the gas concentrations within the voxel are uniform at the end of each breath (each voxel is composed of a ventilatory unit) and that gas-phase oxygen is in equilibrium with blood and tissues at each time point. These assumptions are supported by modeling (see Ref. 282 for explanation). Regions that correlate perfectly with the driving function with no time delay represent conducting airways and are eliminated from the analysis. Similarly, regions that do not correlate represent noise and are excluded from further analysis.
Specific ventilation imaging (SVI) requires a subject to maintain a breathing rate (typically 12 breaths/min), which can be adjusted on an individual basis, to match the subject’s supine resting respiratory rate. Studies using multiple breath washout that have shown that changes in tidal volume result in a linear shift in the specific ventilation distribution, with different portions of the lung increasing their specific ventilation in the same proportion (57, 59) and a lateral shift of the specific ventilation histogram. Imposed breathing frequency from 10 to 60 breaths/min has not been shown to affect the measured distribution of specific ventilation (41), aside from this shift, and validation work (below) suggests it is not a major factor. The technique has shown excellent reproducibility (282) and has been validated against multiple breath washout (196), with good agreement for measures for heterogeneity between the two techniques; a spatial validation against multi-breath hyperpolarized helium MRI (see below) showed good group agreement, despite higher than expected inter-individual variability (18). In addition, preliminary studies of inhaled aerosolized microspheres in an animal model also show good agreement with SVI (307) on a relatively large spatial scale (isogravitational plane).
Noble gas ventilation imaging
Ventilation imaging can be conducted with the noble gases, 129Xenon and 3Helium which are nonradioactive isotopes of Xenon and Helium. 3Helium is naturally occurring in small concentrations and occurs as a byproduct of nuclear weapons testing. Unfortunately, while 2Helium is abundant it does not have a magnetic moment and is not observable with MRI. 3He has a high intrinsic magnetic moment but is in limited supply. 129Xenon is much more abundant and is one of the eight naturally occurring isotopes of Xenon. In order to generate a signal visible on MRI, these inert gases need to be actively hyperpolarized. Hyperpolarization refers to a process whereby the nuclear spins of the gas atoms are brought into alignment. As discussed in the introduction to this section with conventional proton MRI the hydrogen atoms have a preferential alignment brought about by the magnetic field, where the aligned nuclei are in a concentration of about 1:1,000,000. Hyperpolarization brings the gas atoms into alignment in a small magnetic field outside of the MRI scanner. A nucleus that is aligned differs from one that is not by a single quantum unit of angular momentum, which is the amount carried in a photon. Alkali metal, such as Rubidium, is used as an intermediary, because when subjected to resonant and circularly polarized laser light, the outer electron shell becomes polarized. As these polarized atoms collide with 3Helium or 129Xenon, the polarization is transferred to the 3Helium or 129Xenon nuclei (127, 128, 178, 195, 326). It is also possible to impart polarization without the use of the alkali metal intermediate (see Ref. 55), but this can only be done with 3Helium. Hyperpolarization results in a net polarization of more than 100,000 times the polarization of hydrogen nuclei in a 1.5 T magnetic field. Thus, even though the concentration in a gas is relatively low, it gives a large MRI signal when appropriately imaged. This was demonstrated by Albert et al. (5) in the mouse using 129Xenon to image ventilation and in human lungs by MacFall et al. (199) using 3Helium. 3Helium has the advantage of a higher net polarization and remaining stable for long periods of time. Helium has a long history of use in studying pulmonary function in humans. The very low solubility [λ = 0.0085, (328)] means that if it is used as a marker of ventilation it remains exclusively in the airspaces. The limited abundance of 3Helium means that it is not widely available and is expensive. 129Xenon has the advantage that it can be polarized more quickly. Its intermediate solubility (λ ~0.5) means that it is absorbed into the blood and has anesthetic properties in high concentrations; however, in solution it can be used as a marker of perfusion (68, 69, 211). 129Xenon has the additional property that when inhaled, as it dissolves in lung tissue, the MR properties change such that gas-phase hyperpolarized 129Xenon can be distinguished from the dissolved phase. This allows the evaluation of regional gas diffusion and alveolar-capillary gas uptake (180).
There are hardware modifications required to conventional clinical MRI scanners in order to conduct hyperpolarized gas imaging because of the difference in resonant frequency for these nuclei compared to conventional proton (1Hydrogen) MRI. For this reason, broadband capabilities are required for multinuclear imaging as well as nucleus-specific chest RF coils. Inversion recovery pulse sequences act to deplete the polarization and this combined with T1 recovery reduces the signal and thus fast gradient echo sequences with short echo times are used. These imaging sequences for hyperpolarized gas MRI are very fast and often acquire data from the entire lung within a single breath-hold.
Analogous to PET and SPECT of inhaled gases, the amount of polarization and concentration of the gas in a local lung unit determines the signal intensity at the time of imaging. Fractional ventilation (r) is defined as:
| (50) |
where is the ratio of fresh gas delivery to the resident volume. This differs from specific ventilation because here the delivery of fresh gas divided by the resident gas at the end of inspiration. The images are acquired at end inspiration to maximize the amount of hyperpolarized gas in the lungs. An example image quantifying regional fractional ventilation is shown in Figure 18.
Figure 18.
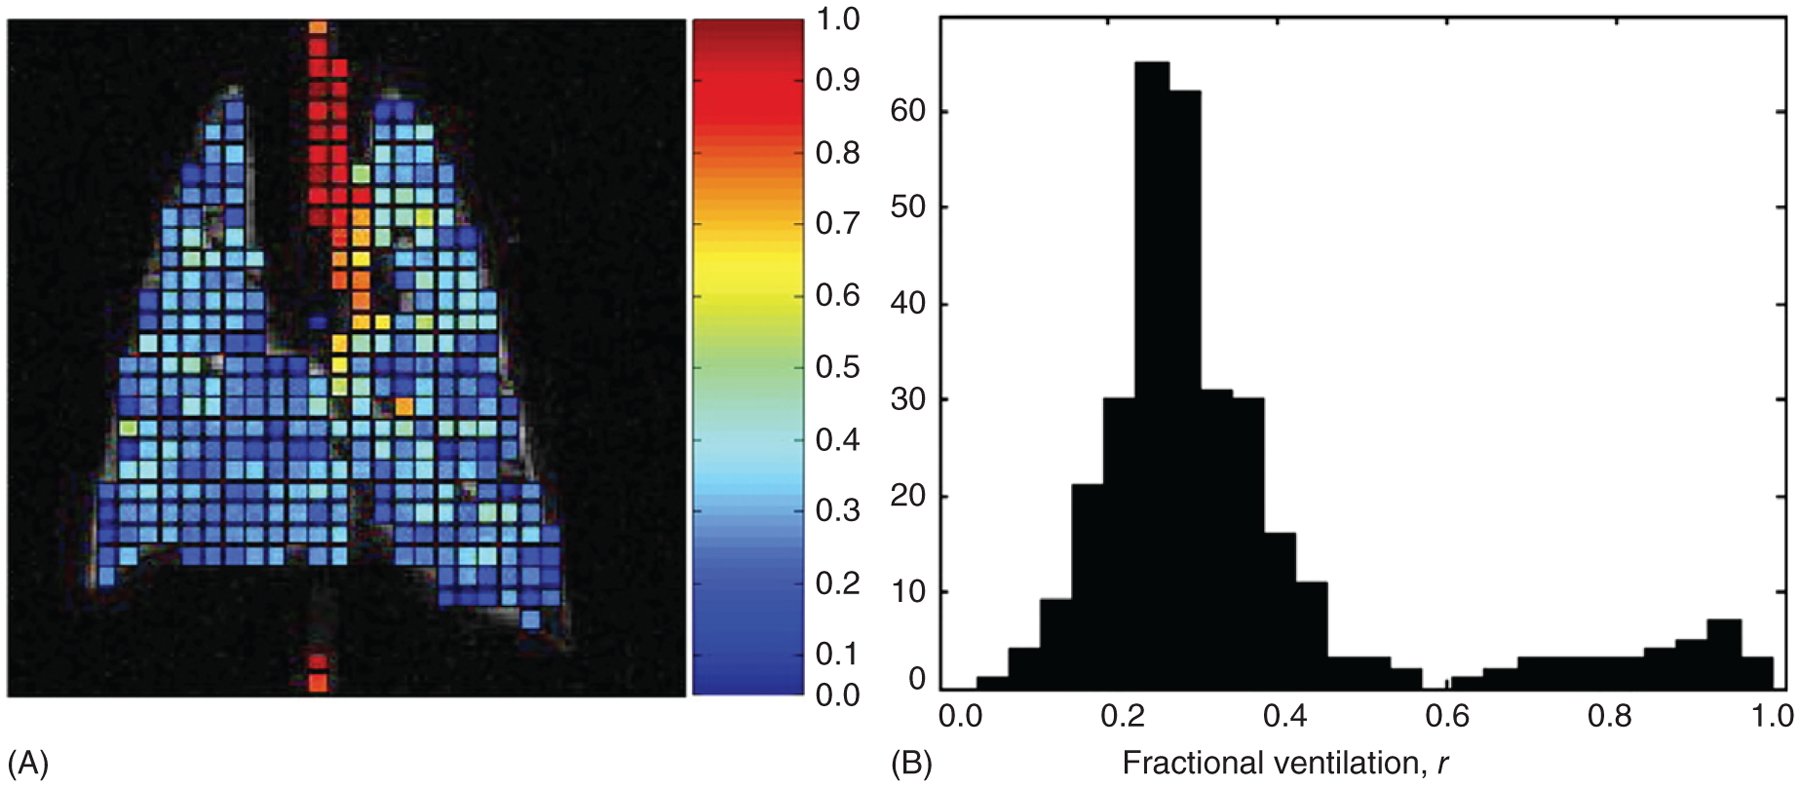
Regional measurement of fractional ventilation measured with MRI using hyperpolarized 3Helium in a coronal slice of a healthy rat lung. Fractional ventilation, r, represents the delivery of fresh gas divided by the resident gas at the end of inspiration (specific ventilation is the delivery of fresh gas divided by resident gas at end expiration). (A) Quantified image. The trachea and large conducting airways can be seen as regions of high r. (B) Histogram of the resultant r values, showing a bimodal distribution showing a main mode of normal lung parenchyma on the left and a second high r mode representing trachea and conducting airways on the right. Reused, with permission, from Hopkins SR, et al. 2007 (156).
Early work demonstrated the feasibility of hyperpolarized ventilation imaging using hyperpolarized 129Xenon in excised mouse lungs (5). Deninger et al. (65) used multiple breaths of hyperpolarized 3Helium (121) to assess regional specific ventilation in guinea pig, but the imaging time was relatively long. The approach was refined to shorten the imaging time and use less gas and was demonstrated to be feasible in humans (75, 123). Like SVI imaging, discussed above, when breathing hyperpolarized gas, the imaged signal in well-ventilated lung rises more quickly than poorly ventilated lung and with appropriate corrections for signal loss due to loss of polarization from both RF effects and from an interaction with oxygen (more about this below), fractional ventilation can be calculated. There is also a great deal of clinical work using a single breath of hyperpolarized gas to identify regions of low/absent signal, commonly termed “ventilation defects” (62, 179, 313). This is a misnomer because single breath techniques typically do not measure ventilation per se but rather a single breath proxy for fractional ventilation. These regions may not truly represent areas of absent ventilation but rather may be regions that merely equilibrate more slowly. In addition, some of the inhaled gas will remain in the conducting airways, and this will contribute to the regional signal even though it does not represent ventilation. Finally, because the coil used for image acquisition is both a transmit and receive coil, magnetic field and flip angle nonuniformity introduces a heterogeneity in signal intensity not reflective of local physiology, affecting quantification (217).
Inert fluorinated gas imaging of ventilation
The use of perfluorinated molecules in MRI has been reviewed in Ref. 281. Sulfur hexafluoride (SF6) and other perfluorinated gases such as hexafluorethane (C2F6) have also been used to measure ventilation, with the advantage that they are less expensive than hyperpolarized noble gases. Perfluorination refers to the replacement of all hydrogens on a molecule with fluorine. This renders these gases insoluble (SF6 λ ~0.008, C2F6 λ = 0.001) and inert. 19Fluorine is a naturally occurring element and resonates with a frequency that is close to protons. When imaged with an appropriately tuned transmit receive coil, the signal acquired is approximately 90% that of proton imaging for a single excitation (192). In addition, signal averaging can occur very rapidly because the time constant for remagnetization is very short for these gases (192), and thus good SNR can be achieved. Multiple fluorine atoms per molecule increases signal but may come at a cost: low molecular weight hydrogen (molecular weight 1 g/mol) is replaced by higher molecular weight fluorine (19 g/mol), and this effect has the potential to affect the ventilation distribution, although the magnitude of this is unknown and may be small. There is evidence from MIGET studies (148, 153, 161) that high molecular weight gases are preferentially retained compared to low molecular weight gases, suggesting gas-phase diffusion limitation (not to be confused with diffusion limitation of gas transport across the alveolar wall). Issues related to differing molecular weight gases may also affect ventilation imaging where Helium and Xenon are used, as these elements are higher and lower molecular weight than air, respectively, and Helium washes in further than Xenon in a single breath (253, 314).
Both single breath and multiple breath washin and washout protocols have been used for lung imaging in both human and animal subjects (3, 56, 191, 236, 290, 291, 343). Zero and ultra-short echo time (referring to the fact that the image acquisition starts either before or a few seconds after the imaging gradients are applied) sequences (190) have been used because of the short T2 of inert fluorinated gases. In the case of protocols that rely on the absolute signal to quantify ventilation, error may be introduced depending on the type of acquisition unless the image is corrected for heterogeneity introduced by proximity to coil elements.
Perfusion
Dynamic contrast-enhanced imaging
Gadolinium is an injectable contrast agent that provides a means to measure pulmonary blood flow. Gadolinium is paramagnetic, which means that it enhances the T1 relaxation rates, making gadolinium useful for MRI. Although free gadolinium in the ionic form is toxic because of the interactions with calcium channels, MRI contrast is chelated and frequently used in magnetic resonance angiography (MRA). Imaging perfusion with injected contrast is relatively simple: A power injector is used to intravenously inject a bolus of contrast agent and dynamic imaging is conducted before, during, and after to visualize the passage of the contrast bolus. As the bolus is distributed throughout the pulmonary circulation there is an initial short delay as the contrast reaches the right ventricle and enters the circulation, followed by a rapid increase in signal intensity (observed on a voxel-by-voxel basis) before a slower decline in signal intensity (Figure 19). Indicator dilution techniques can then be applied to calculate regional blood flow by fitting a gamma-variate function (308) to the regional change in signal intensity as
| (51) |
where Ctissue(t) is the intensity over time distribution, k is a scaling constant, AT is appearance time, and α and β are shape parameters. It should be noted, however, that at high concentrations, signal intensity is not linearly related to the concentration of contrast material for gadolinium-based contrast agents, so this needs to be taken into account (171). Regional blood volume is calculated as the area under the curve, mean transit time (MTT) is calculated as the time to peak signal intensity and from these two values, regional blood flow is calculated (308, 339) by the central volume principle which relates flow, volume and transit time as (299):
| (52) |
Figure 19.

Signal intensity in a normal volunteer within a region of interest in lung parenchyma following bolus injection of contrast during dynamic contrast-enhanced MR imaging of pulmonary perfusion. After a transit delay, a sharp rise in signal intensity is followed by rapid washout. The late peak reflects recirculation of indicators into the region of interest. After gamma-variate fitting, the first moment of the curve represents mean transit time, and area under the curve represents blood volume of the region of interest. Reused, with permission, from Hopkins SR, et al. 2007 (156).
There are several advantages of this technique. The use of Gadolinium contrast is well established in clinical MRI and thus it is straightforward to implement. The contrast material enhances SNR and consequently, spatial resolution may be better than other techniques to measure perfusion such as ASL. The disadvantages include a limit on the number of measures that can be made because of the need to clear the contrast bolus and the amount of contrast that may be given in a 24-h period (42, 74, 294). For this reason, the ability to evaluate changes in physiology as a result of an intervention (posture, altered FIO2, etc.) is limited. In addition, there are issues related to quantification: while blood volume is directly calculated from the area under the regional signal time-intensity curve, regional blood flow, and MTT may be subject to substantial error. This is because these calculations are based on the central volume principle relating local blood volume, blood flow, and MTT through a vascular bed with a defined input and output function. Here, the first moment of the output curve is used as the MTT, but with imaging, the curve is obtained from the individual voxel (330) and may lead to error. However, validation studies suggest that this limitation may be small (131). In addition, although large vessels may be segmented out, smaller arterioles and venules are included in the image and will be included although they do not represent perfusion per se.
Arterial spin labeling
ASL makes use of an inversion recovery pulse sequence to measure perfusion by manipulating signal intensity in a spatially selective way in a pair of images, and these are subtracted to give a measure of perfusion. The specific sequence described here is known as an ASL-FAIRER (flow-sensitive alternating inversion recovery with an extra radiofrequency pulse) sequence (204, 206, 207). Blood flow in the lung is pulsatile so the sequence is EKG-gated and the pair of images are taken approximately 5 s apart during a brief pause in breathing. The two images differ only in the way that the RF pulses are applied: The first (selective inversion or control) image acquisition begins with a 180∘ inversion pulse applied in diastole to a preselected slice of lung. After waiting for a complete systolic ejection of blood the image of the selected slice is acquired. After a brief pause to allow complete relaxation of spins back to the baseline state, the second image (nonselective inversion or tag) is acquired in an identical sequence with one important exception: the 180∘ inversion pulse is applied to the entire torso and not just to the preselected slice. Protons in arterial blood inside the slice that have seen the inversion pulse flow out of the slice during the time between the tag and the image acquisition. In the control image, they are replaced by protons from outside the slice that have not seen the 180∘ inversion pulse and enters the slice fully relaxed and thus make a strong signal when imaged. In the tag image, however, since the 180∘ inversion pulse was applied to the entire torso, the magnetization of arterial blood outside the slice is recovering from the inversion pulse. The timing of the experiment is such that these protons are near the null point of blood at the time the image is collected, and the signal is very low. In both of the images, the magnetization of the spins from stationary protons in the preselected slice at the time of the 180∘ pulse was applied have seen the identical inversion pulse and thus subtract out when the control and tag images are subtracted. Since the signal in the moving protons (i.e. in blood) differs between the two subtraction of the control and tag images yields a map of the amount of blood delivered to each voxel during the delay TI (38, 134, 150), see Figure 20.
Figure 20.

An example of arterial spin labeling (ASL) in a coronal slice of lung in a healthy human. The sequence used to acquire data is ASL-FAIRER (flow sensitive alternating inversion recovery). Two EKG gated images are acquired approximately 5 s apart. (A) A 180∘ selective inversion radiofrequency pulse is applied in diastole to the desired slice of lung. After waiting for a complete systolic ejection of blood the image is acquired, and protons from outside the slice that have not seen the 180∘ inversion pulse and enters the slice fully relaxed giving strong signal. (B) The nonselective inversion image is acquired after the 180∘ inversion pulse is applied to the entire torso and the magnetization of arterial blood outside the slice is recovering from the inversion pulse and the signal is very low. (C) The subtraction of the selective and nonselective inversion images yields a map of the amount of blood delivered to each voxel during the delay time between the inversion pulse and image acquisition, as stationary structures such as the spine, liver, etc. subtract out. Reprinted, with permission, from Hopkins SR and Levin DL. 2006 (155).
This ASL technique has been used to quantify perfusion in the lung under a variety of physiological conditions (19, 134, 152, 254, 306) is quantitative (38, 159) and has shown good reliability. It has been validated in a flow phantom (159). In order to quantify pulmonary blood flow with ASL, it is important to subtract out signal contributions from large vessels. This is because the signal contained in these vessels does not represent perfusion in the voxel where they are located, but rather reflects signal that is destined for a distant capillary bed. In addition, in order to quantify local ratio, these voxels must also be removed as a voxel contained entirely within a large vessel would incorrectly map as a region of shunt, that is, it would have no ventilation signal but a perfusion signal. In the lung, modeling studies (46) have shown that the pulmonary venous circulation is part of the imaged ASL signal, principally in the larger conduit vessels where it comprises up to 35% of the total signal in the larger vessels. Thus, it is possible that venous blood may contaminate the arterial “perfusion” signal, although the tagged blood in the small postcapillary vessels likely moves so slowly that it does not appear in the imaging plane.
Regional ratio, partial pressure of oxygen, and diffusion
Several of the above-listed techniques can be combined to measure regional ventilation-perfusion ratio. For example, hyperpolarized gas ventilation imaging can be combined with gadolinium contrast-enhanced perfusion to measure regional ratio provided associated measures of tissue density are acquired to convert regional fractional ventilation into alveolar ventilation (see below).
Another approach to measuring distributions with proton MRI requires the combination of three separate techniques described in detail in Ref. 135: SVI, ASL and a technique for measuring regional lung proton (tissue) density using a multiple gradient echo sequence. The measurement of density is required because regional measures of specific ventilation, the ratio of the delivery of fresh air to resident air, in a region must be converted to regional alveolar ventilation. One approach to measure this is a recently developed multi-echo fast gradient echo (mGRE) sequence. The sequence collects 12 images alternating between two echo times in a single 9-s breath-hold. The echo time refers to the time interval between the center of the RF pulse to the center of the echo (the echo is the point at which the phase errors in the precessing protons caused by the gradients is zero). Six images (even images: 2, 4, 6, 8, 10, 12) are acquired with an echo time of 1.1 ms and six images (odd images: 1, 3, 5, 7, 9, 11) are acquired at an echo time of 1.8 ms. Proton density is determined by back extrapolating the signal to an echo time of zero by fitting data to a single exponential. Well-characterized phantoms are used in the image field to provide an absolute reference standard. The details of this technique are described in Ref. 306, and reliability and validity studies reported (145).
The voxel is considered as a binary compartment of air and nonair components. The proton density measures are assumed to represent the “nonair” fraction of a lung region. Some of the lung tissue that is part of the nonair compartment is not proton containing, and thus will not give a signal on the proton density scan. This is nevertheless a good approximation because these elements are approximately 10% of the density (135) which is itself a relatively small number (typically <0.3 g/mL at FRC) and thus the error in estimating the larger air compartment is small. The volume fraction of air in a voxel is then (1-density) and when multiplied by the local specific ventilation (SV) this gives the volume of fresh gas/breath. Respiratory frequency and the volume are then used to give alveolar ventilation:
| (53) |
Voxel volume is then used to give ventilation in units of ml (fresh gas)/cm3/min. ratio in a voxel is calculated by dividing the image by the quantitative ASL . Example images in prone and supine posture from a healthy normal subject are given in Figure 21. Details are given in Ref. 135 and this combined technique has been validated against MIGET with good results (284). The technique is time consuming, requires considerable co-operation on the part of the subject and at present evaluates a limited portion of the lung because of time constraints.
Figure 21.

Example images of density (A), alveolar ventilation (B), perfusion (C), and ventilation-perfusion ratio (D) in a sagittal slice of the right lung in a normal subject in the supine posture. Images are also shown for the prone posture (E–H, respectively). Images representing regional specific ventilation (not shown) are combined with proton density to get regional alveolar ventilation. Voxels contained within larger, conduit, blood vessels, and voxels that correlate perfectly with the driving function in specific ventilation (representing large airways) are removed as they are not part of gas exchange and are seen as dark tubular structures in the three right-hand columns of images. The resultant ventilation image is combined with the perfusion image to give an image of regional ventilation-perfusion ratio. Note the gravitational gradients in all images. Reused, with permission, from Henderson AC, et al. 2013 (135).
Another method derived from hyperpolarized gas imaging relies on the fact that collisions with oxygen molecules cause the 3He spins to lose polarization. This is because the collisions cause dipolar coupling between the nuclear and molecular magnetic moments. This loss of polarization is directly proportional to the local oxygen concentration. Assuming steady state conditions where VO2 is constant, PAO2, and thus the signal from polarized 3Helium molecules changes linearly over time. Consequently, the local 3Helium signal (S) at time t can be expressed as:
| (54) |
where Γ is a proportionality constant that relates PO2 to the 3He relaxation rate.
Early work in a pig model (73), was extended to measure regional partial pressure of oxygen in by acquiring a series of back to back images (63, 64, 85) and evaluating the regional change in signal intensity with time. After accounting for signal loss from the RF pulses, regional PO2 can be estimated (124). MIGET uses measures of the distribution and then, in a compartment by compartment evaluation, estimates the distribution of arterial and alveolar PO2 leaving each of the 50 compartments. This approach can also be extended to the inverse problem to estimate regional ratio from the measured PO2, from the data obtained from 3Helium studies (272). Like MIGET this technique uses equations of mass balance for respiratory gases (O2, CO2, and N2) exchange to determine the local ratio (see Ref. 272 for details). However, for both the 3He MRI and SF6 technique (discussed below) the relationship between alveolar PO2 and local ratio is not linear over much of the physiological range and is insensitive at both high and low ratios, limiting utility. This is because, as seen previously in Figure 1, large changes in local ratio result in minimal changes in PO2 in these regions.
Inert fluorinated gas
If a subject breathes multiple breaths of a hyperoxic fluorinated gas mixture such as 25% sulfur hexafluoride (SF6) mixed with 75% oxygen, the gas mixture will be distributed to lung units in proportion to local alveolar ventilation. As the subject continues to breathe the gas mixture, the composition of the gas will remain stable in lung units where the ratio is high, because the SF6 is insoluble in blood and the gas mixture will be replenished, and thus relatively little oxygen is transferred into the small amount of blood perfusing the regions (191). However, in lung units that have a low ratio, the oxygen concentration will fall as oxygen is taken up into the relatively large amount of blood perfusing the region whereas the SF6 will remain behind in the alveolar space. This leads to an enhancement of SF6 signal in poorly ventilated lung. If a reference image is obtained with the subject breathing a mixture containing 21% oxygen and 79% SF6, then the regional ratio can be determined (see Figure 22) as described by Kuethe et al. (191).
Figure 22.
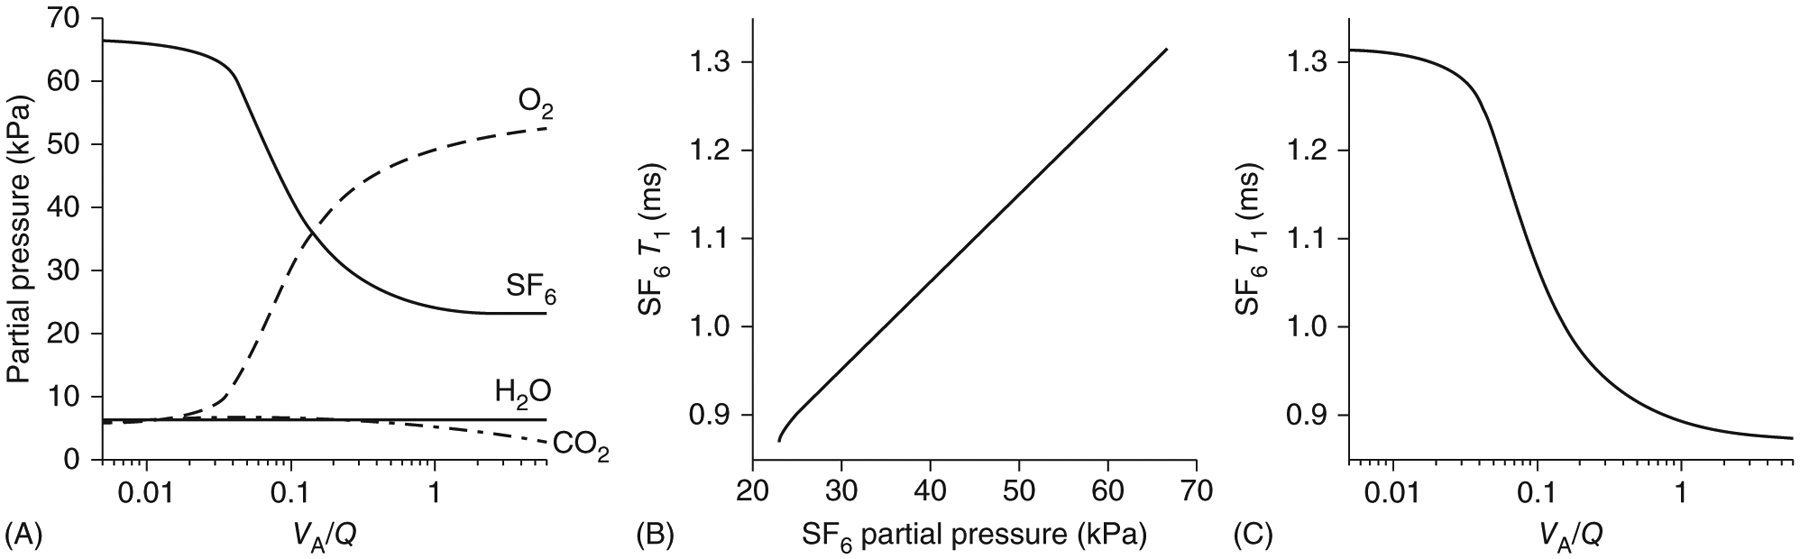
(A) The relationship between gas partial pressure and ratio for respiratory gases and Sulphur Hexafluoride (SF6) for a mammalian lung. The relationship between oxygen and carbon dioxide was also shown previously in Figure 1. In lung units where the ratio is high, since SF6 is insoluble in blood, comparatively little oxygen is transferred out of the alveolus and the SF6 concentration is stable. In lung units with low ratio, as the oxygen partial pressure falls the insoluble SF6 (λ ~0.005) remains behind in the alveolar space. (B) The relationship between SF6 partial pressure and T1. As the concentration of SF6 increases, T1 becomes longer. (C) The relationship between the T1 for SF6 and ratio. Data are for an inhaled gas mixture of 30% SF6/70% O2 and an ambient barometric pressure of 626 mmHg (Albuquerque, NM, elevation 1600 m). Reused, with permission, from Kuethe DO, et al. 1998 (190).
This technique has the advantage that the data collection can take place under steady state conditions (i.e. after several breaths of the gas mixture), and thus resolve poorly ventilated lung regions. In addition, the low solubility of inert fluorinated gases means that they will be retained in the alveolar space and thus, unlike Xenon, they do not have an anesthetic effect.
More recently, this technique has been modified to eliminate the reference image (3). In regions where SF6 is concentrated, the T1 will be shorter, because the SF6 molecules are more massive and therefore have a greater effect on one another rather than collisions with oxygen, carbon dioxide, and other respiratory gases, which are less likely to affect the rotation state of the SF6 molecules (192). Thus, when appropriately imaged the concentration of the SF6 can be recovered and regional ratio calculated. The technique is insensitive to regions of high ratio and thus does not give a complete picture of matching. However, it is the low regions that contribute to hypoxemia and this limitation may not be as important depending on the research question asked.
129Xenon measures of diffusion
As mentioned above, 129Xenon has an interesting property that lends itself to measures of transfer of gas across the alveolar wall. As the inhaled 129Xenon diffuses first from the alveoli, across the alveolar wall, and finally into the red blood cell, it undergoes a shift in resonance frequency. Relative to the gas-phase frequency it shifts by 198 ppm in the tissue plasma barrier and by 217 ppm in red blood cells. A technique called xenon gas transfer spectroscopy allows the imaging of these shifts in resonance frequency and thus transfer of gas across the alveolar wall can be imaged (180, 181).
Xenon is considered a perfusion limited gas in physiological terms. This means that transfer of Xenon across the alveolar wall is dictated by blood flow, and the ability of capillary blood to take up Xenon, rather than a resistance in the blood-gas barrier (diffusion limitation) because Xenon quickly saturates the alveolar wall. However, although the net flux of 129Xenon across the alveolar wall under saturated conditions is zero, the flux of magnetization across the alveolar wall is not. The RF pulses deplete the magnetization and transfer of fresh polarized gas occurs from the alveoli (180) thus providing a measure of diffusion. While some quantification of this metric and reliability and validity studies have been undertaken (182, 300), they are not yet fully realized and issues related to inhomogeneity of ventilation (affecting delivery of gas) and diffusion/perfusion ratio (affecting local diffusion) may affect the results. However, this technique has shown promise for measuring regional diffusional properties.
Advantages and disadvantages
There are some significant advantages to MRI imaging. The lack of ionizing radiation means that it is potentially suitable for a diverse subject population including a pediatric population that might not otherwise be studied and allows repeated studies. Techniques such as ASL, and oxygen-enhanced ventilation imaging or ventilation imaging with fluorinated gas or hyperpolarized gas are noninvasive. Many of the MRI techniques discussed are quantitative and some have undergone some degree of validation (145, 282, 284, 307). Disadvantages include the fact that MRI is expensive, access is more limited than for many other imaging modalities and image acquisition may take a long time. Gadolinium contrast has been linked to nephrogenic systemic fibrosis in patients with renal disease, and there is some concern about toxicity (see Refs 260, 278 for review) as gadolinium has been found in tissue years after MRI studies that were using it as a contrast agent. As mentioned earlier, in ventilation studies, the difference in molecular weight between Helium (lighter), fluorinated gas (heavier), xenon (heavier) and air has the potential to alter the underlying ventilation distribution. It has been suggested that breathing 100% oxygen in SVI (or indeed measures of shunt or Fowler dead space) may potentially alter the underlying relationships, but the available data suggests that this is not the case (149).
Computed tomography (CT)
A review of imaging ventilation and perfusion with computed tomography can be found in Refs 143, 198 and general information about CT scanning can be found in Refs 210, 247. x-rays are generated by the collision of high-speed electrons emitted from a cathode with a positively charged anode causing the release of energy. The applied voltage (peak Voltage in KiloVolts, kVp) of an x-ray machine determines the maximum energy of the x-ray spectrum spread over a range of frequencies. These x-ray photons are higher frequency radiation than those from ultraviolet light and carry sufficient energy that they are capable of penetrating tissue. As they traverse tissue, they are absorbed, and scattered with some traversing the tissue and then exiting. The extent of this is a function of both the density of the tissue and the wavelength of the photon (see Figure 23). The heart and blood vessels, particularly the great vessels, cause higher attenuation of x-ray photons at all wavelengths compared to lung parenchyma, which has a high fraction of air. When an x-ray beam is directed toward the lung parenchyma, a very high fraction of the high energy photons traverse the tissue without absorption and therefore provide no information regarding the tissue density or contrast. Lower energy photons, on the other hand, undergo sufficient attenuation to derive a contrast between tissue elements. A typical source voltage of 120 kVp is used in CT scanning of the chest, since the lung parenchyma has a lot of inherent contrast between air and tissue. This means that relatively low maximum energy x-rays can be used reducing radiation dosage (226, 351).
Figure 23.

Mass attenuation coefficient, as a function of energy for different materials. The mass attenuation coefficient is the fraction of a beam of photons that are absorbed per unit volume of the absorbing tissue or material (called the linear attenuation coefficient, μ), divided by density of the tissue, ρ. The sudden change in the iodine curve reflects the K-edge. the K-edge denotes the point at which the photon energy matches the binding energy of the K-shell electron of the atom. At the K-edge, there is a sudden increase in attenuation due to photoelectric absorption of the photons, thus changing the ability of the photon to penetrate iodine. Green Shading indicates CT energy range. Reprinted, with permission, Xia T, et al. 2014 (345).
The x-ray image (radiograph) is acquired when the exiting x-ray photons collide with a detector such as x-ray film, detectors composed of amorphous selenium or cadmium telluride, or scintillation detectors, which convert the energy from the photon into light and then a digital signal. The resulting “projection image” is a two-dimensional image where the intensity of the image reflects the extent of the transmission or absorption of the photons. Modern computed tomography (CT) builds on these basic principles to reconstruct a three-dimensional image by rotating both the x-ray tube, which emits a cone-shaped beam, and the detector array, about the central axis of the chest to acquire multiple projection images. The path of the beam is called a ray, and a collection of rays is called a view, with hundreds of views acquired during imaging. These are reconstructed into a three-dimensional image by determining how much attenuation of the x-ray beam from each ray occurs in each voxel. Modern helical or spiral CT moves the patient continuously through the scanner while images are acquired so that rather than the discrete rings of early CT, data are acquired in continuous spirals, with the x-ray source and detector tracing a helical path. In addition, the detectors are aligned into arrays of multiple rows, allowing the acquisition of multiple slices per rotation. This has the effect of shortening acquisition time (and therefore radiation dose) or allowing increase resolution by acquisition of more slices.
Dual-energy CT scanning refers to collection of images using two different x-ray spectra, one with a higher mean energy and one lower (reviewed in Ref. 172). Dual-energy CT scanners take advantage of the fact that attenuation is a property of the photon energy as well as tissue density. By acquiring scans at multiple energy spectra, tissue elements that are similar at one energy can be distinguished using data from the other energy components. Filters can be used to increase the difference between the two spectra. The dual spectra can be created by two separate sources, by switching rapidly back and forth between generation of each, or by tubes that are layered to produce both. Another approach uses a broad-spectrum source, using a layered detector system with two layers. The photosensitive material of the layers differ in that one layer is sensitive to the lower energy and the other layer more sensitive to the higher energy spectrum. One disadvantage of the dual source systems is cross-scattering of radiation. Since the tubes operate at the same time, scattered photons from one may be detected by the other detector, affecting the spectral separation unless scatter-correction is applied. For this reason, detector elements to quantify and correct cross-scatter are incorporated in dual source systems (237). Dual-energy CT allows the signal from administered contrast to be separated from the background tissue signal, thus alleviating the need for a second scan. Dual-source CT and multidetector CT greatly increases the speed of acquisition and the entire chest can be imaged within a single breath-hold.
In order for images to be quantitative, the reconstruction of information from the detector arrays into three dimensions needs to be free of additional algorithms that manufacturers place that improve image quality for clinical qualitative assessment such as edge enhancement (increasing the contrast in the areas where there are sharp boundaries) or smoothing of the image. Edge enhancement improves the subjective appearance of an image but adds noise to the image. Smoothing of image will reduce the resolution of an image and may also reduce the accuracy of the acquired data (see Ref. 312). In addition, the scanner must be calibrated by the use of phantoms of known characteristics to ensure that the expected attenuation values are acquired.
For quantitative CT, regional image intensity is expressed by the mean attenuation (μ) of the x-ray on a scale relative to air and water. The Hounsfield unit (HU) defines the radio-density of distilled water at standard pressure and temperature (STP) as zero. Air at STP, which has close to zero attenuation is −1000 HU. The HU for a voxel is calculated as:
| (55) |
Since the range of HU numbers is large, a “window” is selected to focus on the range of interest in the thorax, allowing improved resolution within the range of grayscale available for visualization. In order to use the attenuation of lung tissue quantitatively, the scanner must be calibrated over the appropriate range using phantoms of the correct air/water density and at the same scan parameters and source voltage/current settings (26, 234, 302, 348). The lung volume of acquisition also needs to be carefully controlled (293).
Unsurprisingly, the attenuation of x-rays in a voxel of lung parenchyma is proportional to the relative volumes of tissue, fluid, blood, and air (i.e. the density) (133) and as such, there is a gravitational gradient in attenuation (279). The gravitationally dependent lung has a less negative mean attenuation (HU) than does nondependent lung because the alveoli are smaller, and the blood volume is greater, but this effect is less at total lung capacity as the alveolar size is more uniform (277, 315, 329) reviewed in Ref. 115.
Ventilation
A great number of studies have used the local density to determine which regions of the lung are hyperinflated, normally aerated, poorly aerated, and nonaerated, reviewed in Ref. 98. The change in local attenuation between inspiratory and expiratory scans has also been used to infer recruitment of alveoli with increased lung volumes. This approach tells very little about the underlying ventilation, because ventilation is a dynamic process, and these static images provide only a limited probe of the underlying function. For this reason, CT imagers interested in quantifying regional ventilation turned to noble gas imaging (53, 295). Early in the development of CT, it was recognized that the high molecular weight of xenon offered increased attenuation of x-ray beams and thus could be used as a contrast agent (86, 341, 342). The CT density measured in HUs increases linearly with xenon concentration (Figure 24) and thus the washin (or washout) of gas can be imaged (94, 212). The changes in attenuation are small, approximately 1 to 2 HU/percent of inhaled xenon (86), and vary with the type of scanner and the energy used (lower energy gives greater enhancement), thus data acquisition and analysis must be carefully conducted (94).
Figure 24.

Computed tomography enhancement [ΔCT] measured in Hounsfield Units (HU) induced by differing concentrations of xenon in air at 80 and 120 kV, showing a linear relationship between xenon concentration and the change in attenuation. Reused, with permission, from Marcucci C, et al. 2001 (212).
Studies using xenon were first reported by Gur et al. (116, 117) and then further developed to acquire serial images at end expiration by using a gated acquisition (137, 144, 212, 296, 297). As for other washin techniques (such as oxygen-enhanced MRI or multiple breath hyperpolarized gas imaging), as the subject is switched from air to a xenon/oxygen mixture and the rate of change in signal intensity can be measured and the regional specific ventilation calculated. Studies modeled the washin of xenon as single exponential based on Kety’s model as:
| (56) |
where CA equilibrium is the equilibrium concentration of gas in the alveolus at time t, CI is the inspired concentration of gas, at time t, and is the ratio of fresh gas delivery to the resident volume, that is specific ventilation as before. As in other imaging techniques partial voluming, misregistration, and breath-hold volume will affect the modeled signal characteristics and impart noise. In addition, since the same lung volume must be imaged at each acquisition this may limit the volume of lung imaged.
In order to have sufficient SNR to enable curve fitting to quantify specific ventilation, 40% Xenon is desirable, but this comes at a price, because Xenon is moderately soluble in blood and has an anesthetic effect at high concentrations. Notably, in the nine subjects studied by Gur et al. (116, 117) who were breathing Xenon concentrations ranging from 10% to 50%, 6 had symptoms, with the 3 of 4 subjects breathing concentrations of 40% and above having significant symptoms including loss of consciousness. The solubility of Xenon in blood adds an additional issue to quantification of specific ventilation because recirculation effects must be taken into account (53). This is problematic when using the Kety model (185) because of the explicit assumption Xenon is insoluble in blood and tissue. Concerns have been raised about the effects that inhaling dense gas may have on the underlying ventilation distribution (143). In some studies, Helium is also added to the mixture to prevent large changes in overall gas density. While also a concern for hyperpolarized gas imaging, as mentioned earlier, this effect has been given more consideration in the CT literature.
The concerns about the anesthetic effects of Xenon led some researchers to turn to imaging the washin of Xenon/Krypton (molecular weight 83.7)/oxygen mixtures and Krypton-oxygen mixtures to measure regional ventilation (120, 340). The use of 30% Krypton with 30% Xenon produced a washin signal comparable to breathing 40% Xenon, an important reduction given the symptoms reported by human subjects breathing 40% Xenon (52). The first study using Krypton alone demonstrated technical feasibility of using Krypton as an inhalation agent and using dual-energy CT identified three compartments based on attenuation of air (−1000 HU at both energies), lung parenchyma (60 HU at 80 kVp and 56 HU at 140 kVp) and Krypton (−796 HU at 80 kVp and −972 HU at 140 kVp). Dual-energy CT set at 80 and 140 kVp has also been used with material decomposition to separate the attenuation imparted by xenon from that of the lung to estimated ventilation based on single breaths of Xenon/oxygen mixtures (173). The subject is imaged during a breath-hold following the inhalation of a single breath of a mixture of Xenon and oxygen. While this approach is appealing in its simplicity, it suffers from the same limitations as other single breath methods as discussed above in the section of noble gas imaging with MRI.
Perfusion
With the advent of helical CT acquisitions, it became feasible to acquire images from most of the lung in a single breath-hold following the injection of contrast (263). This allowed injected iodinated contrast media to be visualized in pulmonary circulation (reviewed in Refs 22, 171). Iodinated contrast media has two types, ionic and nonionic, which are distinguished based on the osmolality of the substance, with nonionic contrast being covalently bound to organic molecules (see Ref. 22 for a review). Initially, intravenous contrast contained sodium or lithium iodide and the molecular weight of iodine (molecular weight 129) offered good attenuation characteristics. However, because of toxicity concerns which relate to the osmolality of the injected material covalently bound iodine (nonionic) with lower osmolality is widely used. There is a linear relationship between the amount of iodine injected and attenuation of approximately 26 HU per percent injected at 110 to 120 kVp, and greater attenuation at lower tube voltages (22). This differential effect between voltages lends itself to dual-energy scanning (Figure 25). Unlike gadolinium-based agent imaged with MRI, iodinated contrast does not suffer from lack of linearity at high concentrations. While the osmolality of the injected material affects the incidence of adverse effects, the viscosity of the injected material (which increases with the contrast medium concentration) has an effect on the delivery of the bolus and its distribution (see Ref. 22).
Figure 25.

Regional pulmonary blood volume (PBV) measured after an injection of iodinated contrast by dual-energy source dual detector CT. The configuration of dual-energy computed tomography (DECT) uses 80- and 140-kVp energies, with detectors 95∘ apart to acquire contrast-enhanced CT images at the two energies, (A). A test bolus of contrast is injected to determine the time delay and Axial CT images are acquired (Ba). A region of interest is located in the left atrium (red circle) and a time versus contrast density curve (Bb) is constructed to establish a delay time, the time between the start of the injection and time it takes the contrast density to reach 100 Hounsfield units (HU) (vertical line in the Bb). The delay time accounts for the difference between the start of contrast injection and the start of the DECT acquisition. Images derived from DECT at 80- and 140-kVp are used to calculate PBV maps (C). (D) Global and regional PBV analysis, showing lung mask outlining only the lung parenchyma. Large vessels and airways are excluded. Data were acquired before and after the administration of sildenafil, a potent pulmonary vasodilator (E). To evaluate changes, images are registered by warping the 140-kVp images post sildenafil images to pre sildenafil to evaluate heterogeneity (coefficients of variation, CV, also known as relative dispersion) before and after sildenafil. Reprinted, with permission, from Iyer KS, et al. 2016 (166).
Much of what is referred to as perfusion scanning clinically evaluates blood pool enhancement after a slow injection of contrast (235, 262, 289). From a technical standpoint, this is a much easier study to perform, since only a peripheral venous catheter is required, and full lung coverage is possible within a breath-hold (143). In addition, the radiation exposure is less. However, this is not a measure of perfusion but rather of local blood volume. Work in animals has shown that there is an excellent relationship between local perfused blood volume and local perfusion measured by CT [Figure 26 (95)] using dynamic multidetector CT imaging (see below); however, how well this relationship holds up in patients with lung disease is unclear.
Figure 26.

Images of pulmonary blood volume (PBV), calculated from three-material decomposition of the iodine contrast-enhancement signal and pulmonary blood flow (PBF) measured with four-dimensional (dynamic) electrocardiographically gated axial CT. Data are from a pig model evaluated at five different levels of airway pressure. Top row grayscale images, middle row pulmonary blood volume, bottom row, pulmonary blood flow. Color scale indicates with lower values in blue and higher values in red. There is close agreement between blood volume and blood flow. Reprinted, with permission, from Fuld MK, et al. 2013 (95).
With the advent of dynamic CT imaging (four-dimensional, 4DCT) and as for the MRI techniques previously discussed in the section of dynamic contrast-enhanced imaging with MRI, the tracer kinetics can be used to calculate regional perfusion (344). Typically, a catheter is placed in either the superior vena cava or the right ventricle for injection of contrast material as a sharp bolus (51, 344). An ECG gated axial scan is initiated just prior to the injection of contrast material and from time-attenuation curves, transit times and blood flow can be calculated (6, 51, 72, 144) in a similar manner as the MRI techniques with injected contrast. As for MRI techniques, the contribution of large conduit vessels can be subtracted leaving the majority of the signal representing perfusion (344).
Ventilation-perfusion
Inhaled Xenon
In the previous discussion on measuring ventilation with CT with Xenon, Xenon was considered as a highly insoluble gas and thus confined to the alveolar space. However, this is not true. As discussed earlier, Xenon is somewhat soluble in blood with a blood-gas partition coefficient, λ, of approximately 0.14, a function of its solubility in both red blood cells and plasma. Kreck et al. (188) exploited this during a Xenon washin by acquiring sequential end-expiratory images to simultaneously measure regional ventilation and perfusion. With inhalation of the tracer, the concentration of Xenon in a region is determined by the concentration in inspired gas entering the voxel, the concentration in expired gas leaving the voxel, the amount leaving the voxel by diffusion across the alveolar wall, and the amount of Xenon delivered in pulmonary mixed venous blood from recirculation of previously diffused gas (Figure 26).
From this, a mass balance equation expressing the change in the mass of a tracer gas Mgas over time can be written that assumes: (i) steady state conditions, (ii) that dead space is a fixed fraction of alveolar volume, (iii) that tidal ventilation is represented by unidirectional flow, and that the tracer gas equilibrates in alveolar gas, tissue, and capillary blood as:
| (57) |
where Mgas is the mass of tracer gas in the voxel, is regional ventilation, CI, CA, Ccapillary, and are the inspired, alveolar, capillary, and mixed venous concentrations, respectively. The volume of the voxel Volvoxel is considered to be a binary compartment of air volume (Volair) and tissue (Voltissue), that is
| (58) |
At equilibrium, the concentration in capillary and mixed venous blood can be expressed in terms of the alveolar concentration and the respective partition coefficient, that is
| (59) |
| (60) |
The change in alveolar concentration of the tracer over one breath at time “i” can be expressed as
| (61) |
where T is the period of one breath. This can be substituted back into Eq. (57) to solve for CA at time t:
| (62) |
The alveolar concentration of gas as the subject is switched from breathing room air to a Xenon mixture can be monitored by evaluating the change in HUs over time as the subject breathes the gas. The CI (inspired) and CV (mixed venous) concentrations can be determined by evaluating a region of interest in the trachea or large airways and the vena cava. The fractional volume of air (Volair) and tissue (Voltissue) in each voxel is determined from the HUs of the baseline images before the tracer is administered, and the fractional dead space volume (Voldead space) is assumed to be uniform (a limitation of this approach) and 0.25. Finally, the values of λtissue/air and λblood/air are also assumed. Thus, using this approach, the regional ratio can be quantified by Xenon washin. A limitation of this technique is the assumption that there is a fixed local dead space and the need for high concentrations of inhaled Xenon (65%).
Simultaneous administration of 2 contrast agents (mixed contrast) with dual-energy CT
One possibility to measure regional matching is simply to combine the imaging of ventilation and perfusion. It should be noted that Xenon and Iodine have similar x-ray attenuating properties. This affects the material decomposition approach, making this combination of contrast agents unfavorable. This issue has been addressed by imaging sequentially: Ventilation is first imaged with either Xenon or Krypton and then after a washout period perfused blood volume is evaluated with administration of iodinated contrast. A disadvantage of this technique is the amount of radiation exposure from two imaging sessions. To deal with this issue Hong et al. (147) used dual-energy CT to obtain a single static scan following 3 min of inhalation of 80% Krypton with injection of iodinated contrast at the end of the inhalation period. The timing of the acquisition after the injection of iodinated contrast was determined by a preliminary test to evaluate the arrival time of the contrast bolus after injection. However, the results of their work suggested that at the current time this approach is unlikely to allow for quantitative measurements.
Advantages and disadvantages
CT Scanning techniques are generally widely available and are less expensive than many other imaging techniques such as MRI. The images obtained are high resolution and some validation has been undertaken. When x-ray photons penetrate tissue, their high energy means that there is the possibility that ensuing local effects may affect changes in covalent binding of DNA, the cumulative effects of which can exceed repair leading to cell mutation and vulnerability to radiation-induced cancer. Some examples of the approximate effective radiation dose from various types of CT imaging is given in Table 4. In addition to the risks of radiation exposure, these limits use in repeated studies, which are often desirable in answering physiology research questions unless the work is done in an animal model. These effects are more likely with higher dose but there is no threshold. When injected contrast is used to measure perfusion there is a risk of a reaction to the injected material, in 1% to 3% of individuals receiving nonionic contrast and in up to 12% of individuals receiving ionic contrast. Reactions include rash and/or nausea and vomiting. While rare, severe reactions such as anaphylaxis, occur in ≤0.04% of cases (256).
Electrical Impedance Tomography (EIT)
General considerations
In a direct current circuit, resistance is the opposition to flow of electrons in response to an applied voltage. In an alternating current circuit, this opposition to flow is described by the term impedance. Impedance possesses both magnitude and phase, unlike resistance in a direct current circuit, which has only magnitude. Another common measurement is conductivity, the ability of a material to conduct current. Conductivity depends only on the intrinsic resistive properties of the material; however, the size and shape of the material affect the overall transfer on the current. This can be visualized by thinking of two different gauges of copper wire of the same length conducting electricity: in both cases, the conductivity is the same because then material is the same (copper) but the smaller wire has a lower ability to transfer current than the larger one.
Electrical impedance tomography (EIT) is an imaging technique that applies small high frequency low amplitude alternating currents to the thorax surface through pairs of electrodes arranged in an array. In EIT, the applied currents are tiny and thus imperceptible. By monitoring the voltage that arises on the other electrode pairs, EIT evaluates the differences in electrical impedance (and/or conductivity) from various regions. The ability of tissues to conduct these currents is a function of the free ion content of the tissue or fluid, allowing different tissues to be separated and a volumetric image reconstructed (Figure 27).
Figure 27.

Model of tracer gas delivery and loss for a voxel of lung. With inhalation of the tracer, the concentration is determined by the concentration in inspired gas, the concentration in expired gas, the amount of tracer that diffuses out of the voxel across the alveolar wall, and the amount that recirculates in mixed venous blood. , ventilation; , perfusion; CI, inspired concentration; CA, alveolar concentration Ccap, end-capillary blood concentration; , pulmonary mixed venous blood concentration; t, time. Reused, with permission, from Kreck TC, et al. 2001 (188).
The use of EIT to image lung function has been reviewed in detail (36, 90) and the interested reader is referred elsewhere for a detailed description of the underlying physics (2, 43). Despite its name, EIT does not produce tomographic images because an image cannot be reconstructed slice by slice as it can for CT scanning. This is because the applied currents are not confined locally and may affect multiple measurements and not just those in a particular region. To perform an EIT acquisition, electrodes are placed on the chest surface; these can be individually placed or can be arrayed into belts with a predetermined electrode spacing. A typical placement is in the transverse plane with electrodes placed circumferentially around the chest (90) (Figure 28). Electrode arrays range from 8 to 32 electrodes, with a greater number of electrodes improving spatial resolution and providing additional information to allow rejection of noisy information. With an array of 16 electrodes, up to 104 independent measurements can be used to reconstruct an image, whereas with 8, only 20 are possible (43).
Figure 28.

Schematic diagram of an EIT acquisition. Current (I) is applied between adjacent surface electrodes (in this case 15 and 16), and the voltages (U) are measured between the remaining pairs, in this case 5 and 6. It should be noted that in this instance, electrode pairs 1 and 2 and 13 and 14, will have the greatest sensitivity to monitor the resultant voltage. Reused, with permission, from Frerichs I, et al. 2001 (91).
Most of the information with EIT is from adjacent electrodes and those on the other side of the thorax may be too distant to measure a voltage (90). Since EIT is more sensitive to tissues close to the electrodes, electrode placement affects the results, and precisely locating them is therefore essential for reproducibility in longitudinal evaluation. Electrode placement in the 5th or 6th intercostal space allows information from the basal lung to be acquired, whereas placement in the 3th or 4th intercostal space acquires information from more apical lung. Below the 6th intercostal space, the diaphragm may impinge on the imaging plane, which is undesirable. The acquired image samples the conductivity in the electrode plane, but, since the flow of current is not constrained to just this plane, the cross-sectional volume acquired is about 1∕2 the width of the thorax (90).
A frame consists of data acquired during one set of current application and voltage measurements which is used to reconstruct one raw image, with up to approximately 50 raw images/s possible. In EIT of the lung, information is recovered not only from the lungs but also from the heart and chest wall, and lung ROIs can be identified by regions where there are signal changes consistent with breathing (90) (Figure 29). Recovery of information and reconstruction of EIT images is a nonlinear inverse problem. Image reconstruction is a complex mathematical problem (2, 90), a function of the fact that the applied electrical current travels three-dimensionally along the path of greatest conductance (often blood vessels). Thus, there may be nonunique solutions for projecting a 3D acquisition into a 2D image. EIT image reconstruction algorithms make assumptions about underlying thorax shape, levels of random noise (interference), the impedance distribution at the baseline measurement and representation on either a pixel grid or a triangular configuration (197). All of this information will have an effect on the reconstructed images. A discussion of the various reconstruction algorithms is beyond the scope of this work, and the reader is referred elsewhere for more information (197).
Figure 29.

Electrical impedance tomography (EIT) data obtained from the dorsal region of the dependent (A) and nondependent lungs (B) in a single subject. The relative impedance (rel. ΔZ) changes due to ventilation are greater than those associated with heartbeat which are seen during apnea. Changes in rel. ΔZ during breathing are great in the dependent than in the nondependent lung consistent with the gravitational gradient in regional specific ventilation (283). The decrease in EIT signal during breath holding is consistent with loss of gas volume consistent with ongoing gas exchange in the presence of a RER less than 1, such that less CO2 is produced than O2 is taken up. Reused, with permission, from Frerichs I, et al. 2017 (90).
The physiologic processes of ventilation and perfusion change the local tissue impedance and conductivity (Figure 29). Conductivity is expressed in units of Siemens per meter (S/m) with blood approximately 0.60 S/m and lung conductivity ranging from 0.042 to 0.11 depending on lung volume (79, 99). Thus, monitoring periodic changes with dynamic acquisition allows information about ventilation and perfusion to be inferred. Since the processes of ventilation and perfusion occur at different frequencies (i.e. respiratory rate is 12–20 breaths/min whereas heart rate is approximately 60–100 beats/min) the EIT signal can be filtered to focus on the component of interest. For imaging ventilation and perfusion, a scan rate of 10 images/s or more is desirable. Aliasing, where information at a particular frequency is represented at a different frequency occurs when the sample rate is not high enough (90).
Ventilation
Tissue conductivity is reduced when local gas volume is increased, and it is increased when local gas volume is decreased. The relative changes reflect changes in gas volume in the sampled volume with breathing and therefore represent local specific ventilation (1). If full inspiration and expiration maneuvers are made, this forms the basis for an estimate of local forced vital capacity and FEV1 (319). In addition, some estimates of regional lung compliance can be obtained (see Ref. 32 for explanation), although this may be problematic because airway pressure measured at the mouth may not reflect airway pressure in a local lung region. Also, because changes in PEEP or airway pressure may alter blood volume and thus conductivity that can also affect the results. For ventilation imaging, the reconstruction of tomographic images is done by calculating the changes between a baseline frame (Vref) and the frame at the current time (Vt) acquired as part of time series of subsequent frames, so-called time-difference electrical impedance tomography imaging (tdEIT) (90).
Considering its stature as a relatively new technique, EIT has undergone more validation studies than many other imaging techniques. In anesthetized dogs, lung volume changes with EIT are closely correlated with the volume of air introduced into the lung via calibrated syringe (1). Volume changes with EIT are correlated with changes in gas volume between the right and left lungs compared to CT scanning in patients with ARDS (316), and SPECT in patients with lung cancer (193). EIT has also been compared to aerated lung volume measured by CT scanning in pigs with good agreement (92). In pigs, global measures of lung ventilation compared very favorably between EIT and PET but comparing regions consisting of the anterior and posterior area of the right and left lungs, a more modest (R2 = 0.65) relationship was obtained (268). In another study, regional ventilation measured by EIT was closely correlated with SPECT (139). Lung compliance estimated from EIT correlates favorably with those estimated using airway pressure and lung volume changes (32).
Perfusion
Compared to its use in measuring regional ventilation, measurement of perfusion and ventilation-perfusion matching is much less well developed. Since conductivity increases when blood volume is increased analysis of the waveform induced by pulsatile flow in the lung can be used to quantify perfusion (78, 80, 81, 193, 228). The assumption is made that the changes in local impedance are in proportion to the relative amount of the stroke volume that is distributed to that region. Another approach is to inject boluses of hypertonic saline and monitor the local impedance change as the bolus traverses the pulmonary circulation (93). From the time impedance dilution curve, local pulmonary perfusion can be estimated (174) using similar first pass analysis techniques to those discussed previously in the MRI section. Alternately some investigators use an analysis technique known as the maximal slope method (39), which is based on the idea that a well-perfused region will accumulate the bolus quickly and clear it rapidly. From this regional perfusion is calculated as:
| (63) |
where m is the mass of contrast. In measuring perfusion using the saline bolus method, some regions will have a double peak, a rapid one as the bolus travels through the heart, and another slower peak as it traverses the pulmonary circulation, and this must be corrected for in order to accurately quantify perfusion (39).
The saline bolus technique has shown sensitivity to local perfusion changes and reduced perfusion in areas labeled as perfusion defect as assessed using CT scanning (39, 93), and good agreement with changes observed with SPECT (39). However, a lower relationship with SPECT is reported for EIT perfusion measures based on local pulsatility (39).
Advantages and disadvantages
EIT has the advantage that it can be used to measure ventilation and perfusion in a variety of postures. The lack of ionizing radiation, need for patient cooperation, and portability of the technique means that it can be used in a variety of situations that are not possible for other imaging modalities. In addition, it is inexpensive, and data can be acquired rapidly lending itself to repeated imaging for patient monitoring. However, compared to other imaging modalities such as PET, CT, MRI, or even SPECT it is low spatial resolution, and the true spatial resolution is unclear because tissue closer to the electrodes will be imaged at a higher spatial resolution than tissue further away (130). Because EIT relies on an applied electric current, use in patient with pacemakers or other implanted electrical devices is contraindicated (90). Because of its portability, there is considerable interest in using EIT in the intensive care setting; however, many aspects of care of the ICU patient may interfere with measurements; for example, surgical bandages or staples, will affect electrode placement, and patient care or monitoring devices such as pneumatic air mattresses and cardiac output monitors can interfere with electrode contact or contribute interference to the EIT signals (90).
Destructive Microsphere Techniques
Microspheres, as their name implies, are small spheres that, when injected into the circulation or aerosolized and inhaled, are distributed proportionally to their regional ventilation or blood flow. The destructive microsphere techniques differ from the imaging techniques using inhaled particles or injected macroaggregated albumin in that once an appropriately sized particle has been selected, aerosolized (or injected) and administered, the animals are sacrificed. Then, the lungs are washed, sectioned into appropriately sized pieces, and the number of microspheres is assessed and the regional ventilation or perfusion quantified. The first use of microspheres was described in 1967, when regional blood flow in fetal sheep in utero was evaluated by Rudolph and Heymann (280) using radioactive microspheres. In this study, as part of validation work, 50 μm microspheres were injected into the venous circulation of rodents. After sacrifice of the animals, the lungs were removed, and the amount of radioactivity assayed, thus this study represents the first lung perfusion measurement by this technique. After the initial work with radioisotopes, other investigators introduced measures of blood flow with colored microspheres and then shortly thereafter with fluorescent microspheres.
Microsphere techniques allow measurement under multiple conditions (138), either by using different radioisotopes, different colors (122, 187), or different fluorescent labels (221, 249). Up to 13 colors of fluorescent microspheres (288) or 10 different radioisotopes can be resolved within an experiment, making study of multiple conditions possible. Fluorescent or colored microspheres are less expensive than radiolabeled microspheres for a variety of reasons. First of all, the microspheres themselves are less expensive and do not have the costs associated with disposal of radioactive material and with animals contaminated with radiotracer, after the experiments are completed. More recent techniques use stable isotopes where the microspheres are activated once in the tissue by neutron activation (261) where the tissue is exposed to neutrons rendering the isotopes radioactive allowing them to be assayed. In the case of chronic studies, radioactive isotopes may lose tracer either because of leaching of activity from microspheres, into the blood and lymphatics or because of radioactive decay. However, fluorescent microspheres have been shown to be stable for weeks. Thus, fluorescent microspheres are more suitable for long-term studies; however, there is significantly more work associated with recovery of material as described below (249).
Tissue processing and microspheres assay
Once the experiment is complete the lungs must be excised, sectioned into uniform pieces and assayed for microspheres. Although there are several protocols for handling lung tissue, in a large number of studies reporting quantitative measures (9, 105, 107, 108, 273) the animal is heparinized, exsanguinated, and the lungs are flushed of blood by administration of large volumes of saline. The lungs are then excised, inflated with positive pressure ventilation, air dried and then coated with polyurethane foam, before being encased in isocyanate foam. This allows for a fixed coordinate system for cutting and prevents distortion of the dried lung during sectioning. After sectioning, the spatial location is recorded, any remaining foam is removed, and the pieces are weighed, which allows correction for the amount of tissue present in a piece. The pieces are also inspected for the presence of conducting airways and large blood vessels. Pieces are graded according to a scoring system from 0 to 5 with 0 representing no airways/large blood vessel, and 5 being a piece that has 75% or more of the total piece volume occupied by an airway/large blood vessel (9, 105, 107, 108, 273).
The assays to determine the number of microspheres can take several forms, depending on the type of microspheres used: In the case of radioactive microspheres, the number of counts in each piece is obtained using a scintillation counter. The count rates for each isotopes must be corrected for the loss of counts associated with radioactive decay, any background counts and in the case of multiple isotopes, for spillover of counts from different energy isotopes present in the same sample (45, 138). For nonradiolabeled microspheres, the tissue is digested, and the microspheres may be counted manually using microscope, optical systems, spectrophotometers or x-ray fluorescence systems (248, 249, 274). Some types of fluorescent microspheres can be dissolved in a known quantity of solvent releasing the dye and the dye intensity subsequently measured.
An interesting advance in the analysis of microsphere data is the Imaging CryoMicrotome (Barlow Scientific, Inc., Olympia, WA). This is a device that allows the spatial distribution of microspheres to be evaluated in small samples such as rodent lungs (34). The maximum sample are size is about 64 cm2 (8 cm by 8 cm). The system consists of a cryostatic microtome to provide thin (24 μm) sections of frozen tissue combined with a high resolution (2184 × 1472 pixels) video camera perpendicular to the section. The camera is placed and focused such that the in-plane resolution of the acquired image matches the slice thickness providing isotropic voxels. A fluorescence excitation lamp, combined with excitation and emission filters allows identification of specific fluorescent colors, allowing for assessment of multiple conditions and both ventilation and perfusion. This system was validated against the radioactive microsphere method with excellent results (34). Using this data analysis technique ventilation and perfusion has been measured in rat lungs ranging in spatial scale from near-acinar levels of resolution up to lobar levels (106).
Ventilation
Inhaled particles of less than 2 μm are used to evaluate ventilation (215, 273) because these deposit primarily in the alveolus, with nearly 95% of such particles depositing in the alveolar space (349), as seen previously in Figure 11. Larger particles tend to impact in the conducting airways and the nasopharynx, where they may be cleared by the lung’s defenses. In the previous section on imaging, the use of inhaled particles such as Technigas for ventilation imaging and injected macroaggregated albumin for perfusion imaging were discussed. To measure ventilation using microspheres, the microspheres are placed in solution and mixed by vortexing and sonication (273, 274). Microspheres are then placed into aerosol form using an atomizer with compressed air to force then solution through a high-velocity nozzle. Once aerosolized the aerosol is dried and passed through a source-charge neutralizer to prevent particles from adhering to the delivery system. The aerosolized microspheres are administered over a period of several minutes through an endotracheal tube attached to a positive-pressure ventilator (273).
It has been shown using this technique that deposition of the fluorescent microsphere particles is not dominated by the conducting airways (273), as is expected based on the particle size characteristics. In addition, the distribution of ventilation measured by microspheres was closely related to regional ventilation measured by CT scanning (167, 275). Using microspheres the distribution of ventilation is spatially heterogeneous and has been shown to follow a fractal branching pattern (9), similar to perfusion (see below). In addition to being spatially heterogeneous, temporal heterogeneity in ventilation has also been studied using microspheres showing a small (~coefficient of variation of 1–10%) amounts of variability (275).
Perfusion
Typically, 15 μm microspheres are used to measure perfusion, because they are too large to pass through a capillary, and will lodge in small arterioles. As described above, these lodged microspheres can be recovered once the lung is harvested, the number of local microspheres assessed and regional perfusion calculated. To measure perfusion, microspheres are suspended in distilled water or saline, sonicated, vortexed, and then injected (274). Surfactant agents, such as Tween, are used to aid in the suspension of the microspheres and avoid clumping, or microsphere aggregation (248). Once a microsphere lodges in a capillary bed, it moves into the local interstitium where it is then stable in its location for a period of weeks (see Ref. 248 for review). Since the vessel is occluded by the microsphere, local vascular resistance must rise and there is a limit to how many particles can be injected before the capillary beds are overly obstructed and the underlying physiology altered. This is especially true of small animal models such as rodents; however, it has been shown that with injection of 1,000,000 microspheres, vascular resistance increased by less than 10% (108) in these animals. This is not a major issue, provided care is taken not to inject too many microspheres at once or study too many conditions.
Using microspheres, perfusion has been measured during a great many conditions and contributed much to the understanding of the pulmonary circulation. For example, the effects of breathing altered inspired oxygen (142, 194), prostacyclin infusion (114), exercise (35), hypoxic exercise (154), microgravity (110), hypergravity (110), mechanical ventilation (327), pulmonary embolism (12), posture (10, 327), and PEEP (177) on the pulmonary circulation have been investigated. Further studies have investigated the stability of patterns of perfusion over days (112) and to evaluate genetic determinants of blood flow by evaluating perfusion across and between monozygotic litters (104). Work using microspheres also led to an understanding of structural determinants (107, 109, 111) of pulmonary blood flow and factors affecting pulmonary perfusion beyond simple hydrostatics effects described by the zone model, see Ref. 113 for review. Indeed, the distribution of pulmonary blood has been shown to follow a fractal branching pattern down to the level of gas exchange (9).
Ventilation and perfusion
To measure local ratio, aerosolized and injected microspheres are administered sequentially, as described above. As for repeated measurements under differing conditions, different isotopes or colors are used to mark ventilation or perfusion. An example of data from such a study is shown in Figure 30. A great many studies in animal models have evaluated mechanisms of ventilation-perfusion matching under a variety of conditions including, for example, pulmonary embolism (12), endotoxemia (101), with different postures under mechanical ventilation (49, 222), in small animal models (276).
Figure 30.

Regional ventilation and perfusion measured with fluorescent microspheres in a pig. View is looking at the anterior surface of the lung, and the cardiac fossa is visible as the indented region in the upper portion of the lung fields. The color scale indicates ventilation or perfusion in ml/min/mg of dried lung. Reprinted, with permission, from Altemeier WA, et al. 2000 (9).
Advantages and disadvantages
There are several advantages of these techniques. The technique has been validated against MIGET (11), CT scanning (167, 275) and accurately predicts pulmonary gas exchange (11). They can be used in a variety of postures and conditions, provided an animal model is suitable. Although the measurement of ventilation and perfusion takes place at slightly different times, provided data are obtained under steady state conditions, the ventilation and perfusion data are inherently co-registered. If cardiac output and ventilation are separately measured, then absolute quantification is possible. To do this, typically the weight of the air-dried pieces is obtained, and this allows for pieces around the periphery of the lung to be corrected for the smaller piece size because of partial volume, and the results to be expressed as a representative of per alveolus measurements. While this is a good first approximation, regions of the lung with large airways or blood vessels, or for some species with large amounts of connective tissue (sheep, goats) this may not be as good an estimate. The same is true of lung disease that may result in local increases in lung density such as with scarring or pulmonary fibrosis. Alternately, data can be obtained on the portions of the lung that have complete pieces and thus a fixed volume.
A significant disadvantage is that the microsphere techniques are only suitable for terminal animal studies and given the post experiment processing required to assay these microspheres, these techniques are very labor intensive. The sectioning of the lung into pieces must be very carefully done, because any variation in piece size will directly affect quantification, but this is less a problem for measuring local ratio since both ventilation and perfusion will be affected to the same extent. A further factor is the distortion of the lung anatomy that takes place when the lungs are removed from the thorax and inflated to approximately total lung capacity with positive pressure ventilation. While the lungs were under physiological conditions at the time the microspheres were administered, there are gradients in alveolar size in situ (103), largely because of the normal lung under the weight of gravity. Thus, the effect of gravity on the distribution of ventilation and perfusion in the intact lung is underestimated (152). Finally, aerosolized microspheres may not distribute in an identical fashion as a gas, and this may affect the data (136). A similar concern has been expressed regarding the 15 μm microspheres used to measure perfusion, because they are larger and do not deform like red blood cells, but this effect has been shown to be small (29).
Conclusions
This article has briefly discussed some of the most common quantitative techniques to measure ventilation-perfusion matching. They range from simple noninvasive techniques such as analysis of expired gases to complex imaging techniques. The choice of a technique will depend on several factors, such as the research question and the experimental model (human or animal). Many, but not all, of the discussed techniques have some degree of validation and this should also be considered when choosing a research technique.
Acknowledgments
I am indebted to Dean Kuethe, G. Kim Prisk, Abhilash Kizhakke Puliyakote, Vincent Tedjasaputra, Rebecca Theilmann, Marcos Vidal-Melo, Rui Carlos Sá, and Peter Wagner, who offered suggestions for improvement and helped clarify key portions of the manuscript. Supported by NIH HL199201 and NIH HL129990.
Footnotes
Related Articles
Diffusion of Gases Across the Alveolar Membrane
Ventilation-Perfusion Relationships
Gas Mixing in the Airways and Airspaces
Spatial Distribution of Ventilation and Perfusion: Mechanisms and Regulation
Ventilation: Total, Alveolar, and Dead Space
References
- 1.Adler A, Amyot R, Guardo R, Bates JH, Berthiaume Y. Monitoring changes in lung air and liquid volumes with electrical impedance tomography. J Appl Physiol (1985) 83: 1762–1767, 1997. [DOI] [PubMed] [Google Scholar]
- 2.Adler A, Gaburro R, Lionheart W. Electrical impedance tomography. In: Scherzer O, editor. Handbook of Mathematical Methods in Imaging. New York, New York: Springer, 2011, p. 599–654. [Google Scholar]
- 3.Adolphi NL, Kuethe DO. Quantitative mapping of ventilation-perfusion ratios in lungs by 19F MR imaging of T1 of inert fluorinated gases. Magn Reson Med 59: 739–746, 2008. [DOI] [PubMed] [Google Scholar]
- 4.Agusti AG, Roca J, Gea J, Wagner PD, Xaubet A, Rodriguez-Roisin R. Mechanisms of gas-exchange impairment in idiopathic pulmonary fibrosis. Am Rev Respir Dis 143: 219–225, 1991. [DOI] [PubMed] [Google Scholar]
- 5.Albert M, Cates G, Driehuys B, Happer W, Saam B, Springer C Jr, Wishnia A. Biological magnetic resonance imaging using laser-polarized 129Xe. Nature 370: 199, 1994. [DOI] [PubMed] [Google Scholar]
- 6.Alford SK, van Beek EJ, McLennan G, Hoffman EA. Heterogeneity of pulmonary perfusion as a mechanistic image-based phenotype in emphysema susceptible smokers. Proc Natl Acad Sci U S A 107: 7485–7490, 2010. [DOI] [PMC free article] [PubMed] [Google Scholar]
- 7.Almquist H, Jonson B, Palmer J, Valind S, Wollmer P. Regional VA/Q ratios in man using 133Xe and single photon emission computed tomography (SPECT) corrected for attenuation. Clin Physiol 19: 475–481, 1999. [DOI] [PubMed] [Google Scholar]
- 8.Almquist HM, Palmer J, Jonson B, Wollmer P. Pulmonary perfusion and density gradients in healthy volunteers. J Nucl Med 38: 962–966, 1997. [PubMed] [Google Scholar]
- 9.Altemeier WA, McKinney S, Glenny RW. Fractal nature of regional ventilation distribution. J Appl Physiol (1985) 88: 1551–1557, 2000. [DOI] [PubMed] [Google Scholar]
- 10.Altemeier WA, McKinney S, Krueger M, Glenny RW. Effect of posture on regional gas exchange in pigs. J Appl Physiol (1985) 97: 2104–2111, 2004. [DOI] [PubMed] [Google Scholar]
- 11.Altemeier WA, Robertson HT, Glenny RW. Pulmonary gas-exchange analysis by using simultaneous deposition of aerosolized and injected microspheres. J Appl Physiol (1985) 85: 2344–2351, 1998. [DOI] [PubMed] [Google Scholar]
- 12.Altemeier WA, Robertson HT, McKinney S, Glenny RW. Pulmonary embolization causes hypoxemia by redistributing regional blood flow without changing ventilation. J Appl Physiol (1985) 85: 2337–2343, 1998. [DOI] [PubMed] [Google Scholar]
- 13.Ament S, Maus S, Reber H, Buchholz H, Bausbacher N, Brochhausen C, Graf F, Miederer M, Schreckenberger M. PET lung ventilation/perfusion imaging using 68 Ga aerosol (Galligas) and 68 Ga-labeled macroaggregated albumin. In: Baum RP, Rösch F, editors. Theranostics, Gallium-68, and Other Radionuclides. Heidelberg: Springer, 2013, p. 395–423. [DOI] [PubMed] [Google Scholar]
- 14.Amis TC, Crawford AB, Davison A, Engel LA. Distribution of inhaled 99mtechnetium labelled ultrafine carbon particle aerosol (Technegas) in human lungs. Eur Respir J 3: 679–685, 1990. [PubMed] [Google Scholar]
- 15.Anderson JC, Hlastala MP. Impact of airway gas exchange on the multiple inert gas elimination technique: Theory. Ann Biomed Eng 38: 1017–1030, 2010. [DOI] [PMC free article] [PubMed] [Google Scholar]
- 16.Anthonisen NR, Dolovich MB, Bates DV. Steady state measurement of regional ventilation to perfusion ratios in normal man. J Clin Invest 45: 1349–1356, 1966. [DOI] [PMC free article] [PubMed] [Google Scholar]
- 17.Anthonisen NR, Milic-Emili J. Distribution of pulmonary perfusion in erect man. J Appl Physiol 21: 760–766, 1966. [DOI] [PubMed] [Google Scholar]
- 18.Arai TJ, Horn FC, Sá RC, Rao MR, Collier GJ, Theilmann RJ, Prisk GK, Wild JM. Comparison of quantitative multiple-breath specific ventilation imaging using colocalized 2D oxygen-enhanced MRI and hyperpolarized 3He MRI. J Appl Physiol (1985) 125: 1526–1535, 2018. [DOI] [PMC free article] [PubMed] [Google Scholar]
- 19.Arai TJ, Prisk GK, Holverda S, Sa RC, Theilmann RJ, Henderson AC, Cronin MV, Buxton RB, Hopkins SR. Magnetic resonance imaging quantification of pulmonary perfusion using calibrated arterial spin labeling. JoVE, 51e2712, 2011. [DOI] [PMC free article] [PubMed] [Google Scholar]
- 20.Arnold JF, Fidler F, Wang T, Pracht ED, Schmidt M, Jakob PM. Imaging lung function using rapid dynamic acquisition of T1-maps during oxygen enhancement. MAGMA 16: 246–253, 2004. [DOI] [PubMed] [Google Scholar]
- 21.Ax M, Karlsson LL, Sanchez-Crespo A, Lindahl SG, Linnarsson D, Mure M, Petersson J. Regional lung ventilation in humans during hypergravity studied with quantitative SPECT. Respir Physiol Neurobiol 189: 558–564, 2013. [DOI] [PubMed] [Google Scholar]
- 22.Bae KT. Intravenous contrast medium administration and scan timing at CT: Considerations and approaches. Radiology 256: 32–61, 2010. [DOI] [PubMed] [Google Scholar]
- 23.Bailey DL, Eslick EM, Schembri GP, Roach PJ. 68Ga PET ventilation and perfusion lung imaging—current status and future challenges. Semin Nucl Med 46 (5): 428–435, 2016. [DOI] [PubMed] [Google Scholar]
- 24.Bajc M, Neilly J, Miniati M, Schuemichen C, Meignan M, Jonson B. EANM guidelines for ventilation/perfusion scintigraphy. Eur J Nucl Med Mol Imaging 36: 1356–1370, 2009. [DOI] [PubMed] [Google Scholar]
- 25.Bajc M, Neilly JB, Miniati M, Schuemichen C, Meignan M, Jonson B. EANM guidelines for ventilation/perfusion scintigraphy: Part 2. Algorithms and clinical considerations for diagnosis of pulmonary emboli with V/P(SPECT) and MDCT. Eur J Nucl Med Mol Imaging 36: 1528–1538, 2009. [DOI] [PubMed] [Google Scholar]
- 26.Bakker ME, Stolk J, Putter H, Shaker SB, Parr DG, Piitulainen E, Russi EW, Dirksen A, Stockley RA, Reiber JH, Stoel BC. Variability in densitometric assessment of pulmonary emphysema with computed tomography. Invest Radiol 40: 777–783, 2005. [DOI] [PubMed] [Google Scholar]
- 27.Ball WC Jr, Stewart PB, Newsham LG, Bates DV. Regional pulmonary function studied with xenon 133. J Clin Invest 41: 519–531, 1962. [DOI] [PMC free article] [PubMed] [Google Scholar]
- 28.Barker RC, Hopkins SR, Kellogg N, Olfert IM, Brutsaert TD, Gavin TP, Entin PL, Rice AJ, Wagner PD. Measurement of cardiac output during exercise by open-circuit acetylene uptake. J Appl Physiol (1985) 87: 1506–1512, 1999. [DOI] [PubMed] [Google Scholar]
- 29.Bassingthwaighte JB, Malone MA, Moffett TC, King RB, Little SE, Link JM, Krohn KA. Validity of microsphere depositions for regional myocardial flows. Am J Physiol 253: H184–H193, 1987. [DOI] [PMC free article] [PubMed] [Google Scholar]
- 30.Bateman TM. Advantages and disadvantages of PET and SPECT in a busy clinical practice. J Nucl Cardiol 19 (Suppl 1): S3–S11, 2012. [DOI] [PubMed] [Google Scholar]
- 31.Bebout DE, Story D, Roca J, Hogan MC, Poole DC, Gonzalez-Camarena R, Ueno O, Haab P, Wagner PD. Effects of altitude acclimatization on pulmonary gas exchange during exercise. J Appl Physiol (1985) 67: 2286–2295, 1989. [DOI] [PubMed] [Google Scholar]
- 32.Becher TH, Bui S, Zick G, Blaser D, Schadler D, Weiler N, Frerichs I. Assessment of respiratory system compliance with electrical impedance tomography using a positive end-expiratory pressure wave maneuver during pressure support ventilation: A pilot clinical study. Crit Care 18: 679, 2014. [DOI] [PMC free article] [PubMed] [Google Scholar]
- 33.Berggren SM. The Oxygen Deficit of Arterial Blood Caused by Non-Ventilating Parts of the Lung. Stockholm: Kungl. Boktryckeriet, 1942, p. 92. [Google Scholar]
- 34.Bernard SL, Ewen JR, Barlow CH, Kelly JJ, McKinney S, Frazer DA, Glenny RW. High spatial resolution measurements of organ blood flow in small laboratory animals. Am J Physiol Heart Circ Physiol 279: H2043–H2052, 2000. [DOI] [PubMed] [Google Scholar]
- 35.Bernard SL, Glenny RW, Erickson HH, Fedde MR, Polissar N, Basaraba RJ, Hlastala MP. Minimal redistribution of pulmonary blood flow with exercise in racehorses. J Appl Physiol (1985) 81: 1062–1070, 1996. [DOI] [PubMed] [Google Scholar]
- 36.Bodenstein M, David M, Markstaller K. Principles of electrical impedance tomography and its clinical application. Crit Care Med 37: 713–724, 2009. [DOI] [PubMed] [Google Scholar]
- 37.Bohr C. Ueber die Lungenathmung 1. Skandinavisches Archiv für Physiologie 2: 236–268, 1891. [Google Scholar]
- 38.Bolar DS, Levin DL, Hopkins SR, Frank LF, Liu TT, Wong EC, Buxton RB. Quantification of regional pulmonary blood flow using ASL-FAIRER. Magn Reson Med 55: 1308–1317, 2006. [DOI] [PubMed] [Google Scholar]
- 39.Borges JB, Suarez-Sipmann F, Bohm SH, Tusman G, Melo A, Maripuu E, Sandstrom M, Park M, Costa EL, Hedenstierna G, Amato M. Regional lung perfusion estimated by electrical impedance tomography in a piglet model of lung collapse. J Appl Physiol (1985) 112: 225–236, 2012. [DOI] [PubMed] [Google Scholar]
- 40.Borges JB, Velikyan I, Långström B, Sörensen J, Ulin J, Maripuu E, Sandström M, Widström C, Hedenstierna G. Ventilation distribution studies comparing Technegas and “Gallgas” using 68GaCl3 as the label. J Nucl Med 52: 206–209, 2011. [DOI] [PubMed] [Google Scholar]
- 41.Bouhuys A, Lichtneckert S, Lundgren C, Lundin G. Voluntary changes in breathing pattern and N2 clearance from lungs. J Appl Physiol 16: 1039–1042, 1961. [DOI] [PubMed] [Google Scholar]
- 42.Briguori C, Colombo A, Airoldi F, Melzi G, Michev I, Carlino M, Montorfano M, Chieffo A, Bellanca R, Ricciardelli B. Gadolinium-based contrast agents and nephrotoxicity in patients undergoing coronary artery procedures. Catheter Cardiovasc Interv 67: 175–180, 2006. [DOI] [PubMed] [Google Scholar]
- 43.Brown BH. Electrical impedance tomography (EIT): A review. J Med Eng Technol 27: 97–108, 2003. [DOI] [PubMed] [Google Scholar]
- 44.Brudin LH, Rhodes CG, Valind SO, Jones T, Hughes JMB. Interrelationships between regional blood-flow, blood-volume, and ventilation in supine humans. J Appl Physiol (1985) 76: 1205–1210, 1994. [DOI] [PubMed] [Google Scholar]
- 45.Buckberg GD, Luck JC, Payne DB, Hoffman JIE, Archie JP, Fixler DE. Some sources of error in measuring regional blood flow with radioactive microspheres. J Appl Physiol 31: 598–604, 1971. [DOI] [PubMed] [Google Scholar]
- 46.Burrowes KS, Buxton RB, Prisk GK. Assessing potential errors of MRI-based measurements of pulmonary blood flow using a detailed network flow model. J Appl Physiol (1985) 113: 130–141, 2012. [DOI] [PMC free article] [PubMed] [Google Scholar]
- 47.Buxton RB. Introduction to Functional Magnetic Resonance Imaging: Principles and Techniques. New York, NY: Cambridge University Press, 2009. [Google Scholar]
- 48.Callahan J, Hofman MS, Siva S, Kron T, Schneider ME, Binns D, Eu P, Hicks RJ. High-resolution imaging of pulmonary ventilation and perfusion with 68Ga-VQ respiratory gated (4-D) PET/CT. Eur J Nucl Med Mol Imaging 41: 343–349, 2014. [DOI] [PubMed] [Google Scholar]
- 49.Chang H, Lai-Fook SJ, Domino KB, Schimmel C, Hildebrandt J, Robertson HT, Glenny RW, Hlastala MP. Spatial distribution of ventilation and perfusion in anesthetized dogs in lateral postures. J Appl Physiol (1985) 92: 745–762, 2002. [DOI] [PubMed] [Google Scholar]
- 50.Chen Q, Jakob PM, Griswold MA, Levin DL, Hatabu H, Edelman RR. Oxygen enhanced MR ventilation imaging of the lung. MAGMA 7: 153–161, 1998. [DOI] [PubMed] [Google Scholar]
- 51.Chon D, Beck KC, Larsen RL, Shikata H, Hoffman EA. Regional pulmonary blood flow in dogs by 4D-X-ray CT. J Appl Physiol (1985) 101: 1451–1465, 2006. [DOI] [PubMed] [Google Scholar]
- 52.Chon D, Beck KC, Simon BA, Shikata H, Saba OI, Hoffman EA. Effect of low-xenon and krypton supplementation on signal/noise of regional CT-based ventilation measurements. J Appl Physiol (1985) 102: 1535–1544, 2007. [DOI] [PubMed] [Google Scholar]
- 53.Chon D, Simon BA, Beck KC, Shikata H, Saba OI, Won C, Hoffman EA. Differences in regional wash-in and wash-out time constants for xenon-CT ventilation studies. Respir Physiol Neurobiol 148: 65–83, 2005. [DOI] [PubMed] [Google Scholar]
- 54.Coghe J, Votion D, Lekeux P. Comparison between radioactive aerosol, technegas and krypton for ventilation imaging in healthy calves. Vet J 160: 25–32, 2000. [DOI] [PubMed] [Google Scholar]
- 55.Colegrove F, Schearer L, Walters G. Polarization of He 3 gas by optical pumping. Phys Rev 132: 2561, 1963. [Google Scholar]
- 56.Couch MJ, Ball IK, Li T, Fox MS, Littlefield SL, Biman B, Albert MS. Pulmonary ultrashort echo time 19F MR imaging with inhaled fluorinated gas mixtures in healthy volunteers: Feasibility. Radiology 269: 903–909, 2013. [DOI] [PubMed] [Google Scholar]
- 57.Crawford AB, Cotton DJ, Paiva M, Engel LA. Effect of lung volume on ventilation distribution. J Appl Physiol (1985) 66: 2502–2510, 1989. [DOI] [PubMed] [Google Scholar]
- 58.Crawford AB, Davison A, Amis TC, Engel LA. Intrapulmonary distribution of 99mtechnetium labelled ultrafine carbon aerosol (Technegas) in severe airflow obstruction. Eur Respir J 3: 686–692, 1990. [PubMed] [Google Scholar]
- 59.Crawford AB, Makowska M, Engel LA. Effect of tidal volume on ventilation maldistribution. Respir Physiol 66: 11–25, 1986. [DOI] [PubMed] [Google Scholar]
- 60.Darquenne C, Fleming JS, Katz I, Martin AR, Schroeter J, Usmani OS, Venegas J, Schmid O. Bridging the Gap between science and clinical efficacy: Physiology, imaging, and modeling of aerosols in the lung. J Aerosol Med Pulm Drug Deliv 29: 107–126, 2016. [DOI] [PMC free article] [PubMed] [Google Scholar]
- 61.Darquenne C, Zeman KL, Sa RC, Cooper TK, Fine JM, Bennett WD, Prisk GK. Removal of sedimentation decreases relative deposition of coarse particles in the lung periphery. J Appl Physiol (1985) 115: 546–555, 2013. [DOI] [PubMed] [Google Scholar]
- 62.de Lange EE, Mugler JP III, Brookeman JR, Knight-Scott J, Truwit JD, Teates CD, Daniel TM, Bogorad PL, Cates GD. Lung air spaces: MR imaging evaluation with hyperpolarized 3He gas. Radiology 210: 851–857, 1999. [DOI] [PubMed] [Google Scholar]
- 63.Deninger AJ, Eberle B, Bermuth J, Escat B, Markstaller K, Schmiedeskamp J, Schreiber WG, Surkau R, Otten E, Kauczor HU. Assessment of a single-acquisition imaging sequence for oxygen-sensitive (3)He-MRI. Magn Reson Med 47: 105–114, 2002. [DOI] [PubMed] [Google Scholar]
- 64.Deninger AJ, Eberle B, Ebert M, Grossmann T, Heil W, Kauczor H, Lauer L, Markstaller K, Otten E, Schmiedeskamp J, Schreiber W, Surkau R, Thelen M, Weiler N. Quantification of regional intrapulmonary oxygen partial pressure evolution during apnea by (3)He MRI. J Magn Reson 141: 207–216, 1999. [DOI] [PubMed] [Google Scholar]
- 65.Deninger AJ, Mansson S, Petersson JS, Pettersson G, Magnusson P, Svensson J, Fridlund B, Hansson G, Erjefeldt I, Wollmer P, Golman K. Quantitative measurement of regional lung ventilation using 3He MRI. Magn Reson Med 48: 223–232, 2002. [DOI] [PubMed] [Google Scholar]
- 66.Dietrich O, Losert C, Attenberger U, Fasol U, Peller M, Nikolaou K, Reiser MF, Schoenberg SO. Fast oxygen-enhanced multislice imaging of the lung using parallel acquisition techniques. Magn Reson Med 53: 1317–1325, 2005. [DOI] [PubMed] [Google Scholar]
- 67.Dollery C, Gillam P. The distribution of blood and gas within the lungs measured by scanning after administration of 133Xe. Thorax 18: 316, 1963. [DOI] [PMC free article] [PubMed] [Google Scholar]
- 68.Driehuys B, Moeller H, Pollaro J, Hedlund L. MR imaging of pulmonary perfusion and gas exchange by intravenous injection of hyperpolarized 129Xe. Proc Intl Soc Mag Reson Med 15: 455, 2007. [Google Scholar]
- 69.Driehuys B, Moller HE, Cleveland ZI, Pollaro J, Hedlund LW. Pulmonary perfusion and xenon gas exchange in rats: MR imaging with intravenous injection of hyperpolarized 129Xe. Radiology 252: 386–393, 2009. [DOI] [PMC free article] [PubMed] [Google Scholar]
- 70.Dueck R, Rathbun M, Wagner PD. Chromatographic analysis of multiple tracer inert gases in the presence of anesthetic gases. Anesthesiology 49: 31–36, 1978. [DOI] [PubMed] [Google Scholar]
- 71.Dueck R, Young I, Clausen J, Wagner PD. Altered distribution of pulmonary ventilation and blood flow following induction of inhalation anesthesia. Anesthesiology 52: 113–125, 1980. [PubMed] [Google Scholar]
- 72.Easley RB, Fuld MK, Fernandez-Bustamante A, Hoffman EA, Simon BA. Mechanism of hypoxemia in acute lung injury evaluated by multidetector-row CT. Acad Radiol 13: 916–921, 2006. [DOI] [PubMed] [Google Scholar]
- 73.Eberle B, Weiler N, Markstaller K, Kauczor H, Deninger A, Ebert M, Grossmann T, Heil W, Lauer LO, Roberts TP, Schreiber WG, Surkau R, Dick WF, Otten EW, Thelen M. Analysis of intrapulmonary O(2) concentration by MR imaging of inhaled hyperpolarized helium-3. J Appl Physiol 87: 2043–2052, 1999. [DOI] [PubMed] [Google Scholar]
- 74.Elmstahl B, Nyman U, Leander P, Chai CM, Golman K, Bjork J, Almen T. Gadolinium contrast media are more nephrotoxic than iodine media. The importance of osmolality in direct renal artery injections. Eur Radiol 16 (12): 2712–2720, 2006. [DOI] [PubMed] [Google Scholar]
- 75.Emami K, Kadlecek SJ, Woodburn JM, Zhu J, Yu J, Vahdat V, Pickup S, Ishii M, Rizi RR. Improved technique for measurement of regional fractional ventilation by hyperpolarized 3He MRI. Magn Reson Med 63: 137–150, 2010. [DOI] [PMC free article] [PubMed] [Google Scholar]
- 76.Evans JW, Wagner PD. Limits on VA/Q distributions from analysis of experimental inert gas elimination. J Appl Physiol Respir Environ Exerc Physiol 42: 889–898, 1977. [DOI] [PubMed] [Google Scholar]
- 77.Evans JW, Wagner PD, West JB. Conditions for reduction of pulmonary gas transfer by ventilation-perfusion inequality. J Appl Physiol 36: 533–537, 1974. [DOI] [PubMed] [Google Scholar]
- 78.Eyuboglu BM, Brown BH, Barber DC, Seagar AD. Localisation of cardiac related impedance changes in the thorax. Clin Phys Physiol Meas 8 (Suppl A): 167–173, 1987. [DOI] [PubMed] [Google Scholar]
- 79.Faes TJ, van der Meij HA, de Munck JC, Heethaar RM. The electric resistivity of human tissues (100 Hz-10 MHz): A meta-analysis of review studies. Physiol Meas 20: R1–R10, 1999. [DOI] [PubMed] [Google Scholar]
- 80.Fagerberg A, Stenqvist O, Aneman A. Electrical impedance tomography applied to assess matching of pulmonary ventilation and perfusion in a porcine experimental model. Crit Care 13: R34, 2009. [DOI] [PMC free article] [PubMed] [Google Scholar]
- 81.Fagerberg A, Stenqvist O, Aneman A. Monitoring pulmonary perfusion by electrical impedance tomography: An evaluation in a pig model. Acta Anaesthesiol Scand 53: 152–158, 2009. [DOI] [PubMed] [Google Scholar]
- 82.Farhi LE, Tenney SM. Section 3. The Respiratory System, Volume 4 Gas Exchange Bethesda, MD: American Physiological Society, Distributed by Williams & Wilkins, 1977. [Google Scholar]
- 83.Fazio F, Jones T. Assessment of regional ventilation by continuous inhalation of radioactive krypton-81m. Br Med J 3: 673–676, 1975. [DOI] [PMC free article] [PubMed] [Google Scholar]
- 84.Fazio F, Wollmer P. Clinical ventilation-perfusion scintigraphy. Clin Physiol 1: 323–337, 1981. [DOI] [PubMed] [Google Scholar]
- 85.Fischer MC, Spector ZZ, Ishii M, Yu J, Emami K, Itkin M, Rizi R. Single-acquisition sequence for the measurement of oxygen partial pressure by hyperpolarized gas MRI. Magn Reson Med 52: 766–773, 2004. [DOI] [PubMed] [Google Scholar]
- 86.Foley WD, Haughton VM, Schmidt J, Wilson CR. Xenon contrast enhancement in computed body tomography. Radiology 129: 219–220, 1978. [DOI] [PubMed] [Google Scholar]
- 87.Fowler WS. Lung function studies. II. The respiratory dead space. Am J Physiol 154: 405–416, 1948. [DOI] [PubMed] [Google Scholar]
- 88.Fowler WS. Lung function studies. III. Uneven pulmonary ventilation in normal subjects and in patients with pulmonary disease. J Appl Physiol 2: 283–299, 1949. [DOI] [PubMed] [Google Scholar]
- 89.Fowler WS, Comroe JH. Lung function studies. I. The rate of increase of arterial oxygen saturation during the inhalation of 100 per cent O 2. J Clin Invest 27: 327–334, 1948. [DOI] [PMC free article] [PubMed] [Google Scholar]
- 90.Frerichs I, Amato MB, van Kaam AH, Tingay DG, Zhao Z, Grychtol B, Bodenstein M, Gagnon H, Bohm SH, Teschner E, Stenqvist O, Mauri T, Torsani V, Camporota L, Schibler A, Wolf GK, Gommers D, Leonhardt S, Adler A, TREND study group. Chest electrical impedance tomography examination, data analysis, terminology, clinical use and recommendations: Consensus statement of the TRanslational EIT developmeNt stuDy group. Thorax 72: 83–93, 2017. [DOI] [PMC free article] [PubMed] [Google Scholar]
- 91.Frerichs I, Dudykevych T, Hinz J, Bodenstein M, Hahn G, Hellige G. Gravity effects on regional lung ventilation determined by functional EIT during parabolic flights. J Appl Physiol (1985) 91: 39–50, 2001. [DOI] [PubMed] [Google Scholar]
- 92.Frerichs I, Hinz J, Herrmann P, Weisser G, Hahn G, Dudykevych T, Quintel M, Hellige G. Detection of local lung air content by electrical impedance tomography compared with electron beam CT. J Appl Physiol (1985) 93: 660–666, 2002. [DOI] [PubMed] [Google Scholar]
- 93.Frerichs I, Hinz J, Herrmann P, Weisser G, Hahn G, Quintel M, Hellige G. Regional lung perfusion as determined by electrical impedance tomography in comparison with electron beam CT imaging. IEEE Trans Med Imaging 21: 646–652, 2002. [DOI] [PMC free article] [PubMed] [Google Scholar]
- 94.Fuld MK, Halaweish A, Newell JD Jr, Krauss B, Hoffman EA. Optimization of dual-energy xenon-ct for quantitative assessment of regional pulmonary ventilation. Invest Radiol 48, 2013. DOI: 10.1097/RLI.0b013e31828ad647. [DOI] [PMC free article] [PubMed] [Google Scholar]
- 95.Fuld MK, Halaweish AF, Haynes SE, Divekar AA, Guo J, Hoffman EA. Pulmonary perfused blood volume with dual-energy CT as surrogate for pulmonary perfusion assessed with dynamic multidetector CT. Radiology 267: 747–756, 2013. [DOI] [PMC free article] [PubMed] [Google Scholar]
- 96.Galletti GG, Venegas JG. Tracer kinetic model of regional pulmonary function using positron emission tomography. J Appl Physiol (1985) 93: 1104–1114, 2002. [DOI] [PubMed] [Google Scholar]
- 97.Ganz W, Donoso R, Marcus HS, Forrester JS, Swan HJ. A new technique for measurement of cardiac output by thermodilution in man. Am J Cardiol 27: 392–396, 1971. [DOI] [PubMed] [Google Scholar]
- 98.Gattinoni L, Chiumello D. CT ventilation imaging: Technical background and impact in acute lung injury and ARDS management. In: Lipson D, Van Beek E, editors. Functional Lung Imaging. USA: Taylor & Francis, 2005, p. 14–32. [Google Scholar]
- 99.Geddes LA, Baker LE. The specific resistance of biological material—A compendium of data for the biomedical engineer and physiologist. Med Biol Eng 5: 271–293, 1967. [DOI] [PubMed] [Google Scholar]
- 100.Geier ET, Neuhart I, Theilmann RJ, Prisk GK, Sa RC. Spatial persistence of reduced specific ventilation following methacholine challenge in the healthy human lung. J Appl Physiol (1985) 124: 1222–1232, 2018. [DOI] [PMC free article] [PubMed] [Google Scholar]
- 101.Gerbino AJ, McKinney S, Glenny RW. Correlation between ventilation and perfusion determines heterogeneity in endotoxemia. J Appl Physiol (1985) 88: 1933–1942, 2000. [DOI] [PubMed] [Google Scholar]
- 102.Gesellschaft Physikalisch-medicinische. Verhandlungen der Physikalisch-medincinischen gesellschaft. Würzburg: Stahelschen, Bush und Kumsthandlung, 1869. [Google Scholar]
- 103.Glazier JB, Hughes JM, Maloney JE, West JB. Vertical gradient of alveolar size in lungs of dogs frozen intact. J Appl Physiol 23: 694–705, 1967. [DOI] [PubMed] [Google Scholar]
- 104.Glenny R, Bernard S, Neradilek B, Polissar N. Quantifying the genetic influence on mammalian vascular tree structure. Proc Natl Acad Sci U S A 104: 6858–6863, 2007. [DOI] [PMC free article] [PubMed] [Google Scholar]
- 105.Glenny RW. Spatial correlation of regional pulmonary perfusion. J Appl Physiol (1985) 72: 2378–2386, 1992. [DOI] [PubMed] [Google Scholar]
- 106.Glenny RW, Bauer C, Hofmanninger J, Lamm WJ, Krueger MA, Beichel RR. Heterogeneity and matching of ventilation and perfusion within anatomical lung units in rats. Respir Physiol Neurobiol 189: 594–606, 2013. [DOI] [PMC free article] [PubMed] [Google Scholar]
- 107.Glenny RW, Bernard S, Robertson HT, Hlastala MP. Gravity is an important but secondary determinant of regional pulmonary blood flow in upright primates. J Appl Physiol (1985) 86: 623–632, 1999. [DOI] [PubMed] [Google Scholar]
- 108.Glenny RW, Bernard SL, Lamm WJ. Hemodynamic effects of 15-μm-diameter microspheres on the rat pulmonary circulation. J Appl Physiol 89: 499–504, 2000. [DOI] [PubMed] [Google Scholar]
- 109.Glenny RW, Bernard SL, Robertson HT. Pulmonary blood flow remains fractal down to the level of gas exchange. J Appl Physiol (1985) 89: 742–748, 2000. [DOI] [PubMed] [Google Scholar]
- 110.Glenny RW, Lamm WJ, Bernard SL, An D, Chornuk M, Pool SL, Wagner WW Jr, Hlastala MP, Robertson HT. Selected contribution: Redistribution of pulmonary perfusion during weightlessness and increased gravity. J Appl Physiol (1985) 89: 1239–1248, 2000. [DOI] [PubMed] [Google Scholar]
- 111.Glenny RW, Lamm WJE, Albert RK, Robertson HT. Gravity is a minor determinant of pulmonary blood-flow distribution. J Appl Physiol (1985) 71: 620–629, 1991. [DOI] [PubMed] [Google Scholar]
- 112.Glenny RW, McKinney S, Robertson HT. Spatial pattern of pulmonary blood flow distribution is stable over days. J Appl Physiol (1985) 82: 902–907, 1997. [DOI] [PubMed] [Google Scholar]
- 113.Glenny RW, Robertson HT. Determinants of pulmonary blood flow distribution. Compr Physiol 1: 39–59, 2010. [DOI] [PubMed] [Google Scholar]
- 114.Glenny RW, Robertson HT, Hlastala MP. Vasomotor tone does not affect perfusion heterogeneity and gas exchange in normal primate lungs during normoxia. J Appl Physiol (1985) 89: 2263–2267, 2000. [DOI] [PubMed] [Google Scholar]
- 115.Grenier PA, Beigelman-Aubry C, Feitita C. Computed tomography: Introduction to CT imaging. In: Lipson D, Van Beek E, editors. Functional Lung Imaging. USA: Taylor & Francis, 2005, p. 14–32. [Google Scholar]
- 116.Gur D, Drayer BP, Borovetz HS, Griffith BP, Hardesty RL, Wolfson SK. Dynamic computed tomography of the lung: Regional ventilation measurements. J Comput Assist Tomogr 3: 749–753, 1979. [PubMed] [Google Scholar]
- 117.Gur D, Shabason L, Borovetz HS, Herbert DL, Reece GJ, Kennedy WH, Serago C. Regional pulmonary ventilation measurements by xenon enhanced dynamic computed tomography: An update. J Comput Assist Tomogr 5: 678–683, 1981. [DOI] [PubMed] [Google Scholar]
- 118.Gustafsson A, Jacobsson L, Johansson A, Moonen M, Tylen U, Bake B. Evaluation of various attenuation corrections in lung SPECT in healthy subjects. Nucl Med Commun 24: 1087–1095, 2003. [DOI] [PubMed] [Google Scholar]
- 119.Guy HJ, Gaines RA, Hill PM, Wagner PD, West JB. Computerized, noninvasive tests of lung function. A flexible approach using mass spectrometry. Am Rev Respir Dis 113: 737–744, 1976. [DOI] [PubMed] [Google Scholar]
- 120.Hachulla AL, Pontana F, Wemeau-Stervinou L, Khung S, Faivre JB, Wallaert B, Cazaubon JF, Duhamel A, Perez T, Devos P, Remy J, Remy-Jardin M. Krypton ventilation imaging using dual-energy CT in chronic obstructive pulmonary disease patients: Initial experience. Radiology 263: 253–259, 2012. [DOI] [PubMed] [Google Scholar]
- 121.Haczku A, Emami K, Fischer MC, Kadlecek S, Ishii M, Panettieri RA, Rizi RR. Hyperpolarized 3He MRI in asthma measurements of regional ventilation following allergic sensitization and challenge in mice—Preliminary results. Acad Radiol 12: 1362–1370, 2005. [DOI] [PubMed] [Google Scholar]
- 122.Hale SL, Alker KJ, Kloner RA. Evaluation of nonradioactive, colored microspheres for measurement of regional myocardial blood flow in dogs. Circulation 78: 428–434, 1988. [DOI] [PubMed] [Google Scholar]
- 123.Hamedani H, Clapp JT, Kadlecek SJ, Emami K, Ishii M, Gefter WB, Xin Y, Cereda M, Shaghaghi H, Siddiqui S. Regional fractional ventilation by using multibreath wash-in 3He MR imaging. Radiology 279: 917–924, 2016. [DOI] [PMC free article] [PubMed] [Google Scholar]
- 124.Hamedani H, Shaghaghi H, Kadlecek SJ, Xin Y, Han B, Siddiqui S, Rajaei J, Ishii M, Rossman M, Rizi RR. Vertical gradients in regional alveolar oxygen tension in supine human lung imaged by hyperpolarized 3He MRI. NMR Biomed 27: 1439–1450, 2014. [DOI] [PMC free article] [PubMed] [Google Scholar]
- 125.Hammond MD, Gale GE, Kapitan KS, Ries A, Wagner PD. Pulmonary gas exchange in humans during exercise at sea level. J Appl Physiol (1985) 60: 1590–1598, 1986. [DOI] [PubMed] [Google Scholar]
- 126.Hammond MD, Gale GE, Kapitan KS, Ries A, Wagner PD. Pulmonary gas exchange in humans during normobaric hypoxic exercise. J Appl Physiol (1985) 61: 1749–1757, 1986. [DOI] [PubMed] [Google Scholar]
- 127.Happer W. Optical Pumping. Rev Mod Phys 44: 169–249, 1972. [Google Scholar]
- 128.Happer W, Miron E, Schaefer S, Schreiber D, Wijngaarden W, Zeng X. Polarization of the nuclear spins of noble-gas atoms by spin-exchange with optically pumped alkali-metal atoms. Phys Rev A 29: 3092, 1984. [Google Scholar]
- 129.Harf A, Pratt T, Hughes JMB. Regional Distribution of Va-Q in man at rest and with exercise measured with krypton-81m. J Appl Physiol 44: 115–123, 1978. [DOI] [PubMed] [Google Scholar]
- 130.Harrach B, Ullrich M. Resolution guarantees in electrical impedance tomography. IEEE Trans Med Imaging 34: 1513–1521, 2015. [DOI] [PubMed] [Google Scholar]
- 131.Hatabu H, Tadamura E, Levin DL, Chen Q, Li W, Kim D, Prasad PV, Edelman RR. Quantitative assessment of pulmonary perfusion with dynamic contrast-enhanced MRI. Magn Reson Med 42: 1033–1038, 1999. [DOI] [PubMed] [Google Scholar]
- 132.Hedenstierna G. Atelectasis formation and gas exchange impairment during anaesthesia. Monaldi Arch Chest Dis 49: 315–322, 1994. [PubMed] [Google Scholar]
- 133.Hedlund LW, Vock P, Effmann EL. Computed tomography of the lung. Densitometric studies. Radiol Clin North Am 21: 775–788, 1983. [PubMed] [Google Scholar]
- 134.Henderson AC, Prisk GK, Levin DL, Hopkins SR, Buxton RB. Characterizing pulmonary blood flow distribution measured using arterial spin labeling. NMR Biomed 22: 1025–1035, 2009. [DOI] [PMC free article] [PubMed] [Google Scholar]
- 135.Henderson AC, Sa RC, Theilmann RJ, Buxton RB, Prisk GK, Hopkins SR. The gravitational distribution of ventilation-perfusion ratio is more uniform in prone than supine posture in the normal human lung. J Appl Physiol (1985) 115: 313–324, 2013. [DOI] [PMC free article] [PubMed] [Google Scholar]
- 136.Henry FS, Butler JP, Tsuda A. Kinematically irreversible acinar flow: A departure from classical dispersive aerosol transport theories. J Appl Physiol (1985) 92: 835–845, 2002. [DOI] [PubMed] [Google Scholar]
- 137.Herbert DL, Gur D, Shabason L, Good WF, Rinaldo JE, Snyder JV, Borovetz HS, Mancici MC. Mapping of human local pulmonary ventilation by xenon enhanced computed tomography. J Comput Assist Tomogr 6: 1088–1093, 1982. [DOI] [PubMed] [Google Scholar]
- 138.Heymann MA, Payne BD, Hoffman JI, Rudolph AM. Blood flow measurements with radionuclide-labeled particles. Prog Cardiovasc Dis 20: 55–79, 1977. [DOI] [PubMed] [Google Scholar]
- 139.Hinz J, Neumann P, Dudykevych T, Andersson LG, Wrigge H, Burchardi H, Hedenstierna G. Regional ventilation by electrical impedance tomography: A comparison with ventilation scintigraphy in pigs. Chest 124: 314–322, 2003. [DOI] [PubMed] [Google Scholar]
- 140.Hlastala MP. Multiple inert gas elimination technique. J Appl Physiol Respir Environ Exerc Physiol 56: 1–7, 1984. [DOI] [PubMed] [Google Scholar]
- 141.Hlastala MP. The alcohol breath test—A review. J Appl Physiol (1985) 84: 401–408, 1998. [DOI] [PubMed] [Google Scholar]
- 142.Hlastala MP, Lamm WJ, Karp A, Polissar NL, Starr IR, Glenny RW. Spatial distribution of hypoxic pulmonary vasoconstriction in the supine pig. J Appl Physiol (1985) 96: 1589–1599, 2004. [DOI] [PubMed] [Google Scholar]
- 143.Hoffman EA, Chon D. Computed tomography studies of lung ventilation and perfusion. Proc Am Thorac Soc 2: 492–498, 506, 2005. [DOI] [PMC free article] [PubMed] [Google Scholar]
- 144.Hoffman EA, Tajik JK, Kugelmass SD. Matching pulmonary structure and perfusion via combined dynamic multislice CT and thin-slice high-resolution CT. Comput Med Imaging Graph 19: 101–112, 1995. [DOI] [PubMed] [Google Scholar]
- 145.Holverda S, Theilmann RJ, Sa RC, Arai TJ, Hall ET, Dubowitz DJ, Prisk GK, Hopkins SR. Measuring lung water: Ex vivo validation of multi-image gradient echo MRI. J Magn Reson Imaging 34: 220–224, 2011. [DOI] [PMC free article] [PubMed] [Google Scholar]
- 146.Honda N, Osada H, Watanabe W, Nakayama M, Nishimura K, Krauss B, Otani K. Imaging of ventilation with dual-energy CT during breath hold after single vital-capacity inspiration of stable xenon. Radiology 262: 262–268, 2012. [DOI] [PubMed] [Google Scholar]
- 147.Hong SR, Chang S, Im DJ, Suh YJ, Hong YJ, Hur J, Kim YJ, Choi BW, Lee HJ. Feasibility of single scan for simultaneous evaluation of regional krypton and iodine concentrations with dual-energy CT: An experimental study. Radiology 281: 597–605, 2016. [DOI] [PubMed] [Google Scholar]
- 148.Hopkins SR, Bayly WM, Slocombe RF, Wagner H, Wagner PD. Effect of prolonged heavy exercise on pulmonary gas exchange in horses. J Appl Physiol (1985) 84: 1723–1730, 1998. [DOI] [PubMed] [Google Scholar]
- 149.Hopkins SR, Elliott AR, Prisk GK, Darquenne C. Ventilation heterogeneity measured by multiple breath inert gas testing is not affected by inspired oxygen concentration in healthy humans. J Appl Physiol 122: 1379–1387, 2017. [DOI] [PMC free article] [PubMed] [Google Scholar]
- 150.Hopkins SR, Garg J, Bolar DS, Balouch J, Levin DL. Pulmonary blood flow heterogeneity during hypoxia and high-altitude pulmonary edema. Am J Respir Crit Care Med 171: 83–87, 2005. [DOI] [PubMed] [Google Scholar]
- 151.Hopkins SR, Gavin TP, Siafakas NM, Haseler LJ, Olfert IM, Wagner H, Wagner PD. Effect of prolonged, heavy exercise on pulmonary gas exchange in athletes. J Appl Physiol (1985) 85: 1523–1532, 1998. [DOI] [PubMed] [Google Scholar]
- 152.Hopkins SR, Henderson AC, Levin DL, Yamada K, Arai T, Buxton RB, Prisk GK. Vertical gradients in regional lung density and perfusion in the supine human lung: The Slinky effect. J Appl Physiol (1985) 103: 240–248, 2007. [DOI] [PMC free article] [PubMed] [Google Scholar]
- 153.Hopkins SR, Hicks JW, Cooper TK, Powell FL. Ventilation and pulmonary gas exchange during exercise in the savannah monitor lizard (Varanus exanthematicus). J Exp Biol 198: 1783–1789, 1995. [DOI] [PubMed] [Google Scholar]
- 154.Hopkins SR, Kleinsasser A, Bernard S, Loeckinger A, Falor E, Neradilek B, Polissar NL, Hlastala MP. Hypoxia has a greater effect than exercise on the redistribution of pulmonary blood flow in swine. J Appl Physiol (1985) 103: 2112–2119, 2007. [DOI] [PubMed] [Google Scholar]
- 155.Hopkins SR, Levin DL. Heterogeneous pulmonary blood flow in response to hypoxia: A risk factor for high altitude pulmonary edema? Respir Physiol Neurobiol 151: 217–228, 2006. [DOI] [PubMed] [Google Scholar]
- 156.Hopkins SR, Levin DL, Emami K, Kadlecek S, Yu J, Ishii M, Rizi RR. Advances in magnetic resonance imaging of lung physiology. J Appl Physiol (1985) 102: 1244–1254, 2007. [DOI] [PubMed] [Google Scholar]
- 157.Hopkins SR, McKenzie DC, Schoene RB, Glenny RW, Robertson HT. Pulmonary gas exchange during exercise in athletes. I. Ventilation-perfusion mismatch and diffusion limitation. J Appl Physiol (1985) 77: 912–917, 1994. [DOI] [PubMed] [Google Scholar]
- 158.Hopkins SR, Olfert IM, Wagner PD. Point: Exercise-induced intrapulmonary shunting is imaginary. J Appl Physiol (1985) 107: 993–994, 2009. [DOI] [PMC free article] [PubMed] [Google Scholar]
- 159.Hopkins SR, Prisk GK. Lung perfusion measured using magnetic resonance imaging: New tools for physiological insights into the pulmonary circulation. J Magn Reson Imaging 32: 1287–1301, 2010. [DOI] [PMC free article] [PubMed] [Google Scholar]
- 160.Hopkins SR, Wagner PD. The Multiple Inert Gas Elimination Technique (MIGET). New York, NY: Springer, 2017, p. xiii, 329 pages. [Google Scholar]
- 161.Hsia CC, Herazo LF, Ramanathan M, Johnson RL Jr, Wagner PD. Cardiopulmonary adaptations to pneumonectomy in dogs. II. VA/Q relationships and microvascular recruitment. J Appl Physiol (1985) 74: 1299–1309, 1993. [DOI] [PubMed] [Google Scholar]
- 162.Hughes J. Short-lived radionuclides and regional lung function. Br J Radiol 52: 353–370, 1979. [DOI] [PubMed] [Google Scholar]
- 163.Hughes JM, Glazier JB, Maloney JE, West JB. Effect of lung volume on the distribution of pulmonary blood flow in man. Respir Physiol 4: 58–72, 1968. [DOI] [PubMed] [Google Scholar]
- 164.Hysing B, Dahl LE, Varnauskas E. Determination of cardiac output with cardio green in a direct writing colorimeter. Scand J Clin Lab Invest 14: 430–434, 1962. [DOI] [PubMed] [Google Scholar]
- 165.Inkley SR, Macintyre WJ. Dynamic measurement of ventilation-perfusion with Xenon-133 at resting lung volumes. Am Rev Respir Dis 107: 429–441, 1973. [DOI] [PubMed] [Google Scholar]
- 166.Iyer KS, Newell JD Jr, Jin D, Fuld MK, Saha PK, Hansdottir S, Hoffman EA. Quantitative dual-energy computed tomography supports a vascular etiology of smoking-induced inflammatory lung disease. Am J Respir Crit Care Med 193: 652–661, 2016. [DOI] [PMC free article] [PubMed] [Google Scholar]
- 167.Jacob RE, Lamm WJ, Einstein DR, Krueger MA, Glenny RW, Corley RA. Comparison of CT-derived ventilation maps with deposition patterns of inhaled microspheres in rats. Exp Lung Res 41: 135–145, 2015. [DOI] [PMC free article] [PubMed] [Google Scholar]
- 168.Jakob PM, Wang T, Schultz G, Hebestreit H, Hebestreit A, Hahn D. Assessment of human pulmonary function using oxygen-enhanced T(1) imaging in patients with cystic fibrosis. Magn Reson Med 51: 1009–1016, 2004. [DOI] [PubMed] [Google Scholar]
- 169.Jean-Christophe R, Janier M, Lavenne F, Tourvieille C. Quantitative assessment of regional alveolar ventilation and gas volume using 13NN2 washout and PET. J Nucl Med 46: 1375, 2005. [PubMed] [Google Scholar]
- 170.Jernudd-Wilhelmsson Y, Hornblad Y, Hedenstierna G. Ventilation-perfusion relationships in interstitial lung disease. Eur J Respir Dis 68: 39–49, 1986. [PubMed] [Google Scholar]
- 171.Johns CS, Swift AJ, Hughes PJC, Ohno Y, Schiebler M, Wild JM. Pulmonary MR angiography and perfusion imaging—A review of methods and applications. Eur J Radiol 86: 361–370, 2017. [DOI] [PubMed] [Google Scholar]
- 172.Johnson TR. Dual-energy CT: General principles. AJR Am J Roentgenol 199: S3–S8, 2012. [DOI] [PubMed] [Google Scholar]
- 173.Johnson TR, Krauss B, Sedlmair M, Grasruck M, Bruder H, Morhard D, Fink C, Weckbach S, Lenhard M, Schmidt B, Flohr T, Reiser MF, Becker CR. Material differentiation by dual energy CT: Initial experience. Eur Radiol 17: 1510–1517, 2007. [DOI] [PubMed] [Google Scholar]
- 174.Jones AT, Hansell DM, Evans TW. Pulmonary perfusion in supine and prone positions: An electron-beam computed tomography study. J Appl Physiol (1985) 90: 1342–1348, 2001. [DOI] [PubMed] [Google Scholar]
- 175.Jones AW. Determination of liquid/air partition coefficients for dilute solutions of ethanol in water, whole blood, and plasma. J Anal Toxicol 7: 193–197, 1983. [DOI] [PubMed] [Google Scholar]
- 176.Jonk AM, van den Berg IP, Olfert IM, Wray DW, Arai T, Hopkins SR, Wagner PD. Effect of acetazolamide on pulmonary and muscle gas exchange during normoxic and hypoxic exercise. J Physiol 579: 909–921, 2007. [DOI] [PMC free article] [PubMed] [Google Scholar]
- 177.Kallas HJ, Domino KB, Glenny RW, Anderson EA, Hlastala MP. Pulmonary blood flow redistribution with low levels of positive end-expiratory pressure. Anesthesiology 88: 1291–1299, 1998. [DOI] [PubMed] [Google Scholar]
- 178.Kastler A. Quelques suggestions concernant la production optique et la détection optique d’une inégalité de population des niveaux de quantifigation spatiale des atomes. Application à l’expérience de Stern et Gerlach et à la résonance magnétique. J Phys Radium 11: 255–265, 1950. [Google Scholar]
- 179.Kauczor HU, Hofmann D, Kreitner KF, Nilgens H, Surkau R, Heil W, Potthast A, Knopp MV, Otten EW, Thelen M. Normal and abnormal pulmonary ventilation: Visualization at hyperpolarized He-3 MR imaging. Radiology 201: 564–568, 1996. [DOI] [PubMed] [Google Scholar]
- 180.Kaushik SS, Freeman MS, Yoon SW, Liljeroth MG, Stiles JV, Roos JE, Michael Foster WS, Rackley CR, McAdams HP, Driehuys B. Measuring diffusion limitation with a perfusion-limited gas—Hyperpolarized 129Xe gas-transfer spectroscopy in patients with idiopathic pulmonary fibrosis. J Appl Physiol 117: 577–585, 2014. [DOI] [PMC free article] [PubMed] [Google Scholar]
- 181.Kaushik SS, Robertson SH, Freeman MS, He M, Kelly KT, Roos JE, Rackley CR, Foster WM, McAdams HP, Driehuys B. Single-breath clinical imaging of hyperpolarized 129xe in the airspaces, barrier, and red blood cells using an interleaved 3D radial 1-point Dixon acquisition. Magn Reson Med 75: 1434–1443, 2016. [DOI] [PMC free article] [PubMed] [Google Scholar]
- 182.Kern AL, Gutberlet M, Qing K, Voskrebenzev A, Klimeš F, Kaireit TF, Czerner C, Biller H, Wacker F, Ruppert K. Regional investigation of lung function and microstructure parameters by localized 129Xe chemical shift saturation recovery and dissolved-phase imaging: A reproducibility study. Magn Reson Med, 81 (1): 13–24, 2019. [DOI] [PubMed] [Google Scholar]
- 183.Kety S. Measurement of local blood flow by the exchange of an inert, diffusible substance. Methods Med Res 8: 228–236, 1960. [Google Scholar]
- 184.Kety SS. The theory and applications of the exchange of inert gas at the lungs and tissues. Pharmacol Rev 3: 1–41, 1951. [PubMed] [Google Scholar]
- 185.Kety SS, Schmidt CF. The nitrous oxide method for the quantitative determination of cerebral blood flow in man: Theory, procedure and normal values. J Clin Invest 27: 476–483, 1948. [DOI] [PMC free article] [PubMed] [Google Scholar]
- 186.Kotzerke J, Andreeff M, Wunderlich G. PET aerosol lung scintigraphy using Galligas. Eur J Nucl Med Mol Imaging 37: 175–177, 2010. [DOI] [PubMed] [Google Scholar]
- 187.Kowallik P, Schulz R, Guth BD, Schade A, Paffhausen W, Gross R, Heusch G. Measurement of regional myocardial blood flow with multiple colored microspheres. Circulation 83: 974–982, 1991. [DOI] [PubMed] [Google Scholar]
- 188.Kreck TC, Krueger MA, Altemeier WA, Sinclair SE, Robertson HT, Shade ED, Hildebrandt J, Lamm WJE, Frazer DA, Polissar NL, Hlastala MP. Determination of regional ventilation and perfusion in the lung using xenon and computed tomography. J Appl Physiol (1985) 91: 1741–1749, 2001. [DOI] [PubMed] [Google Scholar]
- 189.Kubicek W, Kottke F, Ramos MU, Patterson R, Witsoe D, Labree J, Remole W, Layman T, Schoening H, Garamela J. The Minnesota impedance cardiograph-theory and applications. Biomed Eng 9 (9): 410–416, 1974. [PubMed] [Google Scholar]
- 190.Kuethe DO, Caprihan A, Fukushima E, Waggoner RA. Imaging lungs using inert fluorinated gases. Magn Reson Med 39: 85–88, 1998. [DOI] [PubMed] [Google Scholar]
- 191.Kuethe DO, Caprihan A, Gach HM, Lowe IJ, Fukushima E. Imaging obstructed ventilation with NMR using inert fluorinated gases. J Appl Physiol (1985) 88: 2279–2286, 2000. [DOI] [PubMed] [Google Scholar]
- 192.Kuethe DO, Pietrass T, Behr VC. Inert fluorinated gas T1 calculator. J Magn Reson 177: 212–220, 2005. [DOI] [PubMed] [Google Scholar]
- 193.Kunst PW, Vonk Noordegraaf A, Hoekstra OS, Postmus PE, de Vries PM. Ventilation and perfusion imaging by electrical impedance tomography: A comparison with radionuclide scanning. Physiol Meas 19: 481–490, 1998. [DOI] [PubMed] [Google Scholar]
- 194.Lamm WJE, Starr IR, Neradilek B, Polissar NL, Glenny RW, Hlastala MP. Hypoxic pulmonary vasoconstriction is heterogeneously distributed in the prone dog. Respir Physiol Neurobiol 144: 281–294, 2004. [DOI] [PubMed] [Google Scholar]
- 195.Leawoods J, Yablonskiy D, Saam B, Gierada D, Conradi MS. Hyperpolarized 3He gas production and MR imaging of the lung. Concept Magn Reson 13: 277–278, 2001. [Google Scholar]
- 196.Lewis SM, Evans JW, Jalowayski AA. Continuous distributions of specific ventilation recovered from inert gas washout. J Appl Physiol Respir Environ Exerc Physiol 44: 416–423, 1978. [DOI] [PubMed] [Google Scholar]
- 197.Lionheart WR. EIT reconstruction algorithms: Pitfalls, challenges and recent developments. Physiol Meas 25: 125–142, 2004. [DOI] [PubMed] [Google Scholar]
- 198.Lipson D, van Beek E. Functional Lung Imaging. USA: Taylor & Francis, 2005. [Google Scholar]
- 199.MacFall JR, Charles HC, Black RD, Middleton H, Swartz JC, Saam B, Driehuys B, Erickson C, Happer W, Cates GD, Johnson GA, Ravin CE. Human lung air spaces: Potential for MR imaging with hyperpolarized He-3. Radiology 200: 553–558, 1996. [DOI] [PubMed] [Google Scholar]
- 200.Macklem PT. Symbols and abbreviations. Supplement 10. Handbook of Physiology, The Respiratory System, Circulation and Nonrespiratory Functions, Compr Physiol, 2011. DOI: 10.1002/cphy.cp0301fm03. [DOI] [Google Scholar]
- 201.Magnant J, Vecellio L, de Monte M, Grimbert D, Valat C, Boissinot E, Guilloteau D, Lemarie E, Diot P. Comparative analysis of different scintigraphic approaches to assess pulmonary ventilation. J Aerosol Med 19: 148–159, 2006. [DOI] [PubMed] [Google Scholar]
- 202.Mai VM. Hyperpolarized gas and oxygen-enhanced magnetic resonance imaging. Methods Mol Med 124: 325–345, 2006. [DOI] [PubMed] [Google Scholar]
- 203.Mai VM, Bankier AA, Prasad PV, Li W, Storey P, Edelman RR, Chen Q. MR ventilation-perfusion imaging of human lung using oxygen-enhanced and arterial spin labeling techniques. J Magn Reson Imaging 14: 574–579, 2001. [DOI] [PubMed] [Google Scholar]
- 204.Mai VM, Berr SS. MR perfusion imaging of pulmonary parenchyma using pulsed arterial spin labeling techniques: FAIRER and FAIR. J Magn Reson Imaging 9: 483–487, 1999. [DOI] [PubMed] [Google Scholar]
- 205.Mai VM, Chen Q, Bankier AA, Edelman RR. Multiple inversion recovery MR subtraction imaging of human ventilation from inhalation of room air and pure oxygen. Magn Reson Med 43: 913–916, 2000. [DOI] [PubMed] [Google Scholar]
- 206.Mai VM, Hagspiel KD, Christopher JM, Do HM, Altes T, Knight-Scott J, Stith AL, Maier T, Berr SS. Perfusion imaging of the human lung using flow-sensitive alternating inversion recovery with an extra radiofrequency pulse (FAIRER). Magn Reson Imaging 17: 355–361, 1999. [DOI] [PubMed] [Google Scholar]
- 207.Mai VM, Knight-Scott J, Berr SS. Improved visualization of the human lung in 1H MRI using multiple inversion recovery for simultaneous suppression of signal contributions from fat and muscle. Magn Reson Med 41: 866–870, 1999. [DOI] [PubMed] [Google Scholar]
- 208.Mai VM, Liu B, Li W, Polzin J, Kurucay S, Chen Q, Edelman RR. Influence of oxygen flow rate on signal and T(1) changes in oxygen-enhanced ventilation imaging. J Magn Reson Imaging 16: 37–41, 2002. [DOI] [PubMed] [Google Scholar]
- 209.Mai VM, Tutton S, Prasad PV, Chen Q, Li W, Chen C, Liu B, Polzin J, Kurucay S, Edelman RR. Computing oxygen-enhanced ventilation maps using correlation analysis. Magn Reson Med 49: 591–594, 2003. [DOI] [PubMed] [Google Scholar]
- 210.Maier A, Steidl S, Christlein V, Hornegger J. Medical Imaging Systems: An Introductory Guide. Cham Switzerland: Springer, 2018. [PubMed] [Google Scholar]
- 211.Månsson S, Wolber J, Driehuys B, Wollmer P, Golman K. Characterization of diffusing capacity and perfusion of the rat lung in a lipopolysaccaride disease model using hyperpolarized 129Xe. Magn Reson Med 50: 1170–1179, 2003. [DOI] [PubMed] [Google Scholar]
- 212.Marcucci C, Nyhan D, Simon BA. Distribution of pulmonary ventilation using Xe-enhanced computed tomography in prone and supine dogs. J Appl Physiol (1985) 90: 421–430, 2001. [DOI] [PubMed] [Google Scholar]
- 213.Melo MFV, Harris RS, Layfield D, Musch G, Venegas JG. Changes in regional ventilation after autologous blood clot pulmonary embolism. Anesthesiology 97: 671–681, 2002. [DOI] [PubMed] [Google Scholar]
- 214.Melot C, Naeije R, Mols P, Vandenbossche JL, Denolin H. Effects of nifedipine on ventilation/perfusion matching in primary pulmonary hypertension. Chest 83: 203–207, 1983. [DOI] [PubMed] [Google Scholar]
- 215.Melsom MN, Kramer-Johansen J, Flatebo T, Muller C, Nicolaysen G. Distribution of pulmonary ventilation and perfusion measured simultaneously in awake goats. Acta Physiol Scand 159: 199–208, 1997. [DOI] [PubMed] [Google Scholar]
- 216.Mettler FA Jr, Huda W, Yoshizumi TT, Mahesh M. Effective doses in radiology and diagnostic nuclear medicine: A catalog. Radiology 248: 254–263, 2008. [DOI] [PubMed] [Google Scholar]
- 217.Miller GW, Altes TA, Brookeman JR, De Lange EE, Mugler JP III. Hyperpolarized 3He lung ventilation imaging with B1-inhomogeneity correction in a single breath-hold scan. MAGMA 16: 218–226, 2004. [DOI] [PubMed] [Google Scholar]
- 218.Mintun MA, Ter-Pogossian MM, Green MA, Lich LL, Schuster DP. Quantitative measurement of regional pulmonary blood flow with positron emission tomography. J Appl Physiol (1985) 60: 317–326, 1986. [DOI] [PubMed] [Google Scholar]
- 219.Möller W, Felten K, Seitz J, Sommerer K, Takenaka S, Wiebert P, Philipson K, Svartengren M, Kreyling WG. A generator for the production of radiolabelled ultrafine carbonaceous particles for deposition and clearance studies in the respiratory tract. J Aerosol Sci 37: 631–644, 2006. [Google Scholar]
- 220.Monaghan P, Provan I, Murray C, Mackey DW, Van der Wall H, Walker BM, Jones PD. An improved radionuclide technique for the detection of altered pulmonary permeability. J Nucl Med 32: 1945–1949, 1991. [PubMed] [Google Scholar]
- 221.Morita Y, Payne BD, Aldea GS, McWatters C, Husseini W, Mori H, Hoffman JI, Kaufman L. Local blood flow measured by fluorescence excitation of nonradioactive microspheres. Am J Physiol 258: H1573–H1584, 1990. [DOI] [PubMed] [Google Scholar]
- 222.Mure M, Domino KB, Lindahl SGE, Hlastala MP, Altemeier WA, Glenny RW. Regional ventilation-perfusion distribution is more uniform in the prone position. J Appl Physiol (1985) 88: 1076–1083, 2000. [DOI] [PubMed] [Google Scholar]
- 223.Musch G, Layfield JD, Harris RS, Melo MF, Winkler T, Callahan RJ, Fischman AJ, Venegas JG. Topographical distribution of pulmonary perfusion and ventilation, assessed by PET in supine and prone humans. J Appl Physiol (1985) 93: 1841–1851, 2002. [DOI] [PubMed] [Google Scholar]
- 224.Musch G, Venegas JG. Positron emission tomography imaging of regional pulmonary perfusion and ventilation. Proc Am Thorac Soc 2: 522–527, 508–529, 2005. [DOI] [PMC free article] [PubMed] [Google Scholar]
- 225.Musch G, Venegas JG. Positron emission tomography imaging of regional lung function. Minerva Anestesiol 72: 363–367, 2006. [PubMed] [Google Scholar]
- 226.Naidich DP, Marshall CH, Gribbin C, Arams RS, McCauley DI. Low-dose CT of the lungs: Preliminary observations. Radiology 175: 729–731, 1990. [DOI] [PubMed] [Google Scholar]
- 227.Naish JH, Parker GJ, Beatty PC, Jackson A, Young SS, Waterton JC, Taylor CJ. Improved quantitative dynamic regional oxygen-enhanced pulmonary imaging using image registration. Magn Reson Med 54: 464–469, 2005. [DOI] [PubMed] [Google Scholar]
- 228.Newell JC, Blue RS, Isaacson D, Saulnier GJ, Ross AS. Phasic three-dimensional impedance imaging of cardiac activity. Physiol Meas 23: 203–209, 2002. [DOI] [PubMed] [Google Scholar]
- 229.Nyren S, Radell P, Lindahl SG, Mure M, Petersson J, Larsson SA, Jacobsson H, Sanchez-Crespo A. Lung ventilation and perfusion in prone and supine postures with reference to anesthetized and mechanically ventilated healthy volunteers. Anesthesiology 112: 682–687, 2010. [DOI] [PubMed] [Google Scholar]
- 230.O’Doherty MJ, Peters AM. Pulmonary technetium-99m diethylene triamine penta-acetic acid aerosol clearance as an index of lung injury. Eur J Nucl Med 24: 81–87, 1997. [DOI] [PMC free article] [PubMed] [Google Scholar]
- 231.Ohno Y, Hatabu H, Higashino T, Nogami M, Takenaka D, Watanabe H, Van Cauteren M, Yoshimura M, Satouchi M, Nishimura Y, Sugimura K. Oxygen-enhanced MR imaging: Correlation with postsurgical lung function in patients with lung cancer. Radiology 236: 704–711, 2005. [DOI] [PubMed] [Google Scholar]
- 232.Orphanidou D, Hughes JM, Myers MJ, Al-Suhali AR, Henderson B. Tomography of regional ventilation and perfusion using krypton 81m in normal subjects and asthmatic patients. Thorax 41: 542–551, 1986. [DOI] [PMC free article] [PubMed] [Google Scholar]
- 233.Parker JA, Coleman RE, Grady E, Royal HD, Siegel BA, Stabin MG, Sostman HD, Hilson AJ, Society of Nuclear Medicine. SNM practice guideline for lung scintigraphy 4.0. J Nucl Med Technol 40: 57–65, 2012. [DOI] [PubMed] [Google Scholar]
- 234.Parr DG, Stoel BC, Stolk J, Stockley RA. Validation of computed tomographic lung densitometry for monitoring emphysema in alpha1-antitrypsin deficiency. Thorax 61: 485–490, 2006. [DOI] [PMC free article] [PubMed] [Google Scholar]
- 235.Patel S, Kazerooni EA. Helical CT for the evaluation of acute pulmonary embolism. AJR Am J Roentgenol 185: 135–149, 2005. [DOI] [PubMed] [Google Scholar]
- 236.Pérez-Sánchez JM, de Alejo RP, Rodríguez I, Cortijo M, Peces-Barba G, Ruiz-Cabello J. In vivo diffusion weighted 19F MRI using SF6. Magn Reson Med 54: 460–463, 2005. [DOI] [PubMed] [Google Scholar]
- 237.Petersilka M, Stierstorfer K, Bruder H, Flohr T. Strategies for scatter correction in dual source CT. Med Phys 37: 5971–5992, 2010. [DOI] [PubMed] [Google Scholar]
- 238.Petersson J, Ax M, Frey J, Sanchez-Crespo A, Lindahl SG, Mure M. Positive end-expiratory pressure redistributes regional blood flow and ventilation differently in supine and prone humans. Anesthesiology 113: 1361–1369, 2010. [DOI] [PubMed] [Google Scholar]
- 239.Petersson J, Glenny RW. Imaging regional PAO2 and gas exchange. J Appl Physiol (1985) 113: 340–352, 2012. [DOI] [PubMed] [Google Scholar]
- 240.Petersson J, Rohdin M, Sanchez-Crespo A, Nyren S, Jacobsson H, Larsson SA, Lindahl SG, Linnarsson D, Neradilek B, Polissar NL, Glenny RW, Mure M. Posture primarily affects lung tissue distribution with minor effect on blood flow and ventilation. Respir Physiol Neurobiol 156: 293–303, 2007. [DOI] [PubMed] [Google Scholar]
- 241.Petersson J, Rohdin M, Sanchez-Crespo A, Nyren S, Jacobsson H, Larsson SA, Lindahl SG, Linnarsson D, Neradilek B, Polissar NL, Glenny RW, Mure M. Regional lung blood flow and ventilation in upright humans studied with quantitative SPECT. Respir Physiol Neurobiol 166: 54–60, 2009. [DOI] [PubMed] [Google Scholar]
- 242.Petersson J, Sanchez-Crespo A, Larsson SA, Mure M. Physiological imaging of the lung: Single-photon-emission computed tomography (SPECT). J Appl Physiol (1985) 102: 468–476, 2007. [DOI] [PubMed] [Google Scholar]
- 243.Petersson J, Sanchez-Crespo A, Rohdin M, Montmerle S, Nyren S, Jacobsson H, Larsson SA, Lindahl SG, Linnarsson D, Glenny RW, Mure M. Physiological evaluation of a new quantitative SPECT method measuring regional ventilation and perfusion. J Appl Physiol (1985) 96: 1127–1136, 2004. [DOI] [PubMed] [Google Scholar]
- 244.Piiper J, Scheid P. Model for capillary-alveolar equilibration with special reference to O2 uptake in hypoxia. Respir Physiol 46: 193–208, 1981. [DOI] [PubMed] [Google Scholar]
- 245.Podolsky A, Eldridge MW, Richardson RS, Knight DR, Johnson EC, Hopkins SR, Johnson DH, Michimata H, Grassi B, Feiner J, Kurdak SS, Bickler PE, Severinghaus JW, Wagner PD. Exercise-induced VA/Q inequality in subjects with prior high-altitude pulmonary edema. J Appl Physiol (1985) 81: 922–932, 1996. [DOI] [PubMed] [Google Scholar]
- 246.Pracht ED, Arnold JF, Wang T, Jakob PM. Oxygen-enhanced proton imaging of the human lung using T2. Magn Reson Med 53: 1193–1196, 2005. [DOI] [PubMed] [Google Scholar]
- 247.Prince JL, Links JM. Medical Imaging Signals and Systems. Upper Saddle River, NJ: Pearson Prentice Hall, 2006. [Google Scholar]
- 248.Prinzen FW, Bassingthwaighte JB. Blood flow distributions by microsphere deposition methods. Cardiovasc Res 45: 13–21, 2000. [DOI] [PMC free article] [PubMed] [Google Scholar]
- 249.Prinzen FW, Glenny RW. Developments in non-radioactive microsphere techniques for blood flow measurement. Cardiovasc Res 28: 1467–1475, 1994. [DOI] [PubMed] [Google Scholar]
- 250.Prisk GK, Elliott AR, Guy HJ, Kosonen JM, West JB. Pulmonary gas exchange and its determinants during sustained microgravity on Spacelabs SLS-1 and SLS-2. J Appl Physiol (1985) 79: 1290–1298, 1995. [DOI] [PubMed] [Google Scholar]
- 251.Prisk GK, Guy HJ, West JB, Reed JW. Validation of measurements of ventilation-to-perfusion ratio inequality in the lung from expired gas. J Appl Physiol (1985) 94: 1186–1192, 2003. [DOI] [PubMed] [Google Scholar]
- 252.Prisk GK, Hopkins SR. Pulmonary gas exchange. In: Colloquium Series on Integrated Systems Physiology, p. 1. online resource (1 PDF (viii, 77 pages)). [Google Scholar]
- 253.Prisk GK, Lauzon AM, Verbanck S, Elliot AR, Guy HJ, Paiva M, West JB. Anomalous behavior of helium and sulfur hexafluoride during single-breath tests in sustained microgravity. J Appl Physiol (1985) 80: 1126–1132, 1996. [DOI] [PubMed] [Google Scholar]
- 254.Prisk GK, Yamada K, Henderson AC, Arai TJ, Levin DL, Buxton RB, Hopkins SR. Pulmonary perfusion in the prone and supine postures in the normal human lung. J Appl Physiol (1985) 103: 883–894, 2007. [DOI] [PMC free article] [PubMed] [Google Scholar]
- 255.Radiation dose to patients from radiopharmaceuticals. A report of a task group of committee 2 of the International Commission on Radiological Protection. Ann ICRP 18: 1–377, 1987. [PubMed] [Google Scholar]
- 256.Radiology, American College. ACR Manual on Contrast Media. Version 10.3. Reston, VA: American College of Radiology, 2017, p. 81–89. [Google Scholar]
- 257.Rahn H. A concept of mean alveolar air and the ventilation-blood flow relationships during pulmonary gas exchange. Am J Physiol 158: 21–30, 1949. [DOI] [PubMed] [Google Scholar]
- 258.Rahn H, Fenn WO. Graphical Analysis of the Respiratory Gas Exchange: The O2 CO2 Diagram. Bethseda, MD: American Physiological Society, 1955. [Google Scholar]
- 259.Ralph DD, Robertson HT, Weaver LJ, Hlastala MP, Carrico CJ, Hudson LD. Distribution of ventilation and perfusion during positive end-expiratory pressure in the adult respiratory distress syndrome. Am Rev Respir Dis 131: 54–60, 1985. [DOI] [PubMed] [Google Scholar]
- 260.Ramalho J, Semelka RC, Ramalho M, Nunes RH, AlObaidy M, Castillo M. Gadolinium-based contrast agent accumulation and toxicity: An update. AJNR Am J Neuroradiol 37: 1192–1198, 2016. [DOI] [PMC free article] [PubMed] [Google Scholar]
- 261.Reinhardt CP, Dalhberg S, Tries MA, Marcel R, Leppo JA. Stable labeled microspheres to measure perfusion: Validation of a neutron activation assay technique. Am J Physiol Heart Circ Physiol 280: H108–H116, 2001. [DOI] [PubMed] [Google Scholar]
- 262.Remy-Jardin M, Mastora I, Remy J. Pulmonary embolus imaging with multislice CT. Radiol Clin North Am 41: 507–519, 2003. [DOI] [PubMed] [Google Scholar]
- 263.Remy-Jardin M, Remy J, Wattinne L, Giraud F. Central pulmonary thromboembolism: Diagnosis with spiral volumetric CT with the single-breath-hold technique–Comparison with pulmonary angiography. Radiology 185: 381–387, 1992. [DOI] [PubMed] [Google Scholar]
- 264.Rhodes C, Valind S, Brudin L, Wollmer P, Jones T, Buckingham P, Hughes J. Quantification of regional V/Q ratios in humans by use of PET. II. Procedure and normal values. J Appl Physiol 66: 1905–1913, 1989. [DOI] [PubMed] [Google Scholar]
- 265.Rhodes C, Valind S, Brudin L, Wollmer P, Jones T, Hughes J. Quantification of regional V/Q ratios in humans by use of PET. I. Theory. J Appl Physiol 66: 1896–1904, 1989. [DOI] [PubMed] [Google Scholar]
- 266.Rhodes CG, Hughes JM. Pulmonary studies using positron emission tomography. Eur Respir J 8: 1001–1017, 1995. [PubMed] [Google Scholar]
- 267.Rice AJ, Thornton AT, Gore CJ, Scroop GC, Greville HW, Wagner H, Wagner PD, Hopkins SR. Pulmonary gas exchange during exercise in highly trained cyclists with arterial hypoxemia. J Appl Physiol (1985) 87: 1802–1812, 1999. [DOI] [PubMed] [Google Scholar]
- 268.Richard JC, Pouzot C, Gros A, Tourevieille C, Lebars D, Lavenne F, Frerichs I, Guerin C. Electrical impedance tomography compared to positron emission tomography for the measurement of regional lung ventilation: An experimental study. Crit Care 13: R82, 2009. [DOI] [PMC free article] [PubMed] [Google Scholar]
- 269.Riley RL, Cournand A. Ideal alveolar air and the analysis of ventilation-perfusion relationships in the lungs. J Appl Physiol 1: 825–847, 1949. [DOI] [PubMed] [Google Scholar]
- 270.Riley RL, Cournand A. Analysis of factors affecting partial pressures of oxygen and carbon dioxide in gas and blood of lungs; theory. J Appl Physiol 4: 77–101, 1951. [DOI] [PubMed] [Google Scholar]
- 271.Riley RL, Cournand A, Donald KW. Analysis of factors affecting partial pressures of oxygen and carbon dioxide in gas and blood of lungs; methods. J Appl Physiol 4: 102–120, 1951. [DOI] [PubMed] [Google Scholar]
- 272.Rizi RR, Baumgardner JE, Ishii M, Spector ZZ, Edvinsson JM, Jalali A, Yu J, Itkin M, Lipson DA, Gefter W. Determination of regional VA/Q by hyperpolarized 3He MRI. Magn Reson Med 52: 65–72, 2004. [DOI] [PubMed] [Google Scholar]
- 273.Robertson HT, Glenny RW, Stanford D, McInnes LM, Luchtel DL, Covert D. High-resolution maps of regional ventilation utilizing inhaled fluorescent microspheres. J Appl Physiol (1985) 82: 943–953, 1997. [DOI] [PubMed] [Google Scholar]
- 274.Robertson HT, Hlastala MP. Microsphere maps of regional blood flow and regional ventilation. J Appl Physiol (1985) 102: 1265–1272, 2007. [DOI] [PubMed] [Google Scholar]
- 275.Robertson HT, Kreck TC, Krueger MA. The spatial and temporal heterogeneity of regional ventilation: Comparison of measurements by two high-resolution methods. Respir Physiol Neurobiol 148: 85–95, 2005. [DOI] [PubMed] [Google Scholar]
- 276.Robertson HT, Krueger MA, Lamm WJ, Glenny RW. High-resolution spatial measurements of ventilation-perfusion heterogeneity in rats. J Appl Physiol (1985) 108: 1395–1401, 2010. [DOI] [PMC free article] [PubMed] [Google Scholar]
- 277.Robinson PJ, Kreel L. Pulmonary tissue attenuation with computed tomography: Comparison of inspiration and expiration scans. J Comput Assist Tomogr 3: 740–748, 1979. [PubMed] [Google Scholar]
- 278.Rogosnitzky M, Branch S. Gadolinium-based contrast agent toxicity: A review of known and proposed mechanisms. Biometals 29: 365–376, 2016. [DOI] [PMC free article] [PubMed] [Google Scholar]
- 279.Rosenblum LJ, Mauceri RA, Wellenstein DE, Thomas FD, Bassano DA, Raasch BN, Chamberlain CC, Heitzman ER. Density patterns in the normal lung as determined by computed tomography. Radiology 137: 409–416, 1980. [DOI] [PubMed] [Google Scholar]
- 280.Rudolph AM, Heymann MA. The circulation of the fetus in utero. Methods for studying distribution of blood flow, cardiac output and organ blood flow. Circ Res 21: 163–184, 1967. [DOI] [PubMed] [Google Scholar]
- 281.Ruiz-Cabello J, Barnett BP, Bottomley PA, Bulte JW. Fluorine (19F) MRS and MRI in biomedicine. NMR Biomed 24: 114–129, 2011. [DOI] [PMC free article] [PubMed] [Google Scholar]
- 282.Sa RC, Asadi AK, Theilmann RJ, Hopkins SR, Prisk GK, Darquenne C. Validating the distribution of specific ventilation in healthy humans measured using proton MR imaging. J Appl Physiol (1985) 116: 1048–1056, 2014. [DOI] [PMC free article] [PubMed] [Google Scholar]
- 283.Sa RC, Cronin MV, Henderson AC, Holverda S, Theilmann RJ, Arai TJ, Dubowitz DJ, Hopkins SR, Buxton RB, Prisk GK. Vertical distribution of specific ventilation in normal supine humans measured by oxygen-enhanced proton MRI. J Appl Physiol (1985) 109: 1950–1959, 2010. [DOI] [PMC free article] [PubMed] [Google Scholar]
- 284.Sa RC, Henderson AC, Simonson T, Arai TJ, Wagner H, Theilmann RJ, Wagner PD, Prisk GK, Hopkins SR. Measurement of the distribution of ventilation-perfusion ratios in the human lung with proton MRI: Comparison with the multiple inert-gas elimination technique. J Appl Physiol (1985) 123: 136–146, 2017. [DOI] [PMC free article] [PubMed] [Google Scholar]
- 285.Sanchez-Crespo A, Petersson J, Nyren S, Mure M, Glenny RW, Thorell JO, Jacobsson H, Lindahl SG, Larsson SA. A novel quantitative dual-isotope method for simultaneous ventilation and perfusion lung SPET. Eur J Nucl Med Mol Imaging 29: 863–875, 2002. [DOI] [PubMed] [Google Scholar]
- 286.Sando Y, Inoue T, Nagai R, Endo K. Ventilation/perfusion ratios and simultaneous dual-radionuclide single-photon emission tomography with krypton-81m and technetium-99m macroaggregated albumin. Eur J Nucl Med 24: 1237–1244, 1997. [DOI] [PubMed] [Google Scholar]
- 287.Schembri GP, Miller AE, Smart R. Radiation dosimetry and safety issues in the investigation of pulmonary embolism. Semin Nucl Med 40 (6): 442–454, 2010. DOI: 10.1053/j.semnuclmed.2010.07.007. [DOI] [PubMed] [Google Scholar]
- 288.Schimmel C, Frazer D, Glenny RW. Extending fluorescent microsphere methods for regional organ blood flow to 13 simultaneous colors. Am J Physiol Heart Circ Physiol 280: H2496–H2506, 2001. [DOI] [PubMed] [Google Scholar]
- 289.Schoepf UJ. Diagnosing pulmonary embolism: Time to rewrite the textbooks. Int J Cardiovasc Imaging 21: 155–163, 2005. [DOI] [PubMed] [Google Scholar]
- 290.Scholz AW, Wolf U, Fabel M, Weiler N, Heussel CP, Eberle B, David M, Schreiber WG. Comparison of magnetic resonance imaging of inhaled SF6 with respiratory gas analysis. Magn Reson Imaging 27: 549–556, 2009. [DOI] [PubMed] [Google Scholar]
- 291.Schreiber WG, Eberle B, Laukemper-Ostendorf S, Markstaller K, Weiler N, Scholz A, Bürger K, Heussel CP, Thelen M, Kauczor HU. Dynamic 19F-MRI of pulmonary ventilation using sulfur hexafluoride (SF6) gas. Magn Reson Med 45: 605–613, 2001. [DOI] [PubMed] [Google Scholar]
- 292.Schuster DP, Kaplan JD, Gauvain K, Welch MJ, Markham J. Measurement of regional pulmonary blood flow with PET. J Nucl Med 36: 371–377, 1995. [PubMed] [Google Scholar]
- 293.Shaker SB, Dirksen A, Laursen LC, Skovgaard LT, Holstein-Rathlou NH. Volume adjustment of lung density by computed tomography scans in patients with emphysema. Acta Radiol 45: 417–423, 2004. [DOI] [PubMed] [Google Scholar]
- 294.Shellock FG, Kanal E. Safety of magnetic resonance imaging contrast agents. J Magn Reson Imaging 10: 477–484, 1999. [DOI] [PubMed] [Google Scholar]
- 295.Simon BA. Regional ventilation and lung mechanics using X-ray CT1. Acad Radiol 12: 1414–1422, 2005. [DOI] [PubMed] [Google Scholar]
- 296.Simon BA, Marcucci C, Fung M, Lele SR. Parameter estimation and confidence intervals for Xe-CT ventilation studies: A Monte Carlo approach. J Appl Physiol (1985) 84: 709–716, 1998. [DOI] [PubMed] [Google Scholar]
- 297.Snyder JV, Pennock B, Herbert D, Rinaldo JE, Culpepper J, Good WF, Gur D. Local lung ventilation in critically ill patients using nonradioactive xenon-enhanced transmission computed tomography. Crit Care Med 12: 46–51, 1984. [DOI] [PubMed] [Google Scholar]
- 298.Societies SfRotIUoP. Glossary on respiration and gas exchange. J Appl Physiol 34: 549, 1973. [DOI] [PubMed] [Google Scholar]
- 299.Stewart G. Researches on the circulation time in organs and on the influences which affect it. J Physiol 15: 1–89, 1893. [DOI] [PMC free article] [PubMed] [Google Scholar]
- 300.Stewart NJ, Horn FC, Norquay G, Collier GJ, Yates DP, Lawson R, Marshall H, Wild JM. Reproducibility of quantitative indices of lung function and microstructure from 129Xe chemical shift saturation recovery (CSSR) MR spectroscopy. Magn Reson Med 77: 2107–2113, 2017. [DOI] [PMC free article] [PubMed] [Google Scholar]
- 301.Stickland MK, Lindinger MI, Olfert IM, Heigenhauser GJ, Hopkins SR. Pulmonary gas exchange and acid-base balance during exercise. Compr Physiol 3: 693–739, 2013. [DOI] [PMC free article] [PubMed] [Google Scholar]
- 302.Stolk J, Dirksen A, van der Lugt AA, Hutsebaut J, Mathieu J, de Ree J, Reiber JH, Stoel BC. Repeatability of lung density measurements with low-dose computed tomography in subjects with alpha-1-antitrypsin deficiency-associated emphysema. Invest Radiol 36: 648–651, 2001. [DOI] [PubMed] [Google Scholar]
- 303.Strong JC, Agnew JE. The particle size distribution of technegas and its influence on regional lung deposition. Nucl Med Commun 10: 425–430, 1989. [DOI] [PubMed] [Google Scholar]
- 304.Suarez-Sipmann F, Santos A, Bohm SH, Borges JB, Hedenstierna G, Tusman G. Corrections of Enghoff’s dead space formula for shunt effects still overestimate Bohr’s dead space. Respir Physiol Neurobiol 189: 99–105, 2013. [DOI] [PubMed] [Google Scholar]
- 305.Suga K, Nishigauchi K, Kume N, Koike S, Takano K, Tokuda O, Matsumoto T, Matsunaga N. Dynamic pulmonary SPECT of xenon-133 gas washout. J Nucl Med 37: 807–814, 1996. [PubMed] [Google Scholar]
- 306.Theilmann RJ, Arai TJ, Samiee A, Dubowitz DJ, Hopkins SR, Buxton RB, Prisk GK. Quantitative MRI measurement of lung density must account for the change in T(2) (*) with lung inflation. J Magn Reson Imaging 30: 527–534, 2009. [DOI] [PMC free article] [PubMed] [Google Scholar]
- 307.Theilmann RJ, Geier ET, Krueger M, Elliott AR, Lamm W, Darquenne CJ, Niese AT, Hopkins SR, Buxton RB, Scadeng M, Dubowitz D, Asadi A, Sa RC, Prisk G, Glenny RW. Proton MRI to measure lung ventilation: Comparison with aerosolized microsphere measurements in a porcine model. Am J Respir Crit Care Med 197: A5832–A5832, 2018. [Google Scholar]
- 308.Thompson HK Jr, Starmer CF, Whalen RE, McIntosh HD. Indicator transit time considered as a gamma variate. Circ Res 14: 502–515, 1964. [DOI] [PubMed] [Google Scholar]
- 309.Torre-Bueno JR, Wagner PD, Saltzman HA, Gale GE, Moon RE. Diffusion limitation in normal humans during exercise at sea level and simulated altitude. J Appl Physiol (1985) 58: 989–995, 1985. [DOI] [PubMed] [Google Scholar]
- 310.Treppo S, Mijailovich SM, Venegas JG. Contributions of pulmonary perfusion and ventilation to heterogeneity in V(A)/Q measured by PET. J Appl Physiol (1985) 82: 1163–1176, 1997. [DOI] [PubMed] [Google Scholar]
- 311.Tsuda A, Henry FS, Butler JP. Particle transport and deposition: Basic physics of particle kinetics. Compr Physiol 3: 1437–1471, 2013. [DOI] [PMC free article] [PubMed] [Google Scholar]
- 312.van Beek EJ, Hoffman EA. Functional imaging: CT and MRI. Clin Chest Med 29: 195–216, vii, 2008. [DOI] [PMC free article] [PubMed] [Google Scholar]
- 313.van Beek EJ, Wild JM, Kauczor HU, Schreiber W, Mugler JP III, de Lange EE. Functional MRI of the lung using hyperpolarized 3-helium gas. J Magn Reson Imaging 20: 540–554, 2004. [DOI] [PubMed] [Google Scholar]
- 314.Verbanck S, Paiva M. Gas mixing in the airways and airspaces. Compr Physiol 1: 809–834, 2011. [DOI] [PubMed] [Google Scholar]
- 315.Verschakelen JA, Van Fraeyenhoven L, Laureys G, Demedts M, Baert AL. Differences in CT density between dependent and nondependent portions of the lung: Influence of lung volume. AJR Am J Roentgenol 161: 713–717, 1993. [DOI] [PubMed] [Google Scholar]
- 316.Victorino JA, Borges JB, Okamoto VN, Matos GF, Tucci MR, Caramez MP, Tanaka H, Sipmann FS, Santos DC, Barbas CS, Carvalho CR, Amato MB. Imbalances in regional lung ventilation: A validation study on electrical impedance tomography. Am J Respir Crit Care Med 169: 791–800, 2004. [DOI] [PubMed] [Google Scholar]
- 317.Vidal Melo MF, Layfield D, Harris RS, O’Neill K, Musch G, Richter T, Winkler T, Fischman AJ, Venegas JG. Quantification of regional ventilation-perfusion ratios with PET. J Nucl Med 44: 1982–1991, 2003. [PubMed] [Google Scholar]
- 318.Vidal Melo MF, Winkler T, Harris RS, Musch G, Greene RE, Venegas JG. Spatial heterogeneity of lung perfusion assessed with (13)N PET as a vascular biomarker in chronic obstructive pulmonary disease. J Nucl Med 51: 57–65, 2010. [DOI] [PMC free article] [PubMed] [Google Scholar]
- 319.Vogt B, Pulletz S, Elke G, Zhao Z, Zabel P, Weiler N, Frerichs I. Spatial and temporal heterogeneity of regional lung ventilation determined by electrical impedance tomography during pulmonary function testing. J Appl Physiol (1985) 113: 1154–1161, 2012. [DOI] [PubMed] [Google Scholar]
- 320.Wagner PD. Diffusion and chemical reaction in pulmonary gas exchange. Physiol Rev 57: 257–312, 1977. [DOI] [PubMed] [Google Scholar]
- 321.Wagner PD, Dantzker DR, Dueck R, Clausen JL, West JB. Ventilation-perfusion inequality in chronic obstructive pulmonary disease. J Clin Invest 59: 203–216, 1977. [DOI] [PMC free article] [PubMed] [Google Scholar]
- 322.Wagner PD, Dantzker DR, Iacovoni VE, Tomlin WC, West JB. Ventilation-perfusion inequality in asymptomatic asthma. Am Rev Respir Dis 118: 511–524, 1978. [DOI] [PubMed] [Google Scholar]
- 323.Wagner PD, Naumann PF, Laravuso RB. Simultaneous measurement of eight foreign gases in blood by gas chromatography. J Appl Physiol 36: 600–605, 1974. [DOI] [PubMed] [Google Scholar]
- 324.Wagner PD, Smith CM, Davies NJH, Mcevoy RD, Gale GE. Estimation of ventilation-perfusion inequality by inert-gas elimination without arterial sampling. J Appl Physiol 59: 376–383, 1985. [DOI] [PubMed] [Google Scholar]
- 325.Wagner PD, Sutton JR, Reeves JT, Cymerman A, Groves BM, Malconian MK. Operation Everest II: Pulmonary gas exchange during a simulated ascent of Mt. Everest. J Appl Physiol (1985) 63: 2348–2359, 1987. [DOI] [PubMed] [Google Scholar]
- 326.Walker T, Happer W. Spin-exchange optical pumping of noble-gas nuclei. Rev Mod Phys 69: 629–642, 1997. [Google Scholar]
- 327.Walther SM, Domino KB, Glenny RW, Hlastala MP. Pulmonary blood flow distribution in sheep: Effects of anesthesia, mechanical ventilation, and change in posture. Anesthesiology 87: 335–342, 1997. [DOI] [PubMed] [Google Scholar]
- 328.Weathersby PK, Homer LD. Solubility of inert gases in biological fluids and tissues: A review. Undersea Biomed Res 7: 277–296, 1980. [PubMed] [Google Scholar]
- 329.Webb WR, Stern EJ, Kanth N, Gamsu G. Dynamic pulmonary CT: Findings in healthy adult men. Radiology 186: 117–124, 1993. [DOI] [PubMed] [Google Scholar]
- 330.Weisskoff RM, Chesler D, Boxerman JL, Rosen BR. Pitfalls in MR measurement of tissue blood flow with intravascular tracers: Which mean transit time? Magn Reson Med 29: 553–558, 1993. [DOI] [PubMed] [Google Scholar]
- 331.West JB. Distribution of pulmonary blood flow and ventilation measured with radioactive gases. Scand J Respir Dis Suppl 62: 9–13, 1966. [PubMed] [Google Scholar]
- 332.West JB. State of the art: Ventilation-perfusion relationships. Am Rev Respir Dis 116: 919–943, 1977. [DOI] [PubMed] [Google Scholar]
- 333.West JB. Causes of and compensations for hypoxemia and hypercapnia. Compr Physiol 1: 1541–1553, 2011. [DOI] [PubMed] [Google Scholar]
- 334.West JB. Respiratory Physiology: the Essentials. Lippincott Williams & Wilkins, 2012. [Google Scholar]
- 335.West JB, Dollery CT. Distribution of blood flow and ventilation-perfusion ratio in the lung, measured with radioactive carbon dioxide. J Appl Physiol 15: 405–410, 1960. [DOI] [PubMed] [Google Scholar]
- 336.West JB, Dollery CT, Naimark A. Distribution of blood flow in isolated lung; relation to vascular and alveolar pressures. J Appl Physiol 19: 713–724, 1964. [DOI] [PubMed] [Google Scholar]
- 337.West JB, Fowler KT, Hugh-Jones P, O’Donnell TV. Measurement of the ventilation-perfusion ratio inequality in the lung by the analysis of a single expirate. Clin Sci 16: 529–547, 1957. [PubMed] [Google Scholar]
- 338.West JB, Wagner PD. Pulmonary gas exchange. In: West JB, editor. Bioengineering Aspects of the Lung. New York and Basel: Marcel Dekker, 1977, p. 361–457. [Google Scholar]
- 339.Wilke N, Jerosch-Herold M, Stillman AE, Kroll K, Tsekos N, Merkle H, Parrish T, Hu X, Wang Y, Bassingthwaighte J, Bache RJ, Ugurbil K. Concepts of myocardial perfusion imaging in magnetic resonance imaging. Magn Reson Q 10: 249–286, 1994. [PubMed] [Google Scholar]
- 340.Winkler SS, Holden JE, Sackett JF, Flemming DC, Alexander SC. Xenon and krypton as radiographic inhalation contrast media with computerized tomography: Preliminary note. Invest Radiol 12: 19–20, 1977. [DOI] [PubMed] [Google Scholar]
- 341.Winkler SS, Sackets JF, Holden JE, Alexander SC, Medsen M, Kimol RL. Xenon inhalation as an adjunct to computerized tomography of the brain-preliminary study. Invest Radiol 11: 360, 1976. [DOI] [PubMed] [Google Scholar]
- 342.Winkler SS, Sackett JF, Holden JE, Flemming DC, Alexander SC, Madsen M, Kimmel RI. Xenon inhalation as an adjunct to computerized tomography of the brain: Preliminary study. Invest Radiol 12: 15–18, 1977. [DOI] [PubMed] [Google Scholar]
- 343.Wolf U, Scholz A, Heussel CP, Markstaller K, Schreiber WG. Sub-second fluorine-19 MRI of the lung. Magn Reson Med 55: 948–951, 2006. [DOI] [PubMed] [Google Scholar]
- 344.Won C, Chon D, Tajik J, Tran BQ, Robinswood GB, Beck KC, Hoffman EA. CT-based assessment of regional pulmonary microvascular blood flow parameters. J Appl Physiol (1985) 94: 2483–2493, 2003. [DOI] [PubMed] [Google Scholar]
- 345.Xia T, Alessio AM, Kinahan PE. Dual energy CT for attenuation correction with PET/CT. Med Phys 41: 012501, 2014. [DOI] [PMC free article] [PubMed] [Google Scholar]
- 346.Yang J, Wan M, Guo Y. Pulmonary functional MRI: An animal model study of oxygen-enhanced ventilation combined with Gd-DTPA-enhanced perfusion. Chin Med J (Engl) 117: 1489–1496, 2004. [PubMed] [Google Scholar]
- 347.Yeh SY, Peterson RE. Solubility of krypton and xenon in blood, protein solutions, and tissue homogenates. J Appl Physiol 20: 1041–1047, 1965. [DOI] [PubMed] [Google Scholar]
- 348.Yuan R, Mayo JR, Hogg JC, Pare PD, McWilliams AM, Lam S, Coxson HO. The effects of radiation dose and CT manufacturer on measurements of lung densitometry. Chest 132: 617–623, 2007. [DOI] [PubMed] [Google Scholar]
- 349.Zeltner TB, Sweeney TD, Skornik WA, Feldman HA, Brain JD. Retention and clearance of 0.9-micron particles inhaled by hamsters during rest or exercise. J Appl Physiol (1985) 70: 1137–1145, 1991. [DOI] [PubMed] [Google Scholar]
- 350.Zeman KL, Wu J, Donaldson SH, Bennett WD. Comparison of 133Xenon ventilation equilibrium scan (XV) and 99mTechnetium transmission (TT) scan for use in regional lung analysis by 2D gamma scintigraphy in healthy and cystic fibrosis lungs. J Aerosol Med Pulm Drug Deliv 26: 94–100, 2013. [DOI] [PMC free article] [PubMed] [Google Scholar]
- 351.Zwirewich CV, Mayo JR, Muller NL. Low-dose high-resolution CT of lung parenchyma. Radiology 180: 413–417, 1991. [DOI] [PubMed] [Google Scholar]