

Abstract
The interactions between glycans and glycan-binding proteins (GBPs) consist of weak, non-covalent, and transient binding events, making them difficult to study in live cells, void of a static, isolated system. Furthermore, the glycans are often presented as protein glycoconjugates, yet there are limited efforts to identify these proteins. Proximity labeling permits the covalent tagging of the glycoprotein interactors for a query GBP in live cells, and coupled with high-resolution mass spectrometry (MS), it facilitates the determination of the proteins bearing the interacting glycans. In this method, fusion protein constructs of a GBP of interest with a peroxidase enzyme allows for the in situ spatiotemporal radical-mediated tagging of interacting glycoproteins in living cells that can be enriched for identification. Using this method, the capture and study of glycan-GBP interactions no longer relies on weak, transient interactions and results in robust capture and identification of the interactome of a GBP, while preserving the native cellular environment. This protocol focuses on the (1) expression and characterization of a recombinant fusion protein between a peroxidase enzyme and a GBP called galectin-3, (2) the corresponding in situ labeling and visualization of interactors, (3) and the proteomic workflow and analysis of the captured proteins for robust identification using MS.
Keywords: Galectin, proximity labeling, proteomics, glycan
INTRODUCTION:
This article describes a general protocol for a radical-mediated in situ proximity tagging method to map the glycan and glycoprotein counter-receptors of glycan-binding proteins (GBPs) in live cells, a method we previously used to identify the glycoprotein interactors for galectin-3 (Joeh, O’Leary, et al., 2020) (Fig. 1). This method utilizes a fusion construct between the GBP and a peroxidase enzyme. The GBP of interest brings the peroxidase in proximity with its counter-receptors in the cell. Upon incubation with biotin-phenol and subsequent addition of hydrogen peroxide, highly reactive and short-lived biotin phenoxyl radicals covalently tag nearby (< 20 nm) associated proteins. Once the proteins have been tagged with biotin, several detection methods are available to visualize or enrich for them, such as fluorescence microscopy, western blotting, or quantitative mass spectrometry (MS)-based proteomics. Fluorescence microscopy provides a quick means to determine the efficiency of the proximity labeling in live cells, and it also provides information on the spatial localization of labeled proteins through various fluorescent markers. Western blotting allows for a qualitative comparison of the intensity of labeling between conditions (i.e. different protein constructs, competition). Quantitative MS-based proteomic experiments using isobaric tags, such as tandem mass tags (TMT), allow for relative quantification of labeled proteins among multiplexed conditions and identification of the counter-receptor proteins. Basic Protocol 1 describes the procedure for the expression, purification, and characterization of the recombinant fusion protein from E. coli. Basic Protocol 2 describes the initial in situ proximity labeling in live cells and visualization by fluorescence microscopy. Basic Protocol 3 describes a biotin-streptavidin mediated enrichment protocol coupled with on-bead digestion with trypsin and derivatization of peptides using 10-plex TMT as a labeling strategy to quantitatively determine the captured proteins by high-resolution MS.
Figure 1.

Overview of in situ proximity tagging with glycan-biding proteins (GBPs), such as galectin-3 (here shown as Gal-3). A fusion protein construct of the GBP and a peroxidase (here shown as PX) is exogenously incubated with live cells, where it freely interacts with its glycoprotein counter-receptors. The subsequent addition of biotin-phenol and hydrogen peroxide (H2O2) leads to the formation of reactive biotin phenoxyl radicals to covalently tag nearby electron-rich residues with biotin. The biotin-tagged proteins are enriched by streptavidin agarose beads and analyzed by quantitative mass-spectrometry based proteomics. Figure adapted from PNAS, 2020; 117(44), 27329. Copyright 2020 CC BY-NC-ND 4.0.
STRATEGIC PLANNING (optional)
The glycan-binding activity of the GBP must be considered when first designing the fusion protein construct, particularly the location of the linkage between the peroxidase and the GBP. In our case, galectin-3 is a chimeric galectin consisting of two distinct functional domains: an N-terminal domain that is implicated in the homo-oligomerization of galectin-3 to initiate high avidity interactions and a C-terminal domain that makes up the carbohydrate recognition domain, or CRD. Previous work has shown that galectin-3 constructs fused at the N-terminus retain their glycan-binding activities (Böcker & Elling, 2017). Galectin-3 fusion proteins with YFP, SNAP tag, or both were recombinantly expressed in E. coli and these showed no significant deficits in glycan mediated binding of galectin-3 (Böcker & Elling, 2017). Thus, we have designed our fusion protein (PX-Gal3) with the linker at the N-terminus of galectin-3. We also recommend designing constructs where the peroxidase is appended on either end of the GBP and empirically testing for glycan-binding activity. In our construct, a hexapeptide composed of glycine and serine residues is used to space the PX and Gal3 domains. Others have used different combinations of short linkers composed mostly of glycine and serine residues such as GSGSTSGSG (Mavylutov, Chen, Guo, & Yang, 2018), GGAGG (Liu et al., 2018), GGSSGGSS (Paek et al., 2017), and even much longer 27 amino acid residue linkers such as KDPNSGGGLVARGSGGGCGGGTGGGS-GGG (Lee et al., 2015). The linker is generally composed of glycine and serine residues of four to ten amino acids, but it can vary depending on desired conformational flexibility. We chose to use an engineered ascorbate PX enzyme, APEX2, for its catalytic potency and monomeric nature (Lam et al., 2015). The amino acid sequences for APEX2 and human galectin-3 were obtained from the reference Lam et al., 2015 and UniProt Q6NVH9, respectively. We chose the pETDuet-1 vector (Novagen) for the high processivity of its T7 promoter, and the option of incorporating another protein (e.g. fluorescent proteins) for dual expression in bacterial E. coli strains. We utilized a commercial vendor (Genscript) to perform codon optimization and generate the PX-Gal3 expression plasmid in pETDuet-1. Factors to consider when deciding on the appropriate vector for expression are copy number, expression system, and epitope tags for purification. Low copy number plasmids are ideal for proteins that are toxic at high levels, while high copy numbers are preferred for generally higher yields; however, a high copy number plasmid can potentially lead to protein aggregation and deficiency in post-translational modifications. Depending on the expression system (i.e. bacterial or mammalian), one may choose an optimized vector for the system in addition to considering potential epitope tags (i.e. hemagglutinin (HA), Flag, etc.) or purification tags (i.e. poly-histidine (H6), GST, etc.), depending on downstream use.
BASIC PROTOCOL 1: Expression, purification, and characterization of fusion protein construct(s)
This protocol describes the expression, purification, and characterization of the PX-Gal3 fusion protein expressed in E. coli. Once the vector encoding for the fusion protein construct has been generated (by cloning or via gene synthesis), it is transformed into competent E. coli cells and plated overnight to produce homogenous colonies. Single colonies are selected for resistance in antibiotic-containing media, and they can be saved as glycerol stocks for future expression. Typically, several colonies from one plate are isolated and screened for optimal expression. One colony can be grown into a starter culture overnight and then expanded to a larger culture for inoculation and induction with Isopropyl β- d-1-thiogalactopyranoside (IPTG). The recombinant protein can then be purified through affinity-based purification steps and desalted. Once the protein is purified and concentrated, protein concentration and purity can be determined through numerous assays, such as UV-Vis, SDS-PAGE gel, western blotting, or ELISAs.
Materials:
BL21 E. coli competent cells (Novagen, Cat. No. 69450)
Plasmid containing PX-tagged target protein (designed and generated by user)
SOC medium (provided by Novagen competent cell kit)
100 μg/mL ampicillin or appropriate antibiotic plates (see recipe in Reagents and Solutions)
50% glycerol in water, sterile
1000X ampicillin or appropriate antibiotic solution (see recipe in Reagents and Solutions)
Luria-Bertani Broth (LB; see recipe in Reagents and Solutions)
1000X IPTG solution (see recipe in Reagents and Solutions)
1X Phosphate-buffered saline (PBS; see recipe in Reagents and Solutions)
Bacterial Lysis Buffer (see recipe in Reagents and Solutions)
Solvent A (see recipe in Reagents and Solutions)
Solvent B (see recipe in Reagents and Solutions)
α-Lactose Agarose (Sigma, Cat. No. L7634)
Lactose Wash Buffer / Protein Storage Buffer (see recipe in Reagents and Solutions)
Lactose Elution Buffer (see recipe in Reagents and Solutions) reagent
4X Laemmli Buffer (see recipe in Reagents and Solutions)
Precision Plus Protein™ Unstained Standards (Protein Ladder) (BioRad, Cat. No. 161–0363)
Stain-free Gel (BioRad, Cat. No. 1610183)
Running Buffer (see recipe in Reagents and Solutions)
WesternSure® Pre-stained Chemiluminescent Protein Ladder – (Li-Cor, P/N: 926–98000)
Chameleon® Duo Pre-stained Protein Ladder (Li-Cor, P/N: 928–60000)
Transfer Buffer (see recipe in Reagents and Solutions)
Methanol (e.g. Fisher Scientific, Cat. No. A412–20)
Tris-buffered saline with Tween-20 (TBST, see recipe in Reagents and Solutions)
5% BSA in TBST (see recipe in Reagents and Solutions)
Primary antibody (e.g. anti-galectin-3, Biolegend, Cat. No. 126701)
Secondary antibody (e.g. goat anti-mouse HRP conjugate, Invitrogen, Cat. No. G21040)
Chemiluminescent HRP substrate (e.g. SuperSignal™ West Pico PLUS Chemiluminescent Substrate, Cat. No. 34577)
Asialofetuin (ASF; Type I from fetal calf, Sigma, A4781–50MG)
Carbonate-Bicarbonate Buffer, pH 9.6 (see recipe in Reagents and Solutions)
1X Phosphate-buffered saline with Tween-20 (PBST; see recipe in Reagents and Solutions)
2% BSA in PBST (w/v; see recipe in Reagents and Solutions)
3,3’,5,5’-tetramethylbenzidine (TMB) substrate (e.g. BioFX®, Cat. No. TMBW-1000–01)
0.2 N H2SO4 (see recipe in Reagents and Solutions)
1.7-mL microcentrifuge tubes (e.g. VWR, Cat. No. 87003–294)
Thermo Scientific™ Digital Dry Baths/Block Heaters
Corning® LSE™ Benchtop Shaking Incubator
Cell Spreader (e.g. VWR, Cat. No. 89042–021)
Culture Tube With Blue Snap Cap (Fisher Scientific, Cat. No. 149569C)
4 L glass Erlenmeyer Flask
New Brunswick™ Innova® 44R, 120V, orbit 2.5 cm (1 in) (Eppendorf, Cat. No. M1282–0004)
NanoDrop™ One/OneC Microvolume UV-Vis Spectrophotometer
Avanti J-E Centrifuge
Vortex
50-mL centrifuge tubes (e.g. VWR, Cat. No. 525–1075)
15-mL centrifuge tubes (e.g. VWR, Cat. No. 525–1068)
Branson SFX250 Sonicator
Plastic Syringe, 10 mL (e.g. Fisher Scientific, Cat. No. 14955459)
0.45 μm or 0.22 μm membrane filter (e.g. MF-Millipore™, Cat. No. GSWP04700)
FPLC (Akta Start, Cytiva, formerly, GE Healthcare Science)
HisTrap™ HP, 1 mL column (Cytiva, formerly, GE Healthcare Science, Cat. No. 17524701)
Tube Revolver / Rotator (ThermoFisher, Cat. No. 88881001)
Ultra-Centrifugal Filter (e.g. Amicon, Cat. No. UFC803024)
PD-10 column (Cytiva, formerly, GE Healthcare Science, Cat. No. 17-0851-01).
Chemidoc Imager (BioRad)
Power source (BioRad)
Gel box (BioRad)
SDS-PAGE cassette (BioRad)
Transfer cassette (BioRad)
Filter paper (BioRad)
Sponges (BioRad)
PVDF HRP membrane (Immobilon®- P Transfer Membrane – Cat.No. IPVH00010)
PVDF FL membrane (Immobilon®- FL Transfer Membrane – Cat.No. IPFL00010)
Stir bar
Stir plate
Rocker
Nunc-Immuno™ MicroWell™ 96 well solid plates (Man. No. 439454)
Adhesive Film (VWR, Cat. No. 60941–062)
Plate reader (e.g. BMG Labtech Clariostar)
Plasmid transformation
-
1
Thaw 20 μL of BL21 cells on ice for 10–20 min.
-
2
Add 10 ng (1μL) of plasmid to the cell suspension and flick gently to mix and incubate on ice for 5 min.
The plasmid should be resuspended as a 100 ng/μL stock solution in 18.2 MΩ water. A working solution can be prepared by diluting the stock solution 1:10 in water. Working solutions should be prepared so that the desired amount of plasmid for the transformation is in 1 μL of solution.
-
3
Heat shock cells at 42°C on the heat block for 30 sec.
-
4
Cool on ice for 2 min.
-
5
Add 80 μL of SOC medium (without antibiotics) and shake at 250 RPM for 1 h, 37°C.
-
6
Spread cells (5–50 μL) on a 100 μg/mL ampicillin plate using a cell spreader and grow colonies overnight in 37°C incubator.
It is recommended that three plates with different volumes of transformed cells (e.g. 10 μL, 30 μL, 50 μL) are created to ensure optimal density of colonies is achieved.
-
7
Pick a single colony and grow in 5 mL of LB medium supplemented with 100 μg/mL of ampicillin in a 10 mL culture tube and incubate overnight at 200 RPM, 37°C. To make glycerol stocks, proceed with Step 8. To expand into larger cultures for protein expression, proceed to Step 9.
It is strongly recommended that a glycerol stock is created to maximize reproducibility of future experiments.
-
8
Mix 500 μL of the overnight culture with 500 μL of 50% glycerol to create a glycerol stock that can be used for future protein expression. Glycerol stocks can be stored in the −80°C freezer indefinitely. For future use, scratch the surface of the stock with a pipette tip, and add to the starter culture media. Avoid repeated thawing to maintain stock quality.
Protein expression
-
9
Add 2 mL (1:500 dilution) of the overnight culture into 1 L of LB medium freshly supplemented with 1000X ampicillin in a 4 L flask, providing 75% headspace. Shake the culture at 220 RPM, 37°C until the optical density (OD) reaches 0.600. Monitor OD by taking 1 mL of culture into a disposable cuvette and measure on the Nanodrop.
Prepare fresh, autoclaved LB medium, directly in the flask for expression, the night before and let it cool overnight at room temperature. Keep closed to keep sterile and use the next day. Do not add antibiotics to the LB medium before autoclaving. It may take anywhere between 2.5–4 h to reach an OD of 0.600, it can vary greatly depending on the construct and selection process. Keep in mind that the doubling time of E. coli is ~20 min so once the culture moves past its stationary phase and into its exponential phase, the OD will approximately double every 20 min.
-
10
Add 1 mL of 1000X IPTG solution and shake for 4 h at 220 RPM, 37°C.
-
11
Pellet the induced bacterial culture for 15 min at 3,300 × g, 4°C.
-
12
Discard supernatant and resuspend the pellet in PBS by vortexing, pipetting, or swirling. Transfer resuspended pellet into a 50-mL centrifuge tube and pellet at for 15 min at 3,300 × g, 4°C.
-
13
Discard supernatant. Pellet can be stored in the −80°C freezer indefinitely or be immediately lysed for protein purification.
Protein purification by affinity-based purification
-
14
Add 10 mL of Bacterial Lysis Buffer into the cell pellet and vortex until fully resuspended.
-
15
Lyse cell pellet on ice by sonication with a sonicator (e.g. Branson SFX250 with total ON time: 30 sec; ON time: 1 sec; OFF time: 3 sec; Amplitude: 20%).
It is essential to keep the pellet on ice during sonication. Sonication produces heat, which can denature or degrade the protein in solution. The long OFF time is meant to allow the solution to stay cool during the sonication period and prevent overheating.
-
16
Pre-clarify the lysate by spinning it down for 20 min at 16,000 × g, 4°C.
-
17
Collect the supernatant by decanting into a new 15-mL centrifuge tube on ice.
-
18
Filter clarified lysate by pumping with a syringe equipped with a 0.22 μm or 0.45 μm filter to ensure that there are no cell debris or precipitate in the solution.
It is critical that there are no solids in the lysate. Any miniscule amount of precipitate or solids in the lysate can clog the lines in the FPLC and potentially damage the instrument.
-
19
Load sample into the FPLC (e.g. Akta Start, Cytiva, formerly, GE Healthcare Science) and purify sample using the HisTrap HP, 1 mL column (column volume ≡ CV, e.g. for a 1 mL HisTrap HP, 1 CV would be 1 mL of solution).
Solvent A (Nickel Wash Buffer): 30 mM imidazole in 2X PBS pH 7.4 (274 mM NaCl, 5.4 mM KCl, 16 mM Na2HPO4, and 4 mM KH2PO4)
Solvent B (Nickel Elution Buffer): 300 mM imidazole in 2X PBS pH 7.4
Flow rate: 0.5 mL/min
Prime pump: 7.0 CV; 100% A, 0% B
Apply the sample using pump
Wash column: 15.0 CV; 100% A, 0% B
- Gradient elution:
- 5 CV from 100% A, 0% B to 95% A, 5% B
- 10 CV from 95% A, 5% B to 0% A, 100% B
Collect samples with high UV absorbance reading. Transfer and store 10 μL into a new 1.7-mL microcentrifuge tube labeled as “E1” for gel analysis.
The flow-through of the sample from the column (that goes directly to waste) can be collected for gel analysis in case the protein does not bind to the column and comes out of the waste line. If collected, label this “S1” for supernatant 1.
-
20Prepare α-lactose agarose beads (Sigma) for loading.
- Cut approximately 5 mm off the tip of a 1000 μL pipette tip to transfer 500 μL of α-lactose agarose resin into one 15-mL centrifuge tube. Rock the bottle to homogenously resuspend beads in its storage buffer before transferring to tube.
- Spin down beads for 2 min, 500 × g, 4°C. Carefully discard supernatant to avoid disturbing the resin.
- Wash resin with 10 CV of 1X PBS and spin down beads for 2 min, 500 × g, 4°C. Discard supernatant.
-
21
Load sample from 19.h. onto beads, and rotate for 1 h at 4°C.
-
22
Spin down beads for 2 min at 500 × g, 4°C. Discard supernatant but transfer and store 10 μL into a new 1.7-mL microcentrifuge tube labeled as “S2” (for flow-through 2) for gel analysis.
-
23
Add 5 CV of Lactose Wash Buffer and rotate for 5 min at 4°C. Then spin down beads for 2 min at 500 × g, 4°C. Discard supernatant. Repeat this step two more times.
-
24
Add 1 CV of Lactose Elution Buffer and rotate at 4°C for 5 min. Then spin down beads for 2 min at 500 × g, 4°C. Collect supernatant. Repeat this step three more times. If total volume of purified protein from Step 24 is greater than 3 mL, continue to Step 25. If the volume is less than or equal to 3 mL, continue to Step 27.
Concentrate and desalt
-
25
Bring the volume down to 3 mL or less using a centrifugal filter (e.g. Amicon, Cat. No. UFC803024). Add solution of purified protein into the centrifugal filter and spin down until the desired volume is achieved, according to the manufacturer’s instruction manual.
Choose centrifugal filter based on the MW of the recombinant protein (e.g. 3 kDa, 10 kDa, 30 kDa) and the volume of the final elution from Step 24 (e.g. 0.5 mL, 4 mL, 15 mL).
-
26
Pipet concentrated protein solution into a new 1.7-mL microcentrifuge tube.
-
27Desalt sample using a PD-10 column (Cytiva, formerly, GE Healthcare Science, Cat. No. 17-0851-01).
- Remove the top cap of the PD-10 column and pour out the column storage buffer. Cut the bottom end to remove the seal.
- Fill up the column with equilibration buffer and allow the solution to flow-through the column by gravity. Discard flow-through. Repeat three more times.
-
28
Add a maximum of 2.5 mL of sample onto the column. Discard flow-through.
If the volume of the sample is less than 2.5 mL, load sample onto column and let the sample enter the packed bed entirely. After the sample has fully entered the bed, add equilibration buffer to the column to adjust the volume up to 2.5 mL (e.g. 2 mL of sample and then 500 μL of equilibration buffer). Let the additional equilibration buffer enter the packed bed entirely before moving onto the next step.
-
29
Place a new 15-mL centrifuge tube under the column for sample collection.
-
30
Elute with 3.5 mL of Protein Storage Buffer and collect the eluate.
-
31
Determine the protein concentration using the NanoDrop.
Determine the extinction coefficient (ε) value and molecular weight (kDa) using the amino acid sequence of the recombinant protein using a calculator (e.g. https://web.expasy.org/protparam/).
If the protein concentration is too dilute, perform Step 25 again to concentrate down the protein to an appropriate concentration.
-
32
Determine the heme occupancy using the NanoDrop.
Set the instrument on the UV-Vis function to measure absorbance at 405 nm and 280 nm.
Use 2 μL of Protein Storage Buffer to blank the instrument.
Clean the stand and measure the absorbance of 2 μL of concentrated protein.
Calculate heme occupancy by dividing absorbance at 405 nm by absorbance at 280 nm.
APEX2 requires a heme cofactor for peroxidase activity, thus the efficiency of proximity tagging is dependent on heme occupancy, which is measured as a ratio of the absorbance of heme (A405) to the absorbance of the protein (A280). A405/A280 values greater than 2.0 correspond to full heme occupancy (Lam et al., 2015), and in our experience, heme occupancy values of approximately 60% is sufficient for robust proximity labeling experiments. E. coli cultures can be supplemented with 1 mM 5 aminolevulinic acid upon induction to improve heme occupancy (Lam et al., 2015).
SDS-PAGE gel and western blot analysis of purified protein
-
33
Add 3 μL of 4X Laemmli Buffer supplemented with β-mercaptoethanol (10% v/v) to 9 μL of each sample (S1, E1, S2, final elution) in a 1.7-mL microcentrifuge tube each and boil sample for 5 min at 95°C in a heating block.
Small aliquots from other fractions may be collected throughout the protocol and run on the SDS-PAGE gel to monitor changes in purity, such as pre-clarified lysate (step 18) and lactose bead washes (step 23).
-
34
Cool each sample on ice for a few seconds and spin down quickly with a microfuge to spin down any condensate from the top of the lid.
-
35
Load 10 μL per sample into a TGX Stain-Free™ FastCast™ 10% polyacrylamide gel (Bio-Rad) and 2 μL of ladder (Bio-Rad). Run the gel at 95 V for 90 min.
-
36
Visualize the gel using the “Stain-free” setting on a Chemidoc imager (Bio-Rad) (Fig. 2A) or other stain-based protocols.
Figure 2.

Examples of protein characterization. (A) Stain-free imaging of SDS-PAGE gel of the different samples collected during the protein purification process (S1: supernatant from Ni-NTA beads; E1: Eluate from Ni-NTA beads; S2 Lac: supernatant from α-lactose beads; E2 Lac: Eluate from α-lactose beads). (B) Binding curve of PX-Gal3 from an ELISA plate coated with asialofetuin glycoprotein. Figure adapted from PNAS, 2020; 117(44), 27329. Copyright 2020 CC BY-NC-ND 4.0.
Transfer
-
37
Setup the wet transfer: Place an open transfer cassette in a container with Transfer Buffer. Place one foam pad on the black panel of the transfer cassette and stack two blotting papers on top. Carefully place the SDS-PAGE gel on top of the blotting papers, ensuring it is completely flat without creases or air bubbles. Soak the PVDF membrane in methanol for 30 sec, and then equilibrate it by soaking with transfer buffer for at least 30 sec before placing it on the top of the gel. Manipulation of the PVDF membrane should be done with clean tweezers. Carefully remove any air bubbles that may form between the gel and the membrane by smoothing over with a roller. Add two blotting papers on top of the membrane, followed by the second foam pad. Carefully, close the transfer cassette and place the transfer sandwich into the gel transfer cell. Fill the tank to the top with transfer buffer. Place an ice pack and stir bar in the tank. Place the entire tank onto a stir plate and run the transfer at 300 mA for 1 h while stirring.
-
38
Remove the membrane from the transfer sandwich and block the membrane with 5% BSA (w/v) in TBST for 1 h at room temperature while rocking.
-
39
Wash the membrane three times with TBST for 5 min, rocking at room temperature per wash.
-
40
Incubate the membrane with primary antibody (e.g. 1:1000 of anti-galectin-3 in 5% BSA (w/v) in TBST) overnight at 4°C while rocking.
Incubation can also be performed for one hour at room temperature while rocking.
-
41
Wash the membrane three times with TBST for 5 min per wash, rocking at room temperature.
-
42
Incubate the membrane with secondary antibody (e.g. 1:1000 of anti-mouse HRP in 5% BSA (w/v) in TBST) for 1 h at room temperature, rocking.
-
43
Wash the membrane three times with TBST for 5 min per wash, rocking at room temperature.
-
44
Develop the membrane using chemiluminescent HRP substrate. Add equal volumes (~500 μl) of the two reagents to a 1.7-mL microcentrifuge tube, and pipet evenly onto the membrane after mixing. Incubate for five minutes.
-
45
Image the chemiluminescence signal using the “Chemiluminescence” setting on Chemidoc imager (Bio-Rad) or other stain-based protocols.
Enzyme-linked immunosorbent assay (ELISA) analysis of purified protein using asialofetuin (ASF)
-
46
Immobilize ASF or another suitable glycoprotein onto a high protein-binding microtiter 96-well plate (Nunc MaxiSorp™) by preparing a 5 μg/mL solution in 0.1 M carbonate-bicarbonate buffer, pH 9.6. Add 100 μL to each well. Seal the plate with adhesive film and incubate overnight at 4°C on a rocker.
ASF was chosen as a suitable glycoprotein due to its abundance of terminal galactose presenting N-glycans. Other GBPs may require a different glycoprotein ligand.
-
47
Wash each well three times with 100 μL of PBST.
-
48
Block each well with 100 μL of 2% BSA in PBST for 1 h at room temperature while rocking.
-
49
Wash each well three times with PBST.
-
50
Add titrations of desired protein of interest (e.g. recombinant galectin-3, PX-Gal3). Rock for 1 h at room temperature.
The concentration range necessary to achieve the optimal binding curve will vary for different proteins and its binding partners. As an example, here we set the highest concentration of galectin-3 at 1 μM and performed a six-fold serial dilution to achieve the lowest concentration of 3.5 pM. Adjust the upper and lower concentrations until absorbance maxima and minima are reached.
-
51
Wash each well three times with 100 μL of PBST.
-
52
Incubate the plate with primary antibody (e.g. 1:1000 of anti-galectin-3 antibody in PBST). Incubate 1 h at room temperature while rocking.
-
53
Wash each well three times with 100 μL of PBST.
-
54
Incubate the plate with secondary antibody (e.g. 1:1000 of anti-mouse HRP-conjugate in PBST). Incubate for 1 h at room temperature while rocking.
-
55
Wash each well three times with 100 μL of PBST.
-
56
Incubate the plate with TMB substrate, using 100 μL in each well, resulting in a blue color (detectable at 650 nm). Monitor continuously for stable color development (1–30 min).
-
57
Upon stable color development, add 100 μL of 0.2 N H2SO4 to each well, resulting in a blue to yellow color change.
-
58
Measure absorbance at 450 nm using the plate reader.
-
59
Determine the EC50 values for binding (Fig. 2B).
Using GraphPad Prism, transform all data points into the log of dose/concentration. Perform “Nonlinear regression (curve fit)” under “Analyze” and choose “log(agonist) vs. response -- Variable slope (four parameters)”. R2 values that depict curve fit should be > 0.99 and a proper “S-shaped” curve should be attained with values at the top and bottom ranges represented. If not, adjust the protein concentrations and repeat. Determine EC50 values based on fitted curves.
ALTERNATE PROTOCOL 1
Manual His-tag purification with Batch Purification:
Introductory paragraph:
If an automated purification method for the nickel-based purification is not available, it is possible to purify the recombinant protein manually used commercially available Ni-NTA beads.
Additional Materials (also see Basic Protocol 1):
Nickel Chelating Resin (G-Biosciences, Man. No. 786–407)
Nickel Wash Buffer (see recipe in Reagents and Solutions)
Nickel Elution Buffer (see recipe in Reagents and Solutions)
Nickel bead preparation:
- Prepare Ni-NTA beads (Sigma) for protein loading.
- Cut approximately 5 mm off the tip of a 1000 μL pipette tip and transfer 500 μL of Ni-NTA resin into a 15-mL centrifuge tube. Rock the bottle to homogenously resuspend the beads in their storage buffer before transferring to the tube.
- Spin down beads for 2 min at 500 × g, 4°C. Carefully discard supernatant to avoid disturbing the resin.
- Wash resin with 10 CV of 1X PBS and spin down beads for 2 min at 500 × g, 4°C. Discard supernatant.
Following protein transformation, expression and lysis (See Basic Protocol 1, Steps 1–18), load the lysate onto the beads in the 15-mL centrifuge tube and rotate for 1 h at 4°C.
Spin down beads for 2 min at 500 × g, 4°C. Remove supernatant but transfer and store 10 μL into a new 1.7-mL microcentrifuge tube labeled as “S1” (for flow-through 1) for gel analysis.
Add 5 CV of Nickel Wash Buffer and rotate for 5 min at 4°C. Then spin down beads for 2 min at 500 × g, 4°C. Discard supernatant. Repeat this step two more times.
Add 1 CV of Nickel Elution Buffer and rotate for 5 min at 4°C. Then spin down beads for 2 min at 500 × g, 4°C. Collect supernatant. Repeat this step three more times. Combine all four supernatant eluates into a single 15-mL centrifuge tube and label as “E1” for elution 1. Transfer and store 10 μL into a new 1.7-mL microcentrifuge tube for gel analysis. Then proceed with the rest of the sample.
-
Transfer the E1 onto α-lactose agarose beads for additional purification and continue with SDS-PAGE gel and western blot analysis (See Basic Protocol 1 Step 20 and continue from there).
Small aliquots from the washes (step 4) and elutions (step 5) can be collected and simultaneously run on the SDS-PAGE gel to evaluate purity before proceeding to subsequent purification steps.
BASIC PROTOCOL 2
In situ labeling and visualization by fluorescence microscopy
Introductory paragraph:
Following successful expression and purification of the recombinant fusion protein, it must be evaluated for activity by performing proximity labeling in live cells. The success of the in situ proximity labeling will initially be assessed by fluorescence microscopy, by which the biotin tagged proteins in the cells can be visualized under a fluorescence microscope using streptavidin-conjugated fluorophores. During this protocol, the different parameters of the labeling (e.g. the concentration of and incubation period with the fusion protein, biotin-phenol, and/or hydrogen peroxide) can be qualitatively and quickly optimized to determine optimum labeling conditions. Here, we use a LX-2 human hepatic stellate cell line that does not adhere strongly onto the surface of plastic cell culture plates. The extensive washing and changing of media during the proximity tagging protocol can dislodge these cells and result in the loss of a significant number of adhered cells. To alleviate this problem, we pre-treat the plates with poly-D-lysine coating to promote cell adherence and retainment during the procedure. For cells that are prone to detaching during media changes and washes, we recommend coating plates with poly-D-lysine before seeding the cells onto the plate.
Materials:
Poly-D-lysine (Corning, Cat. No. 354210)
1X Phosphate-buffered saline (PBS) buffer
LX-2 human hepatic stellate cells (LX-2 HSCs) (e.g. Millipore, Cat. No. SCC064) or appropriate cultured cells
Complete DMEM (see recipe in Reagents and Solutions) or appropriate growth medium
DMEM (e.g. ThermoFisher, Cat. No. 11995065) or appropriate growth medium
PX-Gal3 purified protein (from Basic Protocol 1) or other PX-GBP
500 mM lactose (see recipe in Reagents and Solutions) or appropriate competing carbohydrate
Biotin phenol (e.g. ApexBio, CAS No. 41994-02-9, Cat. No. A8011)
Quencher solution (see recipe in Reagents and Solutions)
Hydrogen peroxide solution (30% w/w) in H2O (Sigma, CAS No. 7722-84-1, Cat. No. H1009–100ML)
4% paraformaldehyde (PFA) in PBS (see recipe in Reagents and Solutions)
1X Phosphate-buffered saline with Tween-20 (PBST; see recipe in Reagents and Solutions)
Streptavidin-Cy5 (e.g. SouthernBiotech, Cat. No. 7100–15)
Hoechst 33342 (e.g. Chemodex, CAS No. 23491-52-3, Cat. No. B0030)
24-well plate (e.g. GenClone, Cat. No. 25–107)
Biological safety cabinet
Incubator (37°C and 5% CO2)
1.7-mL microcentrifuge tubes (e.g. VWR, Cat. No. 87003–294)
Vortex
Shaking incubator (e.g. Corning, Product No. 6790)
Aluminum foil
Fluorescence imager (e.g. EVOS™ M5000 Imaging System – Thermo Fisher AMF5000)
In situ proximity labeling
-
1
Treat 6 wells of a 24-well plate with 300 μL of poly-D-lysine for 15 min at room temperature. Remove and collect the poly-D-lysine for reuse up to five times. Wash wells three times with 500 μL of PBS. Air dry plate in a biosafety cabinet for at least 10 min.
-
2
Plate 1.5 × 10⁵ LX-2 human hepatic stellate cells in each poly-D-lysine treated well. Incubate cells overnight in 500 μL complete DMEM (see recipe in Reagents and Solutions) at 37°C in 5% CO2. Check confluency the next day.
Poly-D-lysine treatment is necessary for cells that loosely adhere to plates. The proximity labeling method requires multiple sequential washes, which may disrupt cells. The confluency should be 80% to 90% before proceeding. If this confluency is not obtained, continue to incubate cells at 37°C in 5% CO2 until achieved.
-
3
Prepare the following four unique experiment treatment solutions in DMEM with total volumes of 750 μl: 25 nM, 50 nM, and 100 nM PX-Gal3, as well as 100 nM PX-Gal3 and 100 mM lactose (diluted from 500 mM stock, see recipe).
Note that the DMEM used in this step is not the “complete” DMEM solution used in Step 2.
-
4
Aspirate the complete DMEM from 24-well plate, and wash cells three times with 500 μL of PBS.
-
5
In four separate wells, add 500 μL of experiment treatment solutions prepared in Step 3. Add 500 μL of DMEM to each of the two remaining wells for negative control A and B. Incubate for 30 min at 37°C in 5% CO2.
-
6
During the incubation period, prepare 5.5 μL of 500 mM biotin phenol in DMSO and dilute to 5.5 mL of 500 μM biotin phenol with complete DMEM pre-warmed to 37°C. Maintain solution at 37°C until Step 8. Prepare 10 mL of quencher solution for use in Step 10 (see recipe in Reagents and Solutions).
To avoid biotin phenol precipitation when diluted in complete DMEM, aggressively pipette 500 mM biotin phenol stock into complete DMEM and immediately vortex to solubilize.
-
7
Aspirate DMEM solution and wash cells three times with 500 μL of PBS.
-
8
Add 500 μL of 500 μM biotin phenol in complete DMEM to each of the experimental wells and negative control A. Add 500 μL of complete DMEM to negative control B.
-
9
Add 5 μL of 100 mM H2O2 in PBS to experimental wells and negative control A to achieve 1 mM final concentration. Rock plate back and forth to mix solution and incubate for one minute at room temperature.
-
10
Aspirate solution quickly and wash all wells three times with 500 μL of quencher solution.
Do not omit this wash step. Do not replace wash step with PBS. Quencher solution washes are essential for removing all excess hydrogen peroxide and biotin phenol. Omitting this step may lead to over-labeling.
Fixation and visualization of the labeling with fluorescence microscopy
-
11
Fix cells from each well with 4% PFA in PBS for 10 min at room temperature on a rocker.
-
12
Aspirate the 4% PFA in PBS and wash each well three times with 500 μL of PBS.
-
13
Add 300 μL of Streptavidin-Cy5 (1:500 dilution in PBST) to each well. Cover the plate with aluminum foil, and incubate for 1 h rocking at room temperature or overnight rocking at 4°C.
-
14
Aspirate solution and wash three times with 500 μL of PBST.
-
15
Add 300 μL of 1 μg/mL Hoescht (see recipe in Reagents and Solutions) and incubate for 10 min at room temperature.
-
16
Aspirate solution and wash three times with 500 μL of PBST.
-
17
Add 300 μL of PBST to each well and image with CY5, DAPI, and brightfield channels on EVOS M5000 microscope (Fig. 3A).
The extent of proximity tagging is visualized and assessed using the intensity of Cy5 fluorophore. For successful tagging, we look for 1) the presence of significant fluorescence signals arising from the cells over control (e.g. no PX-Gal3) conditions, 2) a dose-dependent increase of fluorescence based on the amount of PX-Gal3 fusion protein, and 3) the correct expected localization of the fluorescence signal. For galectin-3 and other similar GBPs, which are expected to mostly interact with cell surface glycans, a 30–60 minute incubation period is expected to yield fluorescence signals from cell surfaces that are observed as hollow circles that do not overlap with the nucleus (visualized by Hoescht 33342 stain). The brightfield channel further aids in this observation. Over the course of the 30–60 min incubation period, some intracellular tagging could be expected due to the normal endocytosis of the fusion protein, but most of the interactors and hence, fluorescence signal, should arise from cell surfaces.
Figure 3.
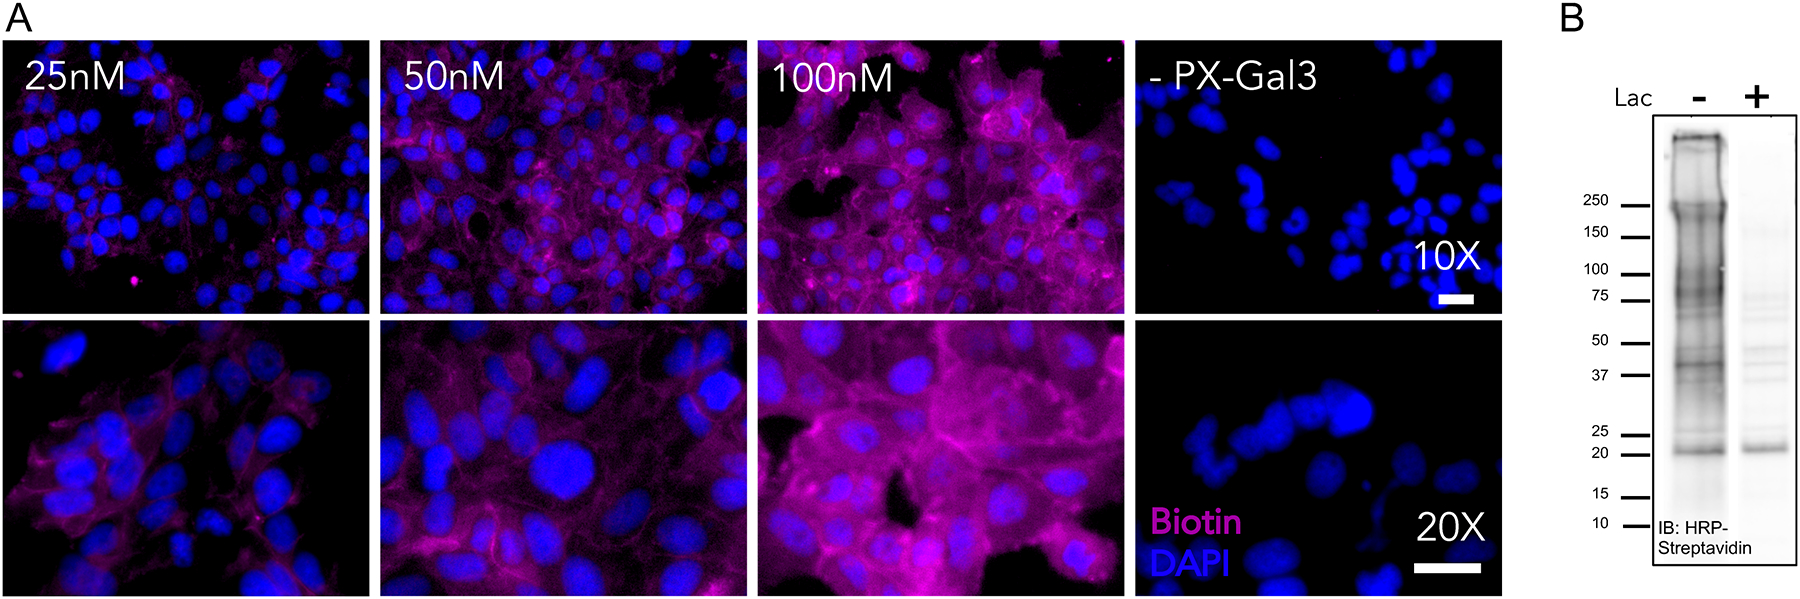
Examples of in situ labeling visualization and validation. (A) Fluorescence microscopy images of dose-dependent labeling of PX-Gal3 in LX-2 hepatic stellate cells. Increases in Cy-5 fluorescence (purple) indicates enhancements in PX-Gal3 labeling. (B) Immunoblot (IB) analysis of biotinylated proteins detected using streptavidin-HRP following proximity labeling with 100 nM PX-Gal3 as well as cells co-incubated with 100 mM lactose to evaluate binding competition. Figure adapted from PNAS, 2020; 117(44), 27329. Copyright 2020 CC BY-NC-ND 4.0.
ALTERNATE PROTOCOL 2
Western blot analysis of in situ proximity labeling:
Introductory paragraph:
In addition to visualization by fluorescence microscopy, another comparative analysis of proximity labeling is western blotting before proceeding to proteomics. Once the proximity labeling is finished and quenched, the cells can be collected and lysed for western blot analysis. Once samples are run on an SDS-PAGE gel and transferred onto a PVDF membrane, the amount of biotinylation of proteins in the lysate can be comparatively analyzed using streptavidin-HRP and visualized using chemiluminescence.
Additional Materials (also see Basic Protocol 2):
1X RIPA (see recipe in Reagents and Solutions)
DC™ Protein Assay Reagent A (BioRad, Cat. #5000113)
Protein Assay Reagent B (BioRad, Cat. #5000114)
4X Laemmli Buffer (see recipe in Reagents and Solutions)
Precision Plus Protein™ Unstained Standards (Protein Ladder) (BioRad, Cat. No. 161–0363)
Stain-free Gel (BioRad, Cat. No. 1610183)
WesternSure® Pre-stained Chemiluminescent Protein Ladder – (Li-Cor, P/N: 926–98000)
Chameleon® Duo Pre-stained Protein Ladder (Li-Cor, P/N: 928–60000)
Transfer Buffer (see recipe in Reagents and Solutions)
Methanol (e.g. Fisher Scientific, Cat. No. A412–20)
Tris-buffered saline with Tween-20 (TBST, see recipe in Reagents and Solutions)
5% BSA in TBST (see recipe in Reagents and Solutions)
PVDF HRP membrane (Immobilon®- P Transfer Membrane – Cat.No. IPVH00010)
PVDF FL membrane (Immobilon®- FL Transfer Membrane – Cat.No. IPFL00010)
Streptavidin-HRP Conjugate (BioWorld, Cat. No. 40180002–1)
Chemiluminescent HRP substrate (e.g. SuperSignal™ West Pico PLUS Chemiluminescent Substrate, Cat. No. 34577)
Cell scraper (e.g. Biologix, Cat. No. 70–2810)
Refrigerated microcentrifuge
Power source (BioRad)
Gel box (BioRad)
SDS-PAGE cassette (BioRad)
Transfer cassette (BioRad)
Filter paper (BioRad)
Sponges (BioRad)
PVDF HRP membrane (Immobilon®- P Transfer Membrane – Cat.No. IPVH00010)
PVDF FL membrane (Immobilon®- FL Transfer Membrane – Cat.No. IPFL00010)
Stir bar
Stir plate
Rocker
Chemidoc Imager (BioRad)
Cell treatment
-
1
Treat 6 wells of a 6-well plate with 750 μL of poly-D-lysine for 15 min at room temperature. Remove and collect the poly-D-lysine for reuse up to four times. Wash wells three times with 1 mL of PBS. Air dry plate in a biosafety cabinet for at least 10 min.
-
2
Plate 1.75 × 10⁶ LX-2 human hepatic stellate cells in each poly-D-lysine treated well. Incubate cells overnight in 500 μL of complete DMEM at 37°C in 5% CO2. Check confluency the next day.
Poly-D-lysine treatment is necessary for cells that loosely adhere to plates. The proximity labeling method requires multiple sequential washes which may disrupt cells. The confluency should be 80% to 90% before proceeding. If this confluency is not obtained, continue to incubate cells at 37°C in 5% CO2 until achieved.
-
3
Prepare the following four unique experiment treatment solutions in DMEM with total volumes of 750 μL: 25 nM, 50 nM, and 100 nM PX-Gal3, as well as 100 nM PX-Gal3 and 100 mM lactose (diluted from 500 mM stock, see recipe in Reagents and Solutions).
Note that the DMEM used in this step is not the complete DMEM solution used in Step 2.
-
4
Aspirate the complete DMEM from 6-well plate, and wash cells three times with 750 μL of PBS.
-
5
In four separate wells, add 750 μL of experiment treatment solutions prepared in Step 3. Add 750 μL of DMEM to each of the two remaining wells for negative control A and B. Incubate at 37°C in 5% CO2 for 30 min.
-
6
During the incubation period, prepare 5.5 μL of 500 mM biotin phenol in DMSO and dilute to 5.5 mL of 500 μM of biotin phenol with complete DMEM pre-warmed to 37°C. Maintain solution at 37°C until Step 8. Prepare 25 mL of quencher solution for use in Step 10.
To avoid biotin phenol precipitation when diluted in complete DMEM, aggressively pipette 500 mM biotin phenol stock into complete DMEM and immediately vortex to solubilize.
-
7
Aspirate media and wash cells three times with 750 μL of PBS.
-
8
Add 750 μL of 500 μM biotin phenol in complete DMEM to each of the experimental wells and negative control A. Add 500 μL of complete DMEM to negative control B.
-
9
Add 7.5 μL of 100 mM H2O2 (10 M stock diluted in PBS) to experimental wells and negative control A to achieve final concentration of 1 mM in each well. Rock plate back and forth to mix solution and incubate for one minute at room temperature.
-
10
Aspirate solution quickly and wash all wells three times with 1 mL of quencher solution.
-
11
Add 500 μL of quencher solution to each plate and scrape cells with scraper. Transfer harvested cells into 1.7-mL microcentrifuge tubes. Repeat once to ensure recovery of as many cells as possible.
-
12
Pellet collected cells for three min at 3,000 RPM, 4°C.
-
13
Remove supernatant and wash twice with 500 μL of cold PBS using pelleting conditions in Step 12.
Pellets can be stored at −80°C for less than a week at this step, if necessary.
Cell lysis and protein concentration standardization
-
14
Lyse cells by adding 50 μL of 1X RIPA (see recipe in Reagents and Solutions) and incubate for 15 min at 4°C.
-
15
Pre-clarify lysate by centrifuging samples for 15 min at 16,000 × g, 4°C.
-
16
Collect supernatant slowly and transfer into new 1.7-mL microcentrifuge tubes.
-
17Add 2 mg/mL BSA to a 96-well plate in 1 μL increments from 1 μL to 6 μL as a standard for the colorimetric assay. Also add 2 μL of protein lysate to the same plate in triplicate.
- Add 20 μL of DC™ Protein Assay Reagent A to each well using a multi-channel pipet.
-
Change tips and add 160 μL of Protein Assay Reagent B to each well using a multi-channel pipet.Note that the second reagent is light sensitive. If poured into a solution reservoir, cover with aluminum foil until it is actively being used. Carefully add solution to avoid producing bubbles. These bubbles will reduce the accuracy of the measurement acquired by the plate reader.Other protein assays are viable depending on the make-up of the lysis buffer. The Pierce 660nm protein assay (ThermoFisher, Cat. No. 22662) is another viable option. When choosing a protein assay, confirm that the different components of the lysis buffer do not interfere with the assay reading.
- Incubate for 3–5 min at room temperature then record absorbance using a plate reader at 750 nm.
- Plot the measured absorbance from the BSA standards in each well, with 1 μL of 2 mg/mL BSA added correlating to 1 mg/mL concentration and increasing linearly. Plot a linear regression line and determine its equation. Calculate the average of the measured absorbance for each lysate, and use the linear regression equation to determine the lysate protein concentration.
- Standardize the protein concentration of each sample to the lowest concentration sample.
SDS-PAGE gel
-
18
Prepare each sample for gel loading by diluting 4X Laemmli Buffer (supplemented with β-mercaptoethanol (10% v/v)) to 1X by adding appropriate volume to each sample in new 1.7-mL microcentrifuge tubes.
-
19
Boil sample for 5 min at 95°C in a heating block.
-
20
Cool each sample on ice for a few seconds, and spin down quickly with a microfuge to spin down any condensate from the top of the lid.
-
21
Load 10 μg of each sample into a TGX Stain-Free™ FastCast™ 10% polyacrylamide gel (Bio-Rad) and 2 μL of ladder (Bio-Rad). Run the gel at 95 V for 90 min.
Transfer
-
22
Place an open transfer cassette in a container with Transfer Buffer. Place one foam pad on the black panel of the transfer cassette and stack two blotting papers on top. Carefully place the SDS-PAGE gel on top of the blotting papers ensuring it is completely flat without creases or air bubbles. Soak the PVDF membrane in methanol for 30 sec, and then equilibrate it by soaking with transfer buffer for at least 30 sec before placing it on the top of the gel. Manipulation of the PVDF membrane should be done with tweezers. Carefully remove any air bubbles that may form between the gel and the membrane by rolling with roller. Add two blotting papers on top of the membrane, followed by the second foam pad. Carefully, close the transfer cassette and place the transfer sandwich into the gel transfer cell. Fill the tank to the top with transfer buffer. Place an ice pack and stir bar in the tank. Place the entire tank onto a stir plate and run the transfer at 300 mA for 1 h while stirring.
-
23
Remove the membrane from the transfer sandwich and block the membrane with 5% BSA (w/v) in TBST for 1 h at room temperature while rocking.
-
24
Wash the membrane three times with TBST for 5 min, room temperature while rocking.
-
25
Incubate the membrane with 1:1000 of Streptavidin-HRP in 5% BSA (w/v) in TBST for 1 h at room temperature or overnight at 4°C while rocking.
-
26
Wash the membrane three times with TBST for 5 min, room temperature while rocking.
-
27
Develop the membrane using HRP substrate for 5 min.
-
28
Image the chemiluminescence signal using the “Chemiluminescence” setting on Chemidoc imager (Bio-Rad) (Fig. 3B).
BASIC PROTOCOL 3: Identification and analysis of labeled proteins by quantitative mass spectrometry (MS)-based proteomics with tandem mass tags (TMT)
This protocol describes the process for preparing the biotin-labeled samples for proteomic analysis. In order to acquire the necessary amount of protein lysate to perform proteomics, the labeling will be scaled up significantly per condition. The ideal amount of protein lysate needed for this protocol is 750 μg – 1 mg. In our hands, we typically obtain ~1–1.5 mg of protein lysate per 20 × 106 LX-2 cells in a 15 cm2 dish. The treated samples will be normalized by concentration following lysis, then denatured, reduced to break disulfide bonds, alkylated to prevent reformation of the disulfide bonds, enriched using streptavidin-agarose beads, and digested overnight on beads by trypsin. The digested peptides will then be labeled using a 10-plex tandem mass tag (TMT) and desalted before being injected into the mass spectrometer for analysis. If only nine samples are needed, then omit either the first of the 10-plex TMT (129N) or the last (131) channels when performing this protocol.
Materials:
Poly-D-lysine (Corning, Cat. No. 354210)
1X Phosphate-buffered saline (PBS)
LX-2 human stellate cells (LX-2 HSCs) (e.g. Millipore SCC064) or appropriate cultured cells
Complete DMEM (see recipe in Reagents and Solutions) or appropriate media
DMEM (e.g. ThermoFisher, Cat. No. 11995065) or appropriate media
Purified PX-Gal3 protein (from Basic Protocol 1) or desired fusion protein
500 mM lactose (see recipe in Reagents and Solutions)
Biotin phenol (e.g. ApexBio, CAS No. 41994-02-9, Cat. No. A8011)
Hydrogen peroxide solution (30% w/w) in H2O (Sigma, CAS No. 7722-84-1, Cat. No. H1009-100ML)
Quencher solution (see recipe in Reagents and Solutions)
2 mg/mL bovine serum albumin (BSA; e.g. RPI, CAS No. 9048-46-8) in MΩ water
DC™ Protein Assay Reagent A (BioRad 5000113)
Protein Assay Reagent B (BioRad 5000114)
LC-MS grade methanol (e.g. Fisher Scientific A456–4)
4:1 methanol and chloroform (see recipe in Reagents and Solutions)
6 M Urea (see recipe in Reagents and Solutions)
10% sodium-dodecyl sulfate (SDS) (Sigma) (Cas No. 151-21-3)
Tris(2-carboxyethyl)phosphine (TCEP; e.g. Fisher Scientific, CAS No. 51805-45-9, Cat. No. AC363830010)
K2CO3 (e.g. Acros Organics, CAS No. 584-08-7, Cat. No. 424081000)
Iodoacetamide (e.g. Sigma, CAS No. 144-48-9, Cat. No. I1149)
Streptavidin agarose resin (e.g. Thermo Scientific, Cat. No. 20353)
100 mM Triethylammonium bicarbonate (TEAB) (see recipe in Reagents and Solutions)
Trypsin premix (see recipe in Reagents and Solutions)
Optima™ LC/MS Grade acetonitrile (e.g. Fisher Scientific, CAS No. 75-05-8, Cat. No. A955-500)
TMT tags (Thermo Fischer Scientific, Cat.No. 90406)
50% hydroxylamine solution in water (e.g. Sigma-Aldrich, Cat. No. 467804)
Optima™ LC/MS Grade formic acid (Fisher Scientific, CAS No. 64-18-6)
Buffer A (see recipe in Reagents and Solutions)
15 cm2 plates (e.g. CellPro TDN0150)
Biosafety cabinet
Incubator (37°C and 5% CO2)
1.7-mL microcentrifuge tubes (e.g. VWR, Cat. No. 87003–294)
Vortex
Cell scraper (e.g. Biologix, Cat. No. 70–2810)
15-mL centrifuge tubes (VWR, Cat. No. 525–1068)
Refrigerated microcentrifuge
Branson SFX250 Sonicator
96-well, flat bottom plate (Genesee Scientific, Cat. No. 25–109)
Plate reader (e.g. BMG Labtech Clariostar)
Shaking incubator (e.g. Corning 6790)
Tube Revolver / Rotator (ThermoFisher, Cat. No. 88881001)
1.5-mL protein lo-bind microcentrifuge tubes (e.g. Eppendorf, Cat. No. 022431081)
2.0-mL microcentrifuge tubes
Speed vacuum (e.g. ThermoFisher, Savant SpeedVac SPD140DDA)
Microfuge
C-18 columns (Thermo Scientific - Pierce®C18 Spin Columns – Cat.No.89873)
Lumos
Cell treatment and lysis
-
29
Treat nine 15 cm2 plates with 7 mL of poly-D-lysine for 15 min at room temperature. Remove and collect the poly-D-lysine for reuse up to four times. Wash plates three times with 4 mL of PBS. Air dry plate in a biosafety cabinet for at least 2 hours.
-
30
Plate 20.0 × 10⁶ LX-2 human hepatic stellate cells in each poly-D-lysine treated plate. Incubate cells overnight in 10 mL of complete DMEM at 37°C in 5% CO2. Check confluency the next day.
Poly-D-lysine treatment is necessary for cells that loosely adhere to plates. The proximity labeling method requires multiple sequential washes which may disrupt cells. The confluency should be 80% to 90% before proceeding. If this confluency is not obtained, continue to incubate cells at 37°C in 5% CO2 until achieved.
-
31
Prepare 25 mL of DMEM with 100 nM PX-Gal3 purified protein and 25 mL of DMEM with 100 nM PX-Gal3 and 100 mM lactose (diluted from 0.5 M stock of lactose in PBS).
Note that the DMEM used in this step is not the complete DMEM solution used in Step 2.
-
32
Aspirate the complete DMEM from 15 cm2 plates, and wash each plate once with 4 mL of PBS.
-
33
Add 8 mL of DMEM with 100 nM PX-Gal3 purified protein to 15 cm2 plates in triplicate. For competition, add 8 mL of DMEM with 100 nM PX-Gal3 and 100 mM lactose to 15 cm2 plates in triplicate. For negative control, add 8 mL of DMEM to 15 cm2 plates in triplicate. Incubate at 37°C in 5% CO2 for 30 min.
-
34
During the incubation period, prepare 75 μL of 500 mM biotin phenol in DMSO, and dilute to create 75 mL of 500 μM biotin phenol in complete DMEM pre-warmed to 37°C. Maintain solution at 37°C until Step 8. Prepare 75 mL of quencher solution for use in Step 10.
To avoid biotin phenol precipitation when diluted in complete DMEM, aggressively pipette 500 mM biotin phenol stock into complete DMEM and immediately vortex to solubilize.
-
35
Aspirate the DMEM solution and wash each plate twice with 4 mL of PBS.
-
36
Add 8 mL of 500 μM biotin phenol in complete DMEM to each plate. Incubate at 37°C in 5% CO2 for 30 min.
-
37
Add 80 μL of hydrogen peroxide (100 mM in PBS) to each plate. Rock plate back and forth to mix solution, and incubate for one minute at room temperature.
-
38
Aspirate solution quickly and wash each plate three times with 8 mL of quencher solution.
-
39
Add 2 mL of quencher solution to each plate and scrape cells with cell scraper. Transfer harvested cells into 15-mL tubes keeping samples separated by plate. Repeat once to ensure recovery of as many cells as possible.
-
40
Pellet collected cells at 3,000 RPM for three min at 4°C.
-
41
Remove supernatant and wash twice with 2 mL of cold PBS using pelleting conditions in Step 12.
Pellets can be stored at −80°C for less than a week at this step if necessary.
-
42
Add 400 μL of cold PBS to each pellet. Lyse with a sonicator (e.g. Branson SFX250 with total ON time: 1 sec; ON time: 15 ms; OFF time: 40 ms; Amplitude: 15%).
Protein concentration standardization
-
43
Determine the protein lysate concentration of each sample using the Lowry protein assay (See Step 17 in Basic Protocol 1).
-
44
Standardize the protein concentration of each sample to 1.0–2.0 mg/mL by diluting with PBS to achieve a final volume of 500 μL in new 15 mL centrifuge tubes.
If no samples have a concentration of 1.0 mg/mL, proceed with the samples standardized to the highest concentration possible. Note that this is not ideal and may negatively affect quantitation. The ideal concentration range is 1.5–2.0 mg/mL.
Protein precipitation
-
45
If the protein concentrations are less than 1.5 mg/mL, add 2 mL of cold MeOH to each sample, and store at −20°C for at least one hour. If the protein concentrations are greater than or equal to 1.5 mg/mL, add 2.5 mL of cold 4:1 MeOH:CHCl3 and then 1 mL of cold PBS. Briefly vortex.
The protein will precipitate once the cold PBS is added to the cold 4:1 MeOH:CHCl3 solution.
-
46
Spin for 10 min at 5,000 RPM, 4°C to create a protein pellet or disc. Carefully remove the supernatant.
If the protein concentration is less than 1.5 mg/mL, a protein disc is expected. Great care must be used to avoid aspirating the protein disc. Angle the tube at ~45° and slowly rotate as the supernatant is removed. With this technique, the disc should adhere to the side of the tube preventing sample loss.
-
47
Wash each sample with 1 mL of cold 4:1 MeOH:CHCl3. Sonicate with a sonicator (e.g. Branson SFX250 with total ON time: 1 sec; ON time: 15 ms; OFF time: 40 ms; Amplitude: 15%) to resuspend protein.
-
48
Spin for 10 min at 5,000 RPM, 4°C to create a protein pellet. Carefully remove the supernatant.
Let sample air dry to remove any remaining chloroform in the tube for at least 10 min. Prepare solutions for the following steps while air drying.
Pellets can be stored at −80°C for less than a week at this step if necessary.
Denaturation, reduction and alkylation
-
49
Add 500 μL of freshly prepared 6M urea in PBS and 10 μL of 10% SDS in PBS to each tube.
-
50
Premix equal volumes of freshly prepared 200mM TCEP in PBS and 600 mM K2CO3 in PBS. Add 50 μL of this solution to each sample.
-
51
Incubate samples for 30 min shaking at 180 RPM, 37°C.
-
52
Add 70 μL of freshly prepared 400 mM iodoacetamide (IAA) in PBS to each tube. Incubate for 30 min at room temperature, protected from light.
-
53
Add 130 μL of 10% SDS in PBS to each sample. Dilute each sample with 5.5 mL of PBS.
Streptavidin enrichment and trypsinization
-
54
Prepare streptavidin agarose resin (100 μL per sample – e.g. 1 mL of bead slurry for 10 samples).
Cut approximately 5 mm off the tip of a 1000 μL pipette tip and transfer 1 mL of streptavidin agarose resin slurry into one 15-mL centrifuge tube. Shake bottle to homogenously resuspend beads in storage buffer before transferring to tube.
Wash bead slurry with 10 CV (10 mL) of PBS. Pellet beads for 2 min at 2000 RPM, room temperature. Remove supernatant.
Streptavidin beads can be washed during the IAA incubation in Step 26.
-
55
Resuspend beads in 2 CV of PBS (2 mL) and transfer 200 μL of resuspended beads directly to each sample.
-
56
Incubate for 1.5 hours at room temperature while rotating.
-
57
Spin down for 2 minutes at 2,000 RPM, 4°C to pellet beads. Remove supernatant.
-
58
Wash beads with 5 mL of 0.2% SDS in PBS. Spin down for 2 minutes at 2,000 RPM, 4°C to pellet beads. Remove supernatant.
-
59
Wash beads with 5 mL of PBS. Spin down for 2 minutes at 2,000 RPM, 4°C to pellet beads. Remove supernatant. Repeat once.
-
60
Wash beads with 5 mL of 100 mM TEAB pH 8.5. Spin down for 2 minutes at 2,000 RPM, 4°C to pellet beads. Remove supernatant.
-
61
Resuspend beads with 500 μL of 100 mM TEAB pH 8.5, and transfer to lo-bind microcentrifuge tubes. Wash each 15-mL centrifuge tube with 500 μL of 100 mM TEAB pH 8.5, and transfer to the lo-bind microcentrifuge tubes to ensure complete transfer of beads.
-
62
Pellet beads for 2 min at 2,000 RPM, 4°C. Remove supernatant.
-
63
Resuspend beads in 200 μL of freshly prepared trypsin premix (~2 μg trypsin per sample, see recipe in Reagents and Solutions).
-
64
Incubate overnight shaking at 180 RPM, 37°C.
TMT labelling and sample combining
-
65
Spin down samples for 5 min at 2,000 RPM, 4°C. With a gel-loading tip, carefully transfer 200 μL supernatant to new lo-bind microcentrifuge tubes.
-
66
Wash beads with 100 μL of 100 mM TEAB pH 8.5. Spin for 5 min at 2,000 RPM, 4°C. Transfer the 100 μL of supernatant to the 200 μL of supernatant collected in Step 39.
-
67
Add 120 μL of anhydrous acetonitrile to achieve final concentration of 30%.
-
68
Transfer 100 μL of each peptide mix to respective 10-plex TMT tag tube. Pipet up and down, then recombine with peptide sample. Repeat to ensure all TMT tag is added to peptide solution.
Aliquot TMT tags in advance in PCR tubes at 8 μL volume and store at −80°C.
-
69
Incubate for 1 h at room temperature, and vortex occasionally.
-
70
Add 6 μL of 5% hydroxylamine (in MΩ water) to each sample to quench the reaction. Vortex, and incubate for 15 min at room temperature.
-
71
Add 4 μL of formic acid (MS-grade) to acidify samples.
-
72
Vacuum-centrifuge all samples to near dryness.
-
73
Combine all samples into one lo-bind microcentrifuge tube with the following technique. Reconstitute first sample in 400 μL of Buffer A by pipetting up and down. Vortex sample, and spin with benchtop microfuge until there is no solution on the cap or walls of the tube (~5 sec). Transfer the solution to the second tube, resuspend, vortex, and microfuge. Repeat this process until all peptides have been resuspended.
-
74
Wash first sample tube with 50 μL of Buffer A and repeat Step 73 to collect any remaining peptides in each sample and combine solutions. Check that the pH is ~3.
Final volume will be greater than 450 μL because of the remaining salt from Step 72. The final volume will be around ~600 μL; the sample will be split up into two and loaded into two C-18 columns for desalting.
Desalting
-
75Desalt samples using two C-18 columns.
- Activate two C-18 columns with 200 μL of 50% ACN. Spin for 1 min at 1,500 × g, room temperature. Collect the flow-through in a 2-mL microcentrifuge tube. Discard flow-through. Repeat twice.
- Equilibrate resin with 200 μL of 5% ACN, 0.1% formic acid in MΩ H2O. Spin for 1 min at 1,500 × g, room temperature. Collect the flow-through with a new microcentrifuge tube. Discard flow-through. Repeat three times.
- Equally split the peptide sample from Step 74 and add to resin (~300 μL of sample per column). Spin for 1 min at 1,500 × g, room temperature. Collect the flow-through in a new microcentrifuge tube.
- Add the flow-through back to the resin. Spin for 1 min at 1,500 × g, room temperature. Repeat twice.
- Wash resin with 200 μL of 5% ACN, 0.1% FA in MΩ H2O. Spin for 1 min at 1,500 × g, room temperature. Discard the flow-through. Repeat two times.
-
Elute the sample with 20 μL of freshly prepared 60% ACN three times. Collect the eluate in a new microcentrifuge tube. Combine eluates from both C-18 columns for a total volume of 120 μL.Protein lo-bind tubes are not necessary for these steps. Standard microcentrifuge tubes will suffice.
-
76
Vacuum-centrifuge to dryness.
Peptides can be stored at −80°C for up to a week if necessary.
MS injection
-
77
Dissolve sample in 20 μL of Buffer A. Spin for 10 min at 12,000 × g, 4°C, and transfer to MS vial.
The hard spin is to ensure that there are no precipitates present in the solution. The tube after Step 76 should look empty/clear. Any minute amount of solids can severely damage a high-resolution MS instrument.
-
78
Analyze sample on a high-resolution MS instrument (e.g. ThermoFisher Lumos).
Proteomics Data Analysis:
-
Filter data set for unique peptide ≥ 3.
Setting the unique peptide requirements to three or greater will greatly decrease the protein list compared to setting it to greater than or equal to two, but this leads to a much more stringent analysis. If the protein list decreases too much, the unique peptide filter can be set to two for a wider capture.
Take the average values of TMT abundance of each conditions from the performed replicates (PX-Gal3, PX-Gal3+Lac, Neg).
-
Take the ratios between PX-Gal3 and Neg for “Enrichment” and perform an initial filter for enrichment ratio greater than ≥ 10 (Fig. 4A).
This initial filter of enrichment ratio of greater than or equal to 10 is an arbitrary value. Based on our data, this provided a very stringent analysis, cutting out a majority of proteins that likely were nonspecifically captured on the streptavidin beads during the enrichment step. This narrowed down list also was highly correlated with the captured proteins that were highly competed with lactose competition, providing a strong list of glycan-mediated interactors of galectin-3 even before statistical analysis.
Perform statistical analysis using GraphPad Prism (see Statistical Analysis section below for detail).
-
Take the ratios between PX-Gal3 and PX-Gal3+Lac for “Competition”, the list of identified proteins where interaction was robustly competed out with lactose co-incubation (Fig. 4B).
Once again, the actual chosen cutoff values for what is considered “successfully competed” is arbitrary. We found that even after setting the cutoff for successful competition for a ratio greater than or equal to 4, we observed a significant number of proteins, indicating that galectin-3 was largely interacting through a glycan-mediated fashion when exogenously treated.
Compare the correlation of the statistically significant proteins between the competed and enriched proteins.
Figure 4.

Representative plots from the analysis of proteomics results. (A) Graph representation the correlation between statistically significant proteins and highly enriched proteins from PX-Gal3 over the negative treatment. (B) Graph representation of the correlation between statistically significant proteins and highly competed proteins from PX-Gal3 over PX-Gal3 co-incubated with lactose. (C) Correlation of the statistically significant proteins between the competition and enrichment ratio. Orange labeled proteins represent top target proteins identified chosen for potential validation. Figure adapted from PNAS, 2020; 117(44), 27329. Copyright 2020 CC BY-NC-ND 4.0.
REAGENTS AND SOLUTIONS:
Use 18.20 MΩ ultra-pure water in all recipes and protocol steps.
All 1X and 2X PBS solutions are prepared from the appropriate dilutions with 18.20 MΩ water and 10X PBS (Fisher Scientific, Cat. No. BP39920).
Ampicillin plates, 100 μg/mL
Dissolve 20 g of LB agar (Fisher, Cat. No. BP1425–500) in 500 mL of MΩ water. Sterilize by autoclave. Cool solution to ~50°C. Add 500 μL of 1000X ampicillin for a final concentration of 100 μg/mL concentration. Pour into 10 cm2 plates and let cool. Store at 4°C for up to one year.
Perform all pouring and cooling in a sterile environment. Use a Bunsen burner fire to keep area sterile.
Ampicillin, 1000X (100 mg/mL)
Dissolve 1 g of ampicillin sodium salt (VWR, CAS No. 69-52-3) in 10 mL of MΩ water. Filter solution by pumping with a syringe equipped with a 0.22 μm and store at −20°C for up to one year.
Bacterial Lysis Buffer
Dissolve 1.362 g imidazole (Sigma, CAS No. 288-32-4) in 500 mL of 2X PBS. Add 6 M HCl or 1 M NaOH dropwise until pH 7.2–7.8 is achieved. Bring final volume to 1 L. Store at 4°C for up to one year.
Bovine serum albumin (BSA) in TBST or PBST, 2% or 5%
Dissolve 200 mg (for 2%) or 500 mg (for 5%) of BSA (RPI, CAS No. 9048-46-8) in 10 mL of TBST or PBST. Rock gently to dissolve. Store at 4°C and use within the day.
Buffer A (0.1% formic acid in water)
Add 10 μL Optima™ LC/MS Grade formic acid (Fisher Scientific, CAS No. 64-18-6) to 10 mL MΩ water. Store at room temperature.
CaCl2, 100 mM
Dissolve 14.7 mg of calcium chloride dihydrate (Fisher Scientific, CAS No. 10035-04-8) in 1 mL of MΩ water. Store at room temperature.
Carbonate-Bicarbonate Buffer, 0.1 M, pH 9.6,
Dissolve 5.76 g of sodium bicarbonate (68.6 mM) and 3.331 g of sodium carbonate (31.4 mM) into 800 mL of MΩ water. Bring final up to 1 L with MΩ water and store at temperature.
Complete DMEM
Mix 500 mL of DMEM (ThermoFisher, Cat. No. 11995065) and 50 mL of fetal bovine serum (FBS, 10%, e.g. GeminiBio, GemCell™ Fetal Bovine Serum, Cat. No. 100–500). Sterile filter media in a biological safety cabinet using a 0.22 μm vacuum filtration system (CellPro, Cat. No. V50022). Store at 4°C for up to one year.
Isopropyl β-d-1-thiogalactopyranoside (IPTG), 1000X (1 M)
Dissolve 2.38 g of isopropyl β-d-1-thiogalactopyranoside (IPTG, BioWorld, CAS No. 367-93-1) in 10 mL of MΩ water. Filter solution by pumping with a syringe equipped with a 0.22 μm and store at −20°C for up to one year.
Nickel Wash Buffer
Add 900 mL of 2X PBS to 100 mL of Nickel Elution Buffer. Store at 4°C for up to one year.
Nickel Elution Buffer
Dissolve 20.42 g of imidazole (Sigma, CAS: 288-32-4) in 1 L of 2X PBS. Sterile filter buffer using 0.22 μm vacuum filtration system (CellPro, Cat. No. V50022). Store at 4°C for up to one year.
Lactose, 500 mM
Dissolve 90.08 mg of α-lactose monohydrate (Sigma, CAS No. 5989-81-1) in 500 μL of PBS. Prepare fresh immediately before every experiment.
Lactose Elution Buffer
Dissolve 4.50 g of α-lactose monohydrate (Sigma, CAS: 5989–81) in 50 mL of Lactose Wash Buffer. Store at 4°C for several months.
Lactose Wash Buffer / Protein Storage Buffer (2 mM EDTA, 0.05% Tween-20 v/v)
Dissolve 904.4 of mg EDTA in 1 L of 1X PBS. Slowly add 500 μL of Tween-20. Store at 4°C for up to one year.
Laemmli Loading Buffer, 4X (100 mL)
Dissolve 3.02 g of Tris Base in 40 mL water. Slowly add 40 mL of glycerol. Add concentrated HCl dropwise to bring pH to 6.75. Add 8 g of SDS.
Under fume hood, add 10 mL of β-mercaptoethanol and 10 mL of MΩ water. Add a pinch of bromophenol blue. Aliquot 500 μL into 1.7-mL Eppendorf tubes and store at −20°C indefinitely.
Luria-Bertani Broth (LB)
Dissolve 25 g of LB (RPI, Cat. No. L24040–5000.0) in 1 L of MΩ water. Sterilize by autoclaving. Store at 4°C for several months.
Methanol and chloroform, 4:1
Mix 200 mL of LC-MS grade methanol (e.g. Fisher Scientific A456–4) and 50 mL of LC-MS grade chloroform (e.g. Sigma-Aldrich 132950) in a glass bottle. Store at 4°C for several months.
NaCl, 5 M (2 L)
Dissolve 584.4 g NaCl in 1.5 L MΩ water. Bring volume up to 2 L with MΩ water. Store at room temperature.
Paraformaldehyde (PFA) in PBS, 4%
Add 4 g of paraformaldehyde (Sigma, CAS No. 30525-89-4, Cat. No. P6148-500G) to 50 mL of MΩ water with a stir bar. Heat and stir solution on a hot plate to ~55–57°C until it dissolves. Add 1 M NaOH dropwise while stirring to help with the dissolving. Add 10 mL of 10X PBS and cool solution to room temperature. Adjust the pH to 7.4 by adding 1 M HCl dropwise until pH is reached. Bring final volume up to 100 mL with MΩ water. Filter solution by pumping with a syringe equipped with a 0.45 μm to remove any remaining solids. Aliquot and store at −20°C for up to one year.
Phosphate-buffered saline with Tween-20 (PBST), 1X
Add 100 mL of 10X PBS (e.g. Fisher Scientific BP39920) and 2 mL of Tween-20 (Fisher Scientific, CAS No. 9005-64-5, Cat. No. BP337-100) to 898 mL of MΩ water. Store at room temperature.
Quencher solution
Create the three components of the quencher solution at 100×. Dissolve 1.00 mg sodium ascorbate (e.g. Chem-Impex International, Inc. 01436) per μL of MΩ water. Dissolve 1.00 mg sodium azide (e.g. Fisher Scientific BP922I) per μL of MΩ water. Dissolve 1.00 mg Trolox (Adipogen AG-CR1–3639) per μL of DMSO. Dilute these solutions in 1X PBS to achieve desired final volume. The sodium ascorbate and sodium azide solutions can be stored at 20°C for several months but the Trolox solution should be prepared fresh immediately before every experiment.
Radioimmunoprecipitation assay buffer buffer (RIPA Buffer), 1X
Add 100 μL of 5X RIPA Buffer (Cell BioLabs, Cat. No. AKR-191) in 400 μL of MΩ water. Prepare fresh immediately before use.
Running Buffer (4L)
Add 500 mL of Tris Glycine SDS PAGE Buffer (10X) (National Diagnostics, Cat. No. EC-870) to 4.5 L of MΩ water. Store at room temperature.
Sulfuric acid, 0.2 N (H2SO4)
Add 561 μL of concentrated sulfuric acid (Sigma, CAS No. 7664-93-9) dropwise into 25 mL of MΩ water. Adjust the final volume to 100 mL with MΩ water. Store at room temperature.
Transfer Buffer (1 L)
Add 200 mL of methanol to 800 mL of Running Buffer. Store at room temperature.
Triethylammonium bicarbonate (TEAB), 100 mM, pH 8.5
Dilute 1 mL of 1.0 M TEAB pH 8.5 (Thermo Scientific, Cat. No. 90114) in 9 mL of MΩ water to create 100 mM TEAB pH 8.5 solution. Prepare fresh immediately before every experiment.
Tris buffer, 0.5 M, pH 7.4 (2 L)
Dissolve 121.1g Tris base in 1.5 L of MΩ water. Adjust pH to 7.4 by dropwise addition of concentrated HCl. Bring up the volume to 2 L with MΩ water. Store at room temperature.
Tris buffered saline (TBS), 10X (1 L)
Add 500 mL of 0.5 M Tris pH 7.4 buffer to 200 mL of MΩ water. Add 300 mL of 5 M NaCl. Store at room temperature.
Trypsin premix
Add 2 mL of 100 mM TEAB pH 8.5 (see recipe in Reagents and Solutions) and 20 μL of 100 mM CaCl2 (see recipe in Reagents and Solutions) to vial of sequencing-grade porcine trypsin (Promega). Pipet to mix. Prepare fresh immediately before every experiment.
Urea, 6M
Dissolve 3.60 g of urea (e.g. Millipore, CAS No. 57-13-6) in 10 mL of MΩ water. Prepare fresh immediately before every experiment.
COMMENTARY
BACKGROUND INFORMATION:
Probing glycan-GBP interactions directly through solid phase binding assays began in the early 1980’s with radio-labeled GBPs and the probing of glycan mediated interactions on thin-layer chromatography (TLC). These experiments ultimately led to discoveries, such as the identification of the glycolipid GM1 as the ligand for cholera toxin GBP (Magnani, Smith, & Ginsburg, 1980) and stage-specific embryonic antigens (Gooi et al., 1981; Kannagi et al., 1983). This early method had a breakthrough in the late 1980’s as the development of lipid conjugation to reduced glycans allowed for their separation and immobilization on thin layer chromatography supports where the assays were performed (Childs et al., 1989; Mizuochi et al., 1989). In 2002, the high-throughput platform through printed glycan microarrays was introduced to study glycan-GBP interactions (Fukui, Feizi, Galustian, Lawson, & Chai, 2002; Park & Shin, 2002; Wang, Liu, Trummer, Deng, & Wang, 2002; Willats, Rasmussen, Kristensen, Mikkelsen, & Knox, 2002). Additional microarray-based techniques such as shotgun glycomics and beam search arrays, surface plasmon resonance (SPR), the use of glycopolymers and glycodendrimers in microarrays, DNA encoded glycan arrays utilizing next generation sequencing, and lectin-affinity columns to capture interactions have all contributed to the growth of the array-based methods of studying glycan-GBP interactions (Joeh, Vilen, O’Leary, & Huang, 2020). However, all of these methods drive focus onto the structure of the requisite binding glycans and require artificial, often static systems to study these interactions. In doing so, many key elements that dictate glycan-protein interactions such as their three-dimensional (3-D) presentation, glycan density, and localization are manipulated and fixed, resulting in potentially misleading captures and identification of glycan-mediated interactions that may not occur within the limitations of the native cellular environment.
This method focuses on surveying glycan-protein interactions in the context of live cells, their native cellular environment. Proximity labeling utilizes fusion protein constructs of the GBP of interest to an enzyme that can convert an inert biotin substrate into a reactive biotin intermediate that covalently reacts with nearby electron-rich amino acids. Three main enzymes are used to perform this biotin labeling: biotin ligase, horseradish peroxidase (HRP), and engineered ascorbate peroxidase (APEX). Biotin ligase-mediated proximity labeling utilizes the E. coli BirA biotin ligase to convert biotin and ATP into biotinoyl-5’-adenylate that can then label nearby lysine residues. Recent development of the biotin ligase enzyme into a much more kinetically favorable labeling enzyme, TurboID and miniTurboID, has dramatically decreased the time needed for labeling from up to 24 hours to as little as 10 minutes (Branon et al., 2018; Cho et al., 2020). The advantages of using biotin-ligase mediated proximity labeling lies in the use of non-toxic reagents, which favors it towards in vivo use; however, while the kinetics have been improved, it is still far behind the labeling window of peroxidase-mediated enzymes, which leads to poor temporal resolution and potential toxicity in long-term experiments. The peroxidase-mediated proximity labeling, APEX and HRP, both utilize hydrogen peroxide (H2O2) as a co-substrate that can rapidly oxidize biotin-phenol (BP) into a highly reactive phenoxyl radical with a short half-life (<1 ms) and radius (~20 nm) that can efficiently label nearby electron-rich residues. Although HRP has higher catalytic activity, it contains multiple disulfide bonds that limits its use to oxidizing environments in the secretory pathway such as within the ER lumen and at the cell surface. The advantages of peroxidase-mediated proximity labeling lie in its rapid labeling kinetics of <1 min which allows for great temporal resolution, and the particular use of APEX2 over HRP allows for greater application in both oxidizing and reducing environments. Coupled with the right choice of inhibitors, proximity labeling can be used to distinguish protein-protein interactions from glycan-mediated GBP interactions (Joeh, O’Leary, et al., 2020).
CRITICAL PARAMETERS:
E. coli strain for protein expression
The yield from protein expression can vary greatly from protein to protein. Even the slightest change, such as single point mutations, can lead to dramatic changes in expression levels and ultimately yield. It is important to consider the many different strains of E. coli that are available for protein expression. Many of them have been optimized for unique scenarios in which certain aspects (uncommon codons for amino acids in bacteria, high number of disulfide bonds in recombinant protein, etc.) that may lower protein expression yields have been remedied. While the BL21 strain is reliable and is among the most common strains, it is important to consider the possibility that low yield may be resolved simply by changing the E. coli strain that the recombinant protein is expressed in.
Optimal working concentration and treatment duration for labeling components
All working concentrations and treatment/incubation duration for the labeling components (e.g. recombinant fusion protein, biotin-phenol, H2O2) can be varied to further optimize the labeling efficiency of the method for each individual cell line or recombinant protein. For aspects pertaining to the recombinant fusion protein, the concentration needed to observe robust labeling can differ greatly between different GBPs of interest. While nanomolar concentrations of PX-Gal3 and 30 min incubations resulted in robust labeling, it is likely that other peroxidase fusion proteins may require larger concentrations and longer incubations time in order to observe efficient labeling. Basic Protocol 2 utilizing the fluorescence microscopy to visualize in situ labeling is a great opportunity to test different concentrations of the fusion protein necessary for strong labeling to occur. Biotin phenol and H2O2 concentration and treatment duration have been generally optimized (Hung et al., 2016), but further optimization of these parameters may lead to greater fine tuning of labeling.
Hydrogen peroxide/quencher solution toxicity
One of the disadvantages of performing peroxidase-mediated proximity labeling is the use of H2O2. Hydrogen peroxide is toxic to the cells and prolonged treatment can lead to cell death. The one-minute treatment of hydrogen peroxide should not lead to cell death for most cells; however, if cell death is observed, it may be necessary to shorten the incubation time. Thirty seconds would be a good additional checkpoint to begin but performing a range of conditions initially to determine the minimum treatment time necessary to observe labeling may be useful for cells more prone to death.
TROUBLESHOOTING:
| Problem: | Possible Cause: | Solution: |
|---|---|---|
| Absorbance signals from ELISA inconsistent among replicates | Temperature at which chemiluminescence substrate was added varied. Pipetting errors. |
Pre-warm the substrate at room temperature at least an hour prior to use, in the dark. Use a multi-channel pipette, making sure that the addition of reagents to technical replicate wells occurs simultaneously. |
| Low yield in protein expression | Low expression during induction Affinity-based purification not capturing recombinant protein |
Perform multiple, parallel small scale bacterial expression and test a range of IPTG concentrations and/or time/temperature of induction Try using different manufacturer beads for Ni-NTA or α-lactose agarose Change wash/elution buffer concentrations for imidazole/lactose respectively |
| Fluorescence signal from in situ labeling is weak | Not enough recombinant fusion protein during incubation Biotin phenol/H2O2 incubation and/or concentration not optimal Cells not staying adhered during labeling process |
Perform labeling with a range of concentrations and/or treatment duration for recombinant fusion protein, biotin phenol, and/or H2O2 Treat the wells/plates with poly-D-lysine or any other coating (depends on cell line) to help with the adherence |
| No signal from SDS-PAGE gel or western blot | Insufficient protein loading Poor antibody |
Load more protein initially Increase antibody concentration Try new antibodies for probing |
| Cell lysate concentration too low for 1.5–2.0 mg/mL normalization for proteomics | Cells may not produce as large of lysate concentration Lysis was not robust Proteins in lysate degraded/digested |
Seed more cells and/or use more or larger plates for experiment Perform sonication multiple times (make sure not to overheat the lysate) Use lysis buffer to lyse cells instead Supplement lysate solution with protease inhibitor cocktail (PIC) |
| TMT signal from the different samples vary greatly | Poor pipetting Inefficient TMT labeling |
Use protein lo-bind pipette tips and protein lo-bind tubes rather than standard Eppendorf tubes Ensure the acetonitrile addition before the TMT treatment is brought to 30% acetonitrile in final volume Increase the temperature during the TMT labeling from room temperature to 37°C |
| Final sample before loading onto the high-resolution MS instrument contains precipitate | Insufficient desalting Contamination |
Desalt again using a new C18 desalting column Centrifugate sample at 16,000 × g and collect the supernatant Filter out the precipitate using a filter column |
| Large contamination of keratin in proteomics sample | Contamination from skin/hair | Clean up the entire bench that the proteomics workflow will be performed at with 70% ethanol Use new gloves Do not hover over any open sample tubes Keep tubes closed whenever not in use |
STATISTICAL ANALYSIS: (optional)
Statistical analysis for proteomics was performed using GraphPad Prism. Once the raw TMT abundance average values were transformed into their corresponding log2 values, “Multiple t tests (and nonparametric test)” under “Grouped Analyses” was used to perform the t tests with “unpaired” experimental design. Individual variance was computed for each comparison and significance was determined as P value < 0.05.
UNDERSTANDING RESULTS:
For Basic Protocol 1, the anticipated results are sufficient yield of recombinant fusion protein with high purity. The yield of any recombinant protein can vary considerably for a number of reasons so plan to optimize the expression and purification conditions. Successful expression and purification of a recombinant protein will be clear through a single band in the SDS-PAGE gel and a clear, single corresponding band in the western blot. The purity of the protein can also be validated via the A230/A280 value of <0.57, indicating minimal nonspecific contamination. For Basic Protocol 2, the anticipated results are robust biotin labeling in live cells and clear visualization by fluorescence microscopy. If appropriate competitor molecules are available, a sharp attenuation of labeling and fluorescence should be observed when the fusion protein construct is co-incubated with said competitors. The results from the western blot probing for biotinylated proteins with streptavidin-HRP should mirror the fluorescence results from the microscopy data. For Basic Protocol 3, the anticipated results are successful generation of a protein list with enrichment patterns mirroring both the fluorescence microscopy and western blot from Basic Protocol 2. The ratios between the enrichment of the different conditions will tell corresponding data (i.e. high ratio value between standard treatment versus negative condition would suggest true enrichment over non-specific enrichment).
TIME CONSIDERATIONS:
Basic Protocol 1: expression and purification of fusion protein can be performed in four to six days. Plasmids should be ordered with sufficient time to be manufactured and shipped. Upon receipt, transformation can be performed immediately. Protein can be expressed and purified in three to four days. Purification and visualization with SDS-PAGE and western Blot requires one to two days. Note variable time commitments for each day. For example, the creation of the starter cultures can be performed in 5 min, whereas expression of protein in 1 L culture will require more than eight hours total, including four hour induction period. Extent of characterization of purified construct will also affect total time.
Basic Protocol 2: labeling of live cells in situ using PX-Gal3 and immunofluorescence microscopy can be performed in two to three days. Cells should achieve desired confluency after overnight incubation post-seeding, but variation in growth rate may extend this procedural delay. Labeling and microscopy steps can be performed in one day if desired, but overnight incubation of cells in Streptavidin-Cy5 is an alternative approach.
Basic Protocol 3: labeling of live cells in situ using PX-Gal3 and enrichment for MS-based proteomics can be performed in five to seven days. Cells should achieve desired confluency after overnight incubation post-seeding, but variation in growth rate may extend this procedural delay. Labeling of cells and protein precipitation can be performed on separate days or sequentially on the same day, requiring about six hours. These and other stopping points are indicated throughout the protocol with storage instructions. Careful planning should be done before starting the procedure to consider consumption of researcher’s time. Note TMT labeling requires approximately two hours of hands-on benchwork, but the vacuum-centrifugation and incubation steps could add several hours of waiting time. Thus, the efficiency of vacuum-centrifugation will also influence completion time and should be considered.
ACKNOWLEDGEMENTS:
E.J. is supported by a Skaggs Graduate Fellowship, enabled by the Henry and Jennifer Luttrell Foundation. A.E.R. is supported by a Skaggs Graduate Fellowship, enabled by the Schimmel Family Foundation. M.L.H. is supported by an NIH K99/R00 Pathway to Independence Award (R00HD0292-03). The M.L.H. lab is supported by startup funds from Scripps Research.
LITERATURE CITED:
- Böcker S, & Elling L (2017). Binding characteristics of galectin-3 fusion proteins. Glycobiology, 27(5), 457–468. doi: 10.1093/glycob/cwx007 [DOI] [PubMed] [Google Scholar]
- Branon TC, Bosch JA, Sanchez AD, Udeshi ND, Svinkina T, Carr SA, … Ting AY (2018). Efficient proximity labeling in living cells and organisms with TurboID. Nat Biotechnol, 36(9), 880–887. doi: 10.1038/nbt.4201 [DOI] [PMC free article] [PubMed] [Google Scholar]
- Childs RA, Drickamer K, Kawasaki T, Thiel S, Mizuochi T, & Feizi T (1989). Neoglycolipids as probes of oligosaccharide recognition by recombinant and natural mannose-binding proteins of the rat and man. Biochemical Journal, 262(1), 131–138. doi: 10.1042/bj2620131 [DOI] [PMC free article] [PubMed] [Google Scholar]
- Cho KF, Branon TC, Udeshi ND, Myers SA, Carr SA, & Ting AY (2020). Proximity labeling in mammalian cells with TurboID and split-TurboID. Nature Protocols, 15(12), 3971–3999. doi: 10.1038/s41596-020-0399-0 [DOI] [PubMed] [Google Scholar]
- Fukui S, Feizi T, Galustian C, Lawson AM, & Chai W (2002). Oligosaccharide microarrays for high-throughput detection and specificity assignments of carbohydrate-protein interactions. Nat Biotechnol, 20(10), 1011–1017. doi: 10.1038/nbt735 [DOI] [PubMed] [Google Scholar]
- Gooi HC, Feizi T, Kapadia A, Knowles BB, Solter D, & Evans MJ (1981). Stage-specific embryonic antigen involves αl→ 3 fucosylated type 2 blood group chains. Nature, 292(5819), 156–158. doi: 10.1038/292156a0 [DOI] [PubMed] [Google Scholar]
- Hung V, Udeshi ND, Lam SS, Loh KH, Cox KJ, Pedram K, … Ting AY (2016). Spatially resolved proteomic mapping in living cells with the engineered peroxidase APEX2. Nature Protocols, 11(3), 456–475. doi: 10.1038/nprot.2016.018 [DOI] [PMC free article] [PubMed] [Google Scholar]
- Joeh E, O’Leary T, Li W, Hawkins R, Hung JR, Parker CG, & Huang ML (2020). Mapping glycan-mediated galectin-3 interactions by live cell proximity labeling. Proceedings of the National Academy of Sciences, 117(44), 27329. doi: 10.1073/pnas.2009206117 [DOI] [PMC free article] [PubMed] [Google Scholar]
- Joeh E, Vilen Z, O’Leary T, & Huang ML (2020). Recent Advancements in Arrayed Technologies and Emerging Themes in the Identification of Glycan-Protein Interactions. In Glycan-Based Cellular Communication: Techniques for Carbohydrate-Protein Interactions (Vol. 1346, pp. 1–21): American Chemical Society. [Google Scholar]
- Kannagi R, Levery SB, Ishigami F, Hakomori S, Shevinsky LH, Knowles BB, & Solter D (1983). New globoseries glycosphingolipids in human teratocarcinoma reactive with the monoclonal antibody directed to a developmentally regulated antigen, stage-specific embryonic antigen 3. J Biol Chem, 258(14), 8934–8942. [PubMed] [Google Scholar]
- Lam SS, Martell JD, Kamer KJ, Deerinck TJ, Ellisman MH, Mootha VK, & Ting AY (2015). Directed evolution of APEX2 for electron microscopy and proximity labeling. Nat Methods, 12(1), 51–54. doi: 10.1038/nmeth.3179 [DOI] [PMC free article] [PubMed] [Google Scholar]
- Lee J, Song EK, Bae Y, Min J, Rhee H-W, Park TJ, … Kang S (2015). An enhanced ascorbate peroxidase 2/antibody-binding domain fusion protein (APEX2–ABD) as a recombinant target-specific signal amplifier. Chemical Communications, 51(54), 10945–10948. doi: 10.1039/C5CC02409A [DOI] [PubMed] [Google Scholar]
- Liu Q, Zheng J, Sun W, Huo Y, Zhang L, Hao P, … Zhuang M (2018). A proximity-tagging system to identify membrane protein–protein interactions. Nature Methods, 15(9), 715–722. doi: 10.1038/s41592-018-0100-5 [DOI] [PubMed] [Google Scholar]
- Magnani JL, Smith DF, & Ginsburg V (1980). Detection of gangliosides that bind cholera toxin: Direct binding of 125I-labeled toxin to thin-layer chromatograms. Analytical Biochemistry, 109(2), 399–402. doi: 10.1016/0003-2697(80)90667-3 [DOI] [PubMed] [Google Scholar]
- Mavylutov T, Chen X, Guo L, & Yang J (2018). APEX2- tagging of Sigma 1-receptor indicates subcellular protein topology with cytosolic N-terminus and ER luminal C-terminus. Protein & Cell, 9(8), 733–737. doi: 10.1007/s13238-017-0468-5 [DOI] [PMC free article] [PubMed] [Google Scholar]
- Mizuochi T, Loveless RW, Lawson AM, Chai W, Lachmann PJ, Childs RA, … Feizi T (1989). A library of oligosaccharide probes (neoglycolipids) from N-glycosylated proteins reveals that conglutinin binds to certain complex-type as well as high mannose-type oligosaccharide chains. J Biol Chem, 264(23), 13834–13839. [PubMed] [Google Scholar]
- Paek J, Kalocsay M, Staus DP, Wingler L, Pascolutti R, Paulo JA, … Kruse AC (2017). Multidimensional Tracking of GPCR Signaling via Peroxidase-Catalyzed Proximity Labeling. Cell, 169(2), 338–349.e311. doi: 10.1016/j.cell.2017.03.028 [DOI] [PMC free article] [PubMed] [Google Scholar]
- Park S, & Shin I (2002). Fabrication of carbohydrate chips for studying protein-carbohydrate interactions. Angew Chem Int Ed Engl, 41(17), 3180–3182. doi: 10.1002/1521-3773(20020902)41:17<3180::Aid-anie3180>3.0.Co;2-s [DOI] [PubMed] [Google Scholar]
- Wang D, Liu S, Trummer BJ, Deng C, & Wang A (2002). Carbohydrate microarrays for the recognition of cross-reactive molecular markers of microbes and host cells. Nat Biotechnol, 20(3), 275–281. doi: 10.1038/nbt0302-275 [DOI] [PubMed] [Google Scholar]
- Willats WG, Rasmussen SE, Kristensen T, Mikkelsen JD, & Knox JP (2002). Sugar-coated microarrays: a novel slide surface for the high-throughput analysis of glycans. Proteomics, 2(12), 1666–1671. doi: 10.1002/1615-9861(200212)2:12<1666::Aid-prot1666>3.0.Co;2-e [DOI] [PubMed] [Google Scholar]