

Abstract
We investigated the utility of the fluorescent dye (Deep Red Anthraquinone 5) DRAQ5 for digital staining of optically sectioned skin in comparison to Acridine Orange (AO). Eight fresh-frozen thawed Mohs discard tissue specimens were stained with AO and DRAQ5, and imaged using an ex vivo confocal microscope at three wavelengths (488 nm and 638 nm for fluorescence, 785 nm for reflectance). Images were overlaid (AO+Reflectance, DRAQ5+Reflectance), digitally stained, and evaluated by three investigators for perceived image quality (PIQ) and histopathological feature identification. In addition to nuclear staining, AO seemed to stain dermal fibers in a subset of cases in digitally stained images, while DRAQ5 staining was more specific to nuclei. Blinded evaluation showed substantial agreement, favoring DRAQ5 for PIQ (82%, Cl 75–90%, Gwet’s AC 0.74) and for visualization of histopathological features in (81%, Cl 73–89%, Gwet’s AC 0.67), supporting its use in digital staining of multimodal confocal micrographs of skin.
Keywords and Research Resource Identifiers: DRAQ5, Acridine Orange, Confocal Microscopy, Mohs, tissue fixture, EVCM
Introduction
Ex vivo confocal microscopy (EVCM), using reflectance and fluorescence contrast, has proven itself to be a useful tool for rapid high-resolution imaging of frozen-thawed and fresh tissue samples. Acridine Orange (AO) is commonly used as a nucleus-specific fluorescent probe and has become the mainstay in investigations of EVCM of skin as well as in ex vivo surgical pathology in the study of breast, prostate, liver, lung, kidney and other tissues [1–6]. However, AO binding behavior is not restricted to the nucleus, with several reports describing the labeling of acidic organelles, RNA, matrix proteins, muscle fibers, and hemoglobin [7–10]. High concentrations of AO may cause artifacts related to nonspecific binding in the dermis [11,12]. By comparison, Deep Red Anthraquinone 5 (DRAQ5) is a red/infrared fluorescent dye that binds exclusively to DNA. Since its first report in 1999, over 70 studies on its use in flow cytometry, live and fixed tissue imaging for labeling of nucleated cells have been published but evidence for its utility in dermatopathology is lacking. By selectively binding to the minor groove, DRAQ5 binds exclusively to DNA molecules, making it a highly specific fluorophore for nuclear staining.[13] Like Hematoxylin, Acridine Orange and DRAQ5 are cationic DNA-binding stains that can be used to discriminate nucleated from anucleated cells for fluorescence microscopic examination of tissue.
In this paper, we report the utility of DRAQ5 for staining and imaging of whole-mounted frozen-thawed skin biopsies using EVCM. By performing a sequential double-stain for DRAQ5 and AO, we explored the utility of DRAQ5 for staining nuclei and mimicking hematoxylin-contrast in digitally stained confocal micrographs of healthy and diseased skin, as compared to that of conventional AO staining and the resulting digitally stained images. [11,12,14–19].
Materials and Methods
Samples
Under an IRB-approved protocol for procurement of discarded human skin specimens, frozen skin samples were collected from the Mohs micrographic surgery (MMS) unit of the Dermatology Service at the Memorial Sloan Kettering Cancer Center (MSKCC) in New York, USA. Eight frozen (MMS) discard tissue specimens were collected. Frozen discard tissue, stored in optimal cutting temperature (OCT) compound (TissueTek, Sakura, CA), was thawed at room temperature and rinsed using saline solution. All samples were wrapped in saline-soaked gauze until imaging.
Tissue processing and staining
Samples were washed and stained sequentially with two fluorescent probes, AO and DRAQ5, based on concentration and time parameters earlier studies by our colleagues [11], and our experience in labeling cutaneous and breast tissue (unpublished results). Prior to the start of the actual experiments, we verified both sequences of staining: AO-wash-DRAQ5 and DRAQ5-wash-AO to evaluate the influence of order of staining on the final image quality and staining. As shown in Fig 1, we observed comparable tissue labeling and image quality by both DRAQ5 and AO, with modest impact of the staining order. We adopted the AO-wash-blot-DRAQ5 sequence as i) repeated or prolonged saline rinses appeared to visibly diminish AO signal intensity and ii) DRAQ5 labeling causes minimal background noise requiring no additional washing steps. Before staining, the specimens were rinsed in saline to remove any excess OCT compound. The staining procedure consisted of immersion in a 0.6 mM acridine orange solution (20 seconds), followed by a 30-second washing step in saline solution (Bini et al, J Biomed Opt, 2011). The biopsy was then blotted dry with tissue paper wipes (Kimwipes, Kimtech, GA) and immersed in 50 μM DRAQ5 (5 mM, Biostatus, Ltd. diluted to 50 μM in phosphate-buffered saline) for 1 minute. Acridine Orange is an aminoacridine-based cell-permeant cationic stain (Exλ = 460–500 nm; Emλ = 526–650 nm) with a molecular weight of 301 Da. Deep Red Anthraquinone 5 (DRAQ5, 1, 5– bis{[2-(dimethylamino) ethyl] amino}- 4, 8-dihydroxyanthracene-9, 10-dione) is a far-red fluorescent label (Exλ = 646 nm; Emλ = 681–697 nm) with a similar molecular weight (413 Da) and cationic properties. [13,20–22] Both DRAQ5 and AO showed rapid staining within one minute at room temperature.
Fig. 1.

Both staining sequences- DRAQ5-wash-AO and AO-wash-DRAQ5 were tested to evaluate influence of staining order in the overall study. Both sequences resulted in similar labeling patterns and minor difference in contrast enhancement.
Ex vivo confocal microscopy
Samples were imaged using an EVCM (research prototype version of VivaScope 2500, Caliber I.D., Rochester, NY) with three lasers: 488 nm, 638 nm, and 785 nm. The 488 nm laser and a photomultiplier tube (PMT) comprised one illumination-fluorescence detection channel, while the 638 nm and 785 nm lasers and a second PMT comprised a second illumination-reflectance detection channel. The system also included a 30X, 0.9 numerical aperture (NA), water immersion objective lens. With this setup, the optical vertical sectioning was ~3 μm with lateral resolution of ~1 μm. For tissue flattening, a self-adhesive plastic insert was attached to a glass slide (Superfrost) to help achieve uniform pressure and flattening of the sample. Tissue flattening for confocal imaging in one plane was achieved using a magnetic tissue flattening device, consisting of a metal frame with four embedded magnets, combined with hydrocolloidal dressing (DuoDERM® Dressing, ConvaTec, Bridgewater, NJ) to support gentle compression of the entire sample surface.
An initial mosaic, at an appropriate depth determined at the center of the sample, was acquired to allow for margin assessment and overall image quality. If non-uniform pressure was detected, a biopsy pad (Bio Plas Inc., San Rafael, CA) was added to redistribute compression. When sufficiently uniform contact was established, mosaics were acquired with consistent illumination power settings using 785 nm for reflectance, then 638 nm and 488nm for fluorescence images. The immersion gel was removed and reapplied after every imaging session to ensure stable viscosity and refractive index matching. Mosaics in the form of strips stitched together with a 10% overlap were acquired for all three channels. Mosaics at 488 nm and 785 nm were collected simultaneously with the subsequent acquisition of the 638 nm mosaic, as the 638 nm and 785 nm lasers share the same laser-detector channel. Mosaics were acquired for all three channels.
Image processing
Mosaics captured with the 488 nm, 638 nm (fluorescence), and 788 nm (reflectance) channels were digitally stained using image acquisition software (VivaScan, Caliber I.D., Rochester, NY), using a previously described grayscale-to-color contrast conversion algorithm. Nuclear staining with either DRAQ5 or AO produces images in fluorescence contrast, which show nuclear morphology mimicking hematoxylin while images in reflectance contrast show only cellular cytoplasm and dermis, mimicking eosin [11]. Accordingly, the contrast conversion algorithm assigns the red-green-blue values of hematoxylin to the pixels in the fluorescence mosaics (showing only nuclear morphology), and the red-green-blue values of eosin to the pixels in the reflectance mosaic (showing only cellular and dermal morphology). When combined as a composite representation, the pink-colored appearance of reflectance mosaics mimics eosin counterstain while the purple-colored appearance of fluorescence mosaics mimics hematoxylin staining, resulting in mosaics mimicking the purple-and-pink colored appearance of conventional H&E staining.
Image Analysis
Staining characteristics and photobleaching properties were verified for both dyes in a subset of samples through prolonged illumination. Images were acquired every minute for 10 minutes to induce photobleaching with 638 nm and 488 nm for AO. Mean fluorescence intensity was measured on all images for comparison of the relative decrease in intensity.
For comparative assessment of digital staining performance, each AO-stained and DRAQ5-stained mosaic was divided into four segments for each of the eight tissues. Images were assessed by three blinded evaluators (A Rossi, M Cordova, A Sahu) experienced in the analysis of confocal micrographs and histopathology H&E slides of skin. Each evaluator assessed 32 AO-stained and 32 DRAQ5-stained image segments (n=64). Image segments were presented in a paired but blinded fashion to reduce potential bias. Evaluators were given an annotation chart, as shown in Table 1, with a corresponding training set detailing the surveyed categories to facilitate a standardized image assessment. The evaluation was split into two parts – a rating of perceived image quality (PIQ) ranging between 1=poor and 10=excellent, and qualitative identification of histological features and artifacts. Lastly, evaluators were asked to state if they preferred one mosaic over the other.
TABLE 1:
Blinded ratings of digitally stained confocal micrographs
| Evaluation category | Assessment | Rating | AO | DRAQ5 | p-value |
|---|---|---|---|---|---|
| Perceived Image Quality | Preferred digital H&E staining | DRAQ5 or AO | 18% (10–25%) | 82% (75–90%) | <.0001 |
| Nuclear enhancement | 1–10 (poor-excellent) | 4 (2.5–5) | 7 (5.5–8) | <.0001 | |
| Brightness, contrast, and saturation | 1–10 (poor-excellent) | 5 (4–7) | 7 (5.5–7.5) | <.0001 | |
| Background clarity | 1–10 (poor-excellent) | 4 (4–5) | 6 (5–8) | <.0001 | |
| Staining homogeneity | 1–10 (poor-excellent) | 4 (3–5) | 6 (5–7) | <.0001 | |
| Histopathological Features | Preferred feature visualization | DRAQ5 or AO | 19% (11–27%) | 81% (73–89%) | <.0001 |
| Epidermis | Presence | 74% (65–83%) | 85% (78–93%) | <.0001 | |
| Dermal fibers | Presence | 75% (66–84%) | 72% (63–81%) | <.0001 | |
| Adipocytes | Presence | 31% (22–40%) | 31% (22–41%) | 0.0002 | |
| Hair follicles | Presence | 78% (70–87%) | 83% (76–91%) | <.0001 | |
| m | Hair shafts | Presence | 39% (29–49%) | 30% (21–40%) | 0.0033 |
| Sebaceous glands | Presence | 59% (49–69%) | 64% (54–73%) | 0.0218 | |
| Sweat glands | Presence | 53% (42–63%) | 53% (42–63) | 0.6080 | |
| Tumors | Presence | 19% (11–27%) | 17% (9–25%) | <.0001 | |
| Inflammatory cells | Presence | 60% (50–70%) | 82% (75–90%) | <.0001 | |
| Blood vessels | Presence | 18% (9–25%) | 44% (34–54%) | <.0001 |
Chart for paired, blinded evaluation of digitally stained images for perceived image quality and histopathological feature identification. Values presented as percentages (lower and upper confidence limits) or medians (interquartile range).
H&E: Hematoxylin and Eosin; DRAQ5: Deep red anthraquinone 5; AO: Acridine orange
Statistics
Median and interquartile ranges (IQR), proportions with exact (Clopper-Pearson) confidence intervals were calculated and presented as percentages for descriptive statistics. To assess the extent of inter-rater agreement, correlation coefficients were calculated. Interrater agreement for the preference of stains was calculated using %Magree SAS macro to compute Kendall’s concordance coefficient (Kendall’s W) and Gwet’s Agreement coefficient (Gwet’s AC) [23]. Both coefficients range from 0, signifying no agreement, to 1, representing perfect agreement. Statistical differences between the two stains were examined using Wilcoxon for ordinal responses on perceived image quality and McNemar’s test for comparing binary responses on preferences and identification of histological features. Plots were constructed to graphically present differences in photobleaching and ratings for all surveyed categories. SAS Enterprise Guide 7.3 (SAS Institute Inc., Cary, NC, USA, RRID:SCR_008567) was used for all calculations and graphical plotting. Statistical significance was set at p<0.05.
Results
Photobleaching
Effects of consistent illumination were investigated over 10 minutes with photobleaching becoming more visible in AO than DRAQ5 stained samples. Quantitation of loss of fluorescence over time, as listed in Table 2, evidenced that photobleaching was more prominent in AO., suggesting an exponential fluorescence decay in AO compared with a more linear decrease in DRAQ5 fluorescence. After 10 minutes of consistent illumination, AO fluorescence intensity dropped by 49% while the DRAQ5 signal remained comparably stable with a decrease of only 7%.
TABLE 2:
Photobleaching effect on DRAQ5 and Acridine Orange
| Time point | Median (IQR) fluorescence values | |
|---|---|---|
| Acridine Orange | DRAQ5 | |
| baseline | 100% (100–100%) | 100% (100–100%) |
| 1 min | 77% (73–89%) | 99% (98–99%) |
| 2 min | 70% (66–80%) | 98% (96–99% |
| 3 min | 66% (60–74%) | 98% (95–99%) |
| 4 min | 63% (54–69%) | 98% (94–98%) |
| 5 min | 59% (51–65%) | 97% (92–97%) |
| 6 min | 58% (48–62%) | 97% (91–97%) |
| 7 min | 56% (44–59%) | 96% (90–96%) |
| 8 min | 54% (43–56%) | 95% (89–96%) |
| 9 min | 53% (41–54%) | 94% (88–95%) |
| 10 min | 51% (40–52%) | 93% (87–94%) |
Fluorescence intensity values in mean percentages over time. Photobleaching was induced by consistent illumination for 10min for DRAQ5 stained tissue (638 nm), and AO stained tissue (488 nm).
IQR: Interquartile range
Staining behavior
AO and DRAQ5 both showed a nuclear staining pattern, highlighting the densely nuclear tumor and epidermis, and other structures such as hair follicle, sebaceous glands, inflammatory cells and eccrine glands. While DRAQ5 only stained the nucleated cells in the dermis, dermal fibers and anucleated structures such as hair shafts and stratum corneum spared by DRAQ5 in a few specimens were observed in AO images. This nonspecific accentuation of dermal fibers can also be seen in the inset of Fig. 2. This possible staining of dermal fibers can have a pronounced influence on dermal morphologic features in the digitally stained mosaics, as seen in Fig. 3. Furthermore, AO was shown to effectively stain membranes of adipocytes while DRAQ5 selectively labeled the nucleus in all samples. Trimodal imaging incorporating AO, DRAQ5 and reflectance contrast, as seen in Fig.4., offers enhanced and more nuanced visualization of fatty tissue compared with bimodal imaging with either dye and reflectance channel. With nucleus-specific DRAQ5 contrast, AO-labelled adipocyte-membranes and reflectance contrast from the lipid deposits, a clear morphologic description of subcutaneous fat is possible and may be used to determine presence or absence of intact adipocytes.
Fig. 2.

Ex vivo confocal micrograph of a skin biopsy presented in three channels with magnified insets. Staining with Acridine Orange (a) shows nuclear staining in tumor and surrounding inflammatory infiltrate along with extracellular fibers in the background (FCM-488). DRAQ5 (b) offers nuclear-specific staining in tumors and surrounding inflammatory infiltrate with minimal or no background features, enhancing histomorphological details (FCM-638). (c), RCM image acqured at785 nm serving as a surrogate for eosin counterstain highlighting tumor and dermal fibers; H&E-histology image (d) for correlation demonstrates similar morphology of tumor nest and surrounding immune cells as seen in AO and DRAQ5 and RCM images.
Fig. 3.
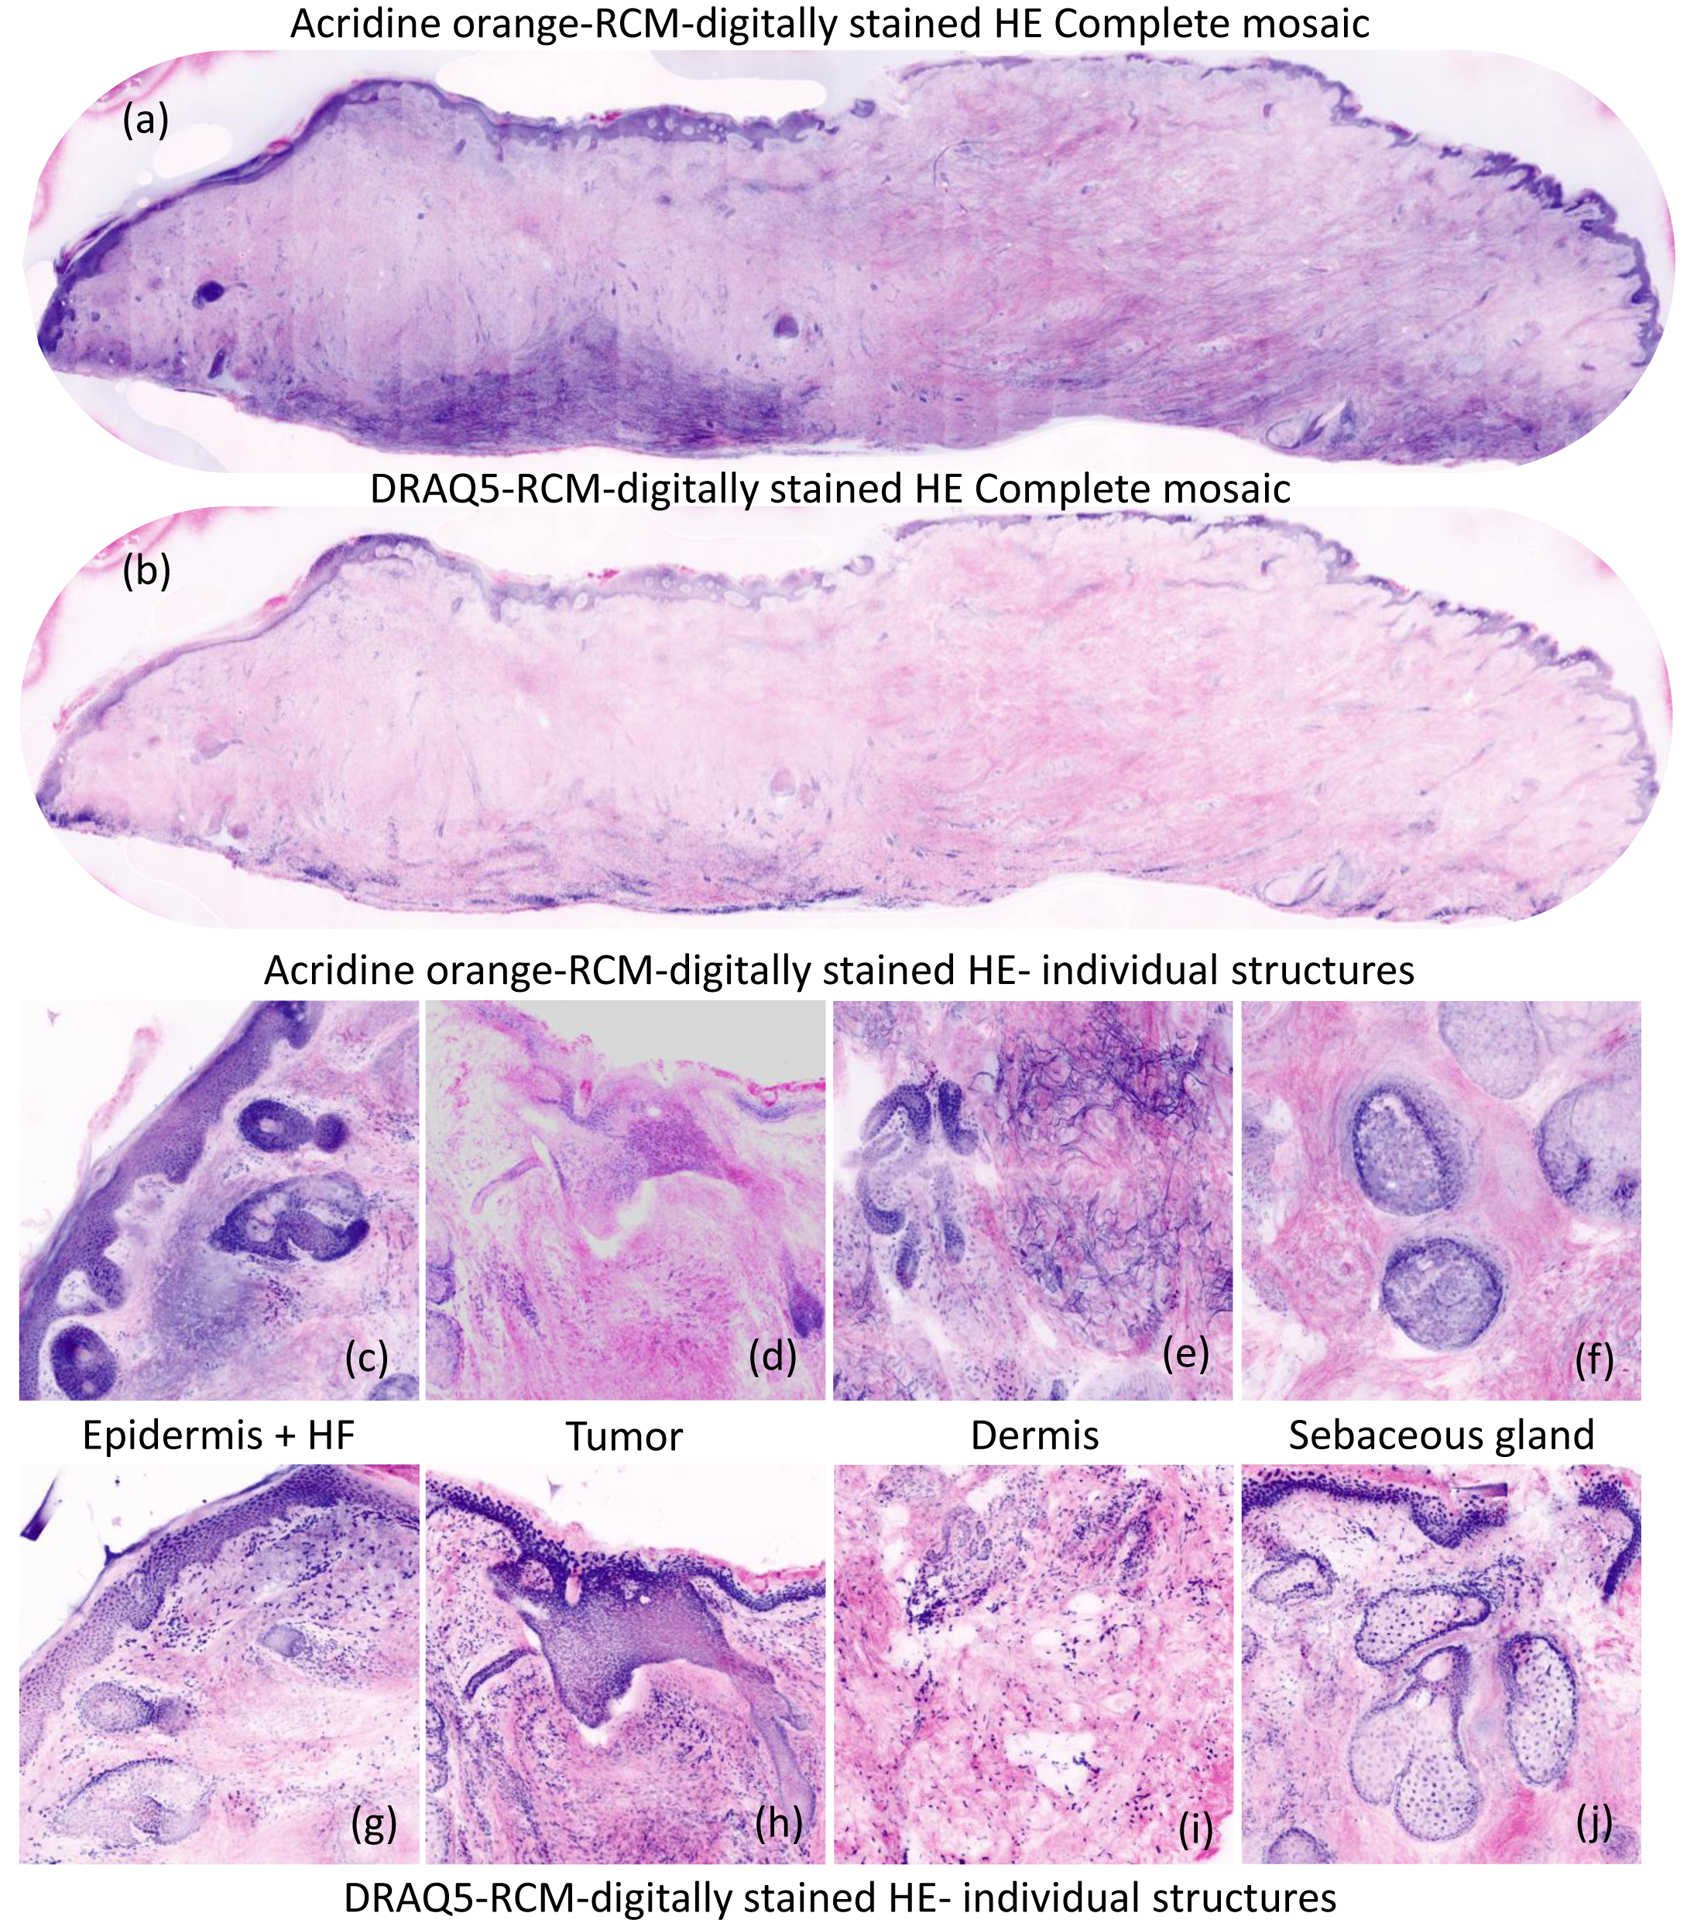
Digitally stained composite strip-mosaic images of discarded Mohs specimens, stained with Acridine Orange imaged at 488 nm, and Deep Red Anthraquinone 5 solution imaged at 638 nm. The digital staining algorithm assigned purple to the nuclear morphology in DRAQ5 and AO stained fluorescence images, mimicking appearance of hematoxylin staining and pink to the cellular and dermal morphology in reflectance, mimicking appearance of eosin counterstaining. The AO mosaic (a) shows artifactual staining in the dermis due to nonspecific binding of AO to collagen. In contrast, the dermis in the DRAQ5 mosaic (b) is uniformly pink, resembling pathology images. The insets for epidermis in AO- stained images (c-f) DRAQ-5 stained images (g-j) indicate higher image quality in DRAQ5 images.
Fig. 4.

Trimodal ex vivo confocal micrograph of subcutaneous fat using reflectance and fluorescence contrast for enhanced visualization of adipocyte morphology (a: Reflectance contrast, visualizing the lipid deposits b: Acridine Orange, labeling adipocyte cell membranes; c: DRAQ5, to selectively stain the nucleus; d: trimodal composite image)
Perceived image quality and histopathological features
DRAQ5 achieved higher average scores for perceived image quality and was the preferred digital stain for all three blinded raters as shown in Table 1. For the perceived image quality assessment of AO-stained and DRAQ5-stained confocal micrographs, investigators gave significantly higher (p<0.0001) for DRAQ5 than AO with moderate agreement for i) nuclear enhancement (W=0.52), ii) brightness, contrast, and saturation (W=0.55), iii) background clarity (W=0.47), and iv) staining homogeneity (W=0.44). DRAQ5 was the preferred digital stain in 82% of all images with substantial agreement between raters (Gwet’s AC=0.74, Cl 0.55–0.92).
DRAQ5 was the preferred stain for identification of histopathological features in 81% (Cl 75–90%) of all images (p<0.0001), with substantial agreement between the three raters (Gwet’s AC=0.67, Cl 0.47–0.88). The most notable statistically significant difference (p<0.0001), as detailed in Table 1, was seen in the visibility of inflammatory cells which were found on 82% (Cl 75–90%) of DRAQ5-stained but only 60% (Cl 50–70%) of AO-stained images.
Discussion
Blinded evaluation by three investigators showed a preference for DRAQ5 for use in digitally stained confocal images with a moderate agreement for enhanced perceived image quality and identification of histopathological features. Furthermore, DRAQ5 showed higher photostability, better mimicked hematoxylin in digitally stained confocal mosaics, and showed high compatibility with AO for nuanced trimodal visualization of adipose white tissue.
Despite its somewhat nonspecific staining behavior, AO has been successfully employed as a nuclear staining agent to imitate Hematoxylin in a rapidly growing number of studies on confocal imaging of fresh tissue [24]. However, the limitations of AO include staining of non-nuclear structures and presence of unbound dye in the dermis. Consequently, aspired improvements on current staining protocols hinge on the quest of finding a superior Hematoxylin-mimicker and potential refinements of the digital contrast conversion algorithms. Nucleus-specific affinity may be the single most important difference between AO and DRAQ5 that ultimately leads to a preference of one over the other. As seen in the confocal micrograph of a peripheral blood smear in Fig 5, DRAQ5 exclusively labels nucleated cells, standing in stark contrast with AO which, like Eosin, stains both white blood cells and anucleated erythrocytes. Differing from Hematoxylin’s staining pattern, the non-specific labeling of anucleated cells and dermal fibers may be major contributors to the background haze commonly seen in AO confocal micrographs. We have previously tested and validated the possible origin of the signal from dermal fibers during imaging at 488 nm. While dermal fibers can be visualized because of their autofluorescence at 488 nm (versus 638 nm) in control unstained tissues, accentuation of dermal fibers (collagen, elastin) in AO images was prominently visible after staining, suggesting some degree of nonspecific staining. Histology correlation studies, as well as prospective clinical investigations to evaluate diagnostic accuracy (sensitivity, specificity, positive and negative predictive value), would be needed to definitively test and prove DRAQ5’s enhanced diagnostic value relative to that of AO [24,25].
Fig. 5.

Ex vivo confocal micrograph of a blood sample stained with acridine orange (a) and DRAQ5 (b), and a composite image (c). Acridine orange stained all cellular components of blood, including anucleated erythrocytes, in contrast to the nucleus-selective DRAQ5.
Trimodal image acquisition may provide additional details potentially helping dermatologists refine their assessment [26],. While the use of two nuclear stains may be redundant for epithelium, fatty tissue, for instance, appears to be an excellent candidate for trimodal imaging. As reflectance, Acridine Orange, and DRAQ5 contrast supplement each other in visualizing the micromorphology of adipocytes, trimodal imaging may be better than digital purple-and-pink colored staining. While previously reported protocols required staining durations varying between 30 min and 5 days, the rapid tissue staining protocol used in this study could be advantageous for clinical point-of-care assessment for subcutaneous adipose tissue disorders. [27,28] White adipose tissue is notoriously difficult to section, distorting its architecture and complicating an accurate morphologic description of adipocytes and other cellular infiltrates.[27,29] Whole-mounting of adipose tissue circumvents fixation and sectioning but require fluorescent probes that can permeate the sample to achieve uniform staining.[30] Given their low molecular weight, both AO and DRAQ5 rapidly diffuse throughout skin biopsies offering trimodal fluorescence confocal microscopy imaging of subcutaneous fatty tissue. Trimodal EVCM of whole-mounted adipose tissue may help differentiate common conditions of the subcutaneous layers at the bedside. By nuanced morphologic description comprising DRAQ5-enhanced nuclei, AO-labeled adipocyte membranes, and intracellular lipid droplet reflectance, hypertrophic alterations in adipocyte morphology may facilitate the diagnosis of lipedema [31]. Furthermore, the nuclear enhancement of inflammatory cells in DRAQ5-stained tissue samples indicate that dermal and subcutaneous inflammatory infiltrates typically seen in lymphedema could be visualized by DRAQ5 [32].
In contrast to standard H&E stains, DRAQ5 is a stoichiometric stain, binding in proportion to the amount of DNA potentially allowing for computational image analysis. Like H&E staining, the compounds of DNA with a dye such as acridine orange are generally not stoichiometric; DNA and dye form 1∶1 compound only when forced by the presence of an excess of dye. As such, the fluorescence intensity of DRAQ5 reflects the DNA content and may consequently be more amenable to computational color deconvolution. Machine-learning assisted image analysis of staining intensity, hindered by traditional methods such as non-stoichiometric AO or H&E staining, may play a role in guiding clinical decision making by effectively visualizing and quantitating cancerous DNA ploidy.
Multimodal imaging, especially with multiple wavelengths, comes with challenges. A chromatic shift of approximately 20 μm between the 488 and 685 nm channels limited our comparison of AO and DRAQ5. Chromatic shifts can be particularly more apparent in mosaics with large field of view. As a consequence, registration of all image features in all three channels at the same depth was limited. To compensate for these chromatic shifts, trimodal images were captured at the focal plane assessed to be ideal for RCM images to reduce any potential bias.
Multimodal imaging of cancer is a constantly evolving field in which DRAQ5-EVCM represents only one of many novel alternatives to traditional H&E histology sections [18,33–37]. The rapidly progressing digitalization of dermatopathology is driven by the need to reduce health-care spending, facilitate medical documentation, and improve the treatment of skin cancer. Digital staining of multimodal confocal images in pink and purple potentially ease the transition from conventional histopathology to optically sectioned rapid pathology by obviating the need for extensive image interpretation training. DRAQ5 is an easy-to-use dye with excellent staining characteristics that should be considered for point-of-care histopathology. Despite its lower fluorescent yield, its superior selectivity achieves greater resemblance to traditional hematoxylin-staining. DRAQ5 may help identify areas of higher nuclear density than the surrounding epidermis and adnexal structures referred to as nuclear crowding, an important feature for the identification of cancers such as basal cell carcinoma. A head-to-head comparison of H&E histology, acridine orange, and DRAQ5 in Mohs micrographic surgery and other surgical and dermatopathology settings is warranted to assess the value of DRAQ5 in a clinical setting for diagnostic purposes and margin control.
Based on the overall preference for digital staining and its utility for trimodal confocal imaging of adipose tissue, DRAQ5 represents a multi-purpose fluorescent staining agent for dermatological investigations in clinical and research settings.
Conclusion
DRAQ5’s rapid staining, nuclear specificity, and resistance to photobleaching support its use as a fluorescent label for digital staining of optically sectioned skin. While DRAQ5 was favored in direct comparison with AO for digital staining of bimodal confocal images, their complementary staining patterns permit nuanced trimodal imaging of subcutaneous adipose tissue.
Acknowledgments
The authors would like to thank Dr. Manu Jain, Ucalene Harris, William Philips, and Sanjee Abeytunge for their support and assistance with this project.
Funding Sources:
This research was funded in parts by NIH/NIBIB grant R01EB020029 and MSKCC’s NIH/NCI Cancer Center Support Grant P30 CA008748.
Footnotes
IRB/IEC approval status: 08-006
Data availability: The datasets generated during and/or analyzed during the current study are available from the corresponding author on reasonable request.
Conflict of Interest Statement:
Rossi AM: travel by Mavig Inc., distributor of VivaScope System manufactured by Caliber ID
Fox CA: employee and equity holder of Caliber ID
Rajadhyaksha M: holds equity in Caliber ID
References
- [1].Rocco B, Sighinolfi MC, Bertoni L, Spandri V, Puliatti S, Eissa A, Reggiani Bonetti L, Azzoni P, Sandri M, De Carne C, Turri F, Cimadamore A, Montironi R, Maiorana A, Micali S, Bianchi G, Pellacani G, Real-time assessment of surgical margins during radical prostatectomy: a novel approach that uses fluorescence confocal microscopy for the evaluation of peri-prostatic soft tissue, BJU Int. (2020). 10.1111/bju.15000. [DOI] [PubMed] [Google Scholar]
- [2].Krishnamurthy S, Cortes A, Lopez M, Wallace M, Sabir S, Shaw K, Mills G, Ex Vivo Confocal Fluorescence Microscopy for Rapid Evaluation of Tissues in Surgical Pathology Practice, Archives of Pathology & Laboratory Medicine. 142 (2017) 396–401. 10.5858/arpa.2017-0164-OA. [DOI] [PubMed] [Google Scholar]
- [3].Krishnamurthy S, Sabir S, Ban K, Wu Y, Sheth R, Tam A, Meric-Bernstam F, Shaw K, Mills G, Bassett R, Hamilton S, Hicks M, Gupta S, Comparison of Real-Time Fluorescence Confocal Digital Microscopy With Hematoxylin-Eosin-Stained Sections of Core-Needle Biopsy Specimens, JAMA Netw Open. 3 (2020) e200476. 10.1001/jamanetworkopen.2020.0476. [DOI] [PMC free article] [PubMed] [Google Scholar]
- [4].Krishnamurthy S, Ban K, Shaw K, Mills G, Sheth R, Tam A, Gupta S, Sabir S, Confocal Fluorescence Microscopy Platform Suitable for Rapid Evaluation of Small Fragments of Tissue in Surgical Pathology Practice, Arch. Pathol. Lab. Med 143 (2019) 305–313. 10.5858/arpa.2018-0352-OA. [DOI] [PubMed] [Google Scholar]
- [5].Puliatti S, Bertoni L, Pirola GM, Azzoni P, Bevilacqua L, Eissa A, Elsherbiny A, Sighinolfi MC, Chester J, Kaleci S, Rocco B, Micali S, Bagni I, Bonetti LR, Maiorana A, Malvehy J, Longo C, Montironi R, Bianchi G, Pellacani G, Ex vivo fluorescence confocal microscopy: the first application for real-time pathological examination of prostatic tissue, BJU Int. 124 (2019) 469–476. 10.1111/bju.14754. [DOI] [PubMed] [Google Scholar]
- [6].Bertoni L, Puliatti S, Reggiani Bonetti L, Maiorana A, Eissa A, Azzoni P, Bevilacqua L, Spandri V, Kaleci S, Zoeir A, Sighinolfi MC, Micali S, Bianchi G, Pellacani G, Rocco B, Montironi R, Ex vivo fluorescence confocal microscopy: prostatic and periprostatic tissues atlas and evaluation of the learning curve, Virchows Arch. (2020). 10.1007/s00428-019-02738-y. [DOI] [PubMed] [Google Scholar]
- [7].Thomé MP, Filippi-Chiela EC, Villodre ES, Migliavaca CB, Onzi GR, Felipe KB, Lenz G, Ratiometric analysis of Acridine Orange staining in the study of acidic organelles and autophagy, J Cell Sci. 129 (2016) 4622–4632. 10.1242/jcs.195057. [DOI] [PubMed] [Google Scholar]
- [8].Perl DP, Little BW, Acridine Orange-Nucleic Acid Fluorescence: Its Use in Routine Diagnostic Muscle Biopsies, Arch Neurol. 37 (1980) 641–644. 10.1001/archneur.1980.00500590065011. [DOI] [PubMed] [Google Scholar]
- [9].Chatterjee S, Kumar GS, Binding of fluorescent acridine dyes acridine orange and 9-aminoacridine to hemoglobin: Elucidation of their molecular recognition by spectroscopy, calorimetry and molecular modeling techniques, J. Photochem. Photobiol. B, Biol 159 (2016) 169–178. 10.1016/j.jphotobiol.2016.03.045. [DOI] [PubMed] [Google Scholar]
- [10].Byvaltsev VA, Bardonova LA, Onaka NR, Polkin RA, Ochkal SV, Shepelev VV, Aliyev MA, Potapov AA, Acridine Orange: A Review of Novel Applications for Surgical Cancer Imaging and Therapy, Front. Oncol 9 (2019). 10.3389/fonc.2019.00925. [DOI] [PMC free article] [PubMed] [Google Scholar]
- [11].Bini J, Spain J, Nehal K, Hazelwood V, DiMarzio C, Rajadhyaksha M, Confocal mosaicing microscopy of human skin ex vivo: spectral analysis for digital staining to simulate histology-like appearance, Journal of Biomedical Optics. 16 (2011) 076008. 10.1117/1.3596742. [DOI] [PMC free article] [PubMed] [Google Scholar]
- [12].Gareau DS, Feasibility of digitally stained multimodal confocal mosaics to simulate histopathology, Journal of Biomedical Optics. 14 (2009) 034050. 10.1117/1.3149853. [DOI] [PMC free article] [PubMed] [Google Scholar]
- [13].Elfer KN, Sholl AB, Wang M, Tulman DB, Mandava SH, Lee BR, Brown JQ, DRAQ5 and Eosin (‘D&E’) as an Analog to Hematoxylin and Eosin for Rapid Fluorescence Histology of Fresh Tissues, PLOS ONE. 11 (2016) e0165530. 10.1371/journal.pone.0165530. [DOI] [PMC free article] [PubMed] [Google Scholar]
- [14].Gareau D, Bar A, Snaveley N, Lee K, Chen N, Swanson N, Simpson E, Jacques S, Tri-modal confocal mosaics detect residual invasive squamous cell carcinoma in Mohs surgical excisions, Journal of Biomedical Optics. 17 (2012) 066018. 10.1117/1.JBO.17.6.066018. [DOI] [PMC free article] [PubMed] [Google Scholar]
- [15].Gareau DS, Li Y, Huang B, Eastman Z, Nehal KS, Rajadhyaksha M, Confocal mosaicing microscopy in Mohs skin excisions: feasibility of rapid surgical pathology, Journal of Biomedical Optics. 13 (2008) 054001. 10.1117/1.2981828. [DOI] [PMC free article] [PubMed] [Google Scholar]
- [16].Jain M, Rajadhyaksha M, Nehal K, Implementation of fluorescence confocal mosaicking microscopy by “early adopter” Mohs surgeons and dermatologists: recent progress, Journal of Biomedical Optics. 22 (2017) 024002. 10.1117/1.JBO.22.2.024002. [DOI] [PMC free article] [PubMed] [Google Scholar]
- [17].Lamberti A, Cinotti E, Habougit C, Labeille B, Rubegni P, Perrot J, Ex vivo confocal microscopy for dermatofibrosarcoma protuberans, Skin Research and Technology. 25 (2019) 589–591. 10.1111/srt.12690. [DOI] [PubMed] [Google Scholar]
- [18].Mu EW, Lewin JM, Stevenson ML, Meehan SA, Carucci JA, Gareau DS, Use of Digitally Stained Multimodal Confocal Mosaic Images to Screen for Nonmelanoma Skin Cancer, JAMA Dermatology. 152 (2016) 1335. 10.1001/jamadermatol.2016.2997. [DOI] [PMC free article] [PubMed] [Google Scholar]
- [19].Patel YG, Nehal KS, Aranda I, Li Y, Halpern AC, Rajadhyaksha M, Confocal reflectance mosaicing of basal cell carcinomas in Mohs surgical skin excisions, Journal of Biomedical Optics. 12 (2007) 034027. 10.1117/1.2750294. [DOI] [PubMed] [Google Scholar]
- [20].Johnson S, Rabinovitch P, Ex-vivo imaging of excised tissue using vital dyes and confocal microscopy, Curr Protoc Cytom. CHAPTER (2012) Unit9.39. 10.1002/0471142956.cy0939s61. [DOI] [PMC free article] [PubMed] [Google Scholar]
- [21].Abeytunge S, Li Y, Larson B, Toledo-Crow R, Rajadhyaksha M, Rapid confocal imaging of large areas of excised tissue with strip mosaicing, Journal of Biomedical Optics. 16 (2011) 050504. 10.1117/1.3582335. [DOI] [PMC free article] [PubMed] [Google Scholar]
- [22].Abeytunge S, Larson B, Peterson G, Morrow M, Rajadhyaksha M, Murray MP, Evaluation of breast tissue with confocal strip-mosaicking microscopy: a test approach emulating pathology-like examination, Journal of Biomedical Optics. 22 (2017) 034002. 10.1117/1.JBO.22.3.034002. [DOI] [PMC free article] [PubMed] [Google Scholar]
- [23].Wongpakaran N, Wongpakaran T, Wedding D, Gwet KL, A comparison of Cohen’s Kappa and Gwet’s AC1 when calculating inter-rater reliability coefficients: a study conducted with personality disorder samples, BMC Medical Research Methodology. 13 (2013) 61. 10.1186/1471-2288-13-61. [DOI] [PMC free article] [PubMed] [Google Scholar]
- [24].Malvehy J, Pérez-Anker J, Toll A, Pigem R, Garcia A, Alos LL, Puig S, Ex vivo Confocal Microscopy: revolution in fast pathology in dermatology, Br. J. Dermatol (2020). 10.1111/bjd.19017. [DOI] [PubMed] [Google Scholar]
- [25].Schüürmann M, Stecher MM, Paasch U, Simon JC, Grunewald S, Evaluation of digital staining for ex vivo confocal laser scanning microscopy, J Eur Acad Dermatol Venereol. (2019). 10.1111/jdv.16085. [DOI] [PubMed] [Google Scholar]
- [26].Sendín-Martín M, Bennàssar A, Levitsky KL, Domínguez-Cruz JJ, Ex vivo confocal microscopy of basal cell carcinoma on a 3-color scale, Journal of the American Academy of Dermatology. 80 (2019) e91–e92. 10.1016/j.jaad.2018.12.022. [DOI] [PubMed] [Google Scholar]
- [27].Martinez-Santibañez G, Cho KW, Lumeng CN, Imaging White Adipose Tissue With Confocal Microscopy, Methods Enzymol. 537 (2014) 17–30. 10.1016/B978-0-12-411619-1.00002-1. [DOI] [PMC free article] [PubMed] [Google Scholar]
- [28].Boumelhem BB, Assinder SJ, Bell-Anderson KS, Fraser ST, Flow cytometric single cell analysis reveals heterogeneity between adipose depots, Adipocyte. 6 (2017) 112–123. 10.1080/21623945.2017.1319536. [DOI] [PMC free article] [PubMed] [Google Scholar]
- [29].Peters SR, Variables Affecting the Cutting Properties of Tissues and the Resulting Artifacts, in: Peters SR (Ed.), A Practical Guide to Frozen Section Technique, Springer, New York, NY, 2010: pp. 97–115. 10.1007/978-1-4419-1234-3_5. [DOI] [Google Scholar]
- [30].Berry R, Church C, Gericke MT, Jeffery E, Colman L, Rodeheffer MS, Methods in Enzymology (MIE): Methods of Adipose Tissue Biology-, Methods Enzymol. 537 (2014) 47–73. 10.1016/B978-0-12-411619-1.00004-5. [DOI] [PMC free article] [PubMed] [Google Scholar]
- [31].Perbeck L, överläkare docent, Kliniken B-OE, universitetssjukhuset K, Sjuksköterska L, Lymfterapeut M, Norrort L, eryd D, Lipödem – en ofta förbisedd men behandlingsbar sjukdom, Läkartidningen. (2017). https://lakartidningen.se/klinik-och-vetenskap-1/artiklar-1/klinisk-oversikt/2017/11/lipodem-en-ofta-forbisedd-men-behandlingsbar-sjukdom/ (accessed April 5, 2020). [PubMed] [Google Scholar]
- [32].Dayan JH, Ly CL, Kataru RP, Mehrara BJ, Lymphedema: Pathogenesis and Novel Therapies, Annual Review of Medicine. 69 (2018) 263–276. 10.1146/annurev-med-060116-022900. [DOI] [PubMed] [Google Scholar]
- [33].Snuderl M, Wirth D, Sheth SA, Bourne SK, Kwon C-S, Ancukiewicz M, Curry WT, Frosch MP, Yaroslavsky AN, Dye-enhanced multimodal confocal imaging as a novel approach to intraoperative diagnosis of brain tumors, Brain Pathol. 23 (2013) 73–81. 10.1111/j.1750-3639.2012.00626.x. [DOI] [PMC free article] [PubMed] [Google Scholar]
- [34].Patel R, Khan A, Wirth D, Kamionek M, Kandil D, Quinlan R, Yaroslavsky AN, Multimodal optical imaging for detecting breast cancer, J Biomed Opt. 17 (2012) 066008. 10.1117/1.JBO.17.6.066008. [DOI] [PubMed] [Google Scholar]
- [35].Al‐Arashi MY, Salomatina E, Yaroslavsky AN, Multimodal confocal microscopy for diagnosing nonmelanoma skin cancers, Lasers in Surgery and Medicine. 39 (2007) 696–705. 10.1002/lsm.20578. [DOI] [PubMed] [Google Scholar]
- [36].Pérez-Anker J, Malvehy J, Moreno-Ramírez D, Ex Vivo Confocal Microscopy Using Fusion Mode and Digital Staining: Changing Paradigms in Histological Diagnosis, Actas Dermosifiliogr. 111 (2020) 236–242. 10.1016/j.ad.2019.05.005. [DOI] [PubMed] [Google Scholar]
- [37].Villarreal JZ, Pérez-Anker J, Puig S, Pellacani G, Solé M, Malvehy J, Quintana LF, García-Herrera A, Ex vivo confocal microscopy performs real-time assessment of renal biopsy in non-neoplastic diseases, J. Nephrol (2020). 10.1007/s40620-020-00844-8. [DOI] [PubMed] [Google Scholar]