Abstract
X-ray induced acoustic computed tomography (XACT) is a unique hybrid imaging modality that combines high X-ray absorption contrast with high ultrasonic resolution. X-ray radiography and computerized tomography (CT) are currently the gold standards for two-dimensional and three-dimensional imaging of skeletal tissues, though there are important properties of bone, such as elasticity and speed of sound, that these techniques cannot measure. Ultrasound is capable of measuring such properties, though current clinical ultrasound scanners cannot be used to image the interior morphology of bones because they fail to address the complicated physics involved for exact image reconstruction; bone is heterogeneous and composed of layers of both cortical and trabecular bone, which violates assumptions in conventional ultrasound imaging of uniform speed of sound. XACT, in conjunction with the time-reversal algorithm, is capable of generating precise reconstructions, and, by combining elements of both X-ray and ultrasound imaging, XACT is potentially capable of obtaining more information than any single of these techniques at low radiation dose. This paper highlights X-ray-induced acoustic detection through linear scanning of an ultrasound transducer and the time-reversal algorithm to produce the first-ever XACT image of a bone sample. Results of this study should prove to enhance the potential of XACT imaging in the evaluation of bone diseases for future clinical use.
Keywords: X-ray induced acoustic computed tomography (XACT), Bone imaging, Time-reversal algorithm
I. INTRODUCTION
Since the discovery of X-rays by Röntgen in 1895, X-ray imaging has proved to be an invaluable tool in medical diagnoses [1]. In 1983, it was discovered that pulsed X-rays can induce acoustic waves within tissue [2], which opened doors for the development of a new kind of X-ray imaging: X-ray-induced acoustic computed tomography (XACT) [3–4]. In the X-ray-induced acoustic (XA) effect, X-ray photons are projected onto a material and are absorbed by inner-shell electrons. The electrons subsequently become excited and release photoelectrons. The resulting energy increases the local temperature of the system, causing atomic vibrations, and thus, the emission of ultrasound waves. These waves encode X-ray absorption information and propagate in all directions from their origin. Thus, if ultrasound detectors cover the area of interest, three-dimensional (3D) imaging is possible from a single X-ray projection [3]. This is in contrast to conventional X-ray CT imaging, which requires a rotating X-ray source and many projections to obtain a 3D image. Given this fact, XACT has the potential to acquire 3D images while reducing radiation dose by orders-of-magnitude compared to CT [5].
As a biomedical imaging technique, XACT has been experimentally studied in imaging of various metallic samples as well as the simulated imaging of biological tissue. Xiang et al. demonstrated the high resolution of XACT by obtaining a two-dimensional (2D) image of gold fiducial markers [6]. This was accomplished by mechanically scanning a 2.25 MHz center frequency transducer around the target. More recently, Tang et al. obtained a 2D image of a lead sample modeled into the OU logo using a ring-array of 5 MHz center frequency transducer elements around the target [7]. Tang et al. also demonstrated the simulated 3D imaging of micro-calcifications within breast tissue [5]. The estimated dosage was 0.4 mGy, which is 10 times less than that of X-ray mammography. Most recently, Li et al. [8] proposed 3D imaging for bone tissue and demonstrated through simulations on a homogeneous bone sample that 3D image reconstruction of bone was possible using a variation regularized iterative method. In addition to biomedical imaging, XACT has also been found to have promising potential in radiation dosimetry [3,9–12] and non-destructive testing [13,14].
This study seeks to introduce the idea of experimental XACT imaging for biological tissue, specifically bone. Since the 1980s, Dual-energy X-ray absorptiometry (DXA) has been the gold-standard for diagnosing osteoporosis, a widespread disease characterized by weakness and fragility of bones [15]. DXA uses X-rays to obtain images that are two-dimensional projections of a three-dimensional structure and is used to measure a single metric, the bone-mass density (BMD). Diagnosis of osteoporosis is based almost entirely upon this single number, while other important properties such as the morphology, elasticity, ratio between cortical and trabecular bone, porosity, etc. are ignored [15]. Since XACT can obtain 3D images using a single X-ray projection, it has the potential to measure many of these properties that DXA left to itself cannot, and thus may prove to be useful in detecting osteoporosis.
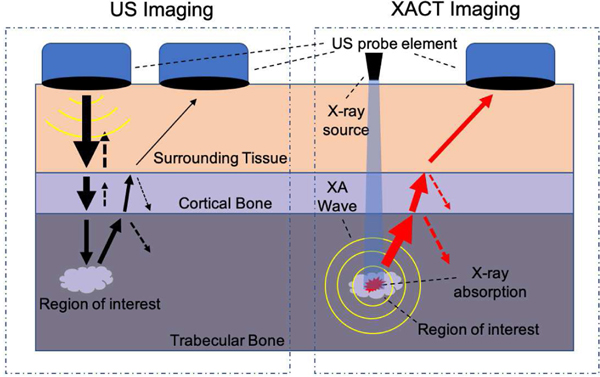
As its detection is primarily ultrasonic, XACT has the potential to measure information beyond that which can be observed in a radiograph. Acoustic properties of a bone, such as elasticity and speed of sound, can be extracted from ultrasound generated due to XACT [16]. Conventional ultrasound imaging has typically not been used to diagnose bone diseases, though advances in reconstruction algorithms have shown the capability of imaging the exterior of bone [17], and, more recently, the cortical shell itself [16]. However, ultrasound imaging of the bone interior has proved especially difficult. As an ultrasound wave progresses from soft tissue through each layer of the bone, part of the wave reflects at each boundary due to the impedance mismatch, resulting in diminished signal strength after each boundary. This is further complicated by the fact that ultrasound imaging requires two-way transmission; a wave is projected from a transducer through multiple layers of tissue, after which, it must return through each of those layers back to the transducer. When utilizing X-ray-induced ultrasound however, the transmission is one-way; pressure waves are created in the interior of the bone, which then propagate to the transducer (see Fig. 1.). We believe this opens up the possibility of ultrasound imaging of the bone marrow itself. This report will show through simulations that reconstruction of the bone marrow from simulated XA signals is possible and produce a bone image from experimentally collected signals.
Fig. 1.
Ultrasound vs. XA transmission. Conventional US travels through each layer of bone and back again, whereas XA waves must only travel in one direction, decreasing the amount of reflection and refraction. Arrow thickness represents pressure wave magnitude. Dashed arrows represent reflections.
II. THEORY
A. X-ray Acoustic Generation
The conversion of X-ray energy to acoustic pressure is governed by the following equation [13]:
| (1) |
where p0 is the initial pressure rise, β is the thermal coefficient of volume expansion, vs is the speed of sound, CP is the specific heat capacity, ηth is the percentage of absorbed energy converted to heat, μa is the mass attenuation coefficient of the X-ray, ρ is the density of the material, and F(r) is the X-ray fluence. Equation (1) can be simplified to [18]:
| (2) |
where Ae is the volumetric X-ray absorption. Thus, the initial pressure contains information relating to X-ray absorption. If the initial pressure rise and material properties are known, the X-ray absorption data can be extracted. Both the fluence and the volumetric X-ray absorption are typically material-dependent and vary with density and the mass attenuation constant. The value of Ae would be expected to be higher for cortical bone than trabecular bone. Typical values of relevant bone properties can be seen in Table I [19]. The mass attenuation coefficient itself will depend both on X-ray energy and material [20].
TABLE I.
MATERIAL PROPERTIES OF BONE
| Bone Type | Cortical | Trabecular |
|---|---|---|
| Specific Heat Capacity (J/kg/°C) | 1313 | 2274 |
| Sound Speed (m/s) | 3514.9 | 2117.5 |
| Density (kg/m3) | 1908 | 1178 |
B. Time-Reversal Algorithm
Assuming the material to be imaged is surrounded by an array of transducer elements, the k-wave time-reversal algorithm can reconstruct the initial pressure using recorded data from these elements [21]. Traditional ultrasound B-mode imaging relies on the assumption that the speed of sound (SOS) within the imaging medium is somewhat constant. This assumption is critically violated when studying tissue such as bone, with the surrounding tissue having a speed around 1500 m/s, cortical bone a speed of 3500 m/s, and trabecular bone 2000 m/s [19]. By using time-reversal, however, the SOS heterogeneity can be accounted for. Time-reversal allows the projection of recorded acoustic data onto a matrix by solving for the pressure via a Dirichlet boundary condition.
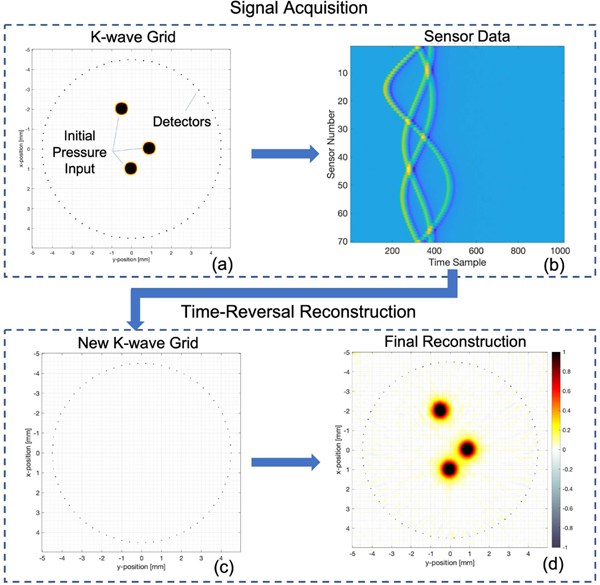
There are four major components that must be specified in order to run the algorithm: the simulation grid, containing information regarding the number of grid points and grid spacing; the medium, containing properties such as speed of sound and density; the source, which specifies the initial pressure distribution; and the sensors. K-wave can be run in either a data acquisition mode or a time-reversal reconstruction mode. During data acquisition, the source is set to some input initial pressure (Fig. 2(a)). The pressure is allowed to propagate and the sensors record the acoustic data obtained (Fig. 2(b)). During time-reversal, a new k-wave grid is set up with the source set to a negligible quantity ((Fig. 2(c)). The detectors project the acoustic data back onto the matrix, resulting in the image reconstruction ((Fig. 2(d)).
Fig. 2.
Time-Reversal Algorithm. During data acquisition, a K-wave grid is setup with an input values including the grid, sensors, initial pressure, and speed of sound distribution (a). The pressure is allowed to propagate, while the sensors record acoustic data, plotted in (b). Once data is collected, a new k-wave grid is setup as before, specifying the grid, sensors, speed of sound distribution, and a null initial pressure input (c). Sensors project acoustic data back onto the matrix via the time-reversal algorithm, resulting in a final reconstruction (d). The reconstruction in (d) can be improved through iterative time-reversal by creating another k-wave grid (a) and using the reconstruction in (d) as initial pressure input to (a). More detectors are added–as many as the grid can accommodate–and the signal acquisition and reconstruction processes are repeated.
Time-reversal allows the use of iterative reconstruction. Once the initial pressure is found after the first reconstruction, this pressure can be input into a new data collection simulation grid, which utilizes as many detectors as the grid can accommodate. These additional detectors will occupy the same geometry as the original detectors. For example, if the original sensor apparatus was a circular array, the iterative apparatus will utilize all the grid points contained along this circle and define them as sensors. Data acquisition and time-reversal are repeated with this larger number of detectors, which results in an improved image.
III. SIMULATIONS
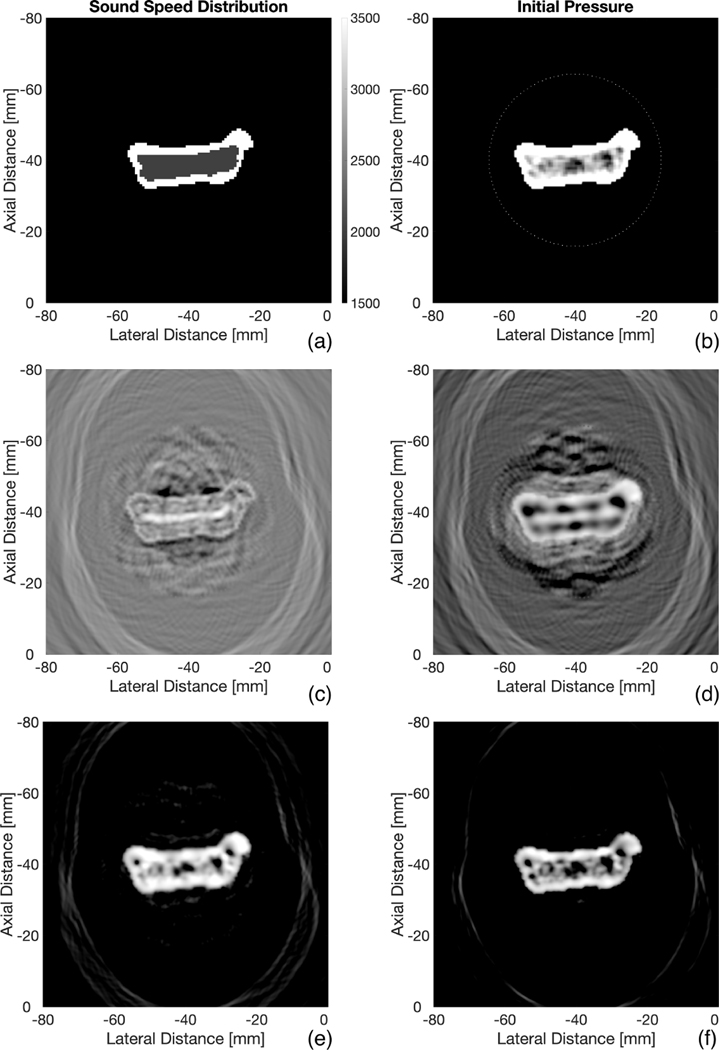
We start off with a demonstration of the use of time-reversal on simulated XACT imaging of bone. The bone of interest was obtained from a public spinal CT database [22]. A 512×512 k-wave grid was setup with a grid spacing of 0.178 mm and sampling rate of 66 MHz. The initial pressure input to the k-wave simulation was set to be proportional to the pixel values of the bone image, as seen in Fig. 3(b). Should accurate quantitative data be desired, the Hounsfield unit conversion described in [8] would need to be implemented; however, this is a not an immediate concern for this study as we are not seeking to quantify specific bone properties. Surrounding the bone is a ring array of 128 transducer elements. Each element operated with center frequency of 750 kHz at 150 percent bandwidth. This frequency was chosen with respect to the tradeoff between signal-to-noise ratio and resolution, as lower frequencies have less attenuation. The bandwidth was chosen to maximize detection to XACT signals, which are broadband. A speed of sound distribution was created using manual segmentation using typical values within the literature [15,19,23]: 3500 m/s for cortical bone, 2000 m/s for trabecular, and 1500 m/s for surrounding tissue (Fig 3(a)). Given this input, the k-wave algorithm commenced and acoustic data was recorded by the elements.
Fig. 3.
Bone Reconstructions. (a) and (b) represent the SOS and initial pressure input to the k-wave simulation grid. 128 transducer elements surround the initial pressure in (b). Time reversal reconstruction assuming uniform SOS (c). Reconstruction assuming uniform SOS of 3500 m/s within boundaries of bone (d). Reconstruction using SOS distribution in (a) (e). Reconstruction after 3 iterations on (e) (f). All reconstructions are shown with a dynamic range of 30 dB
Now that simulated data is produced, the focus shifts to time-reversal reconstruction given this data. A new matrix of the same dimensions is created with the transducers occupying the same positions as before, except here, the acoustic data will be projected back onto the matrix. A speed of sound distribution must also be set, and, as will be seen throughout this section, this is one of the most crucial factors in imaging bone. The SOS distribution is typically not known within the object of interest, so different scenarios of SOS distribution assumptions were explored.
As a base case, we sought to find the reconstruction due to a uniform SOS distribution of that of soft tissue (1500 m/s). This is an assumption made by conventional ultrasound B-mode imaging. Time-reversal was performed and the reconstruction is shown in Fig. 3(c). In actual experimental settings, the outer boundaries of the bone, at least, can be obtained through either conventional ultrasound or X-ray data. With this in mind, we then created a varying SOS distribution: 3500 m/s within the boundaries of the bone, while the surrounding areas remained at 1500 m/s. The results are shown in Figure 3(d), an image that is somewhat better than that due to a uniform SOS assumption. The process was repeated using the original SOS distribution in Fig 3(a), resulting in Fig. 3(e), a much better representation of the initial pressure. Thus we can conclude that knowing the SOS of all layers of bone is crucial to properly performing time-reversal reconstructions. Fig. 2(f) then improves upon 3(e) by utilizing an iterative process consisting of three iterations.
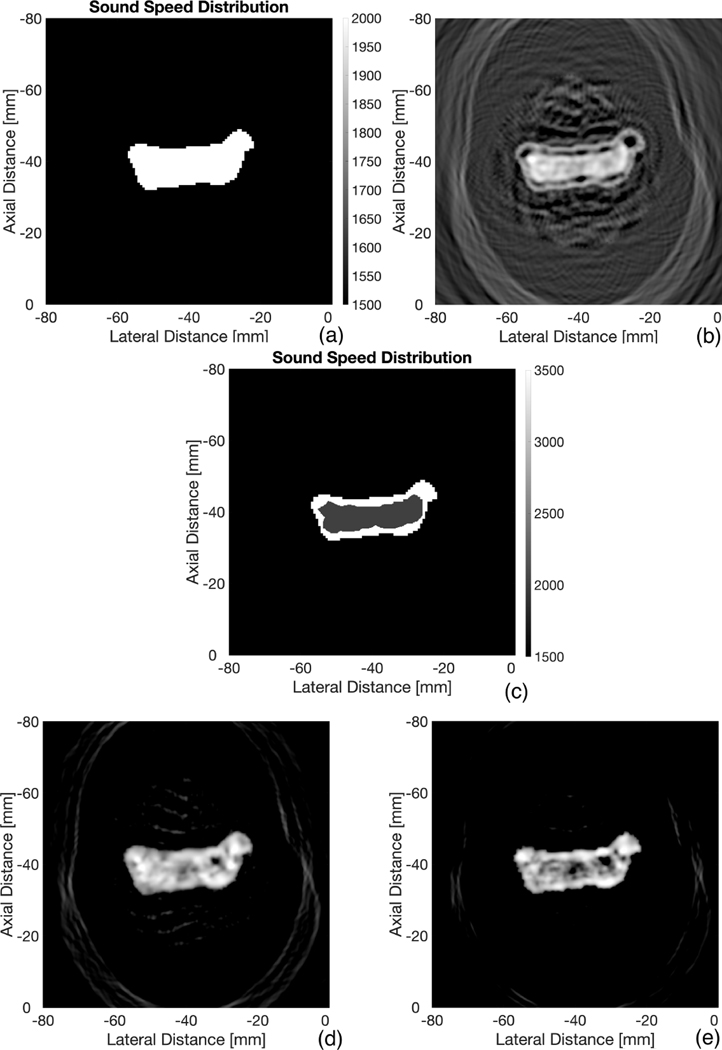
The problem still remains however: how does one find the SOS distribution to adequately perform time-reversal in experimental settings? We do not know the best answer to this question, but, an interesting occurrence was observed that may potentially assist in SOS segmentation. A new simulation was conducted with a varying SOS. As before, a uniform SOS distribution was created within the boundaries of the bone, while areas outside took the value of 1500 m/s (Fig. 4(a)).
Fig. 4.
More Bone Reconstructions. SOS distribution assumption of uniform 2000 m/s within boundaries of bone (a). Time reversal reconstruction using SOS distribution in (a) (b). New manual segmented SOS distribution based on pixels in (b) (c). Reconstruction using SOS distribution in (c) (d). Reconstruction after 3 iterations on (d) (e). The SNR of (e) was found to be 32 dB. All reconstructions are shown with a dynamic range of 30 dB
This time, however, the value set within the boundaries of the bone was set to be 2020 m/s, which is close to the originally set value of trabecular bone, 2000 m/s. The reconstruction is shown in Fig. 4(b), which is hardly representative of the initial pressure. This figure is very interesting, however, in that the pixel values have higher amplitude within the trabecular region, allowing us to segment trabecular from cortical bone. Thus, a new speed of sound distribution was created through manual segmentation based off of Fig. 4(b), as shown in Fig. 4(c): 3500 m/s for the cortical region and 2000 m/s for the trabecular region. Reconstruction was repeated with this SOS, yielding Fig. 4(d), which is much more representative of the initial pressure. Fig. 4(e) then improves upon 4(d) by utilizing the iterative process.
It is unclear why this phenomenon occurs, that is, when performing time reversal with a uniform trabecular SOS assumption within the boundaries of the bone, it yields a pixel distribution that segments the trabecular region. Multiple geometries were tested at varying SOS assumptions and all exhibited the same effect. The closer the SOS assumption was to that of trabecular bone, the better the segmentation matched the actual trabecular region. It remains to be seen if this can occur in experimental settings.
IV. EXPERIMENT
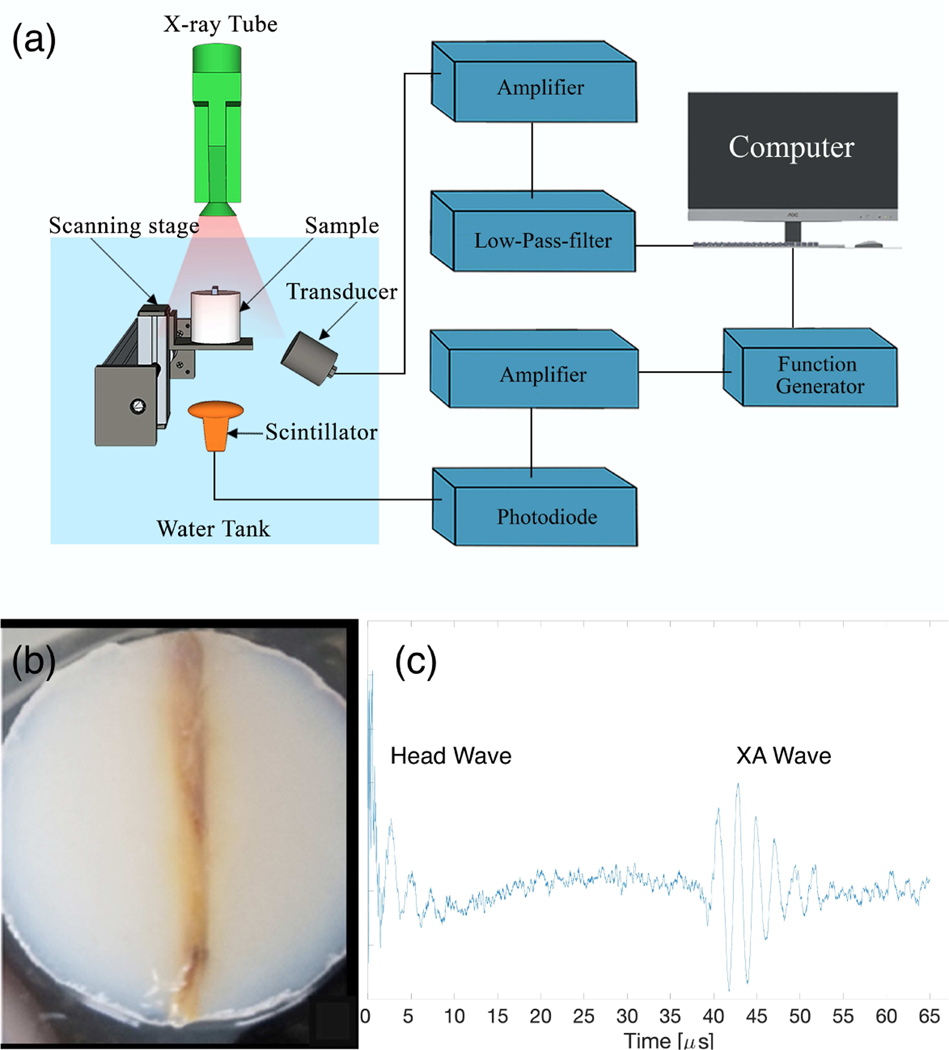
The following section is devoted to the collection of experimental XACT data from a chicken bone and the subsequent processing to produce an XACT image. Fig. 5(a) describes the setup. An X-ray tube (XR200, Golden Engineering Inc., IN, USA) at operating potential of 150 kVp was used to generate ultrashort pulsed X-rays at 60 ns pulse width, corresponding to an average irradiated wavelength of 0.025 nm. The repetition rate was 25 Hz and provided 2.6 to 4.0 mR per pulse. The X-ray tube was placed directly above a fresh chicken bone sample (Fig. 5(b)), which was immersed in a tank of water. Agarose gel was chosen as a mount for the bone because it has similar acoustic properties to that of soft tissue. Facing the bone was a single transducer detector with center frequency of 500 kHz (V301-SU, Olympus-NDT, Waltham, MA, USA). This low frequency was chosen to maximize the the sensitivity to the relatively weak XACT signals; this will also, however, produce a trade-off of decreased resolution. Under the water tank, directly below the X-ray tube and bone, is a scintillator, which converts the X-rays pulse into visible light. The scintillator was put just inferior to the sample, directly in the beam path of the X-ray, to maximize signal strength. The scintillator itself serves as an X-ray detector. It is connected to circuitry whose overall purpose is to trigger the data acquisition card to start collecting data; data should only be collected in the microseconds after the X-ray is fired, the time during which XA waves are propagating in the water tank. The light generated from the scintillator is sent via an optical cable to a photodiode, converting the light to an electrical pulse. The photodiode signal is amplified and sent to a data receiver controlled by LabVIEW (NI PCI-5153EX). The receiver ran at a sampling rate of 62.5 MHz and had a resolution of 8 bits. Once triggered, the LabVIEW program collects data from the transducer, then it waits to be triggered by another pulse. This cycle repeats for each X-ray pulse.
Fig. 5.
Experimental Setup (a). Acoustic data was recorded at a total of 18 positions. Photograph of bone (b). Example XA signal after subtraction of head-wave (c)
The major challenge to overcome in this experiment was maximizing the signal-to-noise ratio (SNR). Bone has far less X-ray absorption than metallic samples, so the corresponding XA signal will also be lower. To maximize the absorption of X-rays by the bone, the X-ray tube was placed as close as possible to the bone, within a few centimeters. The tube, however, could not come in contact with the water, because whenever X-rays were fired while in contact with the water, a false signal would be generated on the transducer. This was attributed to electrical conduction of the tube with the water. In order for the centerline of the transducer to be focused on the bone, the transducer was set slightly below the bone, but angled upward to it. The center of the transducer could not be on the same horizontal plane as the bone as, due to its larger size, a large fraction of its face would not be fully submerged.
The bone/agarose were mounted on a scanning stage that was scanned 18 times at step size of 3 mm. Thus, our detection system behaved as a linear array consisting of 18 transducer elements. 500 XA signals were acquired at each position and averaged together to ensure adequate SNR and to eliminate the effect of the fluctuation of energy between X-ray pulses, which can vary from 2.6 to 4.0 mR. The X-ray tube had a maximum duty cycle of 200 pulses every four minutes. Out of an abundance of caution regarding this limit, we fired 100 pulses every four minutes, resulting in an average of 20 minutes per transducer position. The total scan time amounted to 6 hours for all 18 positions. After acquiring these signals, the target was removed from the water tank and 500 pulses were fired; the signals acquired were averaged together and used to estimate the background. Common in radiation-induced ultrasound events is the “head-wave” interference [7]. This occurs when radiation (in our case, X-rays) generates a signal upon the face of the transducer. This is an unwanted signal, so we subtracted the background from the other averaged signals due to the bone. After subtraction, the head-wave becomes much smaller, though a portion is still visible (see Fig. 5(c)). In preliminary tests, we noticed that the head-wave signal lasted a little less than 40 microseconds (or 6 cm, assuming 1500 m/s speed of sound). The bone was placed around 6 cm from the transducer to ensure the head-wave did not greatly interfere with the signal of interest.
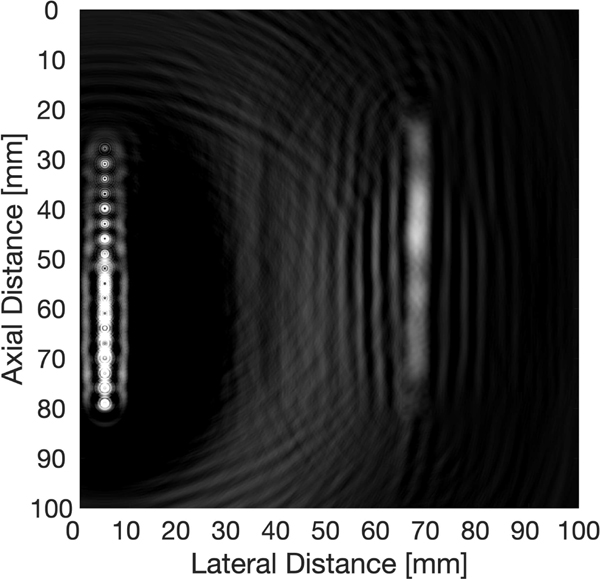
A time-reversal k-wave grid was then set up with an array of 18 transducers at a step size of 3 mm. The grid size was 984×984, the grid spacing was 0.102 mm, and sampling rate was 62.5 MHz. The speed of sound was set to be 1500 m/s exterior to the bone, and 3500 m/s within the boundaries of the bone. Reconstruction was performed, resulting in Fig. 6. As we utilized a low-frequency 500 kHz transducer, it was not expected we could produce an image with high enough resolution to view the different layers of the bone. Hence, no further SOS segmentations were employed.
Fig. 6.
Experimental XACT image of chicken bone using time-reversal. The figure has a dynamic range of 2 dB. The SNR was found to be 16 dB.
V. DISCUSSION
The goal of our study was to find whether or not XACT is a viable option for the imaging of bone. We employed the time-reversal algorithm and produced both simulated images and an experimental image, which, to our knowledge, is the first ever experimental XACT image of a biological sample. We are encouraged by the preliminary results; however, more studies must be conducted to confirm its effectiveness.
The impedance mismatch between layers of bone results in less signal distortion for XACT in comparison to traditional ultrasound, as there are fewer boundaries to cross; however, as our simulations showed, perhaps the most crucial component of XACT time-reversal is knowing the appropriate speed of sound distribution. In comparing the reconstruction in Fig. 3(c), which assumed a uniform SOS distribution with Fig. 3(e), where the SOS is guessed perfectly, it is clear knowing SOS distribution prior to reconstruction is necessary for accurate imaging. The cortical thickness could be estimated from a radiograph [24]. Renaud et. al. [16] describes a novel approach for determining cortical thickness from ultrasound data, which could be applied to SOS segmentation. Our simulations also assumed that all cortical bone speeds are 3500 m/s and all trabecular bone speeds are 2000 m/s, which is an oversimplification, as this SOS can vary between bones and within the same bone tissue. If the boundary between each layer is known, the automatic sound speed selection method shown in [25] can potentially be used to find the appropriate SOS by maximizing the sharpness of the image. The anisotropy of bone was also ignored in our experiment, that is, SOS is typically faster down the length of the bone than along its radius [16]; a factor that needs to be addressed in future studies. The phenomenon seen in the simulations section helped us determine the boundary between cortical and trabecular bone, but it is unclear if this can be used in physical settings, or whether it would still be observed when the anisotropy of bone is considered. More experiments and a better understanding of the theory is needed to determine this. It should also be noted that our simulations succeeded at reconstructing an initial pressure, not X-ray absorption. Per equation (2), should this data be desired, the extra terms in front of X-ray absorption must be considered, which may add an extra layer of complexity to the problem, as these values may vary between cortical and trabecular bone. Future studies will also need to quantitatively describe the radiation dose. There has been little comparison between traditional X-ray technology and XACT in the literature, though it has been shown for simulated breast imaging that the dose is smaller when utilizing XACT [5].
A number of improvements can be made upon the experimental system. The most obvious is to use an actual array of transducers so as to eliminate mechanical scanning. This would vastly decrease the imaging time and improve image quality. The extensive scan time limited the number of scanning positions to 18. Should more have been employed, the image quality would be increased. In comparing the simulations (SNR around 32 dB) to the experiment (SNR of 16 dB), the former employed a higher number of transducers which helped improve SNR. Most of the limitations in this experiment were due to low SNR, which required us to have an unconventional placement of components to ensure maximum absorbance of X-rays by the bone. This can be addressed by using a more powerful X-ray tube. Likewise, methods have also been proposed in using the correlation between radiation-induced ultrasound and pulse-echo ultrasound for SNR improvement [26]. Higher-resolution images will be needed in order to image the different layers of bone, which can be achieved by employing higher center-frequency transducers. This will, however, come with the tradeoff of decreased SNR, as the higher frequencies have greater attenuation. Thus, SNR improvement remains the greatest challenge to be addressed should XACT be utilized for higher-resolution bone imaging. For XACT imaging of objects at times less than the duration of the head wave from the transducer (in our case, 40 microseconds), the head-wave problem will need to be addressed. This can be done by appropriately shielding the transducer from electromagnetic radiation [27]. In photoacoustic imaging, where lasers are used as the acoustic excitation source, methods have been proposed to use head-waves to improve imaging by using the complementary information encoded in them [28]. This improvement could also be incorporated into XACT in future studies.
Compared to other electromagnetically-induced acoustic wave generation mechanisms, XACT does unfortunately require a small radiation dosage, but it has the potential to measure features beyond the capability of other such mechanisms. As X-rays use higher-energy photons than say, lasers [29], the contrast mechanism will be different, yielding the ability to observe unique structures. Greater depth is also potentially possible as X-rays have little attenuation in soft tissue. In scenarios where radiation dosage is a minimal concern, XACT also has the potential to be used in conjunction with traditional CT to yield 3D images which contain both X-ray and acoustic data regarding the structure of interest.
Should XACT be translated into a clinical setting, the ultrasound component will be relatively easy to implement as ultrasound arrays are virtually ubiquitous. Depending on the object of interest, varying geometries of the ultrasound arrays may need to be introduced into the clinical setting however. The X-ray component of XACT will likely be more difficult to implement as the X-rays must be pulsed on the order of nano-seconds [6]. Should XACT find widespread clinical use, nano-second pulsed X-ray sources must become more widely accessible.
VI. CONCLUSION
We have demonstrated the first-ever XACT imaging of a bone sample. Though we do confess our experimental image quality is somewhat poor, we believe it to be first of the many to come as there are a large number of improvements that can be made. The next steps in furthering this technology in biomedical imaging is three-dimensional imaging by employing higher-dimensional transducer-arrays and signal-to-noise ratio improvement.
We are hopeful for future use of XACT imaging in imaging bone, as not one, but three modalities are possible: X-ray, conventional ultrasound, and X-ray-induced ultrasound. The combination of these three in a single system can provide more information and potentially transform the way bone diseases are diagnosed.
ACKNOWLEDGMENT
This work was partially supported by the Guangdong Innovative and Entrepreneurial Research Team Program (Grant No. 2016ZT06G375), National Science Foundation Grants (NSFC Grant No.51975131) to Dr. Xuanrong Ji. This work was also partially supported by National Institute of Health (R37CA240806) and American Cancer Society (133697-RSG-19–110-01-CCE) to Dr. Liangzhong Xiang.
Contributor Information
Elijah Robertson, College of Medicine, University of Oklahoma Health Sciences Center, Oklahoma City, Oklahoma..
Pratik Samant, Stephenson School of Biomedical Engineering and School of Aerospace and Mechanical Engineering at the University of Oklahoma, Norman, Oklahoma..
Siqi Wang, Department of Biomedical Engineering, University of California, Irvine, Irvine, CA..
Tiffany Tran, Stephenson School of Biomedical Engineering and School of Aerospace and Mechanical Engineering at the University of Oklahoma, Norman, Oklahoma..
Xuanrong Ji, School of Electromechanical Engineering at Guangdong University of Technology, Guangzhou, Guangdong, China..
Liangzhong Xiang, Department of Biomedical Engineering and the Department of Radiological Sciences, University of California, Irvine, Irvine, CA..
REFERENCES
- [1].Rontgen WK, “A New Form of Radiation,” Science, vol. 3, no. 72, pp. 726–9, May 1896. [DOI] [PubMed] [Google Scholar]
- [2].Kwang YK and Sachse W, “X-Ray Generated Ultrasound,” Applied Physics Letters, vol. 43, no. 12, pp. 1099–1101, 1983. [Google Scholar]
- [3].Xiang L, Han B, Carpenter C, Pratx G, Kuang Y, and Xing L, “X-ray acoustic computed tomography with pulsed x-ray beam from a medical linear accelerator,” Medical Physics, vol. 40, no. 1, January 2013. [DOI] [PMC free article] [PubMed] [Google Scholar]
- [4].Samant P, Trevisi L, Ji X, and Xiang L, “X-ray induced acoustic computed tomography,” Photoacoustics, vol. 19, September. 2020, Art. no. 100177. [DOI] [PMC free article] [PubMed] [Google Scholar]
- [5].Tang S, Yang K, Chen Y, and Xiang L, “X-ray-induced acoustic computed tomography for 3D breast imaging: A simulation study,” Medical Physics, vol. 45, no. 4, pp. 1662–1672, 2018. [DOI] [PubMed] [Google Scholar]
- [6].Xiang L, Tang S, Ahmad M, and Xing L, “High Resolution X-ray-Induced Acoustic Tomography,” Scientific Reports, vol. 6, May 18 2016. [DOI] [PMC free article] [PubMed] [Google Scholar]
- [7].Tang S, Nguyen DH, Zarafshani A, Zheng B, Liu H. and Xiang L, “X-ray-induced acoustic computed tomography with an ultrasound transducer ring-array,” Applied Physics Letters, vol. 110, no. 10, March 6 2017. [Google Scholar]
- [8].Li Y, Samant P, Wang S, Behrooz A, Li D. and Xiang L, “3-D X-Ray-Induced Acoustic Computed Tomography With a Spherical Array: A Simulation Study on Bone Imaging,” IEEE Transactions on Ultrasonics, Ferroelectrics, and Frequency Control, vol. 67, no. 8, pp. 1613–1619, August. 2020 [DOI] [PMC free article] [PubMed] [Google Scholar]
- [9].Lei H, Zhang W, Oraiqat I, Liu Z, Ni J, Wang X, El Naqa I, “Toward in vivodosimetry in external beam radiotherapy using x-ray acoustic computed tomography: a soft-tissue phantom study validation,” Med. Phys 2018 [DOI] [PubMed] [Google Scholar]
- [10].Hickling S, Hobson M, Naqa IE, “Feasibility of X-Ray acoustic computed tomography as a tool for noninvasive volumetric in vivo dosimetry,” Int. J. Radiat.Oncol. Biol. Phys 90. 2014 [Google Scholar]
- [11].Hickling S, Lei H, Hobson M, L’eger P, Wang X, El Naqa I, “Experimental evaluation of x-ray acoustic computed tomography for radiotherapy dosimetry applications,” Med. Phys 44. 2016 [DOI] [PubMed] [Google Scholar]
- [12].Kim J, Park EY, Jung Y, Kim BC, Kim JH, Yi CY, Kim IJ, Kim C, “X-ray acoustic-based dosimetry using a focused ultrasound transducer and a medical linear accelerator, IEEE Trans. Radiat. Plasma Med. Sci 1 (2017) 534–540, [Google Scholar]
- [13].Tang S, Ramseyer C, Samant P, and Xiang LZ, “X-ray-induced acoustic computed tomography of concrete infrastructure,” Applied Physics Letters, vol. 112, no. 21, May 2018. [Google Scholar]
- [14].Tran T, Samant P, Xiang L, and Liu Y. “X-Ray Induced Acoustic Computed Tomography for Non-Destructive Testing of Aircraft Structure.” Proceedings of the ASME 2019 International Mechanical Engineering Congress and Exposition. Volume 1: Advances in Aerospace Technology. Salt Lake City, Utah, USA. November 11–14, 2019. [Google Scholar]
- [15].Choksi P, Jepsen KJ, and Clines GA, “The challenges of diagnosing osteoporosis and the limitations of currently available tools,” Clin Diabetes Endocrinol, vol. 4, p. 12, 2018. [DOI] [PMC free article] [PubMed] [Google Scholar]
- [16].Renaud G, Kruizinga P, Cassereau D, Laugier P, “In vivo ultrasound imaging of the bone cortex.” Physics in Medicine and Biology. vol. 63, no. 12, pp.125010. 2018. [DOI] [PubMed] [Google Scholar]
- [17].Beltrame V, Stramare R, Rebellato N, Angelini F, Frigo AC, Rubaltelli L, “Sonographic evaluation of bone fractures: a reliable alternative in clinical practice?” Clin Imaging. vol. 36, no. 4, p. 203–208. 2012. [DOI] [PubMed] [Google Scholar]
- [18].Wang LV, “Tutorial on Photoacoustic Microscopy and Computed Tomography” IEEE J. Sel. Top. Quantum Electron vol. 14, no. 1, p. 171. 2008. [Google Scholar]
- [19].Hasgall PA, Di Gennaro F, Baumgartner C, Neufeld E, Lloyd B, Gosselin MC, Payne D, Klingenböck A, Kuster N, “IT’IS Database for thermal and electromagnetic parameters of biological tissues,” Version 4.0, May 15, 2018, DOI: 10.13099/VIP21000-04-0. itis.swiss/database [DOI] [Google Scholar]
- [20].“X-Ray Mass Attenuation Coefficients,” Retrieved from https://physics.nist.gov/PhysRefData/XrayMassCoef/ComTab/bone.html
- [21].Treeby BE, Cox BT, “k-Wave: MATLAB toolbox for the simulation and reconstruction of photoacoustic wave fields,” SPIE vol. 15, no. 2, pp.1–12. 2010 [DOI] [PubMed] [Google Scholar]
- [22].Aslan MS, Shalaby A, and Farag AA, “Clinically desired segmentation method for vertebral bodies,” in 2013 IEEE 10th International Symposium on Biomedical Imaging, pp. 840–843, 2013. [Google Scholar]
- [23].Guillaume H, Padilla F, Peyrin F, and Laugier P. “Variation of Ultrasonic Parameters With Microstructure and Material Properties of Trabecular Bone: A 3D Model Simulation.” Journal of Bone and Mineral Research. vol. 22, no.5 pp. 665–674, May 2007. [DOI] [PubMed] [Google Scholar]
- [24].Preidler KW, Brossmann J, Daenen B, Pedowitz R, De Maeseneer M, Trudell D, and Resnick D. “Measurements of cortical thickness in experimentally created endosteal bone lesions: a comparison of radiography, CT, MR imaging, and anatomic sections,” American Journal of Roentgenology vol. 168. no. 6, p. 1501–1505. 1997 [DOI] [PubMed] [Google Scholar]
- [25].Treeby BE, Varslot TK, Zhang EZ, Laufer JG, and Beard PC, “Automatic sound speed selection in photoacoustic image reconstruction using an autofocus approach,” J. Biomed. Optics, vol. 16, no. 9, p. 090501, 2011. [DOI] [PubMed] [Google Scholar]
- [26].Gao F, Feng X, and Zheng Y, “Coherent Photoacoustic-Ultrasound Correlation and Imaging,” IEEE Transactions on Biomedical Engineering, vol. 61, no. 9, pp. 2507–2512, 2014. [DOI] [PubMed] [Google Scholar]
- [27].Wen H, Bennett E, and Wiesler DG, “Shielding of piezoelectric ultrasonic probes in Hall effect imaging,” Ultrasonic Imaging, vol. 20, no. 3, pp. 206–220, July 1998. [DOI] [PMC free article] [PubMed] [Google Scholar]
- [28].Moore MJ, Strohm EM, and Kolios MC, “Triplex micron-resolution acoustic, photoacoustic, and optical transmission microscopy via photoacoustic radiometry,” Optics Express, vol. 26, no. 17, pp. 22315–22326, August 2018. [DOI] [PubMed] [Google Scholar]
- [29].Beard Paul. “Biomedical photoacoustic imaging.” Interface focus vol. 1,4 pp. 602–31, 2011 [DOI] [PMC free article] [PubMed] [Google Scholar]


