

Abstract
OBJECTIVES:
We test the hypothesis that clinical measures of age-related cognitive, visual, and mobility impairments negatively impact older driver speed limit compliance to advance method developments that improve older patient care and screen, identify, and advise at-risk older drivers.
DESIGN:
Real-world driver behaviors of older adults who had a range of cognitive, visual, and mobility abilities (measured with standardized, clinical tests) were assessed in environmental context (e.g., speed limit, traffic density, roadway type). Older driver speed limit compliance was measured in constant speed limit zones and at transition zones, where speed limits changed.
SETTING:
A naturalistic driving study of older adults living around Omaha, Nebraska.
PARTICIPANTS:
Seventy-seven, legally licensed, active, and typically aging older drivers (65–90 years) who had a range of cognitive and visual abilities.
MEASUREMENTS:
Drivers typical, daily driving was continuously monitored for three months using sensor instrumentation installed in their own vehicles. At study start, each participant completed a comprehensive, standardized, clinical assessment of cognitive, visual, and mobility abilities relevant to aging and driving.
RESULTS:
Older drivers with greater cognitive impairment (p = 0.10) drove slower than drivers with less cognitive impairment, linking cognitive impairment to speed control. Drivers with greater visual impairment overall complied less with speed limit changes at transition zones (p = 0.01) and were more likely to comply with speed limit transitions when they occurred concurrently with changes in roadway features (p < 0.01).
CONCLUSION:
Results link clinical measures of age-related cognitive and visual impairment to impaired driver safety in real-world contexts. Real-world sensor data coupled with detailed, personalized older driver profiles can inform patients, caregivers, interventions, policy, and the design of supportive in-vehicle technology for at-risk older drivers.
Keywords: Naturalistic driving, speed limit compliance, transportation, older drivers, aging, medicine
INTRODUCTION
A total of 34,439 traffic crash fatalities were reported in the U.S. in 2016, including 6,764 adults over 65 years old.1 In 2012, 13.7% of the U.S. population was 65 years or older and this proportion will increase to 20.3% by 2030.2 Functional abilities (e.g., vision, cognition, mobility) decline with age, increasing older driver risk for crashes and crash fatalities.3 Understanding how clinically-relevant metrics of driver abilities and age-related impairments relates to real-world safety is essential for mitigating unsafe driving events, improving older patient care, and preserving older adult mobility. Naturalistic driving studies, using passive and unobtrusive sensor instrumentation installed in drivers’ own vehicles to monitor their typical driver behavior, offer objective assessments of real-world driver safety that can directly map back to clinical data, guiding older patient assessment, care, and intervention.4,5,6,7
Evidence-based frameworks linking clinical measures of aging to real-world safety are needed to assess and intervene in older driver safety, guide doctors in older patient care and counseling, develop methods that support older adult mobility and quality of life, and link real-world behavior to driver health––informing disease identification and treatment. Age-related impairments in functional abilities needed for safe driving may increase crash and injury risk, reducing mobility, autonomy, and quality of life. Driving environment factors related to poor visibility (e.g., night, adverse weather) and higher speed limits (e.g., increased injury risk) pose particular risk for older drivers.8,9,10,11
While some studies have assessed older driver safety in naturalistic or real-world contexts, they were often limited by sample size, lack of detailed driver health assessments, and use of retrospective crash records or self-report. One of the most commonly cited large-scale naturalistic driving studies – Strategic Highway Research Program (SHRP2) – had only 26% of drivers over 65 years and lacked detailed information on drivers’ mobility, cognition, vision, and health, limiting ability to map results to clinical data.6 Another study inspected crash severity among older drivers (≥65 years) across roadway conditions, but only analyzed retrospective crash record data which is often incomplete and lacks critical pre- and post-event information.12 Some research has found older adults’ driving practices were influenced by nighttime and roadway conditions; however, these conclusions were drawn from self-reported questionnaires (which are often unreliable) collected over a short study duration of 2 weeks (limiting the range of environments and states considered in each driver), and driver behaviors, like speed, were not considered.13 Our work extends this research by incorporating detailed, clinically-relevant health and functional assessments to quantify real-world, objective older driver safety behavior.
In this paper we directly linked clinical measures of age-related decline from cognitive, visual, and mobility domains to real-world driver safety behaviors, with the goal of developing methods to screen, identify, and advise older drivers with age-related functional impairments. Specifically, we evaluated correlations between driver functional abilities and behavior across driving environments to determine how age-related functional impairments impact driver speed limit compliance overall and at speed limit transition zones. We focused on driving environments where the driver was uninterrupted by intersections, construction, and other confounders – resulting in datasets of primarily interstate and highway driving. Speed limit compliance is a critical driver safety measure and drivers who drive above or below speed limit may place themselves at risk by deviating from typical traffic flow or impairing vehicle control.
Hypothesis
We tested the hypotheses that 1) older drivers with age-related functional impairments would show impaired driver safety––objectively indexed by speed limit compliance––overall and at speed limit transition zones and 2) speed limit compliance would be impacted by environmental characteristics (visibility [day or night], rush hour, day of the week, and other roadway features [e.g., number/width of lanes, pavement type]).
METHODS
Study Design
Data were collected as part of a longitudinal study where each driver participated for 2, 3-month periods separated by 1-year. This paper analyzed cross-sectional data from the first study year.
Participants
Ninety-one, typically aging, legally licensed drivers (65–90 years) were recruited via fliers, news, and talks at local senior organizations. All were community-dwelling. Exclusion criteria included significant medical co-morbidities (dementia, sleep disorders, pulmonary disease, congestive heart failure, major psychiatric illness, vestibular disease, and current substance abuse) and confounding medications (stimulants, narcotics, anxiolytics, anticonvulsants, antipsychotics, other major psychoactive medication). Of the 91 participants recruited, 13 declined to complete all study visits and 1 was excluded due to recent surgery. The final sample was 77 participants. Following Nebraska licensure standards, all 77 drivers had visual acuity of better than 20/40 (binocular, with or without correction). Driver characteristics ranged as would be expected in typically aging cohorts.14,15
Laboratory Assessments
At the start of each study year, drivers provided standardized, self-report of demographics (age, gender, race/ethnicity, education, and socioeconomics) and health (medication usage and diagnoses). Self-reported health data were used to determine driver eligibility. With driver consent, state DMV (Department of Motor Vehicle) records of crashes and citations were obtained at study start to quantify each driver’s safety for the 3-years prior to study start. Driver functional abilities were rated across clinically validated exams of cognition, vision, and mobility. All functional exam scores were analyzed continuously from lesser to greater impairment.
Vision Assessment
Drivers completed exams of far and near visual acuity (binocular, corrected or uncorrected) and contrast sensitivity at 5%. ETDRS charts were used for all vision assessments.16 Visual acuity is widely used by DMVs to determine driver safety. Contrast sensitivity, which measures an individual’s ability to resolve shapes at a distance and under low contrast conditions (e.g., nighttime, poor weather), is not typically used by DMVs to establish driver safety. Contrast sensitivity provides a more sensitive index of visual impairment that could impact driving (e.g., seeing a roadway sign or lane markers).17
Cognitive Assessment
This study collected standardized neuropsychological measures that are widely used clinically and well understood for quantifying cognitive impairment. All cognitive exams were administered by a clinically trained psychometrist. Tests of general cognitive impairment were Mini-Mental Status Exam (MMSE)15 and Montreal Cognitive Assessment (MoCA).16 Based on MoCA score guidelines for probable mild cognitive impairment (MCI) from the National Alzheimer’s Coordinating Center (NACC) and the National Institute on Aging (NIA),18 44% of our participants had cognitive scores that may indicate MCI (MoCA: 17 – 25) and no participants met cognitive criteria for probable dementia (MoCA: < 17).19,20 A composite measure of cognitive functioning (“COGSTAT”) was calculated from 8 clinical, neuropsychological assessments that are related to aging and driving (executive functioning, attention, visuospatial skills, episodic and working memory, speed of processing, and attention; Supplementary Table S1).21,22,23,24,25 These tests provide a more sensitive index of impairment than the MMSE or MoCA, particularly in pre-dementia older adults, and follow NACC/NIA recommendations for multi-domain assessment of cognitive impairment in MCI.18 COGSTAT is computed by adding up standardized test T-scores (mean = 50, SD[Standard Deviation] = 10) from visuospatial skills (i.e. Block Design, Judgment of Line Orientation, Rey Complex Figure Task [CFT] – Copy), memory (Benton Visual Retention Test, Rey Auditory Verbal Learning Test, Rey CFT – Recall, Controlled Oral Word Association), and executive functioning (Trail Making Test – Part B).22,25,26 COGSTAT scores are normed relative to scores from known healthy older adults. Our drivers showed a range of cognitive abilities as would be expected in typically older adults without dementia. The mean of the healthy older adult (COGSTAT = 400) represents performance similar to normative group.11 Scores below 400 indicate cognitive functioning below the healthy, older adult mean (75.9% of drivers; COGSTAT: 245.6–400) and vice versa (24.1% of drivers; COGSTAT: 400–467.5). Based on the commonly used threshold for indexing MCI (neuropsychological exam scores of < 1.5 SDs below the healthy older adult mean)27,28,29,30,31, 21.5% of our drivers had scores that may indicate MCI (COGSTAT: 245.6–328.8). In addition to the COGSTAT, we also assessed participants processing speed, divided attention, and selective attention using the Useful Field of View test (UFOV). 32,33 According to the UFOV criteria34, the majority of our participants (> 83%) showed normal performance (Supplementary Table S2).
Mobility Assessment
Drivers completed clinical tests of general mobility, including balance (Functional Reach)35 and walking speed (Get Up and Go).36
Naturalistic Driving Data Collection
“Black Box” systems were installed in each participant’s personal vehicle, recording typical driving, at the start of each 3-month naturalistic data collection period. Data were analyzed from the first period of data collection at study start. The systems are custom-built instrumentation, continuously recording driver behavior from on- to off-ignition, collecting video (forward roadway, cabin) and sensor data (GPS, speed, accelerometer, gyroscope, throttle). Raw data were post-processed to a 1 Hz sampling rate.
DATA ANALYSIS
Modeling Overview
This study focused on two driver safety outcomes: a) compliance during constant speed limit zones and b) compliance to speed limit transitions. Outcomes were modeled across driver (Table 1) and driving environment (Table 2) covariates. All continuous covariates were z-scored for modeling to permit effect comparison across a uniform scale.
Table 1.
Summary of Laboratory Assessments
| Description | Range & Mean |
|---|---|
| Age and gender | Age: 65 – 90, µ = 75, SD = 6.3 Male: N = 41; Female: N = 36 |
| COGSTAT: General cognitive ability measured as a normed composite score across 8, clinically validated, neuropsychological exams that are relevant to driving and aging and have been shown to predict driver safety in at-risk populations. Computed by summing standardized T-scores of the clinical, neuropsychological tests (relative to a reference group of healthy older adults), such that µ = 50 and SD = 10. Tests include Trail Making Test (Part B), Controlled Oral Word Association Test, Rey-Osterrieth Complex Figure Test (Copy and Delayed Recall-30 min), WAIS-III Block Design, Benton Visual Retention Test, Auditory-Verbal Learning Test, and Judgement of Line Orientation Test. |
245.6 – 467.5, µ = 363.2, SD = 47.4 (higher scores are better) A score of 400 represents the mean of the healthy older adult reference group. |
| MoCA: Montreal Cognitive Assessment. Participants with MCI have scores 17 – 25 and typically aging participants obtain scores > 25.18 | 20 – 30, µ = 25.9, SD = 2.4 (higher scores are better) |
| Useful Field of View (UFOV): Computer-based test of processing speed, divided attention, and selective attention.32,33 | Speed: 9 – 26.6, µ = 22.2, SD = 3.0 Divided: 16.6 – 236.6, µ = 49.9, SD = 52.4 Selective: 53.2 – 416.4, µ = 160.1, SD = 75.5 (milliseconds, lower scores are better) |
| Far Visual Acuity (FVA): Ability to see at a distance (corrected or uncorrected). Scores were converted to a continuous, logMAR (Logarithm of the Minimum Angle of Resolution) scale | FVA: −0.2 – 0.42, µ = 0.07, SD = 0.12 (lower scores are better) |
| Contrast Sensitivity (CS): Ability to see under low contrast conditions (corrected or uncorrected) and analyzed using logMAR scale | CS: 0.22 – 0.92, µ = 0.51, SD = 0.14 (lower scores are better) |
| Get-up and Go: General mobility measured as the time required for a seated participant to stand up, walk 10 feet, turn around, and return to seat | 5040 – 17059, µ = 9398, SD = 2285.3 (milliseconds, lower scores are better) |
| Functional Reach: Balance measured how far the person can reach forward and maintain balance | 4.62 – 16.5, µ = 9.95, SD = 2.5 (inch, higher scores are better) |
| Speeding citations for 3-year preceding study induction | 6 people violated |
Table 2.
Summary of Driving Environment Covariates
| Predictor | Min | Max | Mean | Count | Definition |
|---|---|---|---|---|---|
| Driving Environment Covariates for Constant Speed Limit Model (Data aggregated to GIS Polyline level, with 10,987 records) | |||||
| Lane Number | 1 | 5 | 2.4 | - | Number of lanes |
| Lane Width | 9 | 18 | 12.3 | - | Lane width (feet) |
| Annual Average Daily Traffic | 145 | 173,480 | 54,709 | - | Total annual traffic volume divided by 365 |
| 25 mph – 55 mph | - | - | - | 769 | Posted Speed Limit |
| 60 mph | - | - | - | 5,358 | |
| 65 mph | - | - | - | 2,292 | |
| 75 mph | - | - | - | 2,568 | |
| Rural | - | - | - | 6,129 | Rural area vs. Urban area |
| Urban | - | - | - | 4,858 | |
| Roadway: Others | - | - | - | 5,100 | Interstate vs. others (with traffic signals) |
| Roadway: Interstate | - | - | - | 5,887 | |
| Surface: Others | - | - | - | 4,149 | Concrete vs. others (asphalt, blend, etc.) |
| Surface: Concrete | - | - | - | 6,838 | |
| Day | - | - | - | 9,229 | Day (sunrise-sunset) vs. Night(sunset-sunrise) |
| Night | - | - | - | 1,758 | |
| Weekday | - | - | - | 8,151 | Monday to Friday vs. Saturday and Sunday |
| Weekend | - | - | - | 2,836 | |
| Rush Hour | - | - | - | 2,200 | Rush hours periods: 7~9 am or 4~6 pm |
| Not Rush Hour | - | - | - | 8,787 | |
| Driving Environment Covariates for Speed Limit Transition Model (Data aggregated to 3-minute trip level, with 248 trips) | |||||
| Not Comply (maintain same speed) |
- | - | - | 63 | Categorical target variable: Speed limit compliance, with 3 different categories |
| Comply to Increased Speed Limit | - | - | - | 70 | |
| Comply to Reduced Speed Limit | - | - | - | 115 | |
| Different | - | - | - | 228 | Roadway condition: Same means all roadway characters are the same, except the posted speed limit |
| Same | - | - | - | 20 | |
| Within 5 mph | - | - | - | 151 | Speed Limit Change Status: Absolute value of speed limit change |
| Greater than 5 mph | - | - | - | 97 | |
| Day | - | - | - | 222 | Visibility condition: Day (sunrise-sunset) vs. Night (sunset-sunrise) |
| Night | - | - | - | 26 | |
| Weekday | - | - | - | 173 | Monday to Friday vs. Saturday and Sunday |
| Weekend | - | - | - | 75 | |
| Rush Hour | - | - | - | 46 | Rush hour periods: 7~9 am or 4~6 pm |
| Not Rush Hour | - | - | - | 202 | |
Data Processing
We processed 242,153 km (150,467 miles) of Black Box GPS data, in Nebraska, for modeling (Figure 1). Roadway features and segments were determined by joining GPS data to Nebraska Geospatial Information System (GIS) databases (Supplementary Figure S1 and S2). Roadway features included: speed limit, lane number/width, daily traffic, surface type, and roadway types. Roadway segments were represented by GIS polylines (a polyline is a straight line or arc between two vertices where all roadway features are the same). For processing and analysis, driving data were divided into 3-minute “trips” (3-minute continuous driving segments that contained one or more roadway segments).
Figure 1.
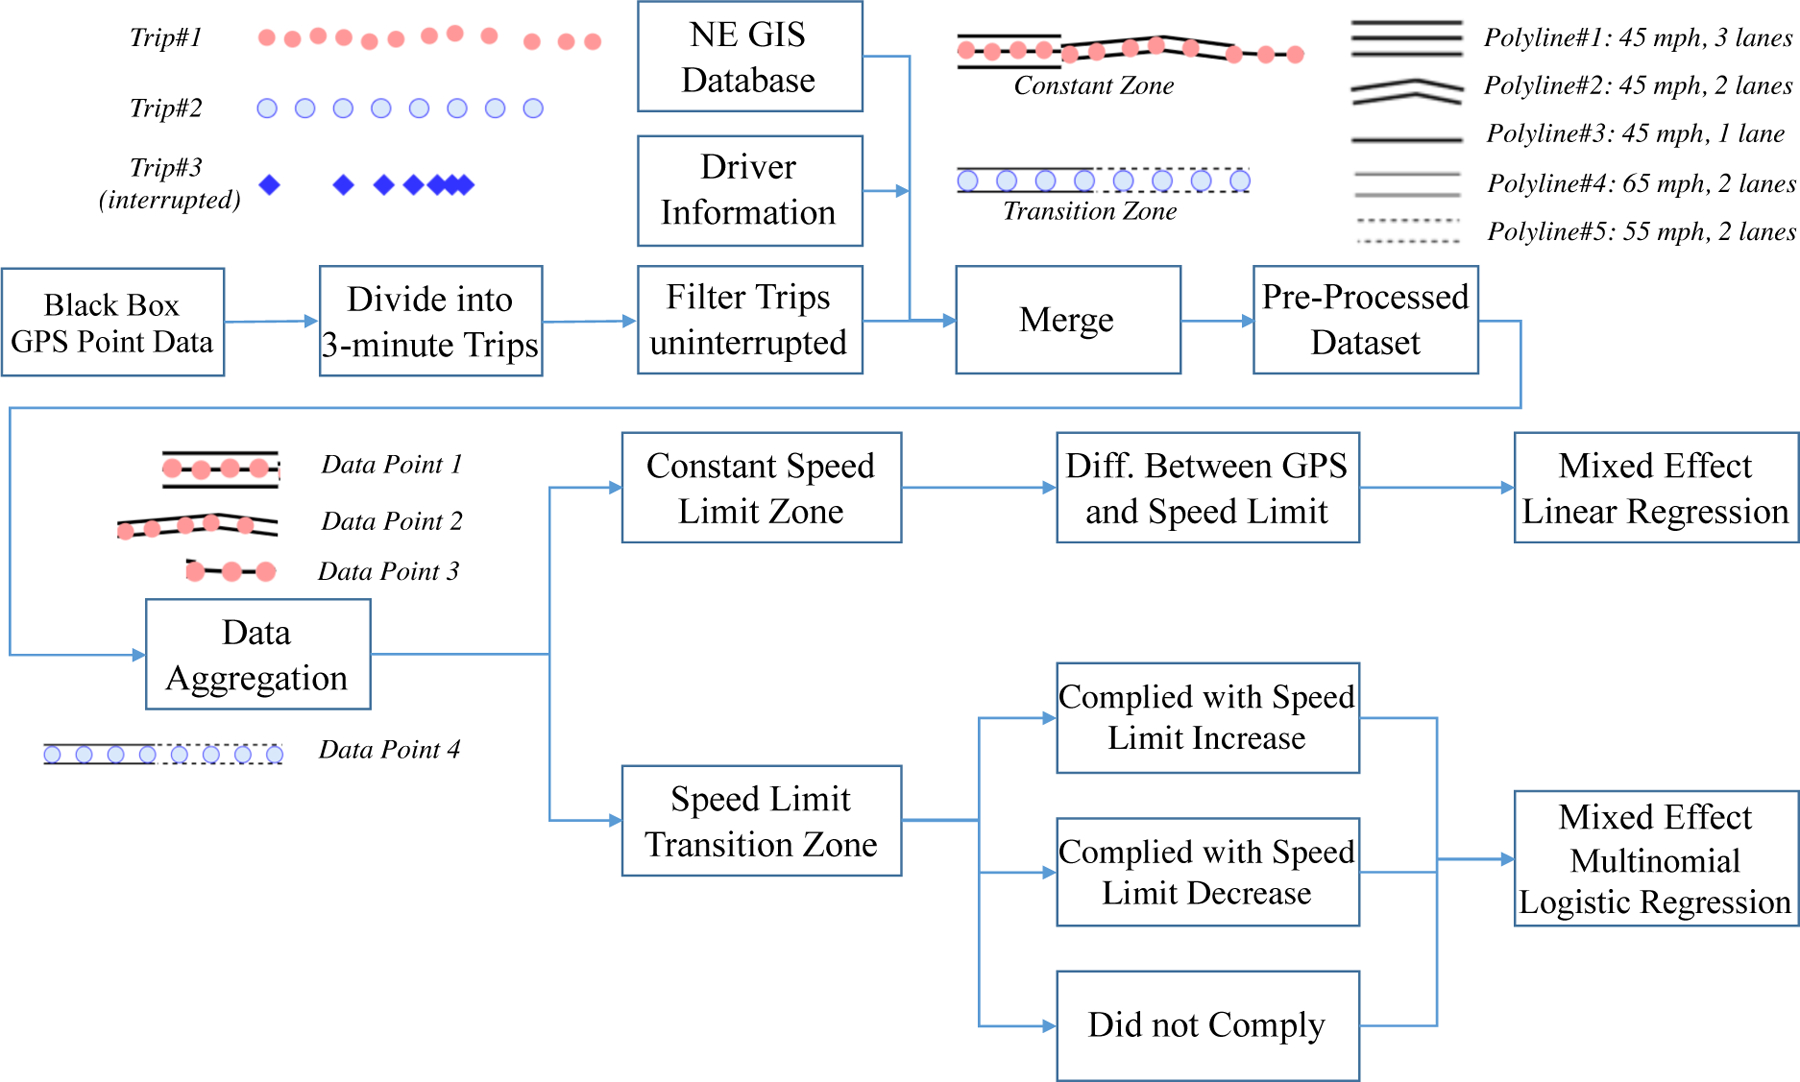
Data Processing and Modeling Pipeline.
To improve results interpretability, we restricted analyses to probable uninterrupted driving scenarios (Supplementary Figure S3 and S4). Driving data were preprocessed with video validation to remove segments where drivers made turns, stopped at intersections, entered a work zone or an area around a traffic accident, or were traveling in congested traffic. A binary Logistic Regression classifier was fine-tuned to filter out trips containing confounding interruptions. A labeled training dataset of 343 3-minute videos were manually annotated as “interrupted” or “uninterrupted driving” based on whether they contained at least one instance of traffic interruption. The trained classifier (98% cross-validated accuracy) was applied to the full dataset resulting in a final dataset of 257 hours across 28,477 km (17,695 miles) of uninterrupted driving. Due to typical roadway characteristics, the final dataset included primarily highway or interstate driving.
Speed Limit Compliance Outcomes
Constant speed limit zones are roadway segments where the legal posted speed limit did not change. Driver compliance was measured as the average difference in vehicle speed to the posted speed limit for each GIS roadway segment, permitting comparison of driver behavior across various locations with varying speed limits.37 Constant speed limit compliance was modeled using linear regression with by-participant random intercepts. After aggregating speed to the GIS polyline level, 10,987 roadway segments (represented by GIS polylines) were used for analysis. The final number of drivers, after removing interrupted driving trips, included in constant speed limit analysis was 69 (23.2% may have had MCI based on COGSTAT scores 1.5 SDs below the healthy older adult mean; 78.3% scored less than the healthy older adult COGSTAT mean of 400).
Speed limit transition zones were defined as roadway segments where the posted speed limit increased or decreased. Each zone lasted 3 minutes, with approximately half the time traveling toward the speed limit sign and the rest driving away from it. Driver speed limit compliance was categorized across 3 outcomes: a) No compliance: Drivers did not change their speed within the zone; b) Complied with increase: Drivers increased speed by ≥5 mph when speed limit increased; and c) Complied with decrease: Drivers slowed speed by ≥5 mph when the speed limit decreased. They were modeled using multinomial logistic regression with by-participant random intercepts. After aggregating data to the 3-minute trip level, the analyzed data included 248 trips. Forty-six drivers were in the final analysis after removing interrupted trips (21.7% may have had MCI based on COGSTAT scores; 73.9% scored < 400 COGSTAT).
Driver Covariates
Driver covariates (demographics, functional abilities, and state crash and citation history) are summarized in Table 1.
Driving Environment Covariates
Table 2 summarizes roadway features for two different scenarios. Features extracted from GIS were directly used for constant speed limit zones. For speed limit transition zones, polyline features were aggregated for each 3-minute trip to categorize if a) roadway features changed contemporaneously with the speed limit (variable = “same”) and b) the absolute magnitude of change in the speed limit (variable = “speed limit change status”).
We evaluated the impact of visibility (day or night), rush hour, and day of the week on driver speed limit compliance in all models. Visibility was determined by mapping GPS coordinates and timestamps to the U.S. Naval Observatory sunrise-sunset database. Rush hour happens twice every weekday, between 7 ~ 9 am or 4 ~ 6 pm, during which most people commute under a higher traffic volume. Day of the week (weekday or weekend) indexes typical traffic pattern based on the typical work week (Monday-Friday).
Mixed Effect Modeling
Drivers showed a range of individual variation, which we accounted for in modeling with a by-participant random intercept. The matrix notation is : y is the target variable with size N × 1; X is a N × p matrix with p covariates; β is the fixed-effect coefficients with size p × 1; Z is the random complement to the fixed X with size N × q; u is a q × 1 column vector of the random effects (q participants); and ε is the residuals vector accounts for randomness. To generalize the model when the response is not continuous, a link function is often applied. The R package lme438 fitted a linear mixed-effect regression model for speed selection in constant speed limit zones. To model the categorical outcomes for speed limit compliance, in speed limit transition zones, the Bayesian multilevel framework in R brms39 was applied for the multinomial logistic regression.
RESULTS
Modeling of Speed Selection in Constant Speed Limit Zones
Roadway speed limit significantly affected driver constant speed limit compliance (Table 3). Drivers had better compliance (e.g., speeds closer to the speed limit) on higher-speed roadways and worse compliance on lower-speed roadways where drivers tended to drive above the speed limit (b = 4.36, 3.48, 2.30, −1.35, p < 0.01 for speed limit < 60, 60, 65, 75). Drivers with greater cognitive impairment (smaller COGSTAT), regardless of probable MCI class, drove slower (b = 0.54, p = 0.10). In this cohort, driver mobility and visual abilities did not affect constant speed limit compliance. Drivers, with history of speeding citations, tended to drive faster (b = 2.7, p = 0.03), mapping patterns of naturalistic driving to objective safety records. Driving environment factors, like rural area (b = 2.11, p < 0.01) and interstate (b = 1.87, p < 0.01), were correlated with more speeding. Drivers drove slower at night (b = −0.68, p < 0.01).
Table 3.
Mixed Effect Linear Regression of Speed
| Predictor | Estimate | Std. Error | P-Value |
|---|---|---|---|
| Intercept | 4.37 | 0.48 | < 0.01 |
| Speed Limit < 60 | Baseline | ||
| Speed Limit 60 | −0.89 | 0.20 | < 0.01 |
| Speed Limit 65 | −2.07 | 0.21 | < 0.01 |
| Speed Limit 75 | −5.72 | 0.29 | < 0.01 |
| Rural | Baseline | ||
| Urban | −2.11 | 0.13 | < 0.01 |
| Roadway Type Interstate | Baseline | ||
| Roadway Type Other | −1.87 | 0.19 | < 0.01 |
| Lane Number | 0.53 | 0.05 | < 0.01 |
| Lane Width | −0.36 | 0.03 | < 0.01 |
| Day | Baseline | ||
| Night | −0.68 | 0.11 | < 0.01 |
| No Speeding Violation | Baseline | ||
| With Speeding Ticket Record | 2.70 | 1.24 | 0.03 |
| COGSTAT | 0.54 | 0.32 | 0.10 |
| UFOV-Speed | 0.40 | 0.28 | 0.15 |
| UFOV-Divided | 0.00 | 0.37 | 0.99 |
| UFOV-Selective | −0.01 | 0.36 | 0.97 |
| Far Visual Acuity | 0.06 | 0.56 | 0.97 |
| Contrast Sensitivity | −0.47 | 0.57 | 0.41 |
| Get-up and Go | 0.37 | 0.37 | 0.32 |
| Functional Reach | 0.03 | 0.36 | 0.94 |
Modeling of Speed Limit Compliance in Speed Limit Transition Zones
Driving environment predicted driver compliance with speed limit transitions (Table 4). Overall, greater speed limit changes (> 5 mph) correlated with greater compliance with speed limit transitions (p = 0.01). Drivers were more likely to comply with speed limit transitions when they occurred concurrently with changes in roadway features. Contrast sensitivity was significant (p = 0.01), indicating that drivers, with worse visual abilities, complied less with decreased speed limit transitions. Compliance with speed limit transitions was not affected by driver cognitive or mobility abilities, suggesting that changing roadway characteristics may primarily challenge drivers with age-related visual impairments.
Table 4.
Mixed Effect Multinomial Logistic Regression of Speed Limit Compliance
| Predictor | Estimate | Est. Error |
95% CI Lower |
95% CI Upper |
Odd Ratio |
|---|---|---|---|---|---|
| Comply to Increase Speed (28.2% of Total Observations) | |||||
| Roadway Changes | Baseline | ||||
| Roadway Same | −3.36 | 1.28 | −6.10 | −1.06 | 0.04 |
| Speed Limit Change = 5 mph | Baseline | ||||
| Speed Limit Change > 5 mph | 1.78 | 0.80 | 0.22 | 3.34 | 5.93 |
| Day | Baseline | ||||
| Night | 3.22 | 1.12 | 1.22 | 5.56 | 25.03 |
| Not Rush Hours | Baseline | ||||
| Rush Hours | 1.54 | 0.65 | 0.29 | 2.86 | 4.66 |
| Comply to Decrease Speed (46.4%) | |||||
| Roadway Changes | Baseline | ||||
| Roadway Same | −2.42 | 0.83 | −4.12 | −0.86 | 0.09 |
| Contrast Sensitivity | −4.41 | 1.98 | −8.82 | −0.82 | 0.01 |
DISCUSSION
This paper focused on determining how age-related cognitive impairment impacts driver safety related to speed limit compliance in older drivers without dementia. Drivers with greater cognitive impairment, regardless of whether they met criteria for MCI, showed reduced speed limit compliance. This result suggests that clinical classifications of cognitive impairment may underestimate real-world safety risk in typically aging or preclinical cohorts, underscoring the need for individual cognitive assessment even when no dementia is present.
The results advance frameworks linking clinical measures to real-world safety and outcomes, which in turn, provide methods to accurately identify at-risk older drivers for clinical assessment and intervention. While impairments in mobility might have been expected to reduce safety, we found that age-related visual and cognitive impairments better index safety in our cohort of healthy, older adults supporting the primary role of age-related visual and cognitive impairments in aging and driver safety––in line with prior literature.17,25 Results suggest that doctors who assess an older driver’s safety should consider cognitive and visual impairments above mobility.
Drivers with better cognitive abilities drove faster (marginally significant), suggesting that drivers with greater cognitive impairment may reduce speed as a compensatory mechanism to allow the driver greater time to process and react to environmental changes. While drivers may adopt this behavior as a strategy to improve safety, driving below ambient traffic speed may increase risk (e.g., rear-end crash).40
Visual impairments were linked specifically to reducing compliance with speed limit transitions, which may denote that drivers with visual impairments have more difficulties rapidly assessing and responding to roadway changes. Specifically, when assessing visual impairment doctors should be aware that visual acuity (typically assessed for licensure) may provide an inadequate index of visual abilities needed for safe driving. Our results suggest that contrast sensitivity, which is not typically assessed by DMVs, is critical for seeing road signs and surrounding traffic across a range of environments. Contrast sensitivity may provide more sensitive predictions of real-world risk than visual acuity. This argues, as others have,17 that DMV screening procedures may be inadequate, also emphasizing the importance of individualized functional abilities assessments when determining driver safety and doctor-patient counseling.
Critically, our cohort of drivers did not include dementia, suggesting that cognitive and visual changes in this population may potentially link to subtle preclinical indices of disease. Several prior studies have shown that decline in many neurodegenerative disorders (e.g., Alzheimer’s disease41 or Parkinson’s disease42) may onset decades before clinical diagnosis. We find that in our cohort of drivers even subtle differences in cognitive and visual performance manifest as observable changes in driver behavior supporting passive-monitoring of driver behavior as a potential tool to index preclinical disease stages. (e.g., incipient Alzheimer’s). Further research, particularly longitudinal studies following individual disease progression, is needed to elucidate this hypothesis.
We linked on-road safety behavior metrics to objective safety outcomes: drivers who had a history of speeding citations also drove more above the speed limit. We also found that environmental or roadway feature changes impacted driving performance for all drivers. The likelihood for compliance at speed limit transition zones is higher when they occurred concurrently with changes in other roadway features, suggesting that drivers ultimately adjust their speed based on the driving environments or perception of safety, rather than posted speed limits, which agrees with prior literatures.43,44,45
Admittedly, further investigation is needed to clarify some results. While we did not find that mobility was predictive of safety, it is unclear if this result is due to our cohorts restricted age-range and the lack of dementia in our driver sample. Additionally, our tests focused on general mobility (balance and walking). It is possible that these mobility measures do not capture potential motor dysfunctions that might affect speed limit compliance. Secondly, our data pre-processing prioritized limiting confounding effects of interrupted driving, at the cost of reducing data, and restricting analyses primarily to interstate and highway driving conditions. However, despite reduced power, we were still able to find effects of cognitive decline on drivers’ safety. Additional data and techniques are needed to capture a more comprehensive driving environment, including those non-highway driving conditions. A potential avenue to address this is by developing methods that permit incorporation of real-time traffic dynamics and weather into our models. Advancements in computer vision––which can automatically extract driving environment––will be critical to explore the entire dataset. Our data were constrained to Nebraska GIS databases, which are all static features. While these features do an adequate job of characterizing high-level variation in roadway environments, greater precision is needed to determine how real-time roadway variation (e.g., lead vehicle presence, real-time cognitive demands) links to driver abilities. Better characterization of the link between driver abilities and real-time roadway or task demands will further elucidate how clinical tests can predict real-world safety. While our models assessed independent contributions of cognitive and visual impairments, these impairments often co-exist within a single driver and may interact, affecting the patterns observed here.
Studying behavior in real-world contexts directly advances the clinical need to screen at-risk drivers and identify individuals for intervention. Advanced frameworks linking clinical tests to real-world behavior and outcomes directly improves patient care and doctor ability to counsel and treat patients. These findings suggest specific targets for intervention to improve older driver safety––including patient care, licensure recommendations, safe roadway design and advanced driver assistance systems.
Supplementary Material
Supplementary Table S1. Cognitive Tests
Supplementary Table S2. UFOV (Useful Field of View) Tests
Supplementary Figure S1. Driving Routes Visualization of Older Driver Study
Supplementary Figure S2. Nebraska GIS (Geographic Information System) Polyline Shapefile
Supplementary Figure S3. Undesired Trips Example – Making Right Turn at an Intersection
Supplementary Figure S4. Undesired Trips Example – Traffic Accident
Key Points:
Studying behavior in real-world contexts directly advances the clinical need to screen at-risk drivers and identify individuals for intervention.
This paper focuses on determining the role of age-related cognitive impairments in driver safety among older drivers who do not have dementia.
Why does this paper matter?
The paper directly advances frameworks linking clinical measures to real-world safety and outcomes, which in turn, informs methods that accurately identify at-risk older drivers for clinical assessment and intervention.
ACKNOWLEDGEMENTS
This work was supported by the NIH and NIA (R01AG017177) and the University of Nebraska Medical Center’s Mind & Brain Health Labs. The views expressed in this paper are those of the authors alone and not the NIH or NIA. We thank our research team for coordinating this project.
The data used in this study are available on request from the corresponding author. The data are not publicly available because they contain information that could compromise the privacy of research participants.
Sponsor’s Role: None
Funding Statement:
This work was supported by the NIH NIA (R01AG017177) and the University of Nebraska Medical Center’s Mind & Brain Health Labs.
Footnotes
Conflicts of Interest: The authors declare no potential conflict of interest
REFERENCES
- 1.National Highway Traffic Safety Administration (NHTSA). Traffic Safety Facts 2016.; 2018. https://crashstats.nhtsa.dot.gov/Api/Public/ViewPublication/812554. Accessed July 7, 2018.
- 2.Ortman JM, Velkoff VA, Hogan H. An Aging Nation: The Older Population in the United States Population Estimates and Projections Current Population Reports.; 2014. www.census.gov/population. Accessed August 5, 2018.
- 3.Tefft BC. Rates of Motor Vehicle Crashes, Injuries and Deaths in Relation to Driver Age, United States, 2014–2015.; 2017. http://aaafoundation.org/wp-content/uploads/2017/11/CrashesInjuriesDeathsInRelationToAge2014-2015Brief.pdf. Accessed August 1, 2018.
- 4.Dawson JD, Uc EY, Anderson SW, Johnson AM, Rizzo M. Neuropsychological Predictors of Driving Errors in Older Adults. J Am Geriatr Soc. 2010;58(6):1090–1096. 10.1111/j.1532-5415.2010.02872.x [DOI] [PMC free article] [PubMed] [Google Scholar]
- 5.Emerson JL, Johnson AM, Dawson JD, Uc EY, Anderson SW, Rizzo M. Predictors of driving outcomes in advancing age. Psychol Aging. 2012;27(3):550–559. 10.1037/a0026359 [DOI] [PMC free article] [PubMed] [Google Scholar]
- 6.Dingus TA, Guo F, Lee S, et al. Driver crash risk factors and prevalence evaluation using naturalistic driving data. Proc Natl Acad Sci. 2016;113(10):2636–2641. 10.1073/pnas.1513271113 [DOI] [PMC free article] [PubMed] [Google Scholar]
- 7.Liu C, Merickel J, Sharma A, & Rizzo M Naturalistic Driving Data Indexes Travel Patterns & Exposure in At-Risk Older Drivers. In: ANNALS OF NEUROLOGY. ANNALS OF NEUROLOGY; 2018. [Google Scholar]
- 8.Allen HK, Beck KH, Zanjani F. Driving concerns among older adults: Associations with driving skill, behaviors, and experiences HHS Public Access. Traffic Inj Prev. 2019;20(1):45–51. 10.1080/15389588.2018.1528358 [DOI] [PMC free article] [PubMed] [Google Scholar]
- 9.Davis J, Casteel C, Hamann C, Peek-Asa C. Risk of motor vehicle crash for older adults after receiving a traffic charge: A case–crossover study. Traffic Inj Prev. 2018;19(5):506–512. 10.1080/15389588.2018.1453608 [DOI] [PubMed] [Google Scholar]
- 10.Lombardi DA, Horrey WJ, Courtney TK. Age-related differences in fatal intersection crashes in the United States. Accid Anal Prev. 2017;99:20–29. 10.1016/J.AAP.2016.10.030 [DOI] [PubMed] [Google Scholar]
- 11.Merickel J, High R, Dawson J, Rizzo M. Real-world risk exposure in older drivers with cognitive and visual dysfunction. Traffic Inj Prev. 2019;20(sup2):S110–S115. 10.1080/15389588.2019.1688794 [DOI] [PMC free article] [PubMed] [Google Scholar]
- 12.Khattak AJ, Pawlovich MD, Souleyrette RR, Hallmark SL. Factors related to more severe older driver traffic crash injuries. J Transp Eng. 2002;128(3):243–249. 10.1061/(ASCE)0733-947X(2002)128:3(243) [DOI] [Google Scholar]
- 13.Myers AM, Trang A, Crizzle AM. Naturalistic Study of Winter Driving Practices by Older Men and Women: Examination of Weather, Road Conditions, Trip Purposes, and Comfort. Can J Aging / La Rev Can du Vieil. 2011;30(04):577–589. 10.1017/S0714980811000481 [DOI] [PubMed] [Google Scholar]
- 14.Ferri CP, Prince M, Brayne C, et al. Global prevalence of dementia: a Delphi consensus study. Lancet (London, England). 2005;366(9503):2112–2117. 10.1016/S0140-6736(05)67889-0 [DOI] [PMC free article] [PubMed] [Google Scholar]
- 15.Petersen RC, Roberts RO, Knopman DS, et al. Prevalence of mild cognitive impairment is higher in men: The Mayo Clinic Study of Aging. Neurology. 2010;75(10):889. 10.1212/WNL.0B013E3181F11D85 [DOI] [PMC free article] [PubMed] [Google Scholar]
- 16.Early Treatment Diabetic Retinopathy Study Design and Baseline Patient Characteristics. Ophthalmology. 1991;98(5):741–756. 10.1016/S0161-6420(13)38009-9 [DOI] [PubMed] [Google Scholar]
- 17.Owsley C, McGwin G. Vision and driving. Vision Res. 2010;50(23):2348–2361. 10.1016/j.visres.2010.05.021 [DOI] [PMC free article] [PubMed] [Google Scholar]
- 18.Albert MS, DeKosky ST, Dickson D, et al. The diagnosis of mild cognitive impairment due to Alzheimer’s disease: Recommendations from the National Institute on Aging-Alzheimer’s Association workgroups on diagnostic guidelines for Alzheimer’s disease. Alzheimer’s Dement. 2011;7(3):270–279. 10.1016/j.jalz.2011.03.008 [DOI] [PMC free article] [PubMed] [Google Scholar]
- 19.Carson N, Leach L, Murphy KJ. A re-examination of Montreal Cognitive Assessment (MoCA) cutoff scores. Int J Geriatr Psychiatry. 2018;33(2):379–388. 10.1002/gps.4756 [DOI] [PubMed] [Google Scholar]
- 20.Roalf DR, Moberg PJ, Xie SX, Wolk DA, Moelter ST, Arnold SE. Comparative accuracies of two common screening instruments for classification of Alzheimer’s disease, mild cognitive impairment, and healthy aging. Alzheimer’s Dement. 2013;9(5):529–537. 10.1016/j.jalz.2012.10.001 [DOI] [PMC free article] [PubMed] [Google Scholar]
- 21.Thompson KR, Johnson AM, Emerson JL, Dawson JD, Boer ER, Rizzo M. Distracted driving in elderly and middle-aged drivers. Accid Anal Prev. 2012;45:711–717. 10.1016/j.aap.2011.09.040 [DOI] [PMC free article] [PubMed] [Google Scholar]
- 22.Uc EY, Rizzo M, Anderson SW, Shi Q, Dawson JD. Driver landmark and traffic sign identification in early Alzheimer’s disease. J Neurol Neurosurg Psychiatry. 2005;76(6):764–768. 10.1136/jnnp.2004.049338 [DOI] [PMC free article] [PubMed] [Google Scholar]
- 23.Aksan N, Dawson JD, Emerson JL, et al. Naturalistic Distraction and Driving Safety in Older Drivers. [DOI] [PMC free article] [PubMed]
- 24.Dawson JD, Anderson SW, Uc EY, Dastrup E, Rizzo M. Predictors of driving safety in early Alzheimer disease. Neurology. 2009;72(6):521–527. 10.1212/01.wnl.0000341931.35870.49 [DOI] [PMC free article] [PubMed] [Google Scholar]
- 25.Dawson JD, Uc EY, Anderson SW, Johnson AM, Rizzo M. Neuropsychological predictors of driving errors in older adults. J Am Geriatr Soc. 2010;58(6):1090–1096. 10.1111/j.1532-5415.2010.02872.x [DOI] [PMC free article] [PubMed] [Google Scholar]
- 26.Aksan N, Dawson JD, Emerson JL, et al. Naturalistic distraction and driving safety in older drivers. Hum Factors. 2013;55(4):841–853. 10.1177/0018720812465769 [DOI] [PMC free article] [PubMed] [Google Scholar]
- 27.Loewenstein DA, Acevedo A, Agron J, et al. Cognitive Profiles in Alzheimer’s Disease and in Mild Cognitive Impairment of Different Etiologies. Dement Geriatr Cogn Disord. 2006;21(5–6):309–315. 10.1159/000091522 [DOI] [PubMed] [Google Scholar]
- 28.Schinka JA, Loewenstein DA, Raj A, et al. Defining Mild Cognitive Impairment: Impact of Varying Decision Criteria on Neuropsychological Diagnostic Frequencies and Correlates. Am J Geriatr Psychiatry. 2010;18(8):684–691. 10.1097/JGP.0b013e3181e56d5a [DOI] [PMC free article] [PubMed] [Google Scholar]
- 29.Jak AJ, Bondi MW, Delano-Wood L, et al. Quantification of Five Neuropsychological Approaches to Defining Mild Cognitive Impairment. Am J Geriatr Psychiatry. 2009;17(5):368–375. 10.1097/JGP.0b013e31819431d5 [DOI] [PMC free article] [PubMed] [Google Scholar]
- 30.BROOKS BL, IVERSON GL, HOLDNACK JA, FELDMAN HH. Potential for misclassification of mild cognitive impairment: A study of memory scores on the Wechsler Memory Scale-III in healthy older adults. J Int Neuropsychol Soc. 2008;14(03):463–478. 10.1017/S1355617708080521 [DOI] [PubMed] [Google Scholar]
- 31.Busse A, Bischkopf J, Riedel-Heller SG, Angermeyer MC. Mild cognitive impairment: prevalence and incidence according to different diagnostic criteria. Br J Psychiatry. 2003;182(5):449–454. 10.1192/bjp.182.5.449 [DOI] [PubMed] [Google Scholar]
- 32.Reinach SJ, Rizzo M, McGehee DV. Driving with Alzheimer disease: the anatomy of a crash. Alzheimer Dis Assoc Disord. 1997;11 Suppl 1:21–27. http://www.ncbi.nlm.nih.gov/pubmed/9194964. Accessed August 11, 2019. [PubMed] [Google Scholar]
- 33.Rizzo M, Reinach S, McGehee D, Dawson J. Simulated Car Crashes and Crash Predictors in Drivers With Alzheimer Disease. Arch Neurol. 1997;54(5):545–551. 10.1001/archneur.1997.00550170027011 [DOI] [PubMed] [Google Scholar]
- 34.UFOV Assessment Manual, Version 06.20.20118. https://www.visualawareness.com/wp-content/uploads/2019/04/UFOV-Assessment-Manual.pdf.
- 35.Duncan PW, Weiner DK, Chandler J, Studenski S. Functional Reach: A New Clinical Measure of Balance. J Gerontol. 1990;45(6):M192–M197. 10.1093/geronj/45.6.M192 [DOI] [PubMed] [Google Scholar]
- 36.Mathias S, Nayak US, Isaacs B. Balance in elderly patients: the “get-up and go” test. Arch Phys Med Rehabil. 1986;67(6):387–389. http://www.ncbi.nlm.nih.gov/pubmed/3487300. [PubMed] [Google Scholar]
- 37.Simons-Morton B, Lerner N, Singer J. The observed effects of teenage passengers on the risky driving behavior of teenage drivers. Accid Anal Prev. 2005;37:973–982. 10.1016/j.aap.2005.04.014 [DOI] [PubMed] [Google Scholar]
- 38.Bates D, Mächler M, Bolker B, Walker S. Fitting Linear Mixed-Effects Models Using lme4. J Stat Softw. 2015;67(1). 10.18637/jss.v067.i01 [DOI] [Google Scholar]
- 39.Bürkner P-C. brms: An R Package for Bayesian Multilevel Models Using Stan. J Stat Softw. 2017;80(1). 10.18637/jss.v080.i01 [DOI] [Google Scholar]
- 40.Lee SE, Llaneras E, Klauer SG, Sudweeks J. Analyses of Rear-End Crashes and Near-Crashes in the 100-Car Naturalistic Driving Study to Support Rear-Signaling Countermeasure Development.; 2007.
- 41.Sperling R, Mormino E, Johnson K. The Evolution of Preclinical Alzheimer’s Disease: Implications for Prevention Trials. Neuron. 2014;84(3):608–622. 10.1016/j.neuron.2014.10.038 [DOI] [PMC free article] [PubMed] [Google Scholar]
- 42.Cheng H-C, Ulane CM, Burke RE. Clinical progression in Parkinson disease and the neurobiology of axons. Ann Neurol. 2010;67(6):715–725. 10.1002/ana.21995 [DOI] [PMC free article] [PubMed] [Google Scholar]
- 43.Hamzeie R, Savolainen PT, Gates TJ. Driver speed selection and crash risk: Insights from the naturalistic driving study. J Safety Res. November 2017. 10.1016/j.jsr.2017.10.007 [DOI] [PubMed]
- 44.Wilmot CG, Khanal M. Effect of Speed limits on speed and safety: A review. Transp Rev. 1999;19(4):315–329. 10.1080/014416499295420 [DOI] [Google Scholar]
- 45.Wang S, Sharma A. Assessing the Impact of Speed-Limit Reduction near Signalized High-Speed Intersections Equipped with Advance-Warning Flashers. J Transp Eng Part A Syst. 2017;143(6):04017014. 10.1061/JTEPBS.0000035 [DOI] [Google Scholar]
Associated Data
This section collects any data citations, data availability statements, or supplementary materials included in this article.
Supplementary Materials
Supplementary Table S1. Cognitive Tests
Supplementary Table S2. UFOV (Useful Field of View) Tests
Supplementary Figure S1. Driving Routes Visualization of Older Driver Study
Supplementary Figure S2. Nebraska GIS (Geographic Information System) Polyline Shapefile
Supplementary Figure S3. Undesired Trips Example – Making Right Turn at an Intersection
Supplementary Figure S4. Undesired Trips Example – Traffic Accident