

Abstract
Aims:
To further understand clinical and biochemical features, and HLA-DRB1 genotypes, in new cases of diabetes in Sudanese children and adolescents.
Methods:
Demographic characteristics, clinical information, and biochemical parameters (blood glucose, HbA1c, C-peptide, autoantibodies against glutamic acid decarboxylase 65 [GADA] and insulinoma-associated protein-2 [IA-2A], and HLA-DRB1) were assessed in 99 individuals <18 years (y), recently (<18 months) clinically diagnosed with T1D. HLA-DRB1 genotypes for 56 of these Arab individuals with T1D were compared to a mixed control group of 198 healthy Arab (75%) and African (25%) individuals without T1D.
Results:
Mean±SD age at diagnosis was 10.1±4.3y (range 0.7–17.6y) with mode at 9–12y. A female preponderance was observed. Fifty-two individuals (55.3%) presented in diabetic ketoacidosis (DKA). Mean±SD serum fasting C-peptide values were 0.22±0.25 nmol/L (0.66±0.74 ng/mL). 31.3% were autoantibody negative, 53.4% were GADA positive, 27.2% were IA-2A positive, with 12.1% positive for both autoantibodies. Association analysis compared to 198 controls of similar ethnic origin revealed strong locus association with HLA-DRB1 (p<2.4 × 10⁻¹⁴). Five HLA-DRB1 alleles exhibited significant T1D association: three alleles (DRB1*03:01, DRB1*04:02, and DRB1*04:05) were positively associated, while three (DRB1*10:01, DRB1*15:02, and DRB1*15:03) were protective. DRB1*03:01 had the strongest association (odds ratio=5.04, p=1.7×10⁻¹⁰).
Conclusions:
Young Sudanese individuals with T1D generally have similar characteristics to reported European-origin T1D populations. However, they have higher rates of DKA and slightly lower autoantibody rates than reported European-origin populations, and a particularly strong association with HLA-DRB1*03:01.
Keywords: childhood diabetes, Sudan, HLA, autoantibodies, C-peptide
1. Introduction
Diabetes with onset in childhood is predominantly type 1 diabetes (T1D), but various other forms can occur in this age group (1). T1D incidence varies widely across the world; rates are much higher in European- and some Arab-origin populations in comparison to populations from other regions (2). Some of this variance appears to be due to different frequencies of predisposing HLA alleles (1, 3), although and unfortunately, only limited data are available from some populations, including those in Africa. Islet autoantibody positivity rates, as reflected by autoantibodies against beta cell antigens such as glutamic acid decarboxylase 65 (GADA) and Insulinoma-Associated Antigen-2 (IA-2A), are generally elevated in high-incidence countries, but have been reported as substantially lower in clinically diagnosed T1D individuals in nations such as Pakistan and Bangladesh (4, 5). Even in European populations, substantial heterogeneity in autoantibodies and disease phenotypes has been recently reported (6, 7).
Sudan is a lower-middle income country in northern Africa with a population of 40.5 million in 2017 (8). Due to its geographic position, this country has substantial Arab- and African-populations (9). A study published in 2015 demonstrated a moderate T1D incidence (10.1 per 100,000 population per year in 0.5–19 year age range) in Sudan (10). Type 2 diabetes (T2D) has also been reported in Sudanese children and adolescents (11). Given this series of unknowns regarding the pathogenesis and phenotypes of diabetes in Sudan, especially with a contemporaneous mindset, we conducted a study of 99 new or recent-onset individuals of T1D (duration <18 months) in children and adolescents <18 years of age in Khartoum, Sudan for the purpose of investigating demographic, clinical, and biochemical features, as well as HLA-DRB1 alleles.
2. Methods
2.1. Study site
The study was conducted at the Paediatric and Endocrinology Department units at the University of Khartoum and Sudan Childhood Diabetes Center (SCDC) in Khartoum, Sudan (12), where enrolled T1D individuals received care with the support from the Life for a Child Program (13) and other sources. This study was approved by relevant Ethics Committees in Sudan, the United States of America, Australia, and was performed in accordance with the Declaration of Helsinki. Written informed consent was obtained for all individuals as per Ethics Committee requirements prior to enrollment in the study.
2.2. Study participants
During the study period from April 2013 to August 2016, approximately 132 young people <18 years of age were diagnosed with diabetes (defined according to standard World Health Organization (WHO) criteria (14). Determination of the type of diabetes was made by the local investigators according to available clinical features and history, using international recommendations (1). T1D diagnosis required classic symptoms with immediate sustained need for insulin therapy, without features suggesting T2D, monogenic diabetes, maturity-onset diabetes of the young, or secondary causes of diabetes – individuals with other forms of diabetes were excluded from the study. Individuals with T1D who presented in Khartoum but were to be followed-up in regional centres were also excluded, and a few individuals declined consent. After these exclusions, a total of 102 T1D individuals <18 years of age at diagnosis were enrolled. Three individuals provided consent, but subsequently requested that certain study information be excluded, precluding further analysis. Of the 99 individuals diagnosed from April 2013 to August 2016, five (5.1%) were assessed within the first week of diagnosis, 23 (23.2%) from one week to one month, 63 (63.6%) within one to six months, while the remaining 8 (8.1%) were assessed from six to 18 months following diagnosis. This series was not consecutive, but rather one of an opportunistic sampling. Of the 99 T1D individuals, 71 were of Arab ethnicity, 25 of African ethnicity, with ethnic information unavailable for three individuals.
A set of 206 unrelated, non-diabetic control individuals were collected for the HLA genotyping studies. Controls were required to be non-diabetic, unrelated to each other or to any cases, and have both parents born in Sudan. Detailed ancestry information was not collected for each of the control individuals; however, their ethnicity distribution was broadly similar to that of the T1D individuals, i.e., ~75% Arab and ~25% African.
2.3. Demographic data
Date of birth, sex, ethnic group (Arab or African), city, and province of residence at diagnosis, date of diagnosis, as well as distance from and travel time to the centre, were recorded.
2.4. Clinical parameters
The presence of polyuria, polydipsia, weight loss, malnutrition, and ketoacidosis at the time of diagnosis were recorded. Ketoacidosis was defined as per the local clinical definition as the presence of clinical features (tachypnoea, dehydration, confusion, or coma) in combination with marked ketonuria (“Moderate” or higher on dipstick) and elevated blood glucose levels (>11 mmol/L (200 mg/dL)). Facilities for blood gas analysis or ketonemia were cost-prohibitive and therefore, not available. The following information pertaining to diabetes care was also recorded for each individual: date of insulin commencement, number of insulin injections per day, type of insulin used, insulin storage method at home, use of oral hypoglycemic agents, and other medications or treatments. History of other medical conditions and family history were also recorded. Body weight and height were measured by electronic scales and stadiometer, respectively, with individuals wearing no shoes and lightweight clothing. Body Mass Index (BMI) was calculated, and BMI SD scores (SDS) were calculated using the WHO standards for those <5 years of age (15) and for those 5–19 years of age (16), with an SDS of ≥2.0 being regarded as overweight and ≥3.0 as obese.
2.5. Sample collection
Sample collection for HLA genotyping was performed as described previously (17). Briefly, approximately 200μl of peripheral blood from each patient was preserved by mixing with DNAgard® blood (BioMatrica, San Diego, CA), followed by drying for storage and shipment for analysis. For unrelated controls without diabetes, approximately 1 mL of saliva was mixed with 0.5 mL DNAgard® saliva stabilizing reagent (BioMatrica, San Diego, CA) for storage and subsequent shipment for analysis.
2.6. Biochemical parameters and serology
Blood glucose was measured using a Mindray BA-88A analyser (Darnstadt, Germany). HbA1c was determined by nephelometry using a MISPA-I2 meter (Agappe Diagnostics Ltd. Cochin, Kerala, India). Fasting C-peptide, GADA, and IA-2A were measured by ELISA in Khartoum, using commercially available ELISA kits manufactured by (for C-Peptide) Mercodia (Uppsala, Sweden), and (for GADA and IA-2A) IBL (Hamburg, Germany). GADA and IA-2 autoantibodies were considered positive if levels were ≥30 IU/mL based on the standard curve, according to manufacturer’s recommendation. Similar ELISA formats have been challenged in Islet Autoantibody Standardization Programs with comparable sensitivity and specificity to radioimmunoassays(18).
2.7. HLA-DRB1 genotyping
Dried blood from patient samples were reconstituted in 200 μl water, with DNA extracted from patient blood and control saliva samples using QIAamp® blood kits (Qiagen, Hilden, Germany). High-resolution HLA-DRB1 genotyping was performed at the Children’s Hospital Oakland Research Institute in California, USA using two platforms: a 454 GS Junior System (Roche, Basel, Switzerland) and on the MiSeq® instrument (Illumina, San Diego, CA).
For the Roche 454 platform, exon 2 of the DRB1 gene was amplified; amplicons were purified with AMPure beads (Becton Dickinson, Franklin Lakes, USA), quantified using the Quant-iT PicoGreen dsDNA reagent (Life Technologies, Foster City, USA), mixed with capture beads, amplified in an emulsion PCR, and pyrosequenced on the 454 GS Junior instrument. DRB1 genotype calls were assigned with a combination of two customized software packages: Assign™ ATF (Conexio Genomics, Freemantle, Australia) and Sequence COmpilation and REarrangement (SCORE™) software (Graz, Austria) (19).
For the Illumina platform, a two-step amplification strategy was used to amplify exon 2 of DRB1, with first-round primers containing the same locus-specific sequence as that used for the 454-based genotyping. Amplicons were sequenced on an Illumina MiSeq instrument. Genotype calls were assigned using HLA Twin™ software, version 2.1 (Omixon, Budapest, Hungary).
Of the original 99 T1D and 206 control individuals, 25 T1D and 133 control individuals were genotyped with both methods. Of the total 308 samples, 275 (76 T1D individuals and 198 controls) produced high-confidence, good quality DRB1 allele calls. Of the 76 T1D individuals, 56 reported Arab ancestry. Allele calls were reported at two-field (peptide) resolution. All calls were concordant at the two-field level between platforms.
2.8. Statistical analyses
The demographic and clinical data were assessed using Microsoft Excel (Microsoft Corporation, Redmond, USA). The data were assessed for bimodality using likelihood ratio tests for nested finite mixture models. Models were fitted using an Expectation-Maximization algorithm implemented in R 3.3.1 (R Core Team, Vienna, Austria) and with the package ‘mixtools’ (20). Significance was assessed using Wilks’ chi-square approximation and by parametric bootstrap with 1,000 samples. To assess sensitivity to distributional assumptions, the analysis was performed in triplicate, assuming mixtures of Normal, LogNormal, and Gamma populations in turn.
BIGDAWG (21) version 2.3.6 was used perform locus-level (kx2) chi-squared (χ2) tests of heterogeneity and allele-level (2×2) χ2 tests of association between 56 Arab individuals with T1D and 198 control individuals at the HLA-DRB1 locus, at two-field (peptide) level. DRB1 genotype data for 17 African individuals with T1D and 3 individuals of unknown ethnicity were not analyzed. BIGDAWG v2.3.6 combines the set of alleles with expected counts < 5 in either individuals or controls that represent less than 20% of contingency table cells into a common “binned” category for analysis (22), as the χ2 test is invalid when >20% of contingency table cells have expected values < 5(23). As BIGDAWG analysis assumes that case and control individuals belong to the same population, only the 57 Arab individuals with T1D were compared to controls (Table 2); however, because ethnicity (Arab or African) of the controls was unknown, we performed additional association analyses in which 149/198 (75%) of controls were selected randomly 50,000 times and analyzed with the 56 Arab individuals with T1D.
Table 2:
Case–control association analyses for DRB1 alleles in Arab T1D individuals and controls
| DRB1 Allele | Control Frequency (n) | Patient Frequency (n) | OR (95% CI) | p-value | Significance |
|---|---|---|---|---|---|
| 01:02 | 0.033 (13) | 0.018 (2) | 0.54 (0.06–2.42) | 4.09 × 10−01 | NS |
| 03:01 | 0.086 (34) | 0.321 (36) | 5.04 (2.86–8.86) | 1.70 × 10⁻¹⁰ | * |
| 04:01 | 0.01 (4) | 0.027 (3) | 2.7 (0.39–16.16) | 1.81 × 10−01 | NS |
| 04:02 | 0.01 (4) | 0.045 (5) | 4.58 (0.96–23.4) | 1.44 × 10−02 | * |
| 04:03 | 0.028 (11) | 0.018 (2) | 0.64 (0.07–2.98) | 5.57 × 10−01 | NS |
| 04:05 | 0.045 (18) | 0.134 (15) | 3.25 (1.46–7.08) | 7.96 × 10−04 | * |
| 07:01 | 0.073 (29) | 0.098 (11) | 1.38 (0.6–2.96) | 3.86 × 10−01 | NS |
| 08:04 | 0.109 (43) | 0.107 (12) | 0.99 (0.46–1.99) | 9.65 × 10−01 | NS |
| 10:01 | 0.073 (29) | 0.018 (2) | 0.23 (0.03–0.94) | 3.07 × 10−02 | * |
| 11:01 | 0.058 (23) | 0.054 (6) | 0.92 (0.3–2.4) | 8.56 × 10−01 | NS |
| 11:02 | 0.02 (8) | 0 (0) | 0 (0–2.07) | 1.29 × 10−01 | NS |
| 11:04 | 0.033 (13) | 0.018 (2) | 0.54 (0.06–2.42) | 4.09 × 10−01 | NS |
| 13:01 | 0.073 (29) | 0.027 (3) | 0.35 (0.07–1.16) | 7.40 × 10−02 | NS |
| 13:02 | 0.096 (38) | 0.036 (4) | 0.35 (0.09–1) | 4.09 × 10−02 | † |
| 13:03 | 0.04 (16) | 0.018 (2) | 0.43 (0.05–1.88) | 2.54 × 10−01 | NS |
| 15:02 | 0.061 (24) | 0.009 (1) | 0.14 (0–0.88) | 2.56 × 10−02 | * |
| 15:03 | 0.078 (31) | 0 (0) | 0 (0–0.42) | 2.25 × 10−03 | * |
| binned | 0.073 (29) | 0.054 (6) | 0.72 (0.24–1.82) | 4.68 × 10−01 | NS |
| TOTAL | 1 (396) | 1 (112) |
n: Number of observations of each allele; OR: Odds Ratio; CI: Confidence Interval; NS: Not Significant;
Significant;
Significance is questionable given the results of the resampling analyses; Binned: Alleles with low expected counts in subjects or controls were combined into a common category for analysis in BIGDAWG’s “non-strict binning” mode (Supplementary Table 3).
PyPop (v0.8.0) (24) was used to test Hardy-Weinberg equilibrium (HWE) proportions of HLA-DRB1 genotypes in individuals with T1D and controls. Locus-level HWE deviations were tested using Guo and Thompson’s exact method (25). Chen’s method (26, 27) was used to identify individual genotypes deviating significantly from HWE, with a threshold for significance of 0.05.
3. Results
3.1. Demographic data
Forty-two (42.4%) individuals were male and 57 (57.6%) were female. All were Sudanese (born in Sudan of Sudanese parents), with ethnic group information provided for 96/99 of the T1D individuals examined: 26.0% identified themselves as belonging to African ethnic groups while 74.0% identified with Arab or Arab-African mix ethnic groups. There was no discernible seasonal pattern in disease incidence (data not shown). The mean±SD age of diagnosis of T1D was 10.1±4.3 years (range 0.7 – 17.6 years). The median age at diagnosis was 10.3 years, with a mode of onset at 9–12 years (Figure 1). Fifteen individuals (15.2%) were diagnosed at 0–4 years, 33 (33.3%) at 5–9 years, 38 (38.4%) at 10–14 years, and 13 (13.1%) at 15–19 years. Travel information was provided for 78/99 individuals with T1D: 13 (16.7%) travelled <10km to access care, 41 (52.6%) travelled 10–50 km, 7 (9.0%) travelled 50–200 km, and 17 (21.8%) travelled >200km.
Figure 1:
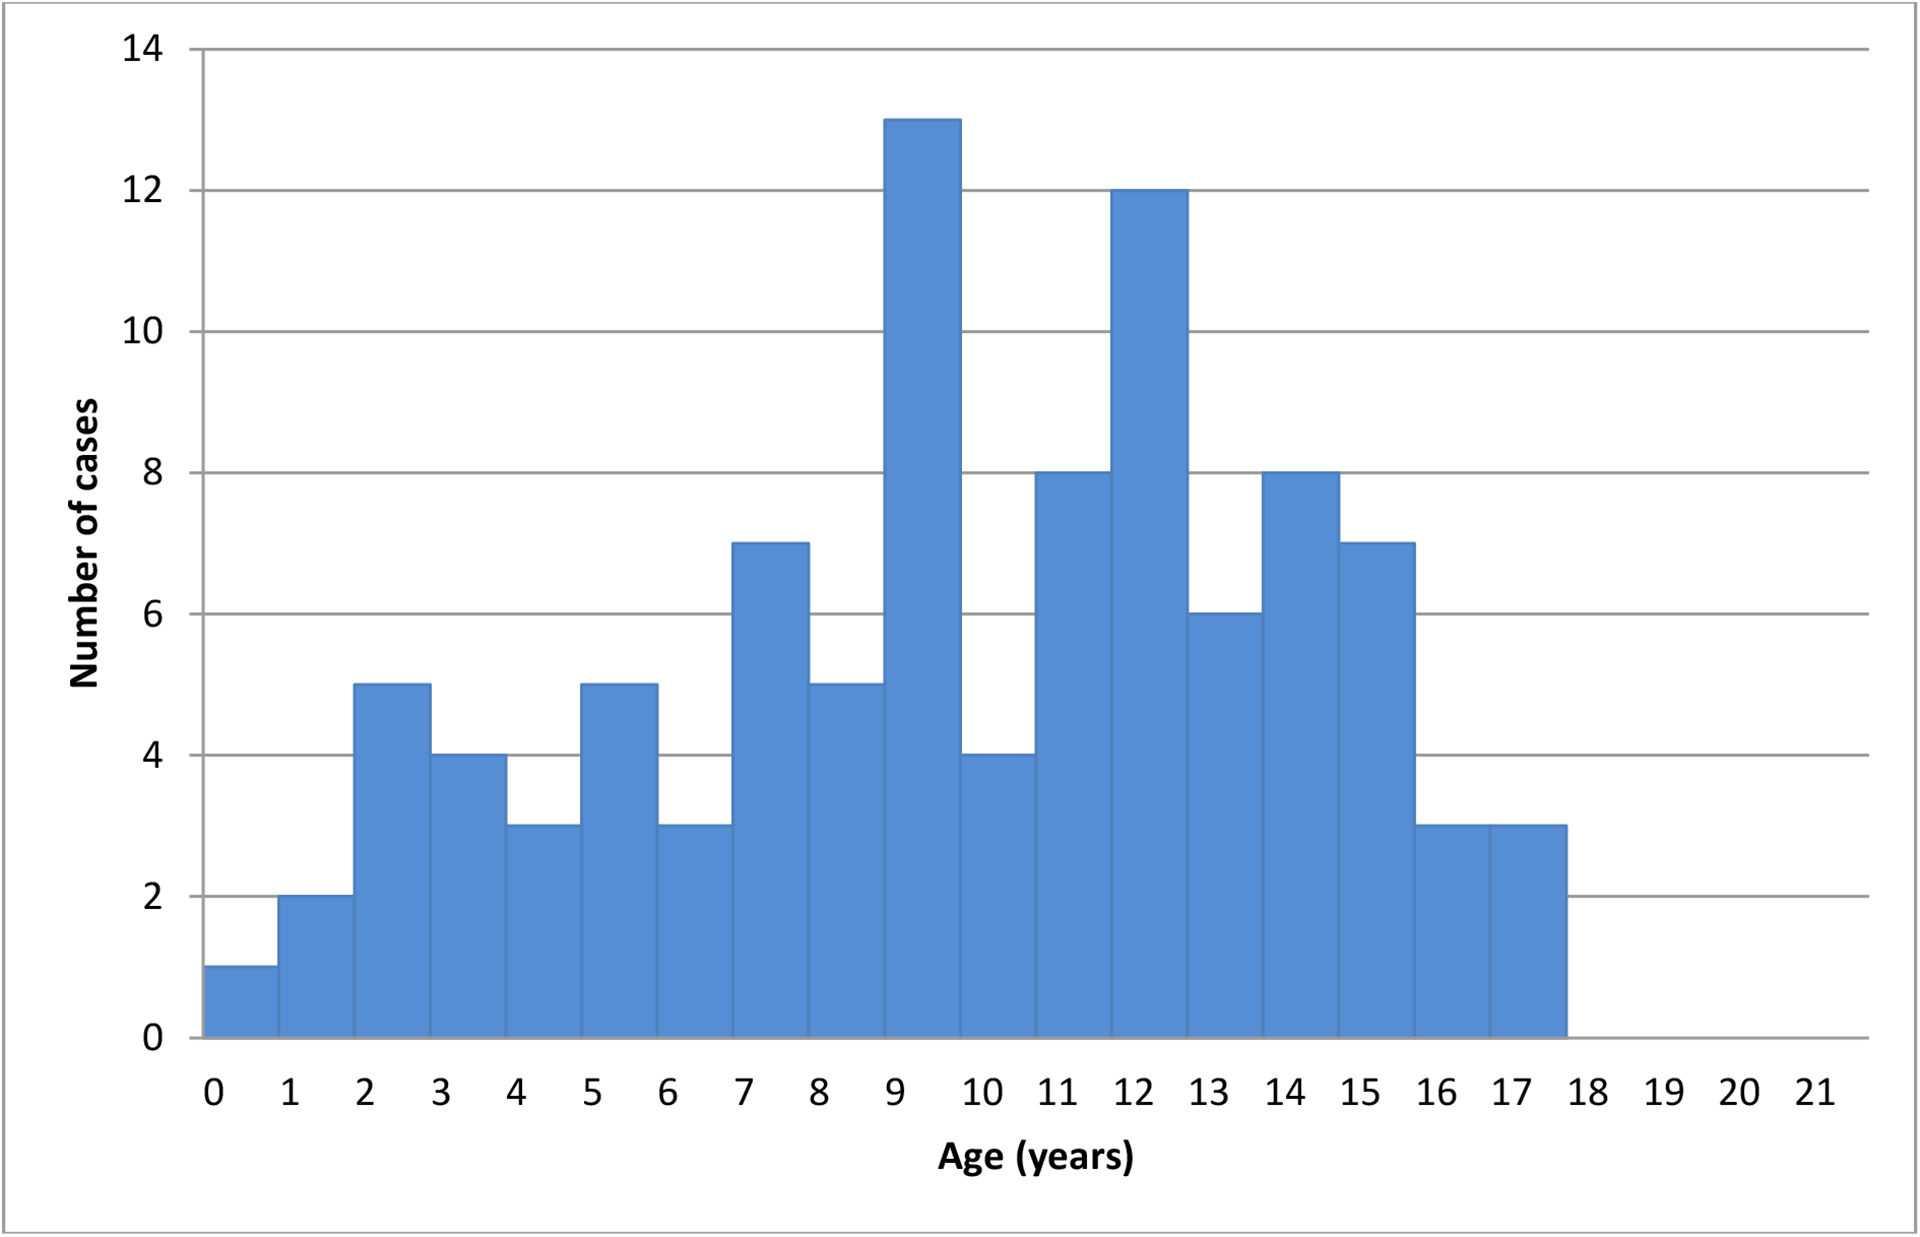
The age of onset of T1D in young people <18 years of age in Sudan.
3.2. Clinical parameters
Clinical features were recorded for 94/99 T1D individuals. The main symptoms preceding diagnosis were polyuria (n=90, 95.7%), polydipsia (n=87, 92.6%) and weight loss (n=69, 73.4%). Fifty-two (55.3%) presented in DKA. Mean BMI SDS was −0.9±2.6 (range −16.8 to 4.1), based on data for 88 individuals. Seven individuals were overweight at diagnosis. All had fasting serum C-peptide ≤0.8 ng/mL (≤0.26 nmol/L), two presented in DKA and three of these had one positive autoantibody. One subject was obese at diagnosis, a boy aged 7 who was GADA positive, and had a C-peptide of 0.66 ng/mL (0.22 nmol/mL) with no DKA. Three individuals had a BMI SDS of <-5.0. Two of these were positive for at least one autoantibody while two presented in DKA and one with malnutrition.
The mean±SD blood glucose (n=77) at diagnosis was 20.2±6.9 mmol/L (364±124 mg/dL), with a range of 11.0–38.9 mmol/L (198–700 mg/dL). The mean±SD HbA1c (n=63) was 10.9±2.7% (95.3±29.5 mmol/mol), with a range of 5.0–16.0% (31.1–151 mmol/mol). Nine T1D individuals (9.1%) had other medical conditions (n=82): three with tonsillitis, one each with anaemia, coeliac disease, neurological disability, epilepsy, nephritis, and an allergy. Family history was available for 95 of the T1D individuals: five (5.1%) had a brother with T1D; 1 (1.0%) had a father with T1D.
Insulin therapy information was available for 97/99 T1D individuals: 80 (82.5%) started on insulin on the same day as diagnosis, 11 (11.3%) started within 1 week, 3 (3.1%) started within 1 month, and 3 (3.1%) started within 2 months. For n=84 T1D individuals, 60 (71.4%) were able to store insulin in a refrigerator at home, with the remaining 24 (28.6%) using a refrigerator outside of the home, ice, or an evaporative cooling device (28).
3.3. C-peptide
Table 1 shows C-peptide results and relationship with autoantibody status. The mean±SD fasting serum C-peptide was 0.66±0.74 ng/mL (0.22±0.25 nmol/L). Sixty-eight (68.7%) T1D individuals had a fasting C-peptide value of <0.8 ng/mL (<0.26 nmol/L), 30 (30.3%) had a C-peptide value between 0.8-<3.1 ng/mL (0.26–1.03 nmol/L), and 1 (1.0%) had a C-peptide value >3.1 ng/mL (>1.03 nmol/L). The single individual with a raised C-peptide was a boy, aged 17.6 years at diagnosis, no DKA on presentation, while positive for both IA-2A and GADA, and fasting serum C-peptide level of 6.0 ng/mL (2.0 nmol/L).
Table 1:
The relationships of C-peptide, and autoantibodies for 99 individuals clinically diagnosed with T1D
| Autoantibody status | |||||
|---|---|---|---|---|---|
| GADA-65 ≥30 (n=53) | IA-2A ≥30 (n=27) | Both autoantibodies (n=12) | Either/both autoantibodies (n=69) | Neither autoantibodies (n=30) | |
| C-peptide <0.8 ng/mL (<0.26 nmol/L) (n=68) | 37 (54.4%) | 20 (29.4%) | 9 (13.2%) | 49 (72.1%) | 19 (27.9%) |
| 1C-peptide 0.8–3.1 ng/mL (0.26–1.03 nmol/L)1 (n=30) | 15 (50.0%) | 6 (20.0%) | 2 (6.7%) | 19 (63.3%) | 11 (36.7%) |
| C-peptide >3.1 ng/mL (>1.03 nmol/L) (n=1) | 1 (100.0%) | 1 (100.0%) | 1 (100.0%) | 1 (100.0%) | 0 (0.0%) |
Normal Range
3.4. Autoantibody results
Twenty-seven (27.2%) individuals were IA-2A positive, 53 (53.5%) were GADA positive, and 12 (12.1%) were positive for both, resulting in 69 (69.7%) who were positive for at least one autoantibody (Table 1). Amongst seropositive individuals, the mean±SD titres were 240.2±198.1 IU/mL for GADA autoantibodies and 146.9±275.8 IU/mL for IA-2A. Supplementary Table 1 shows the age of diagnosis, HLA alleles, BMI SDS, DKA status, C-peptide, and other data on all autoantibody negative subjects.
3.5. Relationship of DKA status to C-peptide and autoantibodies.
With respect to C-peptide, of the 52 individuals who presented in DKA, 38 (73.1%) had a low C-peptide (<0.8 ng/mL (<0.26 nmol/L), and 14 (26.9%) had a C-peptide in the normal range (0.8–3.1 ng/mL (0.26–1.03 nmol/L).
With respect to autoantibodies, of these 52 individuals who presented in DKA, 29 (55.8%) were positive for GADA, 13 (25.0%) for IA2, 8 (15.4%) had both autoantibodies, and 17 (32.7%) were autoantibody negative.
3.6. HLA results
High-confidence, good quality HLA-DRB1 genotypes were generated from 76 T1D and 198 control individuals; however, because of the mixed ethnicity of the whole population, only the larger, Arab group of individuals (n=56) is shown in the disease association analysis (Table 2). The African subgroup of patients was too small for meaningful analysis. DRB1 genotype proportions of both the study and the control individuals comported to HWE expectations. As expected, the DRB1 locus was significantly associated with T1D (p = 2.42 × 10⁻¹⁴). Three alleles, DRB1*03:01, DRB1*04:02, and DRB1*04:05, were positively associated with T1D, with the greatest risk conferred by the DRB1*03:01 allele (Odds Ratio [OR] = 5.04, p = 1.7 × 10⁻¹⁰). In European populations, DRB1*03:01 and DRB1*04 alleles (except DRB1*04:03) are predisposing and are part of the high-risk heterozygous genotype “DR3/DR4” (29). In the Sudanese individuals reported here, DRB1*04:02 (OR = 4.58, p = 1.4 × 10⁻²) and DRB1*04:05 (OR = 3.25, p = 8.0 × 10⁻⁴) were significantly predisposing. DRB1*04:01 and DRB1*04:03 did not exhibit significant association, and the frequency of DRB1*04:04 was too low to be included in the final analysis. Four alleles, including DRB1*10:01, DRB1*13:02, DRB1*15:02, and DRB1*15:03, show significant T1D protection (OR= 0.23, 0.35, 0.14, and 0.00, respectively). However, the result for DRB1*13:02 may be spurious, since it did not remain significant in the resampling analysis. (Supplementary Table 2).
A summary of the resampling analyses are included in Supplementary Table 2, and p-values and ORs for each allele in each replicate are available from the authors upon request. In all 50,000 analyses, the associations for the DRB1*03:01, DRB1*04:02, DRB1*04:05, DRB1*10:01, DRB1*15:02 and DRB1*15:03 alleles are consistent with those reported in Table 2. However, the p-values for the DRB1*13:02 allele in the resampling analyses ranged from 0.006 to 0.451, with a mean 0.050 (Supplementary Table 2). Almost half (46.4%) of the p-values for DRB1*13:02 were not-significant at the 0.05 level, and 37.5% of the resampling analyses had p-values < 4.09E-02. DRB1*13:02 was not associated with T1D in a large fraction of replicates, and initial findings were not validated by resampling analysis, therefore we do not interpret these data as supporting an association between DRB1*1302 and T1D.
3.7. Ethnicity aside from HLA
The rate of autoantibody negativity, the mean C-peptide, and the percent who had DKA were all very similar between the 71 individuals of Arab ethnic groups and the 25 from African groups (Supplementary Table 4).
4. Discussion
This study investigated the clinical, biochemical, and genetic characteristics of recent-onset clinical-diagnosed T1D in children and youth in Sudan. In comparison to European-origin populations, the rate of DKA at onset was high, autoantibody-negative forms (based on testing for two autoantibodies) were more common, and there was a particularly strong association with HLA-DRB1*03:01.
The highest rates of T1D globally occur in Nordic countries (2, 30). However, of the ten countries with the highest T1D incidence, three are now high-income Arab-nations: Kuwait (ranked third at incidence of 41.7 per 100,000 children <15 years of age/year), Saudi Arabia (ranked fifth, incidence of 31.4), and Qatar (ranked eighth, incidence of 28.4) (30). The most recent study from Sudan has data from 2015 and found an incidence of 10.1/100,000 population per year for the 0.5–19 year age group (10). Data from countries in sub-Saharan Africa are much more limited; however, incidences appear to be substantially lower (2, 31). Sudan’s population is around 70% Arab and 30% African in origin (9), similar to the distribution of individuals enrolled in this study, suggesting that T1D incidence does not differ markedly between Arab and African groups in Sudan.
The patterns for clinical presentation and age of T1D onset in this study were similar to those of European populations (3). Such populations sometimes show a slight male preponderance (1). In this study, a female preponderance (male:female ratio = 0.74) was observed, however the Khartoum State study of Saad et al. (10) did not find a gender difference.
The observed rate of DKA at diagnosis of 55.3% is high by international standards (32). However, Elamin et al. (33) reported a rate of 81.2% also in Khartoum, and high rates have been seen in other African studies (31). DKA is a dangerous condition and can be fatal (32, 34) or have long-term sequelae (32). In the current study, high rates of DKA could be explained, at least in part, by lack of recognition of T1D symptoms before onset of DKA due to limited health services outside the capital, with many families travelling long distances to access care.
Most fasting serum C-peptide values were low, consistent with the diagnosis of T1D. The rate of autoantibody positivity was lower than that seen in populations of European-ancestry in Finland and the United States (3, 35, 36); however, zinc transporter-8 autoantibodies (ZnT8A) and insulin autoantibodies (IAA) were not assessed. Even in European T1D populations, autoantibody-negative rates (for up to five autoantibodies) range up to 7.9% (36). In comparison to Finnish data, GADA positivity was lower (54.4% versus 67.0%), and IA-2A positivity much lower (29.4% versus 76.0%). Two older studies on T1D autoantibodies in Sudanese individuals only evaluated islet-cell antibodies (ICA), with reported positivity rates of 41.7% (37) and 63% (33). A recent study (38) of 81 newly-diagnosed T1D individuals <19 y of age, also from Khartoum, found GADA positivity of 77.5%, IAA of 36.3%, and ZnT8A of 16.3%. IA-2A was not measured.
Analysis of HLA data is complex due to the highly polymorphic nature of the HLA loci. The number of HLA alleles is large, and their individual frequencies are generally low. In addition, HLA frequencies and haplotype combinations vary largely among populations. However, most of the T1D risk effects of HLA-DRB1 alleles in this dataset are consistent with reports from other populations in that DRB1*03:01 and DRB1*04 alleles, with the exception of the T1D-protective DRB1*04:03 allele, are predisposing for T1D. Indeed, the DRB1*03:01 allele appears to have a particularly strong predisposing effect here, as it does in Somalia and Pakistan, where nearly all T1D risk is attributable to DRB1*03:01 (4, 29, 39, 40). In Europeans, risk from DRB1*04:05 is higher than that from DRB1*03:01, exhibiting ORs as high as 11.37 (29). Our data are also consistent with a very early Sudanese study by Magzoub et al. (41), which showed associations with T1D for DR3, DR4, and DRw6 (Dw18).
T1D protection conferred by DRB1*15:xx alleles (sometimes referred to as “DR2”) is apparent in this Sudanese population, which represents a unique opportunity to observe effects of DRB1*15:02 and DRB1*15:03 alleles in the same sample set. In populations of European ancestry, the common DR2 allele is DRB1*15:01, which is also highly protective for T1D, but too rare to assess in our Sudanese cohort. Overall, T1D protection from DRB1*15:xx alleles appears to be quite consistent among populations. DRB1*10:01 is not generally associated with T1D but showed marginal significance for T1D protection in these data. The observed DRB1*13:02 protective effect was not replicated in the resampling analyses. Unlike the other T1D-associated alleles observed in these data, which are found only in one or a few haplotypic combinations, DRB1*13:02 can be found in numerous DR-DQ haplotypes, especially in non-European populations. These DRB1*13:02 haplotypes can have either predisposing or protective T1D associations (39). The true effects of DRB1*10:01 and DRB1*13:02 will become more clear with both replication studies and genotyping of additional loci, particularly HLA-DQA1 and HLA-DQB1.
Although few reports are available on the HLA genetics of T1D susceptibility in African populations, comparison of our Sudanese data with a recent study from Ethiopia (42) underscores the fact that geographical proximity does not necessarily correlate with genetic risk factors. Individuals in the Ethiopian study were from the Amhara ethnic group, recruited in or near Gondar, which is only 765km from Khartoum, Sudan. The Amhara speak a Semitic language and have many western-Eurasian features; however, the low-resolution genotyping data from the Amhara do not show the unusually strong effect of DRB1*03:01. In the Ethiopian data, the magnitude of risk conferred by DRB1*03:01 and DRB1*04:xx were similar, with the DRB1*04:xx effect being slightly stronger.
The current study has a few limitations. The ethnic distribution of the source population in and around Khartoum may not be reflective of the whole country; however, the ethnic distribution of our sample set was consistent with previous reports. In addition, although both T1D individuals and control individuals demonstrated HWE, separate analysis of Arab and African T1D and control subsets would be preferable if resources were available. To at least partially address the uncertainty in the ethnic composition of the control individuals, we applied a resampling approach confirming the initial associations for all alleles except DRB1*13:02. The series was not a consecutive enrolment and, therefore, may not fully represent the whole clinic population. Funding constraints limited the number of autoantibodies that could be measured, and limited the HLA analysis to DRB1. It is possible that one or more autoantibody-negative individuals has MODY or T2D. Monogenic diabetes (43) does occur in Sudan; cases of TRMA (thiamine-resistant megaloblastic anaemia) syndrome have been reported (44), and other genetically-confirmed types have been observed at the Sudanese Childhood Diabetes Centre (SCDC) (unpublished observations). T2D has also been reported in children and adolescents in Sudan (11).
Measurement of ZnT8A and IAA, with the latter requiring blood sampling prior to initiation of exogenous insulin therapy, may reveal more autoantibody-positive cases (1,3, 38), and further genetic studies could uncover other gene associations, both within and outside HLA. Fasting serum C-peptide was also only measured on a single occasion.
In conclusion, the clinical, biochemical, and genetic characteristics of T1D in youth in this Sudanese study population were generally similar to those seen in European populations, with some differences in HLA. Further work is needed in Sudan to reduce the rate of DKA, and also to determine current nationwide T1D incidence and prevalence.
Supplementary Material
Acknowledgements
The authors thank Angela Middlehurst for helping with the ethics application, Sara Williams and Amanda Posgai for aid in composing the manuscript, Sarah Garnett for the BMI SD data, and Jayanthi Maniam for help with manuscript submission. We appreciate the support of IBL and Mercodia, who provided the ELISA kits at a reduced cost. This study was partly funded by the Leona M. and Harry B. Helmsley Charitable Trust, and was supported by National Institutes of Health (NIH) National Institute of Allergy and Infectious Disease (NIAID) grant R01AI128775 (SM). The content is solely the responsibility of the authors and does not necessarily reflect the official views of the Leona M. and Harry B. Helmsley Charitable Trust, NIAID, NIH, or United States Government.
Footnotes
Conflicts of interest
No potential conflicts of interest relevant to this article were reported.
References
- 1.Mayer-Davis EJ, Kahkoska AR, Jefferies C, Dabelea D, Balde N, Gong CX et al. ISPAD Clinical Practice Consensus Guidelines 2018: Definition, epidemiology, and classification of diabetes in children and adolescents. Pediatr Diabetes. 2018;19(Suppl 27):7–19. [DOI] [PMC free article] [PubMed] [Google Scholar]
- 2.Patterson CC, Karuranga S, Salpea P, Saeedi P, Dahlquist G, Soltesz G, Ogle GD. IDF Diabetes Atlas: Worldwide estimates of incidence, prevalence and mortality of Type 1 Diabetes in children and adolescents: Results from the International Diabetes Federation Diabetes Atlas. Diabetes Res Clin Pract 2019; 157:107842. [DOI] [PubMed] [Google Scholar]
- 3.Katsarou A, Gudbjörnsdottir S, Rawshani A, Dabelea D, Bonifacio E, Anderson BJ, et al. Type 1 diabetes mellitus. Nat Rev Dis Primers. 2017. March 30;3:17016. doi: 10.1038/nrdp.2017.16. [DOI] [PubMed] [Google Scholar]
- 4.Fawwad A, Govender D, Ahmedani MY, Basit A, Lane JA, Mack SJ et al. Clinical features, biochemistry, HLA-DRB1 status in youth-onset type 1 diabetes in Pakistan. Diabetes Res Clin Pract. 2019. March;149:9–17. doi: 10.1016/j.diabres.2019.01.023. Epub 2019 Jan 30. [DOI] [PMC free article] [PubMed] [Google Scholar]
- 5.Zabeen B, Govender D, Hassan Z, Noble JA, Lane JA, Mack SJ et al. Clinical features, biochemistry and HLA-BR1 status in children and adolescents with diabetes in Dhaka, Bangladesh. Diabetes Res Clin Pract 2019; 158:107894. [DOI] [PMC free article] [PubMed] [Google Scholar]
- 6.Ilonen J, Lempainen J, Hammais A, Laine A-P, Härkönen T, Toppari J et al. Primary islet autoantibody at initial seroconversion and autoantibodies at diagnosis of type 1 diabetes as markers of disease heterogeneity. Pediatr Diabetes 2018;19:284–292. [DOI] [PubMed] [Google Scholar]
- 7.Battaglia M, Ahmed S. Anderson MS, Atkinson MA, Becker D, Bingley PJ et al. Introducing the endotype concept to address the challenge of disease heterogeneity in type 1 diabetes. Diabetes 2020;43:5–12. [DOI] [PMC free article] [PubMed] [Google Scholar]
- 8.The World Bank: Sudan. (2019). Retrieved June 2, 2019 from https://data.worldbank.org/country/sudan.
- 9.World Directory of Minorities and Indigenous Peoples: Sudan. (2018). Retrieved February 10, 2020 from https://minorityrights.org/country/sudan/.
- 10.Saad FM, Mahmoud LA, Ali AMM, Omer IM, Abdullah MA. Incidence and prevalence of type 1 diabetes mellitus in children and adolescents aged 6 months-19 years in Khartoum State, Sudan. Sudan J Paediatr. 2020;20(2):163–169. doi: 10.24911/SJP.106-1587542600. [DOI] [PMC free article] [PubMed] [Google Scholar]
- 11.Osman HAM, Elsadek N, Abdullah M. Type 2 diabetes in Sudanese children and adolescents. Sudanese J Pediatr 2013;13:17–22. [PMC free article] [PubMed] [Google Scholar]
- 12.Sudanese Childhood Diabetes Association. (2020). Retrieved December 10, 2019 from https://www.scda-sudan.org.
- 13.Life for a Child International. (2020). Retrieved December 10, 2019 from https://www.lfacinternational.org.
- 14.World Health Organization, & International Diabetes Federation. (2006). Definition and diagnosis of diabetes mellitus and intermediate hyperglycaemia. Retrieved February 11, 2018, from http://www.who.int/diabetes/publications/Definition%20and%20diagnosis%20of%20diabetes_new.pdf.
- 15.WHO Multicentre Reference Study Group. WHO child growth standards: length/height-for-age, weight-for-age, weight-for-length, weight-for-height and body mass index-for-age: methods and development. Acta Paediatr Suppl. 2006. April;450:76–85.16817681 [Google Scholar]
- 16.de Onis M, Onyango AW, Borghi E, Siyam A, Nishida C, Siekmann J. Development of a WHO growth reference for school-aged children and adolescents. Bull World Health Organ. 2007. September;85(9):660–7. [DOI] [PMC free article] [PubMed] [Google Scholar]
- 17.Ahmadov GA, Govender D, Atkinson MA, Sultanova RA, Eubova AA, Wasserfall CH, et al. (2018). Epidemiology of childhood-onset type 1 diabetes in Azerbaijan: incidence, clinical features, biochemistry and HLA-DRB1 status. Diabetes Res Clin Pract. 2018 October;144:252–259. doi: 10.1016/j.diabres.2018.09.009. Epub 2018 Sep 13. [DOI] [PMC free article] [PubMed] [Google Scholar]
- 18.Wasserfall C, Montgomery E, Yu L, Michels A, Gianani R, Pugliese A, Nierras C, Kaddis JS, Schatz DA, Bonifacio E, Atkinson MA. Validation of a Rapid Type 1 Diabetes Autoantibody Screening Assay for Community Based Screening of Organ Donors to Identify Subjects at Increased Risk for the Disease. Clin Exp Immunol. 2016. 185(1):33–41. [DOI] [PMC free article] [PubMed] [Google Scholar]
- 19.Helmberg W, Lanzer G, Zahn R, Weinmayr B, Wagner T, Albert E. Virtual DNA analysis – a new tool for combination and standardised evaluation of SSO, SSP and sequencing-based typing results. Tissue Antigens. 1998. June;51(6):587–92. [DOI] [PubMed] [Google Scholar]
- 20.Benaglia T, Chauveau D, Hunter DR, Young D. mixtools: An R package for analysing finite mixture models. J Stat Softw 2009;32:1–29. [Google Scholar]
- 21.Pappas DJ, Marin W, Hollenbach JA, Mack SJ. Bridging ImmunoGenomic Data Analysis Workflow Gaps (BIGDAWG): An integrated case-control analysis pipeline. Hum Immunol. 2016. March;77(3):283–287. [DOI] [PMC free article] [PubMed] [Google Scholar]
- 22.Hollenbach JA, Mack SJ, Thomson G, Gourraud PA. Analytical methods for disease association studies with immunogenetic data. Methods Mol Biol. 2012;882:245–66. [DOI] [PMC free article] [PubMed] [Google Scholar]
- 23.Yates DS, Moore DS, McCabe GP (1998). The Practice of Statistics. Macmillan; (New York, USA: ). [Google Scholar]
- 24.Lancaster AK, Single RM, Solberg OD, Nelson MP, Thomson G. PyPop update--a software pipeline for large-scale multilocus population genomics. Tissue Antigens. 2007. April;69 Suppl 1:192–7. [DOI] [PMC free article] [PubMed] [Google Scholar]
- 25.Guo SW, Thompson EA. Performing the exact test of Hardy-Weinberg proportion for multiple alleles. Biometrics. 1992. June;48(2):361–72. [PubMed] [Google Scholar]
- 26.Chen JJ, Thomson G. The variance for the disequilibrium coefficient in the individual Hardy-Weinberg test. Biometrics. 1999. December;55(4):1269–72. [DOI] [PubMed] [Google Scholar]
- 27.Chen JJ, Hollenbach JA, Trachtenberg EA, Just JJ, Carrington M, Rønningen KS et al. Hardy-Weinberg testing for HLA class II (DRB1, DQA1, DQB1, and DPB1) loci in 26 human ethnic groups. Tissue Antigens. 1999. December;54(6):533–42. [DOI] [PubMed] [Google Scholar]
- 28.Ogle GD, Abdullah M, Mason D, Januszewski AS, Besançon S. Insulin storage in hot climates without refrigeration: temperature reduction efficacy of clay pots and other techniques. Diabet Med. 2016;33:1544–1553. [DOI] [PubMed] [Google Scholar]
- 29.Erlich H, Valdes AM, Noble J, Carlson JA, Varney M, Concannon P, et al. HLA DR-DQ haplotypes and genotypes and type 1 diabetes risk: analysis of the type 1 diabetes genetics consortium families. Diabetes. 2008. April;57(4):1084–92. [DOI] [PMC free article] [PubMed] [Google Scholar]
- 30.International Diabetes Federation. IDF Diabetes Atlas (9th ed.) Brussels: International Diabetes Federation. (2019). Retrieved January 8 2020from https://diabetesatlas.org/en/resources/. [Google Scholar]
- 31.Piloya-Were T, Sunni M, Ogle GD, Moran A. Childhood diabetes in Africa. Curr Opin Endocrinol Diabetes Obes. 2016. August;23(4):306–11. [DOI] [PubMed] [Google Scholar]
- 32.Wolfsdorf JI, Glaser N, Agus M, et al. Diabetic ketoacidosis and hyperglyemic hyperosmolar state. Pediatr Diabetes. 2018;19 (Suppl 27):15–177. [DOI] [PubMed] [Google Scholar]
- 33.Elamin A, Omer MIA, Tuvemo T. Islet-cell antibodies and endogenous insulin secretion in Sudanese diabetic children. Diabetes Res Clinical Pract 1992;16:91–96. [DOI] [PubMed] [Google Scholar]
- 34.Elamin A, Kheir KM, Tuvemo T. Diabetic ketoacidosis in children in Khartoum City, Sudan. East Afr Med J 1994;71:102–104. [PubMed] [Google Scholar]
- 35.Dabelea D, Pihoker C, Talton JW, D’Agostino RB Jr, Fujimoto W, Klingensmith GJ, et al. Etiological approach to characterization of diabetes type: the SEARCH for Diabetes in Youth Study. Diabetes Care 2011. July;34(7):1628–33. [DOI] [PMC free article] [PubMed] [Google Scholar]
- 36.Knip M, Siljander H, Ilonen J., Simell O, Veijola R. Role of humoral beta-cell autoimmunity in type 1 diabetes. Pediatr Diabetes 2016. (Suppl 22):17–24. [DOI] [PubMed] [Google Scholar]
- 37.Magzoub MMA, Abdel-Hameed AA, Bottazzo GF. Prevalence of islet cell and thyrogastric autoantibodies in Sudanese patients with type 1 diabetes. Diabetic Medicine 1994;188–192. [DOI] [PubMed] [Google Scholar]
- 38.Rabab MY, Urwa H, Abdullah MA. Pancreatic autoantibodies in Sudanese children with newly diagnosed type 1 diabetes mellitus. Int J Diabetes Clin Res 6:107. 10.23937/2377-3634/1410107. [DOI] [Google Scholar]
- 39.Noble JA, Johnson J, Lane JA, and Valdes AM (2013). HLA class II genotyping of African American type 1 diabetic patients reveals associations unique to African haplotypes. Diabetes 62, 3292–3299. [DOI] [PMC free article] [PubMed] [Google Scholar]
- 40.Sunni M, Noble JA, Yu L, Mahamed Z, Lane JA, Dhunkal AM, et al. Predominance of DR3 in Somali children with type 1 diabetes in the twin cities, Minnesota. Pediatr Diabetes. 2017. March;18(2):136–142. [DOI] [PubMed] [Google Scholar]
- 41.Magzoub MM, Stephens HA, Gale EA, Bottazzo GF. Analysis of HLA-DR and -DQ gene polymorphisms in Sudanese patients with type 1 (insulin-dependent) diabetes. Immunogenetics. 1991;34:366–371. [DOI] [PubMed] [Google Scholar]
- 42.Balcha SA, Demisse AG, Misra R, Vartak V, Cousminer DL, Hodge KM. Type 1 diabetes in Africa: An immunogenetic study in the Amhara of northern Ethiopia. Diabetologia 2000; 10.1007/s00125-020-05229-x [DOI] [PMC free article] [PubMed] [Google Scholar]
- 43.Hattersley AT. Greeley SAW, Polak M, Rubio-Cabezas O, Njølstad PR, Mlynarski W et al. The diagnosis and management of monogenic diabetes in children. Pediatr Diabetes 2018;19(Suppl 27):47–63. [DOI] [PubMed] [Google Scholar]
- 44.Habeb AM, Flanagan SE, Sulali MA, Abdullah MA, Pomahačová R, Boyadzhiev V, et al. Pharmacogenomics in diabetes: outcomes of thiamine therapy in TRMA syndrome. Diabetologia. 2018. May;61(5):1027–1036. doi: 10.1007/s00125-018-4554-x. Epub 2018 Feb 15. [DOI] [PMC free article] [PubMed] [Google Scholar]
Associated Data
This section collects any data citations, data availability statements, or supplementary materials included in this article.