Abstract
Aqueous solubility is one of the most important properties in drug discovery, as it has profound impact on various drug properties, including biological activity, pharmacokinetics (PK), toxicity, and in vivo efficacy. Both kinetic and thermodynamic solubilities are determined during different stages of drug discovery and development. Since kinetic solubility is more relevant in preclinical drug discovery research, especially during the structure optimization process, we have developed predictive models for kinetic solubility with in-house data generated from 11,780 compounds collected from over 200 NCATS intramural research projects. This represents one of the largest kinetic solubility datasets of high quality and integrity. Based on the customized atom type descriptors, the support vector classification (SVC) models were trained on 80% of the whole dataset, and exhibited high predictive performance for estimating the solubility of the remaining 20% compounds within the test set. The values of the area under the receiver operating characteristic curve (AUC-ROC) for the compounds in the test sets reached 0.93 and 0.91, when the threshold for insoluble compounds was set to 10 and 50 μg/mL respectively. The predictive models of aqueous solubility can be used to identify insoluble compounds in drug discovery pipeline, provide design ideas for improving solubility by analyzing the atom types associated with poor solubility and prioritize compound libraries to be purchased or synthesized.
Keywords: kinetic solubility, atom typing descriptors, support vector classification (SVC), in silico ADME model, prediction
Introduction:
The fraction of poorly soluble compounds in drug discovery has been increasing over the last few decades. There are many driving forces which can lead to a compound’s poor solubility issue. First, potency-oriented drug discovery puts biological activity on high priority in compound design, synthesis and selection. This entails introducing hydrophobic moieties to improve the binding affinity of a drug molecule, since hydrophobicity is a primary force that redistributes a molecule between aqueous solvent and lipophilic binding pockets in proteins.1 Second, some drug targets, such as protein kinases, possess a flat pocket; while flat compounds with hydrogen bond donors and acceptors are known to stack and crosslink with each other, resulting in poor solubility.2 Third, increasing globularity of a drug molecule by introducing sp3 hybrid carbon atoms can improve solubility, but potentially decreases the synthetic feasibility, thus it is not favored by medicinal chemists.3 Poorly soluble compounds, however, are generally associated with unfavorable properties, such as artificially low bioactivity, erratic in vitro ADMET (absorption, distribution, metabolism, excretion, and toxicity) measurements, low in vivo exposure and oral bioavailability, abnormal PK profile, etc.4 Therefore, compounds with poor solubility should be assigned with low priority status in the development phase, or simply be removed from the drug discovery pipeline.
Solubility is the dissolved concentration of a compound under given solution conditions. Solubility of a compound is largely determined by its molecular structure and experimental conditions. Molecular structure defines the interactions between the solutes and solvent, and solute to solute, which in turn, will determine how much solute will dissolve in the solution at equilibrium. Early studies have concluded the relationship between solubility and physicochemical properties of a solute, such as melting point, lipophilicity (logP), molecular weight, etc.5 The intrinsic solubility can also be calculated from sublimation free energies and hydration free energies with reasonable accuracy.6 However, simplified QSAR (quantitative structure-activity relationship) equations, such as the Yalkowsky General Solubility Equation,5 which were derived from small datasets, are usually associated with limited applicability domain. Whereas theoretical approaches are not only compute-intensive and lack satisfactory accuracy, but also require experimentally determined crystal structures of the solutes.6 On the other hand, data-driven QSAR models achieved tremendous success in predicting physicochemical and ADMET properties,1, 7, 8 including solubility. Due to the profound influence of experimental conditions on measured solubility, compiling solubility datasets from different sources may negatively impact the performance of predictive models due to assay inconsistencies. The primary data resources for published solubility predictive models are two commercial databases AQUASOL and PHYSPROP,9 which are largely collected from literature. It is worth noting that another large solubility dataset has been deposited on to the PubChem (PubChem AID: 1996) by the Burnham Center for Chemical Genomics (BCCG), containing over 57,000 compounds with solubility data measured by using chemiluminescent nitrogen detection (CLND) technique.10 In this study, we determined the kinetic solubility of over 11,000 non-redundant drug-like molecules collected from more than 200 NCATS intramural drug discover projects under the same experimental conditions (i.e. NCATS ADME SOP for Kinetic Solubility Determination), and developed highly predictive models on the basis of this high quality dataset. These predictive models and the solubility dataset can enrich the cheminformatics toolbox for drug discovery in a public domain.
Material and Methods:
Material:
Potassium phosphate monobasic, potassium phosphate dibasic, furosemide, albendazole, phenazopyridine, dimethyl sulfoxide (DMSO) were purchased from Sigma-Aldrich (St. Louis, MO). N-propanol was purchased from Fisher Scientific (Hampton, NH). All test articles (10 mM in DMSO) were provided by NCATS Compound Management. Liquid handling pipette tips (20 μl and 200 μl) were purchased from pION (Billerica, MA). 1.1 mL storage plate (cat #110323), deep well plate (cat #110023), filter plate (cat #110037) and high sensitivity UV plates (cat #110286) were also purchased from pION (Billerica, MA).
Instrumentation:
The intrinsic solubility was determined using a fully automated Freedom EVO 200 robotic system equipped with a 96-channel head, liquid handling system and TeVac system (Tecan, Morrisville, NC) with EVOware software (version 3.5). This entails a fully automated system of sample preparation and sample analysis using UV plate reader, Nano Quant, Infinite® 200 PRO, Tecan Inc. (Männedorf, Switzerland). Data processing was done using μSOL Evolution from pION Inc (version 3.8).
Kinetic Solubility Assay:
Pion’s patented μSOL assay was used for kinetic solubility determination.11–13 In this assay, the classical saturation shake-flask solubility method was adapted as previously described by Avdeef et al., 2001.13 Test compounds were prepared in 10 mM DMSO stock and diluted to a final drug concentration of 150 μM in the aqueous solution (pH 7.4, 100 mM phosphate buffer). Samples were incubated at room temperature for 6 hours and vacuum-filtered using Tecan TeVac to remove any precipitates. The concentration of the compound in the filtrate was measured via UV absorbance (λ: 250–498 nm). The filtrate drug concentration was determined by comparing the fully solubilized reference plate which contains 17 μM of compound dissolved in spectroscopically pure n-propanol. All compounds were tested in duplicates. The kinetic solubility (μg/mL) of compounds was calculated using the μSOL Evolution software. The three experimental controls used were albendazole (low solubility), phenazolpyridine (moderate solubility) and furosemide (high solubility). The solubility of the three control drugs were measured in each of 380 batches. Albendazole was reported with a solubility of < 1 μg/mL in 324 measurements; furosemide with that of > 55 μg/mL in 378 batches; whereas the solubility of phenazolpyridine was recorded as 27.73 ± 4.49 μg/mL.
Dataset:
The organic compounds in the dataset were collected from multiple drug discovery projects in the NCATS with diversified chemical scaffolds. The molecular structures used for the modeling were standardized by stripping salts, removing duplicates, and generating canonical Smiles by using a Pipeline Pilot protocol.14 The final dataset contains 11,780 non-redundant unique compounds with measured solubility values.
Theory and Calculation:
Molecular Descriptors:
The customized atom-type-based molecular descriptors employed to construct the QSAR models in this paper are derived from an atom type casting tree.1 An atom type in a molecule is assigned according to its own chemical property as well as neighboring atoms and bonds, reflecting its chemical environment. In this molecular descriptor system, the architecture of the tree is optimized recursively, in terms of where to further split a branch or where to merge existing branches, in order to maximize the predictive power of log P regression models.1 The optimized molecular descriptors consist of 221 atom types, and 41 correction factors, introduced to capture the whole molecule properties, such as flexibility of the molecule, and the fraction of sp2 hybrid atoms in a molecule, etc.1 A detailed description of each atom type and correction factor can be found in Ref. 1.
Support Vector Machine (SVM):
SVM is an elegant machine learning algorithm that was originally developed to solve binary classification problems.15 The classification application υ-SVC proposed by Schölkopf et al.16 was applied in this study. The parameterization of υ, and the non-linearity parameter in the kernel function of a Gaussian Radial Basis Function (RBF), γ, was accomplished on a grid-based search to minimize the mean standard error (MSE) of 5-fold cross-validation (CV) on the training data. LIB-SVM, a software implementation of SVM developed by Chang and Lin,17 was adopted in this study.
Results and Discussion:
The aqueous solubility dataset generated in this study comprises both qualitative and quantitative data types. More than 56% solubility measurements were reported qualitatively, such as < 1 μg/mL (considered as low aqueous soluble), or > 76 μg/mL (considered as high aqueous soluble). The distribution of the solubility measurements is asymmetric, heavily skewing toward low solubility side (Figure 1). In order to include the qualitative data points in model construction, binary classification was adopted for solubility QSAR modeling.
Figure 1.
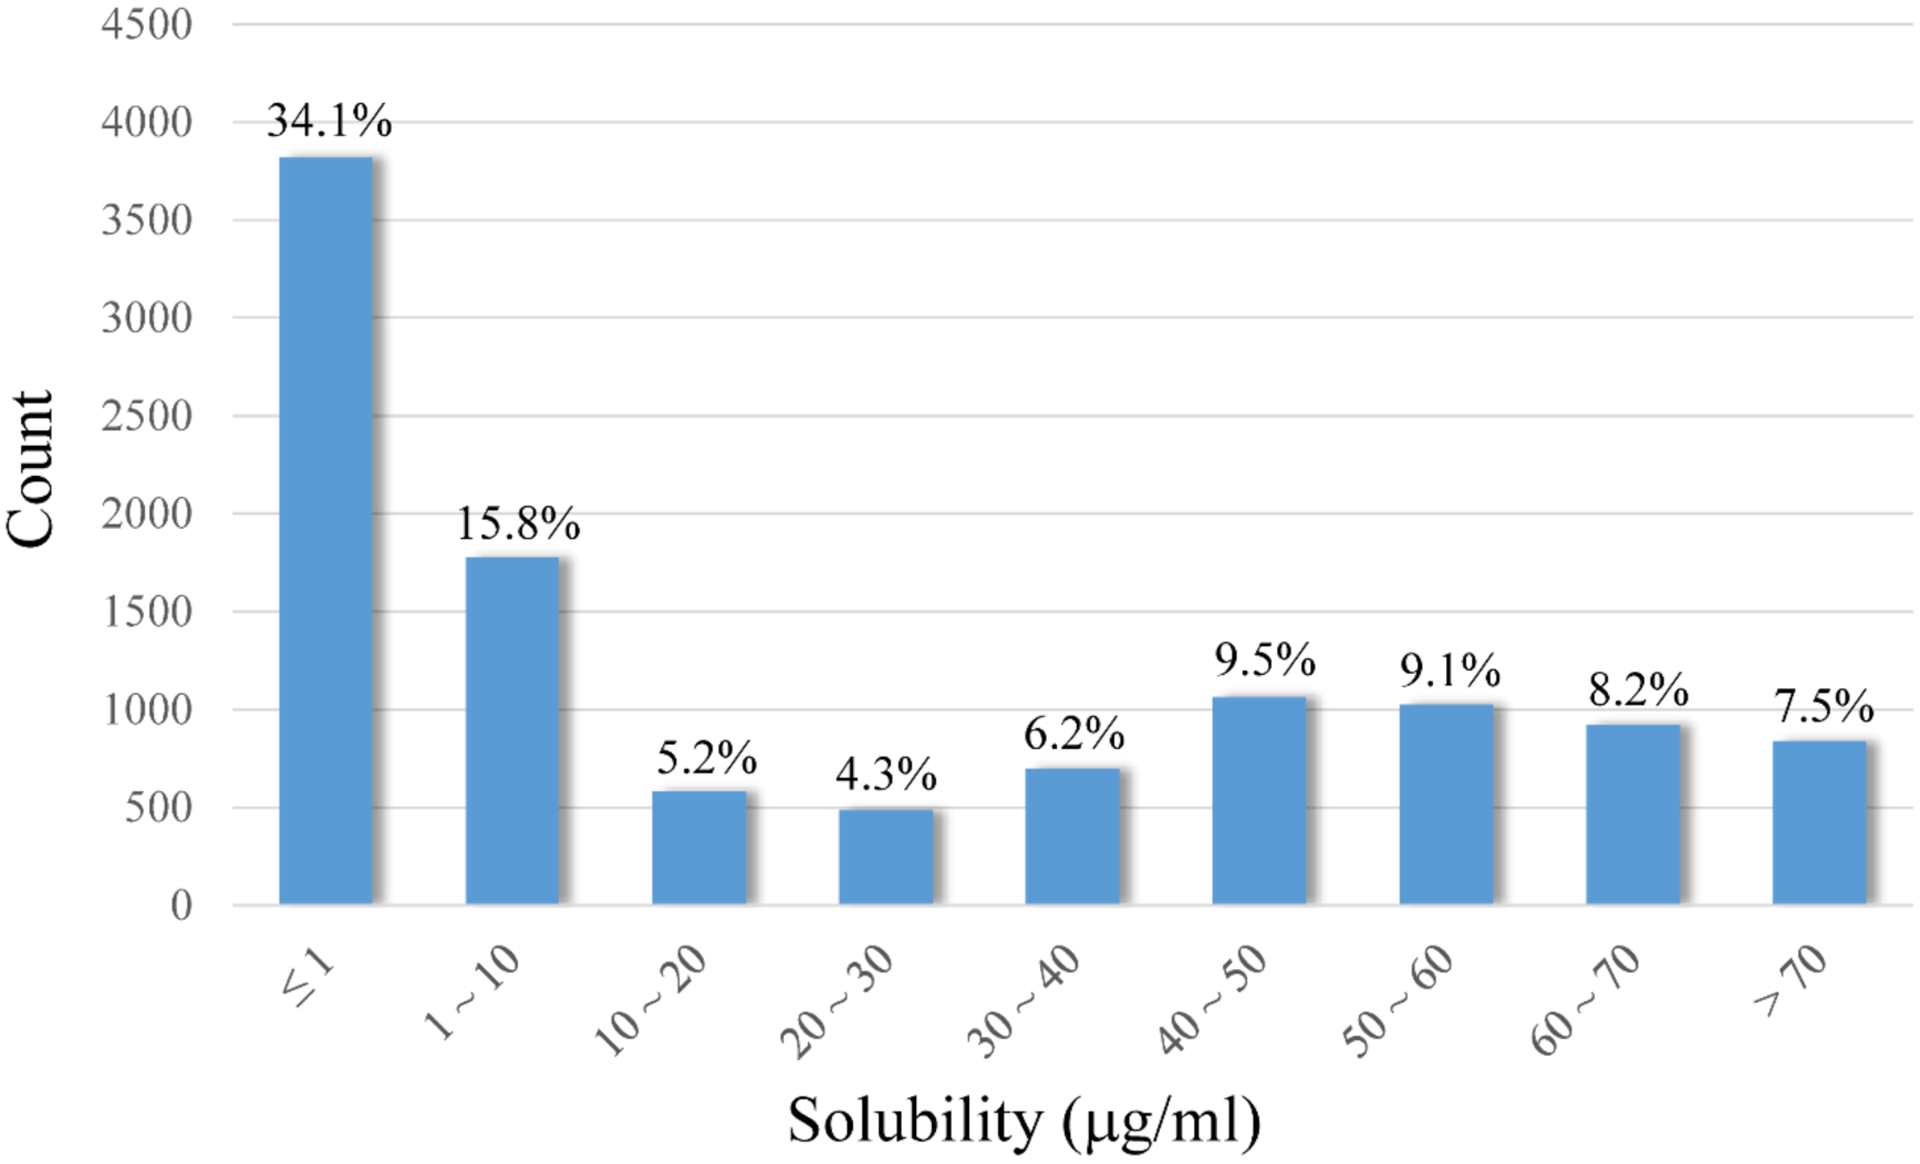
Distribution of all compounds with measured aqueous solubility across the whole dataset.
It is noteworthy that although all compounds were compiled from drug discovery projects, approximately half of the compounds in the dataset are poorly soluble with solubility ≤ 10 μg/mL, among which more than two-thirds have measured solubility ≤ 1 μg/mL (Figure 1). The high percentage of poorly soluble molecules in the dataset led us to reevaluate the drug-likeness of this collection.
The distributions of molecular weight (MW) and logP represent a typical drug-like compound library (Figure 2a and 2b). More than 71% compounds have a MW less than 500 Dalton, while the calculated logP values1 are less than 5.0 for more than 86% compounds. Less than 10% of the compounds in this dataset violate Lipinski’s rule-of-five (RO5) (Figure 2c),18 implying a highly drug-like collection of organic compounds. This observation evidences that current criteria for drug-likeness estimation may not be adequate, since aqueous solubility is not incorporated and it is not simply derivable from other physicochemical properties.
Figure 2.
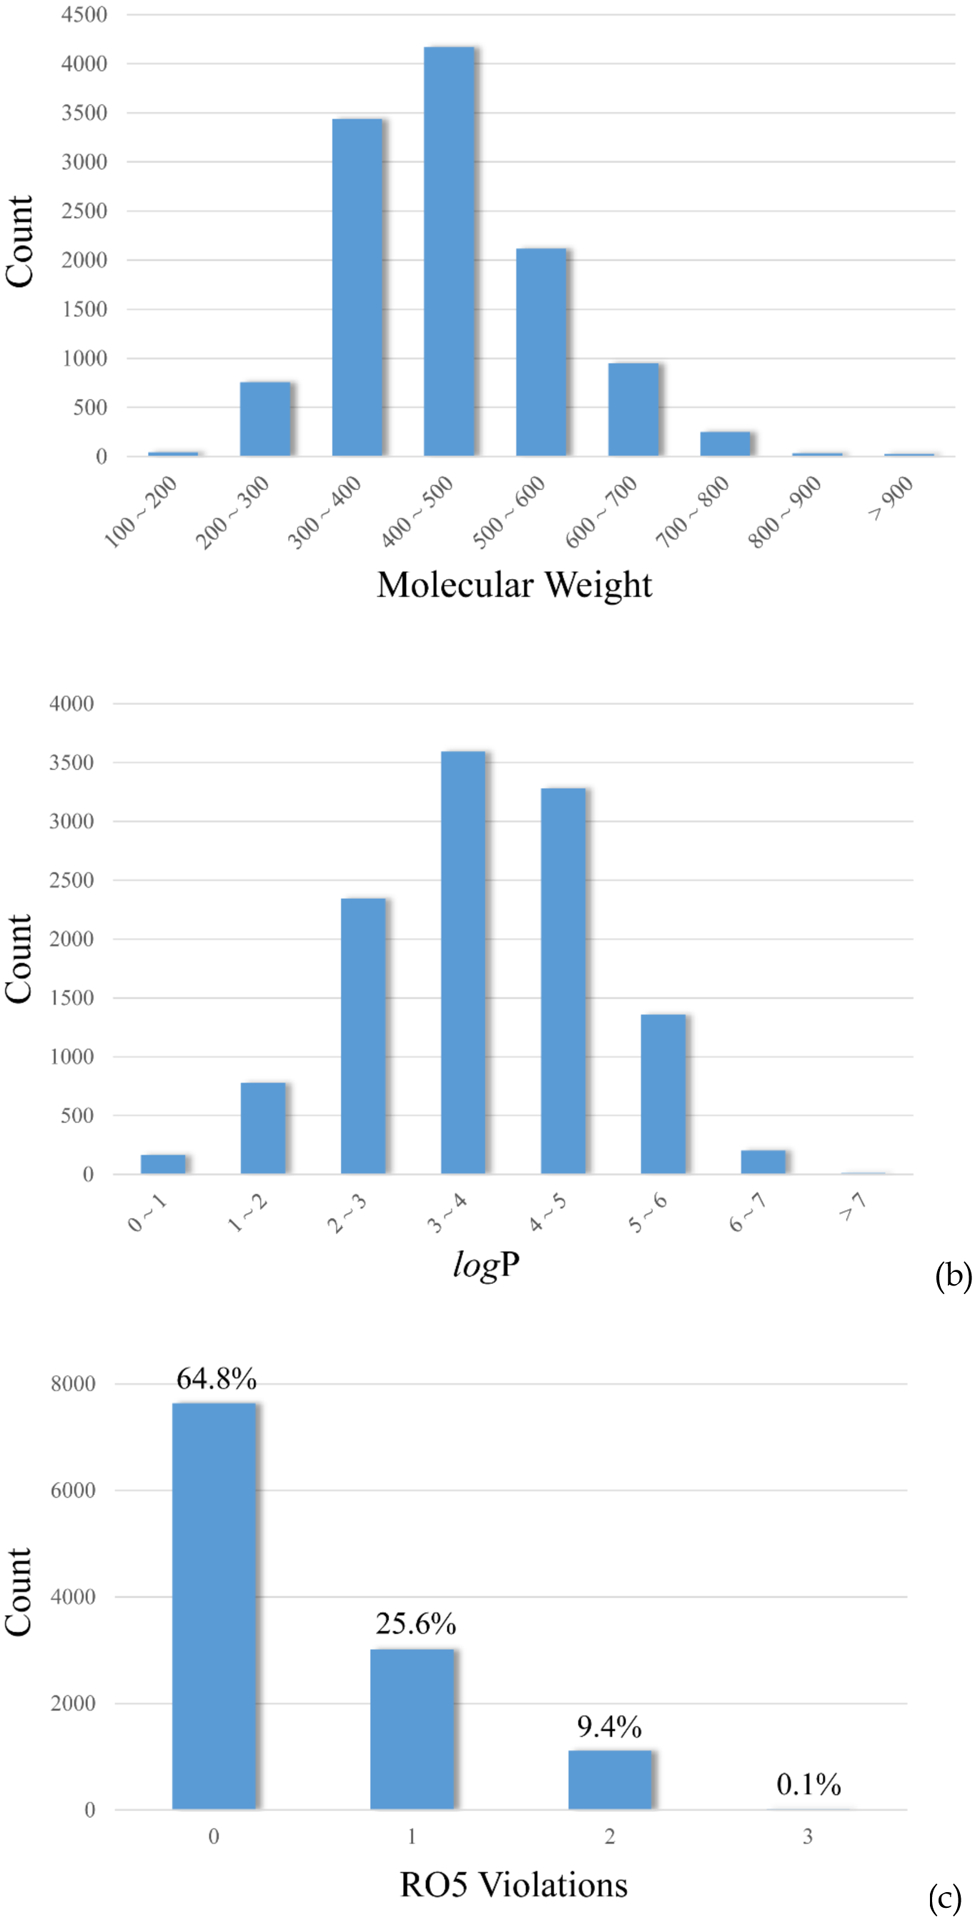
Distributions of (a) molecular weight (MW), (b) calculated logP, and (c) Lipinski’s rule-of five (RO5) violations, across the whole dataset.
The boundary of soluble and insoluble classes is set largely on the consideration of potential solubility issues for human oral absorption.4 Compounds with solubility lower than 10 μg/mL are usually classified as insoluble.9 Selection of this classification criterion resulted in a balanced dataset with 51.1% soluble compounds and is favorable for QSAR modeling. On the other hand, a minimum solubility of 52 μg/mL was suggested for a compound with an average permeability to be completely absorbed.4 Therefore, a second classification threshold of 50 μg/mL was adopted in this study to separate compounds with ideal solubility for drug development. Less than 25%of the dataset fell into the category of highly soluble compounds (Figure 1).
Two SVC models were trained to discriminate between insoluble and highly soluble compounds. The datasets were randomly split into the training (80%) and the testing (20%) sets separately for the two datasets using different cutoffs. The final models built using the optimized parameters and their predictive performance are summarized in Table 1. Both models are highly predictive with AUC-ROC reaching 0.93 and 0.91 respectively. The differences in AUC-ROC and accuracy are partially due to the distribution of the training sets. The first model (Model10) consists of a well-balanced dataset, whereas the second model (Model50) is severely imbalanced. Imbalanced training sets may impact model performance in a negative way, since the minority classes are inadequately represented.19
Table 1.
Summary of the optimized parameters of the SVC models for Model10 and Model50, together with training and test sets information and performance of predictions.
| Cutoff (μg/mL) | Model10 | Model50 |
|---|---|---|
| γ | 0.25 | 0.50 |
| v | 0.25 | 0.25 |
| AUC | 0.93 | 0.91 |
| Accuracy | 0.86 | 0.83 |
| Training set (positive) | 9402 (50.0%) | 9463 (23.2%) |
| Test set (positive) | 2377 (51.2%) | 2316 (23.9%) |
The advantage of utilizing atom types as molecular descriptors is its potential to decipher the chemical meanings of a predictive model. It is of interest to compare the discriminating factors for the two models that recognize insoluble compounds and highly soluble compounds. Of the top 20 atom types and correction factors, twelve are identical for both models. 7 of the top 20 features for Model10 are whole-molecule properties, such as polar surface area (PSA), whereas the number increased to 11 for Model50. The aromatic moieties demonstrate dominant discerning power in Model10 to differentiate insoluble compounds from soluble ones, whereas the existence of acidic and polar moieties top the features that recognize highly soluble compounds (Table 2).
Table 2.
The top 5 atom types and features extracted by feature importance analysis for Model10 and Model50.
| Ranking | Model10 | Model50 |
|---|---|---|
| 1 | aromatic carbon | hydrogen bond acceptor |
| 2 | aromatic hydrogen | acidic hydrogen |
| 3 | acidic hydrogen | polar surface area |
| 4 | fraction of sp2 atoms | hydrogen on sp3 carbon |
| 5 | aromatic acid | fraction of sp2 atoms |
Figure 3 illustrates a clear shift on the counts of hydrogen bond acceptors (HBA) for highly soluble compounds. Nearly 90% of poorly soluble compounds have less than 6 HBAs, while over 80% of highly soluble compounds possess more than 4 HBAs (Figure 3). By increasing HBAs and PSA, and introducing acidic moieties, the aqueous solubility of a drug molecule can effectively be improved. In addition, increment of sp3 hybrid carbon atoms and reduction of fraction of sp2 hybrid atoms are suggested by feature analysis of Model50 in order to achieve high solubility (Table 2).
Figure 3.
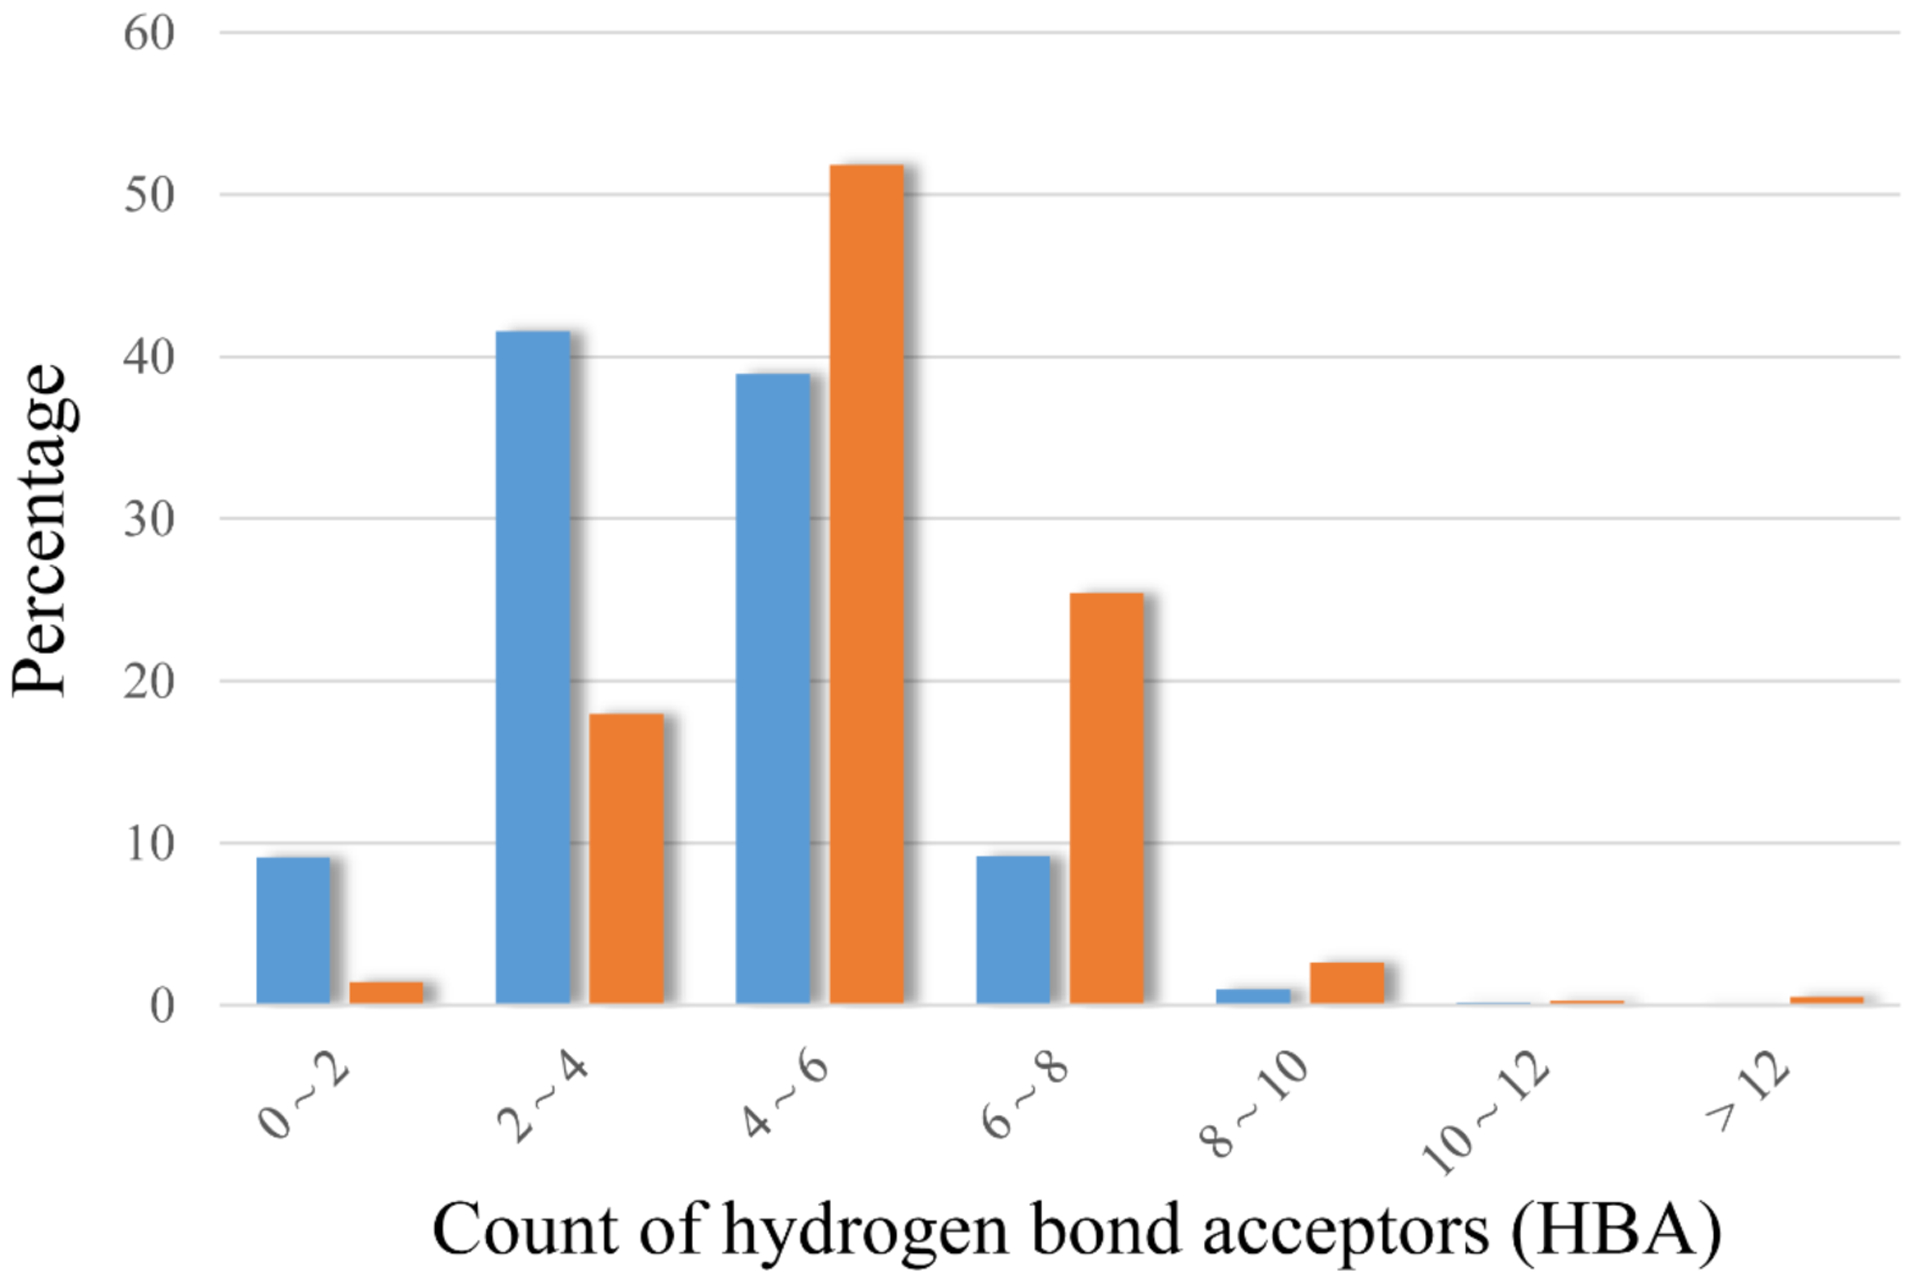
Distributions of the counts of hydrogen bond acceptors (HBA) in highly soluble compounds (colored in orange) and poorly soluble compounds (colored in blue) in Model50.
It has been observed that molecular saturation correlates with solubility in current dataset, which is consistent with what was reported in the literature.2 The fraction of sp2 hybrid atoms in a molecule exhibited high discerning power in both Model10 and Model50 (Table 2). A clear declining trend in percent of soluble compounds was demonstrated for the molecules with increasing fraction of sp2 hybrid atoms, no matter where the cutoff of solubility was set (Figure 4). If the fraction of sp2 hybrid atoms is controlled to under 0.4 in a molecule, the molecule could have more than 86% and 46% possibility of being soluble in Model10 and Model50, respectively.
Figure 4.
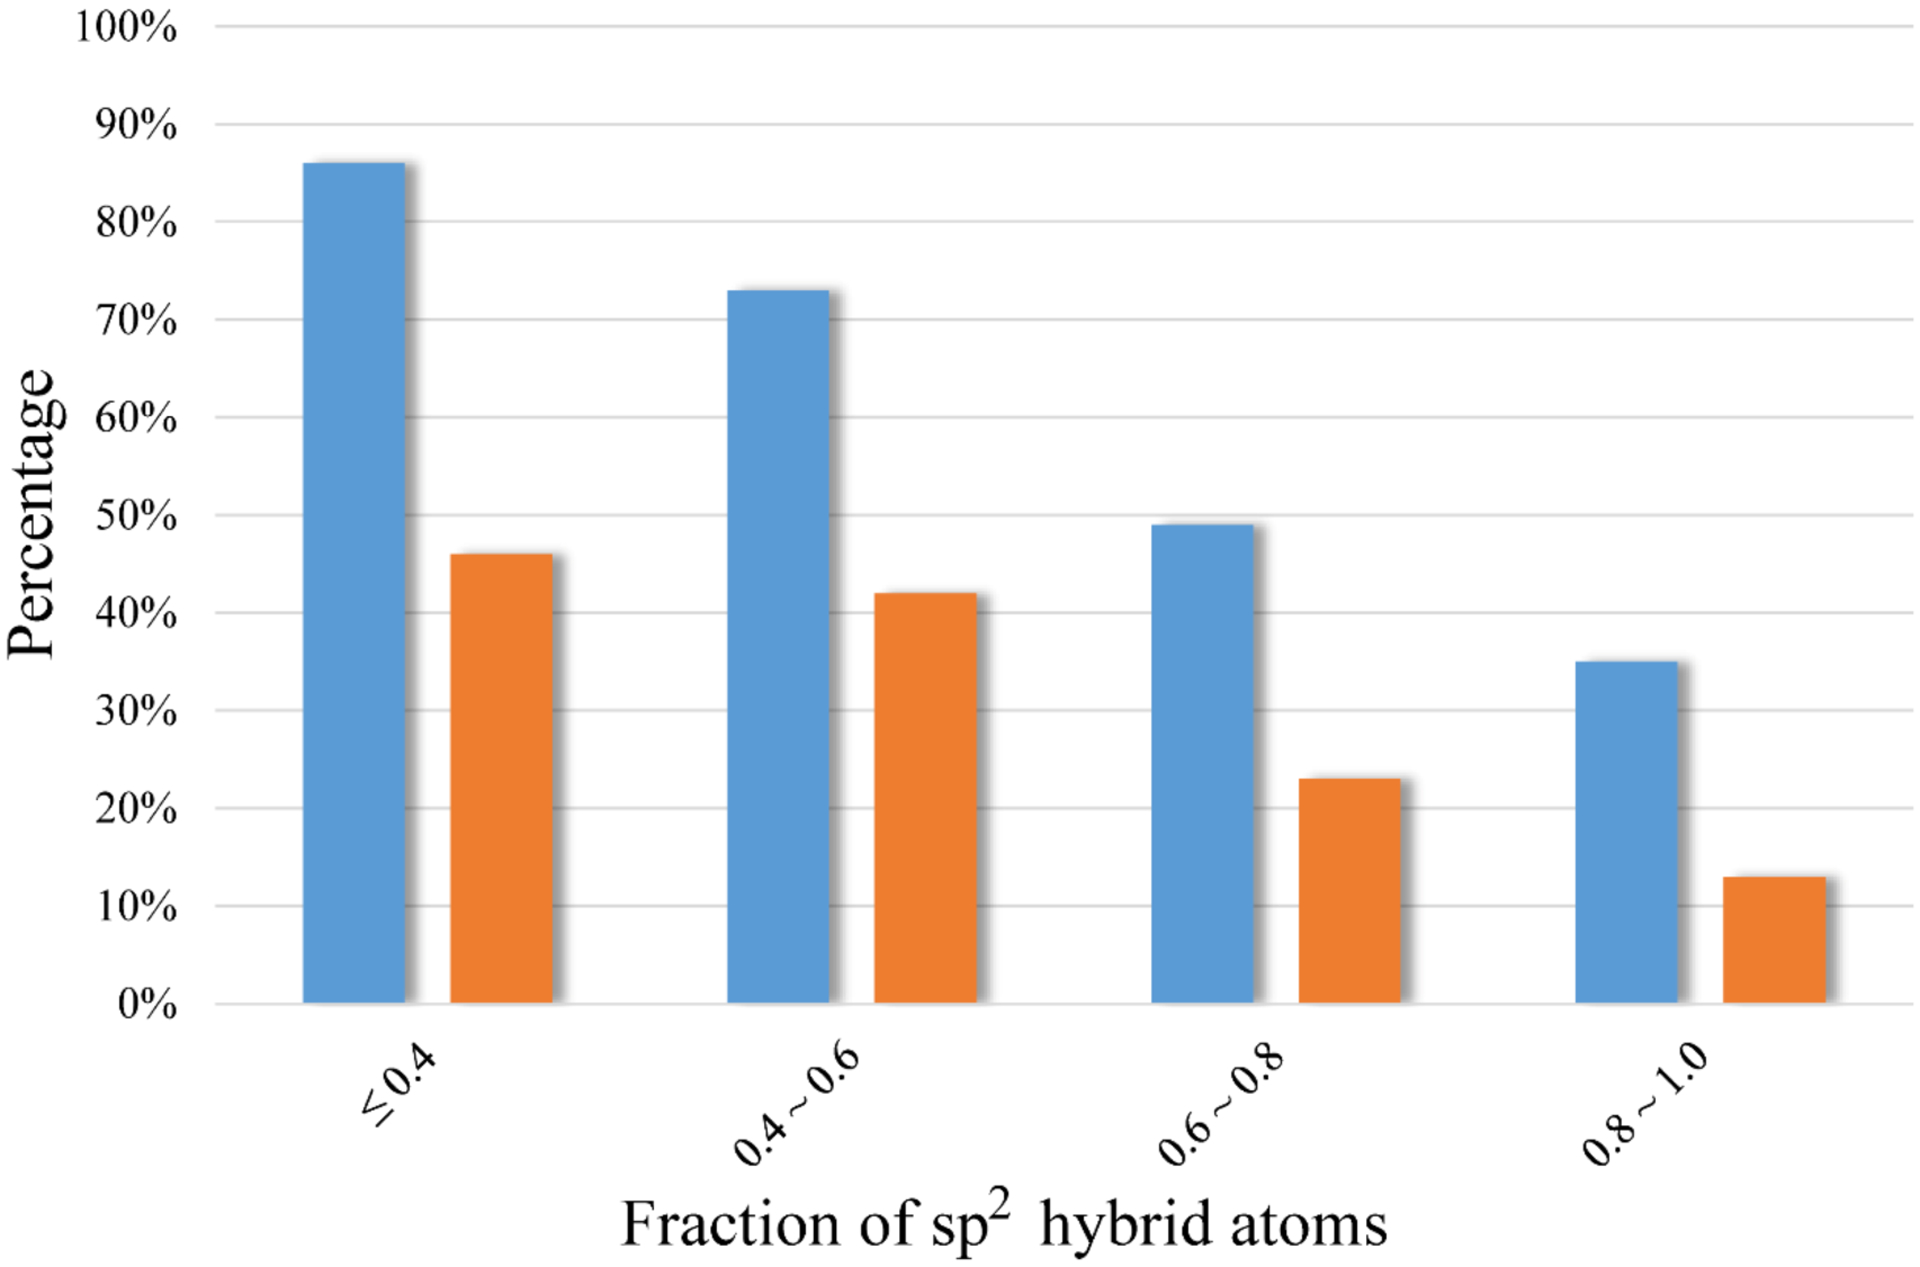
The percentage of soluble compounds decreases with the increasing ratio of sp2 hybrid atoms in a molecule for Model10 (colored in blue) and Model50 (colored in orange).
As previously mentioned, kinase inhibitors tend to have poor solubility partly due to the characteristics of the ATP binding pocket. As a result, tremendous efforts have been made to improve aqueous solubility of these drugs.20 It is of interest to compare the predicted solubility of kinase inhibitors (KIs) and those KIs advanced to clinical trials (KI drug candidates, or KIDCs), in order to investigate whether compounds with better solubility have greater opportunity to advance to clinical trials. Therefore, both Model10 and Model50 solubility models were applied to predict aqueous solubility of two kinase datasets − 4,425 known KIs collected from literature21 and 243 KIDCs22. The predicted probability of a compound being soluble at 10 μg/mL demonstrated different distributions between the two datasets (Figure 5a), yet a more significant difference was observed when the cutoff was set to 50 μg/mL (Figure 5b). There were 41.3% of the KIDCs being predicted as soluble with a probability greater than 80%, representing an 8% increment from the KIs (Figure 5a). On the other hand, a difference of 16% (67.6% vs 51.7%) between the KIs and the KIDCs was estimated for the subsets of the compounds which were least likely being highly soluble (Figure 5b). In both cases, the KIs with higher solubility showed better opportunity to enter clinical trials, indicating that solubility is one of the determining factor to the success of KIs.
Figure 5.
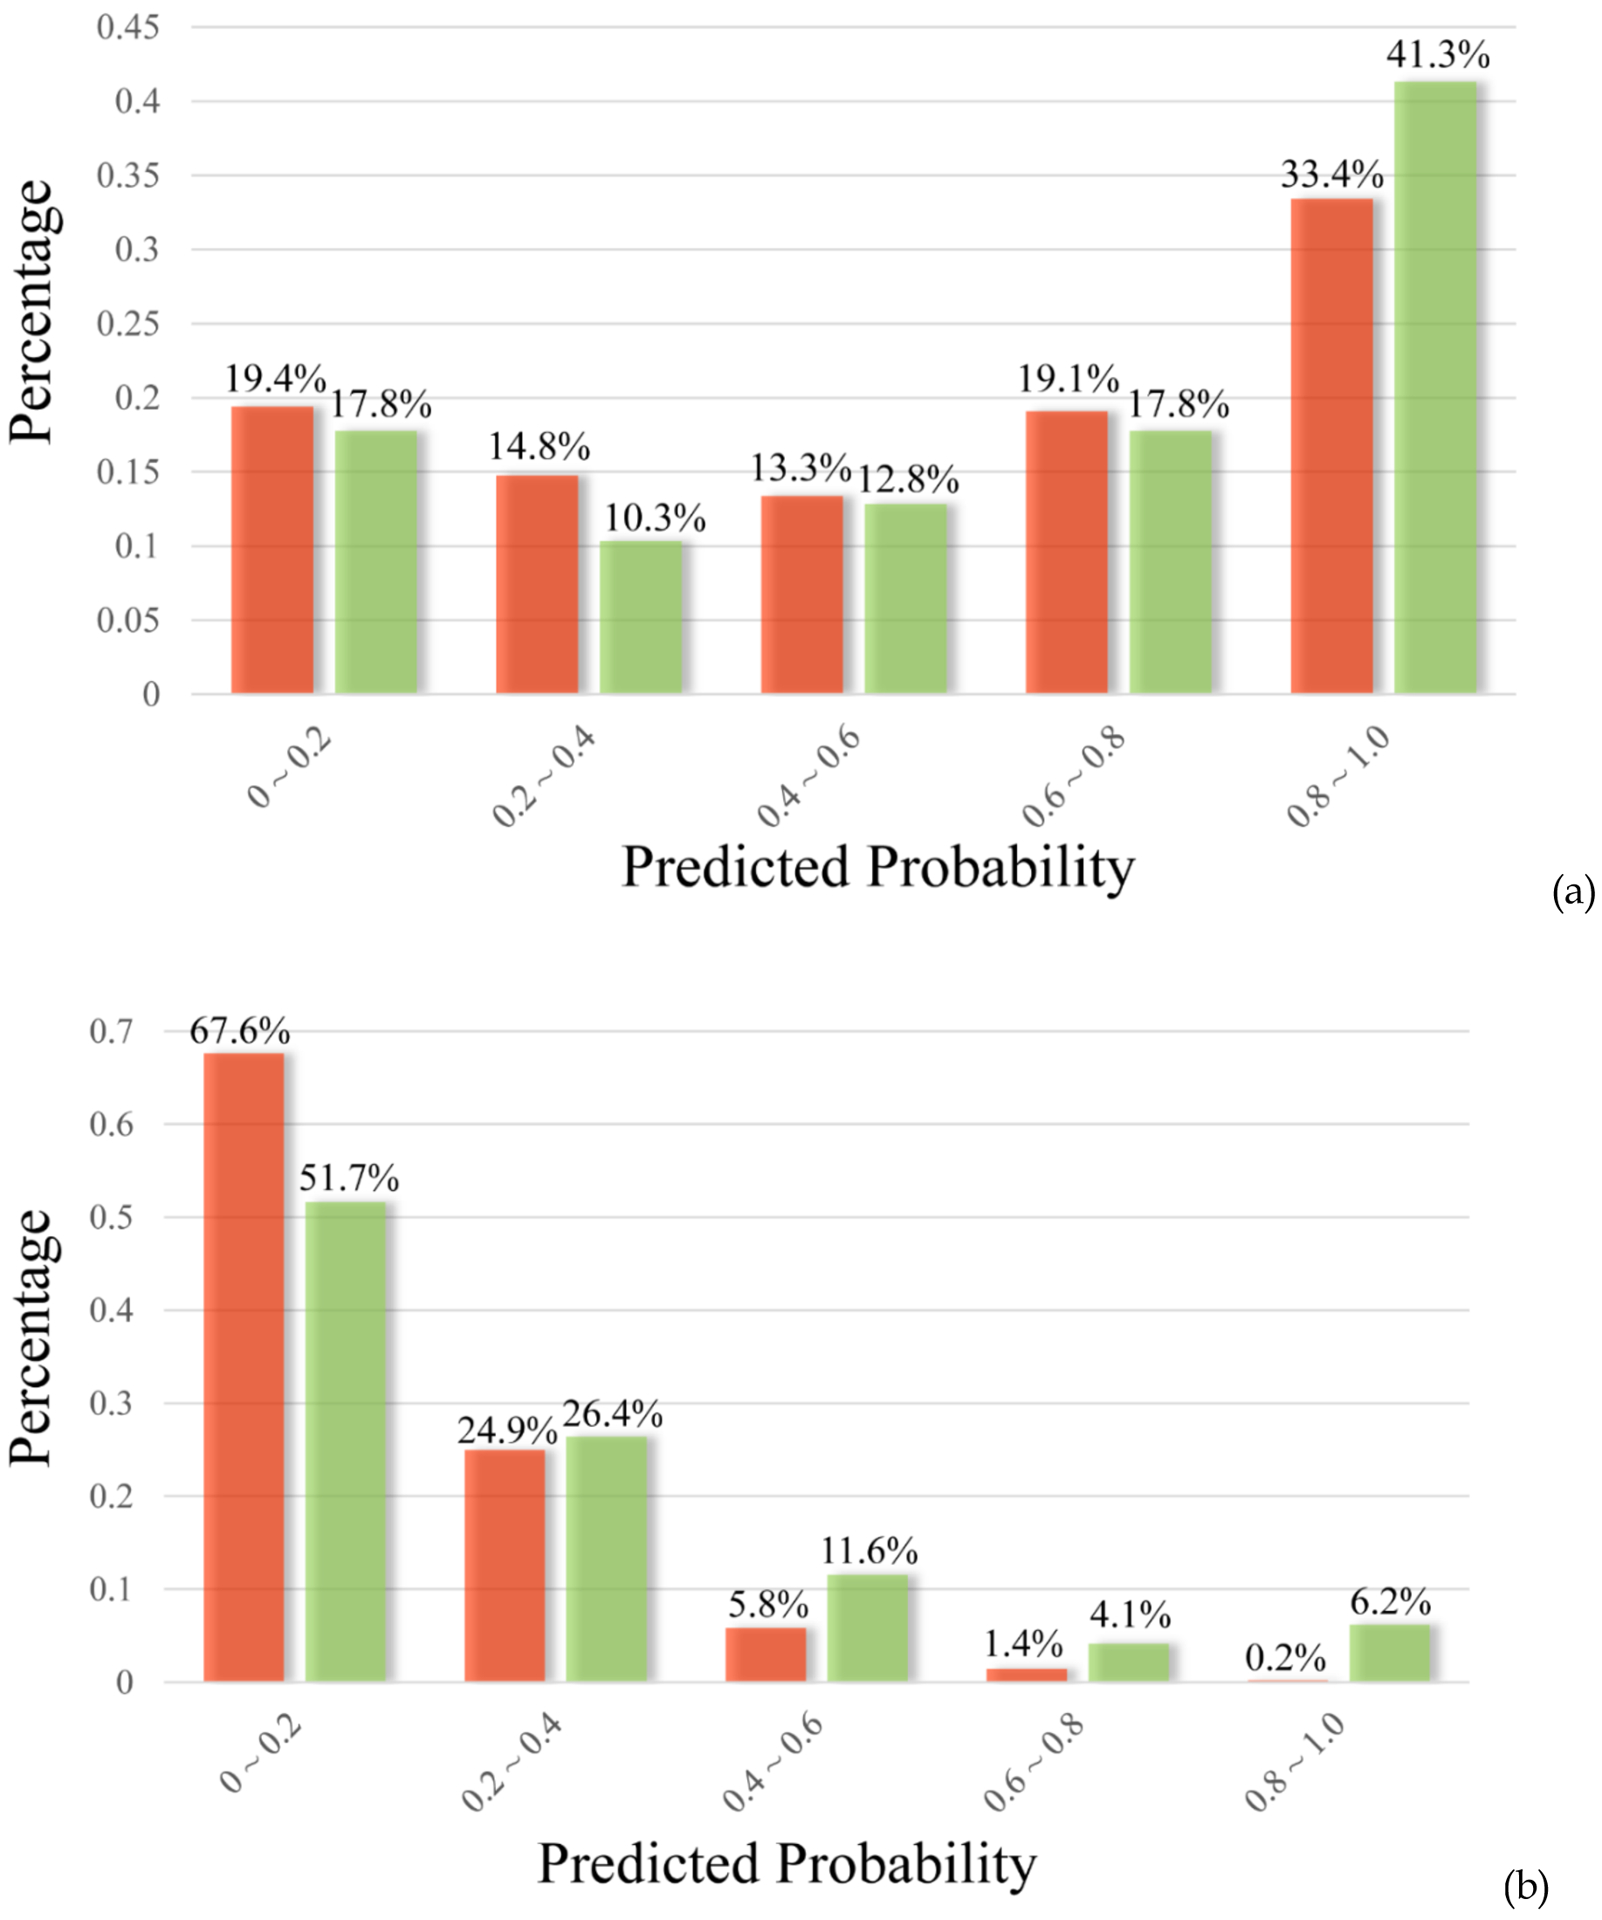
The distributions of the predicted probabilities of being soluble by Model10 (a) and highly soluble by Model50 (b) for KIs (colored in red) and KIDCs (colored in green).
Conclusions:
A large kinetic solubility dataset has been generated at the NCATS using Pion’s patented μSOL assay. Half of the 11,780 non-redundant compounds are regarded as poorly soluble with a solubility of less than 10 μg/mL, although large fraction of which are labeled drug-like, according to Lipinski’s RO5. Only less than a quarter of the compounds in the dataset are highly soluble (sol. > 50 μg/mL). Two SVC models have been constructed to recognize poorly soluble compounds (sol. < 10 μg/mL) and highly soluble compounds (sol. > 50 μg/mL), and both models exhibited high predictivity, as measured by AUC-ROC. Feature analysis leads to useful suggestions on how to improve solubility of a molecule, including introducing polar and acidic moieties, increasing sp3 hybrid carbon atoms, and reducing of fraction of sp2 hybrid atoms. The predictive models for poorly soluble and highly soluble molecules are useful tools to triage compounds in drug discovery and classification biopharmaceutics (The QSAR solubility models are accessible at https://tripod.nih.gov/web_adme/solub.html).
References:
- 1.Sun H A Practical Guide to Rational Drug Design. Elsevier: Cambridge, UK, 2016. [Google Scholar]
- 2.Lovering F; Bikker J; Humblet C Escape from flatland: increasing saturation as an approach to improving clinical success. J Med Chem 2009, 52, 6752–6. [DOI] [PubMed] [Google Scholar]
- 3.Lovering F Escape from Flatland 2: complexity and promiscuity. Medchemcomm 2013, 4, 515–519. [Google Scholar]
- 4.Di L; kerns EH Drug-like properties: concepts, structure, design, and methods. Elsevier: New York, 2016. [Google Scholar]
- 5.Yalkowsky SH; Banerjee S Aqueous solubility : methods of estimation for organic compounds. Dekker: New York, 1992. [Google Scholar]
- 6.Palmer DS; McDonagh JL; Mitchell JB; van Mourik T; Fedorov MV First-Principles Calculation of the Intrinsic Aqueous Solubility of Crystalline Druglike Molecules. J Chem Theory Comput 2012, 8, 3322–37. [DOI] [PubMed] [Google Scholar]
- 7.Moroy G; Martiny VY; Vayer P; Villoutreix BO; Miteva MA Toward in silico structure-based ADMET prediction in drug discovery. Drug Discov Today 2012, 17, 44–55. [DOI] [PubMed] [Google Scholar]
- 8.Sun H A universal molecular descriptor system for prediction of logP, logS, logBB, and absorption. J Chem Inf Comput Sci 2004, 44, 748–57. [DOI] [PubMed] [Google Scholar]
- 9.Cheng T; Li Q; Wang Y; Bryant SH Binary classification of aqueous solubility using support vector machines with reduction and recombination feature selection. J Chem Inf Model 2011, 51, 229–36. [DOI] [PMC free article] [PubMed] [Google Scholar]
- 10.Bhattachar SN; Wesley JA; Seadeek C Evaluation of the chemiluminescent nitrogen detector for solubility determinations to support drug discovery. J Pharm Biomed Anal 2006, 41, 152–7. [DOI] [PubMed] [Google Scholar]
- 11.Avdeef A; Bendels S; Tsinman O; Tsinman K; Kansy M Solubility-excipient classification gradient maps. Pharm Res 2007, 24, 530–45. [DOI] [PubMed] [Google Scholar]
- 12.Kerns EH; Di L; Carter GT In vitro solubility assays in drug discovery. Curr Drug Metab 2008, 9, 879–85. [DOI] [PubMed] [Google Scholar]
- 13.Avdeef A Absorption And Drug Development. John Wiley & Sons, Inc.: Hoboken, New Jersey, 2001. [Google Scholar]
- 14.Pipeline Pilot. http://accelrys.com/products/pipeline-pilot/ (Accessed 08/24/2018).
- 15.Noble WS What is a support vector machine? Nat Biotechnol 2006, 24, 1565–7. [DOI] [PubMed] [Google Scholar]
- 16.Scholkopf B; Smola AJ; Williams R Shrinking the tube: A new support vector regression algorithm. MIT Press: Cambridge, MA, 1999; Vol. 11. [Google Scholar]
- 17.Chang C-C; Lin C-J LIBSVM : a library for support vector machines, 2001. [Google Scholar]
- 18.Lipinski CA Drug-like properties and the causes of poor solubility and poor permeability. J Pharmacol Toxicol Methods 2000, 44, 235–49. [DOI] [PubMed] [Google Scholar]
- 19.Sun H; Veith H; Xia M; Austin CP; Tice RR; Huang R Prediction of Cytochrome P450 Profiles of Environmental Chemicals with QSAR Models Built from Drug-like Molecules. Molecular Informatics 2012, 31, 783–792. [DOI] [PMC free article] [PubMed] [Google Scholar]
- 20.Sanchez-Martinez C; Gelbert LM; Lallena MJ; de Dios A Cyclin dependent kinase (CDK) inhibitors as anticancer drugs. Bioorg Med Chem Lett 2015, 25, 3420–35. [DOI] [PubMed] [Google Scholar]
- 21.Christmann-Franck S; van Westen GJ; Papadatos G; Beltran Escudie F; Roberts A; Overington JP; Domine D Unprecedently Large-Scale Kinase Inhibitor Set Enabling the Accurate Prediction of Compound-Kinase Activities: A Way toward Selective Promiscuity by Design? J Chem Inf Model 2016, 56, 1654–75. [DOI] [PMC free article] [PubMed] [Google Scholar]
- 22.Klaeger S; Heinzlmeir S; Wilhelm M; Polzer H; Vick B; Koenig PA; Reinecke M; Ruprecht B; Petzoldt S; Meng C; Zecha J; Reiter K; Qiao H; Helm D; Koch H; Schoof M; Canevari G; Casale E; Depaolini SR; Feuchtinger A; Wu Z; Schmidt T; Rueckert L; Becker W; Huenges J; Garz AK; Gohlke BO; Zolg DP; Kayser G; Vooder T; Preissner R; Hahne H; Tonisson N; Kramer K; Gotze K; Bassermann F; Schlegl J; Ehrlich HC; Aiche S; Walch A; Greif PA; Schneider S; Felder ER; Ruland J; Medard G; Jeremias I; Spiekermann K; Kuster B The target landscape of clinical kinase drugs. Science 2017, 358. [DOI] [PMC free article] [PubMed] [Google Scholar]


