

Abstract
Background
Recent studies have indicated that circular RNAs (circRNAs) are novel endogenous RNAs whose 5′ and 3′ ends are covalently linked and play critical roles in gastric carcinogenesis. However, the significance of circRNA hsa_circ_0001874 in gastric cancer (GC) is still unclear.
Methods
Therefore, we first detected hsa_circ_0001874 levels in GC cell lines and tissues and analyzed their potential correlation with clinicopathological factors. Then, a receiver operating characteristic (ROC) curve was established to evaluate its clinical value. Finally, we further predicted the biological functions of this molecule by bioinformatics analysis.
Results
Our data showed that as an indicator, hsa_circ_0001874 expression was significantly decreased in 78.02% (71/91) of the GC patients. Combined with clinicopathological factors, the hsa_circ_0001874 level was strongly associated with cell differentiation (p < 0.001), tumor stage (p = 0.005), invasion (p = 0.024), lymphatic metastasis (p = 0.023), and CEA level (p < 0.001) in GC tissues. The area under the curve (AUC) was up to 0.673, with a sensitivity and specificity of 61.54% and 68.13%, respectively. Bioinformatics analysis showed that hsa_circ_0001874 harbors miR‐593‐5p, miR‐103a‐3p, and miR‐107 seed sequences to regulate these three miRNAs and downstream target genes and exert its various biological functions in the carcinogenesis and progression of GC.
Conclusion
In summary, these data suggest that hsa_circ_0001874 is an indicator of GC and plays a significant role in gastric carcinogenesis and progression.
Keywords: bioinformatics analysis, circRNAs, gastric cancer, hsa_circ_0001874
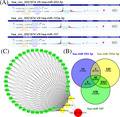
Prediction for hsa_circ_0001874‐miRNAs‐target genes axis. (A) The interaction between hsa_circ_0001874 and miRNAs based on TargetScan and miRanda. (B) Venn diagram reveled the number of common downstream targets of hsa‐miR‐593‐5p, hsa‐miR‐103a‐3p and hsa‐miR‐107. (C) The interaction network map of hsa_circ_0001874‐miRNAs‐target genes axis.
1. INTRODUCTION
Gastric cancer (GC) is a common malignancy and the fourth leading cause of mortality worldwide. 1 The majority of GC patients are diagnosed at an advanced stage and lack typical symptoms, leading to a poor prognosis. It not only seriously endangers people's health, but also creates a huge economic burden on society. Although there were many studies on GC, the molecular mechanism of GC initiation and progression is still unclear. 2 , 3 Therefore, it is important to explore biomolecules and their functions in large‐scale data analyses, which will help improve the diagnosis and treatment of GC.
Circular RNAs (circRNAs) are special endogenous circular RNA molecules with 5′ and 3′ ends covalently linked by alternative splicing. 4 Circular RNAs have various biological functions and show stability, abundance, tissue‐specific exhibition, and high conservation. 5 , 6 Accumulating evidence suggests that circRNAs play key roles in cell physiological processes such as cell proliferation, differentiation, and apoptosis. 7 , 8 Moreover, some circRNAs with dysregulated expression can affect the occurrence and progression of cancers by many ways, especially acting as miRNA sponges. 4
Hsa_circ_0001874 is an aberrantly expressed circRNA identified in our GC microarray. 5 Its gene symbol is BICD cargo adaptor 2 (BICD2), and it is located at chr9:95500310–95500614 and is 304 nts in length. However, the importance of hsa_circ_0001874 in GC is still unknown. Therefore, we first detected the hsa_circ_0001874 expression levels in GC cells and tissues and analyzed its clinicopathological correlation. Then, a receiver operating characteristic (ROC) curve was established to evaluate its clinical value. Finally, we further predicted its potential biological functions by bioinformatics methods. Our results showed that hsa_circ_0001874 is an indicator of gastric carcinogenesis and progression.
2. MATERIALS AND METHODS
2.1. Specimen collection
Ninety‐one pairs of GC tissues and matched paracarcinoma tissues (3 cm away from the edge of the tumor) were obtained from the Affiliated Hospital of the Medical School of Ningbo University, China, between 2015 and 2019. All tissues were collected from surgical patients and stored in the refrigerator at −80°C, submerged in RNA‐fixer Reagent (Bioteke). The tissues were finally diagnosed by pathology, and the tumor clinical stages were assessed according to the tumor‐node‐metastasis (TNM) staging system (8th ed.). The histological grades are based on the National Comprehensive Cancer Network clinical practice guidelines of oncology (V.3.2017). All patients assigned the informed consent.
2.2. Cell culture
Cells were provided by the Chinese Academy of Sciences Biochemistry and Cell Biology Research . The culture conditions were RPMI‐1640 medium (Life Technologies) with 10% fetal bovine serum at 37°C with 5% CO2.
2.3. qRT‐PCR analysis
RNA was extracted using TRIzol reagents (Ambion) and then reverse‐transcribed into cDNA via the GoScript Reverse Transcription (RT) System (Promega). Real‐time quantitative reverse transcription‐polymerase chain reaction (qRT‐PCR) was performed with GoTaq qPCR Master Mix (Promega). We selected glyceraldehyde 3‐phosphate dehydrogenase (GAPDH) to normalize the hsa_circ_0001874 levels. The primers were as follows: 5′‐ATACCCGTTGGCTCTCCTGC‐3′ (sense) and 5′‐CGTGTGTAAGCCCACCCTGA‐3′ (antisense) for hsa_circ_00001874; and 5′‐ACCCACTCCTCCACCTTTGAC‐3′ (sense) and 5′‐TGTTGCTAGCCAAATTCGTTA‐3′ (antisense) for GAPDH. Hsa_circ_00001874 levels were analyzed using the ΔCt method. 9 Each experiment was repeated independently at least two times. DNA sequencing was used to confirm the sequence of qRT‐PCR products (Figure S1).
2.4. Bioinformatics analysis
TargetScan and miRanda were used to predict and annotate the miRNA sponge function. 10 Kyoto Encyclopedia of Genes and Genomes pathway (KEGG) and Gene Ontology (GO) analyses of hsa_circ_0001874/miRNA pathways were performed by DIANA‐miRPath software. 10 The circRNA‐miRNA‐mRNA network was drawn by Cytoscape software (https://cytoscape.org). The common downstream targets of the three miRNAs were identified based on the Venny 2.1 software.
2.5. Statistical analysis
Statistical analyses were conducted by the Statistical Package for the Social Sciences (SPSS) 20.0 software (SPSS). Student's test and one‐way analysis of variance (ANOVA) were the main statistical methods used in this study. A p‐value < 0.05 was considered statistically significant.
3. RESULTS
3.1. Hsa_circ_0001874 expression was decreased in GC
To verify whether hsa_circ_0001874 was aberrantly expressed in gastric carcinogenesis, we first detected hsa_circ_0001874 levels in the normal human gastric epithelial cell line GES‐1 and two GC cell lines (BGC‐823 and SGC‐7901). Our results showed that hsa_circ_0001874 expression was significantly decreased in the two GC cell lines compared with the GES‐1 cell line (Figure 1A). Then, we detected its expression levels in GC tissues. It is that hsa_circ_0001874 was also significantly decreased in 78.02% (71/91) of the GC tissues compared with their paired paracarcinoma tissues (p < 0.001; Figure 1B,C). The area under the ROC curve (AUC) was 0.673 (95% confidence interval [CI]: 0.595–0.751, p < 0.001; Figure 1D), with a sensitivity and specificity of 61.54% and 68.13%, respectively.
FIGURE 1.

Aberrant expression of hsa_circ_0001874 in GC. (A) Relative expression levels of hsa_circ_0001874 in GES, BGC‐823, and SGC‐7901. (B) Hsa_circ_0001874 levels in 91 GC and marched paracarcinoma tissues. (C) Hsa_circ_0001874 expression levels were decreased in 78.02% (71/91) GC tissues. (D) ROC curve of hsa_circ_0001874 in distinguishing GC tissues from paracarcinoma tissues (*p < 0.05, **p < 0.01, ***p < 0.001)
3.2. Clinicopathological correlation of hsa_circ_0001874
Hsa_circ_0001874 expression levels in GC tissues were negatively correlated with GC patient cell differentiation grade (p < 0.001), tumor stage (p = 0.005), invasion (p = 0.024), lymphatic metastasis (p = 0.023), and tissue CEA level (p < 0.001) (Table 1).
TABLE 1.
Relationship of Hsa_circ_0001874 expression levels (ΔC t) in cancer tissues with clinicopathological factors of patients with gastric cancer
| Characteristics | No. of case (%) | Mean ± SD | p‐Value |
|---|---|---|---|
| Age (years) | |||
| ≥60 | 58 (63.7) | 14.758 ± 2.518 | 0.818 |
| <60 | 33 (36.3) | 14.879 ± 2.165 | |
| Gender | |||
| Male | 64 (70.3) | 14.526 ± 2.455 | 0.089 |
| Female | 27 (29.7) | 15.457 ± 2.107 | |
| Tumor location | |||
| Sinuses ventriculi | 45 (49.4) | 14.646 ± 2.604 | 0.496 |
| Cardia | 10 (11.0) | 14.023 ± 1.959 | |
| Corpora ventriculi | 24 (26.4) | 15.297 ± 1.411 | |
| Others | 12 (13.2) | 15.048 ± 3.292 | |
| Diameter (cm) | |||
| ≥5 | 46 (50.5) | 14.841 ± 2.335 | 0.876 |
| <5 | 45 (49.5) | 14.762 ± 2.459 | |
| Differentiation | |||
| Well | 24(26.4) | 15.973 ± 1.255 | <0.001 |
| Poor | 67 (73.6) | 14.383 ± 2.555 | |
| Stage | |||
| Early | 23 (25.3) | 15.731 ± 1.411 | 0.005 |
| Advanced | 68 (74.7) | 14.488 ± 2.567 | |
| Borrmann type | |||
| I and II | 17 (25.0) | 14.512 ± 3.513 | 0.972 |
| III and IV | 51 (75.0) | 14.480 ± 2.208 | |
| Pathological diagnosis | |||
| Signet ring cell cancer | 6 (6.6) | 13.600 ± 2.356 | 0.203 |
| Adenocarcinoma | 85 (93.4) | 14.887 ± 2.686 | |
| Invasion | |||
| T1 and T2 | 34 (37.4) | 15.529 ± 2.079 | 0.024 |
| T3 and T4 | 57 (62.6) | 14.368 ± 2.466 | |
| Lymphatic metastasis | |||
| N 0 | 36 (39.6) | 15.503 ± 2.199 | 0.023 |
| N 1‐3 | 55 (60.4) | 14.344 ± 2.409 | |
| Distal metastasis | |||
| M0 | 79 (86.8) | 14.803 ± 2.318 | 0.993 |
| M1 | 12 (13.2) | 14.797 ± 2.905 | |
| Venous invasion | |||
| Absent | 50 (54.9) | 14.856 ± 2.394 | 0.813 |
| Present | 41 (45.1) | 14.736 ± 2.401 | |
| Perineural invasion | |||
| Absent | 46 (50.5) | 14.900 ± 2.392 | 0.693 |
| Present | 45 (49.5) | 14.702 ± 2.400 | |
| CEA (Tissue) | |||
| Positive | 70 (77.1) | 15.323 ± 2.100 | <0.001 |
| Negative | 21 (22.9) | 12.523 ± 2.238 | |
| CA19‐9 (tissue) | |||
| Positive | 51 (56.0) | 14.889 ± 2.105 | 0.696 |
| Negative | 40 (44.0) | 14.691 ± 2.723 | |
Data were presented as mean ± standard deviation. A p ‐value < 0.05 was considered statistically significant (in bold).
3.3. Annotation of hsa_circ_0001874 biological function
Bioinformatics analysis indicated that hsa_circ_0001874 harbors miR‐593‐5p, miR‐103a‐3p and miR‐107 seed sequences (Figure 2A). These three miRNAs regulate 104, 3627, and 3747 downstream target protein genes, respectively. A Venn diagram revealed the number of common targets of this three miRNAs (Figure 2B). A map comprising hsa_circ_0001874, three miRNAs, and their common targets was constructed to show their interaction (Figure 2C). GO and KEGG results indicated that the hsa_circ_0001874/miRNA axis regulates downstream target protein genes to exert its various biological functions involved in multiple biological processes and signaling pathways, such as protein complex regulation, gene expression, the cell cycle, the p53 signaling pathway, and metabolic processes (Figure 3A,B). All these factors will affect the carcinogenesis and progression of GC.
FIGURE 2.

Prediction for hsa_circ_0001874‐miRNA‐target gene axis. (A) The interaction between hsa_circ_0001874 and miRNAs based on TargetScan and miRanda. (B) Venn diagram reveled the number of common downstream targets of hsa‐miR‐593‐5p, hsa‐miR‐103a‐3p, and hsa‐miR‐107. (C) The interaction network map of hsa_circ_0001874‐miRNA‐target gene axis
FIGURE 3.

GO analysis and KEGG analysis of hsa_circ_0001874‐miRNAs. (A) GO analysis. (B) KEGG analysis
4. DISCUSSION
circRNAs are special endogenous circular RNA molecules that were once regarded as nonfunctional by‐products and ignored by researchers. However, accumulating evidences have suggested that some circRNAs are aberrantly expressed and related to multiple pathological processes of gastric carcinogenesis, including tumorigenesis, development, and metastasis. 4 , 11 As crucial regulators, circRNAs have been found to exert their biological functions mainly acting as miRNA sponges. 12 Wang et al. 13 illustrated that the downregulated circ‐ITCH expression in GC promoted proliferation, migration, invasion, and epithelial‐mesenchymal transition (EMT) via a miR‐199a‐5p sponge mechanism. Zhang et al. 14 showed that upregulated circRNA_0005529 expression facilitates GC growth and metastasis by regulating the miR‐527/Sp1 axis. Moreover, in a recent study, circPVT1 was discovered to regulate the chemoresistance and malignancy of GC by modulating cancer‐related pathway through interacting with miR‐152‐3p. 15 Knockdown of circPVT1 expression significantly reduced DDP resistance and elevated cisplatin sensitivity in GC. 15 Similarly, circHN1, circMAN2B2, and hsa_circ_0023642 were also found to affect the growth and migration of GC cells by the similar ways. 16 , 17 , 18 All these circRNAs can serve as potential biomarkers and targets for the diagnosis and therapy of GC, which strongly suggests an important role of altered circRNAs in cancer pathophysiology.
Hsa_circ_0001874 is aberrantly expressed in gastric carcinogenesis. In this study, hsa_circ_0001874 expression levels were decreased in the GC cell lines and 78.02% of the GC tissues. Bioinformatics analysis revealed that hsa_circ_0001874 regulates abundant downstream target genes by sharing miRNA response elements with miR‐593‐5p, miR‐103a‐3p, and miR‐107. KEGG and GO analyses indicated the hsa_circ_0001874/miRNA axis is related to various biological processes, pathophysiological mechanisms, and cancer signaling pathways, such as biosynthesis, gene expression, metabolic processes, and cancer pathways. This suggest that hsa_circ_0001874 plays crucial roles in gastric carcinogenesis and progression through the hsa_circ_0001874‐miRNA‐target gene axis.
Some clinicopathological variables are independent prognostic factors for GC patients. Previous studies showed that patients’ 5‐year survival rate in early stage was higher than 85%, whereas it was lower than 20% in advanced GC. 19 For advanced GC, TNM stage representing tumor (T), lymph node metastasis (N), and distant metastasis (M) in GC cancer tissues is good indicator for patient prognostic assessment. Clinical statistics showed that the 5‐year survival rates were significantly different among different T and N categories. For GC patients in the T1, T2, T3, T4a, and T4b categories, their 5‐year survival rates were 93.9%, 98.7%, 51.8%, 32.6%, and 20.4%, respectively. 20 Similarly, in the N0, N1, N2, N3a, and N3b categories, the 5‐year survival rates were 81.3%, 61.0%, 48.3%, 35.9%, and 16.9%, respectively. 20 The degree of cell differentiation is also an important pathological factor associated with GC patient prognosis. The worse the differentiation was, the lower the overall survival rates were. 21 Moreover, as a common gastrointestinal tumor biomarker, CEA expression levels in tissue were directly correlated with GC prognosis. 22 The 5‐year survival rates were 67.6% and 40.1% for negatively and positively stained tissues, respectively. 23 In the current study, the hsa_circ_0001874 expression levels in GC tissues were in related to GC patients’ cell differentiation grade, tumor stage, invasion, lymphatic metastasis, and tissue CEA level. This implies that hsa_circ_0001874 is a potential indicator for clinical prognostic prediction.
Conclusively, our results suggested that hsa_circ_0001874 is an indicator of gastric carcinogenesis and progression.
CONFLICT OF INTEREST
The authors declare no potential conflicts of interest.
Supporting information
Figure S1
ACKNOWLEDGEMENTS
This work was supported by the National Natural Science Foundation of China (Grant Nos. 81702367 and 81772279) and the Affiliated Hospital of Medical School of Ningbo University Youth Talent Cultivation Program (Grant No. FYQMKY202001).
DATA AVAILABILITY STATEMENT
The data that support the findings of this study are available from the corresponding author upon reasonable request.
REFERENCES
- 1. Sung H, Ferlay J, Siegel R, et al. GLOBOCAN estimates of incidence and mortality worldwide for 36 cancers in 185 countries. CA Cancer J Clin. 2021;71(3):209‐249. 10.3322/caac.21660 [DOI] [PubMed] [Google Scholar]
- 2. Xie Y, Liu L. Analysis of correlation between HP infection and activation of PI3K/Akt pathway in mucosal tissues of gastric cancer and precancerous lesions. Oncol Lett. 2018;16(5):5615‐5620. [DOI] [PMC free article] [PubMed] [Google Scholar]
- 3. Du S, Li Y, Su Z, et al. Index‐based dietary patterns in relation to gastric cancer risk: a systematic review and meta‐analysis. Br J Nutr. 2020;123(9):964‐974. [DOI] [PubMed] [Google Scholar]
- 4. Tao X, Shao Y, Yan J, et al. Biological roles and potential clinical values of circular RNAs in gastrointestinal malignancies. Cancer Biol Med. 2021;18(2):1‐21. 10.20892/j.issn.2095-3941.2020.0348 [DOI] [PMC free article] [PubMed] [Google Scholar]
- 5. Shao Y, Li J, Lu R, et al. Global circular RNA expression profile of human gastric cancer and its clinical significance. Cancer Med. 2017;6(6):1173‐1180. [DOI] [PMC free article] [PubMed] [Google Scholar]
- 6. Chen B, Huang S, Janitz M. Changes in circular RNA expression patterns during human foetal brain development. Genomics. 2019;111(4):753‐758. [DOI] [PubMed] [Google Scholar]
- 7. Li J, Yang J, Zhou P, et al. Circular RNAs in cancer: novel insights into origins, properties, functions and implications. Am J Cancer Res. 2015;5(2):472‐480. [PMC free article] [PubMed] [Google Scholar]
- 8. Luo B, Tang C, Chen J. CircRNA and gastrointestinal cancer. J Cell Biochem. 2019;120(7):10956‐10963. 10.1002/jcb.28610 [DOI] [PubMed] [Google Scholar]
- 9. Tao X, Shao Y, Lu R, et al. Clinical significance of hsa_circ_0000419 in gastric cancer screening and prognosis estimation. Paolo Res Pract. 2020;216(1):152763. [DOI] [PubMed] [Google Scholar]
- 10. Shao Y, Tao X, Lu R, et al. Hsa_circ_0065149 is an indicator for early gastric cancer screening and prognosis prediction. Pathol Oncol Res. 2020;26(3):1475‐1482. [DOI] [PubMed] [Google Scholar]
- 11. Yu X, Ding H, Yang L, et al. Reduced expression of circRNA hsa_circ_0067582 in human gastric cancer and its potential diagnostic values. J Clin Lab Anal. 2020;34(3):e23080. [DOI] [PMC free article] [PubMed] [Google Scholar]
- 12. Nisar S, Bhat AA, Singh M, et al. Insights into the role of circrnas: biogenesis, characterization, functional, and clinical impact in human malignancies. Front Cell Dev Biol. 2021;9:617281. [DOI] [PMC free article] [PubMed] [Google Scholar]
- 13. Wang Y, Wang H, Zheng R, et al. Circular RNA ITCH suppresses metastasis of gastric cancer via regulating miR‐199a‐5p/Klotho axis. Cell Cycle. 2021;20(5‐6):522‐536. [DOI] [PMC free article] [PubMed] [Google Scholar]
- 14. Zhang X, Yang H, Jia Y, et al. circRNA_0005529 facilitates growth and metastasis of gastric cancer via regulating miR‐527/Sp1 axis. BMC Mol Cell Biol. 2021;22(1):6. [DOI] [PMC free article] [PubMed] [Google Scholar]
- 15. Wang X, Zhang Y, Li W, et al. Knockdown of cirRNA PVT1 elevates gastric cancer cisplatin sensitivity via sponging miR‐152‐3p. J Surg Res. 2021;261:185‐195. [DOI] [PubMed] [Google Scholar]
- 16. Zhang Y, Wang M, Zang X, et al. CircHN1 affects cell proliferation and migration in gastric cancer. J Clin Lab Anal. 2020;34(10):e23433. [DOI] [PMC free article] [PubMed] [Google Scholar]
- 17. Zhang Y, Xia L, Wu J, et al. Hsa_circ_0023642 promotes proliferation, invasion, and migration of gastric cancer by sponging microRNA‐223. J Clin Lab Anal. 2020;34(10):e23428. [DOI] [PMC free article] [PubMed] [Google Scholar]
- 18. Sun B, Sun H, Wang Q, et al. Circular RNA circMAN2B2 promotes growth and migration of gastric cancer cells by down‐regulation of miR‐145. J Clin Lab Anal. 2020;34(6):e23215. [DOI] [PMC free article] [PubMed] [Google Scholar]
- 19. Marqués‐Lespier JM, González‐Pons M, Cruz‐Correa M. Current perspectives on gastric cancer. Gastroenterol Clin North Am. 2016;45(3):413‐428. [DOI] [PMC free article] [PubMed] [Google Scholar]
- 20. Sun Z, Wang Z, Zhu Z, et al. Evaluation of the seventh edition of american joint committee on cancer TNM staging system for gastric cancer: results from a Chinese monoinstitutional study. Ann Surg Oncol. 2012;19(6):1918‐1927. [DOI] [PubMed] [Google Scholar]
- 21. Feng F, Liu J, Wang F, et al. Prognostic value of differentiation status in gastric cancer. BMC Cancer. 2018;18(1):865. [DOI] [PMC free article] [PubMed] [Google Scholar]
- 22. Thompson J, Zimmermann W, Osthus‐Bugat P, et al. Long‐range chromosomal mapping of the carcinoembryonic antigen (CEA) Gene Family Cluster. Genomics. 1992;12(4):761‐772. [DOI] [PubMed] [Google Scholar]
- 23. Wang W, Seeruttun SR, Fang C, et al. Prognostic significance of carcinoembryonic antigen staining in cancer tissues of gastric cancer patients. Ann Surg Oncol. 2016;23(4):1244‐1251. [DOI] [PubMed] [Google Scholar]
Associated Data
This section collects any data citations, data availability statements, or supplementary materials included in this article.
Supplementary Materials
Figure S1
Data Availability Statement
The data that support the findings of this study are available from the corresponding author upon reasonable request.