

Abstract
Background
The prediction for severe acute pancreatitis (SAP) is the key to give timely targeted treatment. Leukocyte cell population data (CPD) have been widely applied in early prediction and diagnosis of many diseases, but their predictive ability for SAP remains unexplored. We aim to testify whether CPD could be an indicator of AP severity in the early stage of the disease.
Methods
The prospective observational study was conducted in the emergency department ward of a territory hospital in Shanghai. The enrolled AP patients should meet 2012 Atlanta guideline.
Results
Totally, 103 AP patients and 62 healthy controls were enrolled and patients were classified into mild AP (n = 30), moderate SAP (n = 42), and SAP (n = 31). Forty‐two CPD parameters were examined in first 3 days of admission. Four CPD parameters were highest in SAP on admission and were constantly different among 3 groups during first 3 days of hospital stay. Eighteen CPD parameters were found correlated with the occurrence of SAP. Stepwise multivariate logistic regression analysis identified a scoring system of 4 parameters (SD_LALS_NE, MN_LALS_LY, SD_LMALS_MO, and SD_AL2_MO) with a sensitivity of 96.8%, specificity of 65.3%, and AUC of 0.87 for diagnostic accuracy on early identification of SAP. AUC of this scoring system was comparable with MCTSI, SOFA, APACHE II, MMS, BISAP, or biomarkers as CRP, PCT, and WBC in prediction of SAP and ICU transfer or death.
Conclusions
Several leukocyte CPD parameters have been identified different among MAP, MSAP, and SAP. They might be ultimately incorporated into a predictive system marker for severity of AP.
Keywords: acute pancreatitis, cell population data, prediction, scoring system, severity
Comparable predictive efficiency of a CPD scoring system compared with MCTSI, SOFA, APACHE II, MMS, BISAP, or biomarkers as CRP, PCT, and WBC in prediction of SAP and ICU transfer or death.
1. | INTRODUCTION
Acute pancreatitis (AP) is one of the most common gastrointestinal disorders requiring admission to hospital, 1 , 2 , 3 , 4 among which 15–20% of patients develop severe AP (SAP). 3 , 4 The mortality rate in SAP has been reported as high as 20–40%. 3 , 4 One of the key measures to improve the clinical outcome of AP is early evaluation and identification of SAP, which allows the physicians to perform promptly intensive care. According to the 2012 Atlanta guideline, 5 SAP is characterized by persistent organ failure, which was assessed by modified Marshall score (MMS) >2 and the duration of organ failure last ≥48 h. Therefore, determination of SAP usually requires 48 h after disease onset. This makes it difficult to predict SAP in an early stage. Previously, various biomarkers like C‐reactive protein (CRP), D‐dimer, procalcitonin, and interleukins have been tested for early prediction of AP outcomes. 4 , 6 , 7 , 8 , 9 , 10 But none of them present a flawless performance in predicting SAP.
Leukocyte cell population data (CPD) consist of several leukocyte morphologic parameters, which are measured by automated hematology analyzers. The Coulter DxH 800 hematology analyzer (Beckman Coulter, Fullerton, CA) collects data directly from more than 8000 white blood cells. It can measure cell volume (V) for accurate cell size by direct current impedance, characterize conductivity (C) for the internal composition of each cell through radio frequency opacity, and measure light scatter (S) for cytoplasmic granularity and nuclear structure using a laser beam. Using these data, it can identify neutrophil, lymphocyte, monocyte, eosinophil, or basophil in each cell sample and generate a cell count for each cell type. Leukocyte CPD parameters have been widely applied in the early prediction and diagnosis of acute infection, malaria, and leukemia, 11 , 12 , 13 , 14 , 15 , 16 due to their easy and early accessibility. However, there is a lack of study on the application of VCS technology in acute pancreatitis.
Most SAP patients lead to the development of systemic inflammatory response syndrome (SIRS) in the early stage of the disease. 17 , 18 , 19 SIRS is recognized as one of the most important indicators for the occurrence of persistent organ failure, which is responsible for morbidity and mortality in most of the SAP patients. 20 , 21 , 22 , 23 In addition, some patients will progress to infection of the pancreas or abdomen, which is a fatal complication and they will need active intervention or to be transferred for specialist care.
In the current study, we aim at assessing whether leukocyte CPD parameters could represent an early indicator of SAP. We measured and compared leukocyte CPD parameters of MAP, MSAP, and SAP in the first 3 days of admission. By using stepwise logistic regression model, we screened for a set of CPD parameters to predict SAP and evaluated its diagnostic accuracy.
2. | MATERIALS AND METHODS
2.1. | Participants
This study was approved by the ethical committee of Ruijin Hospital and conducted according to Helsinki declaration. The prospective observational study was conducted from March 2019 to August 2020. Patients who were hospitalized in the emergency department including the intensive care unit and medical ward of Ruijin Hospital, Shanghai Jiao Tong University School of Medicine (Shanghai, China), and diagnosed as AP were recruited in the study. All patients were admitted within 72 h after the onset of the symptoms. Informed consent was obtained from all patients before enrollment into the study. Exclusion criteria were as follows: 1) aged <18 years; 2) patients with a history of chronic pancreatitis; 3) pregnancy or lactation; 4) known malignancy, hematological system diseases.
Sixty‐two healthy people including 34 males and 28 females were chosen as healthy controls by routine health checkup in our hospital. Their median (Q1, Q3) of age was 46(33, 55). Exclusion criteria were as follows: 1) aged <18 years; 2) patients with a history of pancreatitis; 3) pregnancy or lactation; 4) known malignancy, hematological system diseases.
2.2. | Diagnosis
According to 2012 revised Atlanta guideline, 5 acute pancreatitis is defined as the presence of at least two out of the following three criteria: 1) pain in the upper abdomen, 2) serum amylase or lipase concentration >3 times the upper limit of normal, or 3) imaging features of acute pancreatitis on computed tomography (CT) or magnetic resonance imaging (MRI).
The MMS system was used to evaluate the respiratory, renal, and circulation variables. The type and duration of organ failure were also recorded. Mild AP (MAP) was characterized as neither organ failure nor local or systemic complications. Moderate SAP (MSAP) was characterized as transient organ failure (<48 h) or local or systemic complications. SAP was characterized by persistent organ failure (>48 h). Etiologies including biliary, 24 lipidemic, 25 alcoholic, and idiopathic 26 were also determined.
2.3. | Data collection
General information including gender, age, body mass index (BMI), pre‐existing comorbidities (cardiac diseases, pulmonary disease, liver disease, diabetes mellitus, hypertension, hyperlipidemia, renal disease, and other comorbidities), and substance abuse (alcohol and tobacco) were collected in the medical chart of AP patient. The daily intake of alcohol abuse did not meet the criteria of alcoholic pancreatitis. 26
On admission (day 1) and on the two following days (days 2 and 3), blood samples were obtained from AP patients for blood tests. Data included complete blood cell count (CBC), and the CPD parameters of neutrophils (NE), lymphocytes (LY), eosinophils (EO), and monocytes (MO), which were generated by each individual cell passing through the aperture and were optically and electronically measured by the Coulter DxH 800 hematology analyzer (Beckman Coulter, Fullerton, CA). The CPD parameters included volume (V), conductivity (C), median angle light scatter (MALS), upper median angle light scatter (UMALS), lower median angle light scatter (LMALS), low angle light scatter (LALS), and axial light loss (AL2). Routine blood tests included serum concentrations of urea, creatinine, bilirubin, procalcitonin (PCT), C‐reactive protein (CRP), serum activities of amylase, aspartate and alanine aminotransferases (AST, ALT), and plasma concentrations of D‐dimer. The routine tests were conducted on the day of blood collection in the Central Laboratory of Ruijin Hospital using automatic analyzers and standard protocol.
Accordingly, the organ support (mechanical ventilation, renal replacement therapy, vasoactive agent) was recorded. Several severity scoring systems including acute physiology and chronic health evaluation II (APACHE II), sequential organ failure assessment (SOFA), bedside index for severity in acute pancreatitis (BISAP), modified Marshall score (MMS), and modified computed tomography severity index (MCTSI) were collected on 3 days. The outcome indicators including the length of stay (in hospital), surgery, and inhospital mortality were analyzed.
All AP patients received intensive management including controlled fluid resuscitation, support of organ function, and enteral nutrition by the same clinical team to reduce potential bias. 27
2.4. | Scoring system
We developed a scoring system based on 4 CPD parameters (SD_LALS_NE, MN_LALS_LY, SD_LMALS_MO, SD_AL2_MO) to predict the occurrence of SAP. Each patient was assigned a score on a scale of 0 to 4 according to the presence or absence of SD_LALS_NE<36.17, MN_LALS_LY>34.50, SD_LMALS_MO<16.62, SD_AL2_MO<17.27.
2.5. | Statistical analysis
All statistical tests were conducted using SPSS 20.0 statistical software package (IBM Analytics, Armonk, NY) and R project v. 3.5.2 (The R Foundation for Statistical Computing, Vienna, Austria. http://www.r‐project.org). Nominal data were reported as number (percentage of the group). Quantitative data were reported as mean and standard deviation (SD) or median, lower and upper quartiles (Q1; Q3), depending on the normality of each variable's distribution (as assessed with Shapiro‐Wilk test). Due to the non‐normal distribution of most quantitative variables, Wilcoxon test or Kruskal‐Wallis analysis of variance (with post hoc comparisons using Siegel and Castellan method) was applied when comparing two groups or three groups, respectively. The optimal value of cutoff of related indicators was decided using the analysis of time‐dependent receiver operating characteristic (ROC) curve. The univariate logistic regression and the backward stepwise (entry and removal probability were 0.05 and 0.10, respectively) multivariate logistic regression model were fitted with SAP, and we calculated the odds ratio (OR) together with corresponding 95% confidence interval (CI). All analysis in this study was performed two‐sided at the 5% significance level. R package stats and FSA were applied to conduct Kruskal‐Wallis analysis with post hoc comparison. MASS was used for logistic regression analysis. pROC and ggplot2 were applied for the analysis of ROC curve.
3. | RESULTS
3.1. | Clinical characteristics
The study included 103 patients with AP, 43 women, 60 men, with a median (Q1; Q3) age of 46.00 (34.50; 60.00) years. The median (Q1; Q3) disease onset time of AP patients was 24.00 (12.00; 36.00) hours. According to the 2012 Atlanta criteria, 30 patients (29.13%) were diagnosed with MAP, 42 (40.78%) with MSAP, and 31 (30.10%) with SAP. MAP, MSAP, and SAP patients did not differ significantly in terms of age, sex, BMI, onset time, percentage affected with comorbidities, substance abuse, and AP etiology (Table 1). We also collected the vital sign of AP patients. Compared with MAP patients, the temperature and heart rate were higher in MSAP and SAP patients. And the respiratory rate in MAP patients was lower than MSAP and SAP patients (Table 1).
TABLE 1.
Clinical characteristics of the study group according to the severity of acute pancreatitis (AP)
| Characteristic | MAP (n = 30) | MSAP (n = 42) | SAP (n = 31) | P‐value |
|---|---|---|---|---|
| Demographics | ||||
| Male sex, n (%) | 16 (53.33) | 26 (61.90) | 18 (58.06) | 0.767 |
| Age (Q1; Q3), years | 53.00 (36.00; 62.75) | 48.00 (34.25; 59.75) | 44.00 (34.50; 50.00) | 0.198 |
| Body mass index (Q1; Q3), kg/m2 | 24.87 (23.55; 27.67) | 25.09 (23.77; 28.15) | 28.40 (24.30; 31.82) | 0.109 |
| Onset time (Q1; Q3), h | 24.00 (12.00; 30.00) | 30.00 (24.00; 48.00) | 24.00 (24.00; 42.00) | 0.096 |
| Pre‐existing comorbidities | ||||
| Cardiac diseases, n (%) | 7 (23.33) | 4 (9.52) | 3 (9.68) | 0.181 |
| Pulmonary disease, n (%) | 2 (6.67) | 3 (7.14) | 3 (9.68) | 0.905 |
| Liver disease, n (%) | 12 (40.00) | 25 (59.52) | 11 (35.48) | 0.087 |
| Diabetes mellitus, n (%) | 9 (30.00) | 13 (30.95) | 4 (12.90) | 0.166 |
| Hypertension, n (%) | 13 (43.33) | 14 (33.33) | 9 (29.03) | 0.484 |
| Hyperlipidemia, n (%) | 11 (36.67) | 24 (57.14) | 16 (51.61) | 0.222 |
| Renal disease, n (%) | 1 (3.33) | 3 (7.14) | 3 (9.68) | 0.637 |
| Other comorbidities, n (%) | 7 (23.33) | 8 (19.05) | 5 (16.13) | 0.774 |
| Substance abuse | ||||
| Alcohol, n (%) | 11 (36.67) | 15 (35.71) | 11 (35.48) | 0.928 |
| Tobacco, n (%) | 11 (36.67) | 15 (35.71) | 10 (32.26) | 0.928 |
| Etiology | ||||
| Biliary, n (%) | 15 (50.00) | 14 (33.33) | 17 (54.84) | 0.600 |
| Hypertriglyceridemia, n (%) | 8 (26.67) | 18 (42.86) | 9 (29.03) | |
| Alcoholic, n (%) | 5 (16.67) | 8 (19.05) | 4 (12.90) | |
| Other/idiopathic, n (%) | 2 (6.67) | 2 (4.76) | 1 (3.23) | |
| Vital signs | ||||
| Temperature (Q1; Q3), ℃ | 37.30 (37.00; 37.60) | 38.10 (37.55; 38.40) | 38.90 (38.40; 39.05) | <0.001a,b,c |
| Heart rate (Q1; Q3), beats per minute | 94.50 (82.75; 101.50) | 106.50 (92.50; 119.00) | 125.00 (114.50; 135.00) | <0.001a,b,c |
| Respiratory rate (Q1;Q3), breaths per minute | 20.00 (19.25; 21.75) | 24.50 (20.25; 28.00) | 30.00 (22.50; 35.50) | <0.001a,c |
| Mean arterial pressure (Q1; Q3), mmHg | 100.16 (90.33; 105.58) | 102.98 (88.42; 110.53) | 103.00 (94.84; 118.35) | 0.362 |
| Pulse oxygen saturation (Q1; Q3), % | 100.00 (99.00; 100.00) | 100.00 (99.25; 100.00) | 98.00 (93.00; 100.00) | 0.001a,c |
| Operation | ||||
| Therapeutic ERCP, n (%) | 0 (0.00) | 2 (4.76) | 2 (6.45) | 0.558 |
| Percutaneous transhepatic gallbladder drainage, n (%) | 0 (0.00) | 2 (4.76) | 5 (16.13) | 0.040a |
| Percutaneous peritoneal drainage, n (%) | 0 (0.00) | 7 (16.67) | 18 (58.06) | <0.001a,b,c |
| Surgery, n (%) | 1 (3.33) | 0 (0.00) | 8 (25.81) | <0.001a,b |
| Outcome | ||||
| ICU admission, n (%) | 2 (6.67) | 30 (71.43) | 31 (100.00) | <0.001a,b,c |
| Hospital mortality, n (%) | 0 (0.00) | 0 (0.00) | 5 (16.13) | 0.004a,b |
| Length of hospital stay, days | 15.00 (11.25; 19.75) | 23.00 (21.00; 29.50) | 45.00 (39.50; 62.50) | <0.001a,b,c |
Abbreviations: ERCP, endoscopic retrograde cholangiopancreatography; ICU, intensive care unit; MAP, mild acute pancreatitis; MSAP, moderately severe acute pancreatitis; SAP, severe acute pancreatitis.
Note: Categorical variables presented as n (%), number and percentage; Continuous variables presented as median (Q1; Q3), Q1, lower quartile; Q3, upper quartile; p‐value is reported for overall comparison between three groups (in Pearson chi‐squared test or Kruskal‐Wallis ANOVA), the letters in superscript indicate the results of post hoc tests: a significant difference between the MAP and SAP groups in post hoc comparison; b significant difference between the MSAP and SAP groups in post hoc comparison; c significant difference between the MAP and MSAP groups in post hoc comparison.
In the operation, the percentage of percutaneous transhepatic gallbladder drainage was higher in SAP (16.13%) patients compared with that in MAP (0%) patients. Compared with MAP (0.0%) patients, the percentage of percutaneous peritoneal drainage was higher in MSAP (16.67%) and SAP (58.06%) patients. The percentage of surgery was higher in SAP (25.81%) patients compared with that in MAP (3.33%) and MSAP (0.00%) patients (Table 1).
In addition, we investigated clinical outcomes among three groups. The percentage of ICU admission and the length of hospital stay were higher among patients with MSAP and SAP. Five AP patients (16.13%) died, all in SAP group (Table 1).
On admission, the patients with SAP were characterized with significantly higher concentrations of amylase (810.00 U/L), aspartate aminotransferase (47.00 U/L), total bilirubin (29.60 μmol/L), creatinine (71.00 μmol/L), urea (7.20 mmol/L), and D‐dimer (6.07 mg/L). The concentrations of inflammatory markers, serum procalcitonin, in SAP (2.66 ng/ml) patients were higher than in MAP (0.26 ng/ml) and MSAP (0.70 ng/ml) patients significantly, and the serum CRP showed no significant difference between MSAP (197.00 mg/L) and SAP (231.00 mg/L) patients, but both of them were higher than that of MAP (123.50 mg/L) patients (Table 2).
TABLE 2.
The results of laboratory tests on admission according to the AP severity. Data are shown as median (Q1; Q3)
| Variable | MAP (n=30) | MSAP (n=42) | SAP (n=31) | P‐value |
|---|---|---|---|---|
| Amylase, U/L | 312.00 (112.50; 669.00) | 467.00 (193.50; 828.50) | 810.00 (299.00; 1282.00) | 0.027a |
| Triglyceride, mmol/L | 3.24 (1.19; 4.48) | 2.78 (1.50; 6.16) | 2.63 (1.40; 6.75) | 0.856 |
| ALT, U/L | 26.50 (19.00; 69.50) | 16.00 (12.00; 36.75) | 27.00 (15.00; 57.50) | 0.062 |
| AST, U/L | 22.00 (14.25; 54.50) | 22.50 (18.00; 32.75) | 47.00 (30.00; 58.00) | 0.006a,b |
| Total bilirubin, µmol/L | 17.00 (12.62; 22.67) | 17.80 (11.25; 24.80) | 29.60 (19.65; 46.70) | <0.001a,b |
| Direct bilirubin, µmol/L | 2.70 (1.90; 4.38) | 3.55 (2.02; 7.28) | 10.40 (4.65; 16.35) | <0.001a,b |
| Creatinine, µmol/L | 64.50 (53.25; 74.50) | 56.00 (48.25; 74.50) | 71.00 (59.50; 138.00) | 0.008b |
| Urea, mmol/L | 4.10 (3.15; 5.68) | 4.55 (3.10; 6.00) | 7.20 (4.50; 10.75) | <0.001a,b |
| D‐dimer, mg/L | 0.82 (0.57; 2.05) | 4.86 (3.05; 8.96) | 6.07 (3.68; 10.52) | <0.001a,c |
| Procalcitonin, ng/ml | 0.26 (0.13; 0.62) | 0.70 (0.36; 1.92) | 2.66 (0.83; 6.44) | <0.001a,b,c |
| CRP, mg/L | 123.50 (49.02; 157.50) | 197.00 (124.25; 272.25) | 231.00 (147.50; 276.00) | <0.001a,c |
| White blood cell count, *109/L | 12.57 (10.79; 13.98) | 11.46 (8.63; 14.37) | 10.15 (7.55; 13.20) | 0.415 |
| Neutrophil count, *109/L | 10.41 (8.55; 12.13) | 9.73 (7.51; 12.74) | 9.12 (6.85; 12.20) | 0.899 |
| Lymphocyte count, *109/L | 1.41 (1.03; 1.66) | 0.92 (0.71; 1.29) | 0.85 (0.62; 1.06) | <0.001a,b |
| Eosinophil count, *109/L | 0.05 (0.01; 0.18) | 0.03 (0.01; 0.09) | 0.01 (0.00; 0.04) | 0.019a |
| Monocyte count, *109/L | 0.58 (0.47; 0.72) | 0.49 (0.35; 0.70) | 0.42 (0.30; 0.70) | 0.136 |
| Basophil count, *109/L | 0.02 (0.01; 0.03) | 0.02 (0.01; 0.03) | 0.02 (0.01; 0.02) | 0.640 |
| Red blood cell count, *1012/L | 4.60 (4.02; 4.98) | 3.99 (3.65; 4.37) | 3.46 (2.86; 4.43) | <0.001a,c |
| Hematocrit, % | 41.50 (37.00; 45.50) | 37.00 (33.00; 40.00) | 31.00 (27.50; 39.50) | 0.002a,c |
| Platelet count, *109/L | 197.50 (175.75; 229.50) | 173.00 (133.25; 249.75) | 131.00 (87.50; 206.50) | 0.007 a |
Abbreviations: ALT, alanine aminotransferase; AST, aspartate aminotransferase; CRP, C‐reactive protein; MAP, mild acute pancreatitis; MSAP, moderately severe acute pancreatitis; SAP, severe acute pancreatitis.
Note: Categorical variables presented as n (%), number and percentage; Continuous variables presented as median (Q1; Q3), Q1, lower quartile; Q3, upper quartile; P‐value is reported for overall comparison between three groups (in Pearson chi‐squared test or Kruskal‐Wallis ANOVA), the letters in superscript indicate the results of post hoc tests: a significant difference between the MAP and SAP groups in post hoc comparison; b significant difference between the MSAP and SAP groups in post hoc comparison; c significant difference between the MAP and MSAP groups in post hoc comparison.
In terms of hematological variables, the count of lymphocyte, eosinophil, red blood cell, platelet, and the percentage of hematocrit were significantly lower among patients with SAP relatively. However, other hematological variables did not differ significantly between the MAP, MSAP and SAP patients (Table 2).
As shown in Table 3, several scoring systems including APACHE II, MMS, SOFA, BISAP, and MCTSI scores in SAP patients were significantly higher than in MAP and MSAP patients. This was also observed in the case of persistent (≥48 h) organ dysfunction.
TABLE 3.
Comparison of severity and organ dysfunction among cohorts
| Characteristic | MAP (n=30) | MSAP (n=42) | SAP (n=31) | p‐Value |
|---|---|---|---|---|
| APACHE II score (Q1; Q3), points | 4.00 (2.25; 6.00) | 6.50 (3.00; 10.00) | 11.00 (7.50; 14.50) | <0.001a,b |
| Modified Marshall score (Q1; Q3), points | 0.00 (0.00; 1.00) | 2.00 (1.00; 2.00) | 3.00 (2.00; 3.50) | <0.001a,b,c |
| SOFA score (Q1; Q3), points | 1.00 (0.00; 2.00) | 2.00 (2.00; 3.75) | 5.00 (3.50; 7.00) | <0.001a,b,c |
| BISAP score (Q1; Q3), points | 0.50 (0.00; 1.00) | 2.00 (1.00; 2.00) | 2.00 (2.00; 3.00) | <0.001a,b,c |
| MCTSI score (Q1; Q3), points | 2.00 (2.00; 2.00) | 4.00 (4.00; 5.50) | 6.00 (4.00; 8.00) | <0.001a,b,c |
| Persistent (≥48 h) respiratory failure, n (%) | 0 (0.0) | 0 (0.0) | 27 (87.10) | <0.001a,b |
| Persistent (≥48 h) acute renal failure, n (%) | 0 (0.0) | 0 (0.0) | 9 (29.03) | 0.002a,b |
| Persistent (≥48 h) circulatory failure, n (%) | 0 (0.0) | 0 (0.0) | 6 (19.35) | 0.008a,b |
| Mechanical ventilation, n (%) | 0 (0.0) | 0 (0.0) | 23 (74.19) | <0.001a,b |
| Renal replacement therapy, n (%) | 0 (0.0) | 0 (0.0) | 5 (16.13) | 0.004b |
| Use of vasoactive agent, n (%) | 0 (0.0) | 0 (0.0) | 6 (19.35) | <0.001a,b |
Abbreviations: APACHE II, acute physiology and chronic health evaluation II; BISAP, bedside index for severity in acute pancreatitis; MAP, mild acute pancreatitis; MCTSI, modified computed tomography severity index; MSAP, moderately severe acute pancreatitis; SAP, severe acute pancreatitis; SOFA, sequential organ failure assessment.
Note: Categorical variables presented as n (%), number and percentage; Continuous variables presented as median (Q1; Q3), Q1, lower quartile; Q3, upper quartile; P‐value is reported for overall comparison between three groups (in Pearson chi‐squared test or Kruskal‐Wallis ANOVA), the letters in superscript indicate the results of post hoc tests: a significant difference between the MAP and SAP groups in post hoc comparison; b significant difference between the MSAP and SAP groups in post hoc comparison; c significant difference between the MAP and MSAP groups in post hoc comparison.
3.2. | Comparison of CPD parameters among MAP, MSAP, and SAP patients in first 3 days after admission
We examined 42 CPD parameters in total during first 3 days of admission: 14 CPD parameters for neutrophil, lymphocyte, and monocyte, respectively. On admission, as listed in Tables 4, S1 and S4, 18 CPD parameters were significantly different among MAP, MSAP, and SAP. Most of them showed higher levels in SAP than either MAP or MSAP. Seven (SD_V_NE, SD_LMALS_NE, SD_AL2_NE, SD_C_LY, SD_UMALS_LY, SD_LMALS_LY, and SD_AL2_LY) and 2 (MN_C_LY and MN_C_MO) were higher in SAP compared with either MAP or MSAP, respectively. Five of 18 (MN_V_NE, SD_LALS_NE, SD_MALS_LY, SD_V_MO, and SD_AL2_MO) were highest in SAP than in both MAP and MSAP. The rest 4 (MN_MALS_NE, MN_UMALS_NE, MN_LMALS_NE, and MN_LALS_LY) were lower in SAP than in MAP but not MSAP. On day 2 (Tables 5, S2 and S5), 11 of 42 CPD parameters were different among 3 groups. Five of 11 (MN_V_NE, SD_MALS_LY, SD_UMALS_LY, MN_V_MO, and SD_AL2_MO) were higher in SAP than in MAP and MSAP. Two (SD_V_NE and SD_V_MO) were higher in SAP compared with that in MAP but not MSAP. SD_C_LY was higher in SAP than in MSAP but not MAP. On the contrary, another 3 (SD_C_NE, MN_MALS_NE, and MN_UMALS_NE) showed lower levels in SAP. On day 3 (Tables 6, S3 and S6), 16 CPD parameters were significantly different. Nine (MN_V_NE, SD_V_LY, SD_C_LY, SD_MALS_LY, SD_UMALS_LY, SD_LMALS_LY, SD_AL2_LY, MN_V_MO, and SD_V_MO) were higher in SAP compared with that in MAP and MSAP. Three of 16 (SD_V_NE, MN_UMALS_LY, and SD_AL2_MO) showed higher levels in SAP compared with that in MAP, whereas 4 (MN_MALS_NE, MN_UMALS_NE, MN_LMALS_NE, and MN_LALS_LY) were lower in SAP. Taken together, as shown in Figure 1, 4 of 42 CPD parameters were highest in SAP on admission and were constantly different among MAP, MSAP, and SAP during all 3 days of hospital stay.
TABLE 4.
Results of CPD parameters on day 1 according to the AP severity. Data are shown as median (Q1; Q3)
| Variable | MAP (n = 30) | MSAP (n = 42) | SAP (n = 31) | χ2 | P‐value |
|---|---|---|---|---|---|
| MN_V_NE | 152.50 (147.00; 157.75) | 158.00 (152.25; 164.75) | 164.00 (159.00; 168.50) | 21.11 | 0.001a,b,c |
| SD_V_NE | 19.60 (18.64; 22.36) | 22.23 (20.73; 23.86) | 22.01 (21.02; 25.54) | 14.30 | 0.001a,c |
| MN_MALS_NE | 140.50 (135.00; 144.00) | 137.00 (130.25; 141.75) | 134.00 (129.50; 138.00) | 15.31 | 0.001a,c |
| MN_UMALS_NE | 141.00 (138.25; 144.00) | 141.00 (135.00; 144.75) | 138.00 (133.50; 141.00) | 6.78 | 0.034a |
| MN_LMALS_NE | 137.50 (130.25; 141.00) | 130.50 (119.00; 136.75) | 125.00 (121.00; 133.00) | 16.41 | 0.001a,c |
| SD_LMALS_NE | 12.72 (12.10; 14.45) | 15.50 (12.61; 18.50) | 15.76 (13.53; 18.11) | 8.33 | 0.016a,c |
| SD_LALS_NE | 31.50 (29.61; 35.04) | 35.12 (31.80; 41.51) | 41.97 (39.26; 45.42) | 25.96 | 0.001a,b,c |
| SD_AL2_NE | 13.39 (12.52; 14.78) | 14.67 (13.49; 16.67) | 14.75 (13.51; 17.21) | 8.97 | 0.011a,c |
| MN_C_LY | 116.00 (114.00; 119.50) | 115.00 (113.00; 117.00) | 118.00 (115.00; 120.00) | 8.08 | 0.018b |
| SD_C_LY | 11.54 (10.00; 14.92) | 12.28 (9.45; 14.68) | 14.57 (11.11; 17.21) | 6.59 | 0.037a |
| SD_MALS_LY | 18.05 (16.19; 19.81) | 18.61 (17.39; 20.33) | 21.03 (18.56; 22.20) | 13.95 | 0.001a,b |
| SD_UMALS_LY | 19.83 (18.74; 21.99) | 21.11 (19.55; 23.40) | 22.98 (20.47; 24.12) | 9.59 | 0.008a |
| SD_LMALS_LY | 21.05 (19.17; 22.49) | 21.94 (20.27; 23.03) | 23.32 (21.55; 24.63) | 11.03 | 0.004a |
| MN_LALS_LY | 38.50 (35.00; 49.00) | 36.50 (33.25; 45.75) | 34.00 (32.00; 41.00) | 7.52 | 0.023a |
| SD_AL2_LY | 10.47 (10.04; 11.36) | 11.37 (10.29; 12.32) | 12.39 (11.04; 12.96) | 12.16 | 0.002a |
| SD_V_MO | 21.94 (19.98; 24.55) | 24.53 (22.65; 26.66) | 26.91 (23.86; 29.72) | 22.70 | 0.001a,b,c |
| MN_C_MO | 124.00 (122.25; 126.75) | 123.00 (121.00; 123.00) | 125.00 (121.50; 126.00) | 8.58 | 0.014b,c |
| SD_AL2_MO | 13.66 (12.73; 14.96) | 15.38 (13.89; 17.54) | 20.85 (18.22; 22.71) | 44.93 | 0.001a,b,c |
Abbreviations: AL2, axial light loss; C, conductivity; CPD, cell population data; LALS, low angle light scatter; LMALS, lower median angle light scatter; LY, lymphocyte; MALS, median angle light scatter; MAP, mild acute pancreatitis; MN, mean; MO, monocyte; MSAP, moderately severe acute pancreatitis; NE, neutrophil; Q1, lower quartile; Q3, upper quartile; SAP, severe acute pancreatitis; SD, standard deviation; UMALS, upper median angle light scatter; V, volume.
Note: P‐value is reported for overall comparison between three groups (in Kruskal‐Wallis ANOVA), the letters in superscript indicate the results of post‐hoc tests: a significant difference between the MAP and SAP groups in post hoc comparison; b significant difference between the MSAP and SAP groups in post hoc comparison; c significant difference between the MAP and MSAP groups in post hoc comparison.
TABLE 5.
Results of CPD parameters on day 2 according to the AP severity. Data are shown as median (Q1; Q3)
| Variable | MAP (n = 30) | MSAP (n = 42) | SAP (n = 31) | χ2 | P‐value |
|---|---|---|---|---|---|
| MN_V_NE | 150.00 (146.00; 154.75) | 154.50 (149.00; 163.75) | 161.00 (155.00; 166.50) | 16.43 | 0.001a,b,c |
| SD_V_NE | 20.21 (18.29; 21.34) | 21.44 (19.58; 22.68) | 21.40 (20.18; 23.82) | 9.71 | 0.007a,c |
| SD_C_NE | 6.47 (6.14; 6.94) | 6.14 (5.63; 6.59) | 5.74 (5.02; 6.16) | 13.62 | 0.001a,b |
| MN_MALS_NE | 141.50 (136.00; 143.75) | 137.50 (133.00; 141.75) | 136.00 (132.50; 138.50) | 9.20 | 0.010a,c |
| MN_UMALS_NE | 140.00 (138.00; 143.75) | 139.50 (136.00; 141.00) | 136.00 (134.00; 141.00) | 8.10 | 0.017a |
| SD_C_LY | 12.17 (9.60; 14.35) | 11.68 (9.69; 13.78) | 13.99 (11.71; 16.06) | 7.56 | 0.022b |
| SD_MALS_LY | 17.89 (16.84; 19.50) | 18.33 (16.92; 20.34) | 20.29 (19.12; 21.87) | 10.33 | 0.005a,b |
| SD_UMALS_LY | 20.26 (19.39; 22.09) | 20.35 (19.25; 22.33) | 22.32 (21.64; 23.65) | 8.58 | 0.013a,b |
| MN_V_MO | 168.00 (163.00; 172.75) | 169.00 (164.00; 174.00) | 176.00 (167.00; 182.00) | 8.93 | 0.011a,b |
| SD_V_MO | 21.17 (19.69; 23.46) | 24.30 (21.29; 26.59) | 25.73 (23.72; 27.37) | 19.80 | 0.001a,c |
| SD_AL2_MO | 13.63 (13.26; 15.01) | 15.97 (14.36; 18.28) | 17.68 (16.15; 19.40) | 30.00 | 0.001a,b,c |
Abbreviations: AL2, axial light loss; C, conductivity; CPD, cell population data; LALS, low angle light scatter; LMALS, lower median angle light scatter; LY, lymphocyte; MALS, median angle light scatter; MAP, mild acute pancreatitis; MN, mean; MO, monocyte; MSAP, moderately severe acute pancreatitis; NE, neutrophil; Q1, lower quartile; Q3, upper quartile; SAP, severe acute pancreatitis; SD, standard deviation; UMALS, upper median angle light scatter; V, volume.
Note: P‐value is reported for overall comparison between three groups (in Kruskal‐Wallis ANOVA), the letters in superscript indicate the results of post hoc tests: a significant difference between the MAP and SAP groups in post hoc comparison; b significant difference between the MSAP and SAP groups in post hoc comparison; c significant difference between the MAP and MSAP groups in post hoc comparison.
TABLE 6.
Results of CPD parameters on day 3 according to the AP severity. Data are shown as median (Q1; Q3)
| Variable | MAP (n = 30) | MSAP (n = 42) | SAP (n = 31) | χ2 | P‐Value |
|---|---|---|---|---|---|
| MN_V_NE | 148.50 (144.25; 153.00) | 153.00 (149.00; 159.75) | 159.00 (153.00; 167.50) | 16.71 | 0.002a,b,c |
| SD_V_NE | 19.05 (18.17; 22.08) | 21.43 (19.30; 22.74) | 21.81 (19.56; 23.34) | 7.07 | 0.029a |
| MN_MALS_NE | 142.00 (138.25; 144.75) | 137.00 (132.50; 141.75) | 135.00 (133.00; 139.00) | 13.27 | 0.001a,c |
| MN_UMALS_NE | 142.00 (139.25; 145.00) | 139.00 (136.00; 141.00) | 137.00 (134.00; 141.50) | 9.88 | 0.007a,c |
| MN_LMALS_NE | 138.00 (135.25; 140.75) | 132.00 (126.00; 138.75) | 131.00 (126.50; 135.00) | 9.41 | 0.009a,c |
| SD_V_LY | 15.72 (14.02; 17.71) | 17.04 (15.95; 19.14) | 19.63 (16.34; 21.72) | 14.81 | 0.001a,b,c |
| SD_C_LY | 11.44 (9.02; 12.71) | 12.48 (10.39; 14.00) | 15.66 (12.55; 16.91) | 19.32 | 0.001a,b |
| SD_MALS_LY | 17.76 (16.79; 19.32) | 18.63 (17.74; 20.34) | 20.34 (18.87; 21.81) | 15.79 | 0.001a,b |
| MN_UMALS_LY | 70.50 (65.50; 75.75) | 76.50 (67.00; 81.00) | 77.00 (70.50; 83.00) | 6.97 | 0.030a |
| SD_UMALS_LY | 20.13 (19.04; 21.88) | 20.92 (19.21; 22.90) | 22.15 (21.26; 24.16) | 10.38 | 0.005a,b |
| SD_LMALS_LY | 21.07 (19.90; 22.74) | 21.67 (20.70; 22.98) | 23.44 (21.76; 24.24) | 13.76 | 0.001a,b |
| MN_LALS_LY | 44.00 (37.00; 48.00) | 36.00 (34.00; 46.75) | 35.00 (32.50; 43.50) | 9.86 | 0.007a,c |
| SD_AL2_LY | 10.65 (9.85; 11.41) | 11.48 (10.41; 12.76) | 12.70 (11.76; 13.97) | 15.58 | 0.001a,b |
| MN_V_MO | 168.00 (162.00; 170.00) | 169.00 (164.00; 172.00) | 175.00 (168.50; 181.50) | 16.38 | 0.001a,b |
| SD_V_MO | 20.60 (18.77; 21.88) | 24.49 (21.76; 26.29) | 25.86 (23.83; 29.45) | 27.32 | 0.001a,b,c |
| SD_AL2_MO | 13.94 (12.52; 15.81) | 14.65 (13.01; 17.57) | 16.80 (14.67; 19.40) | 10.50 | 0.005a |
Abbreviations: AL2, axial light loss; C, conductivity; CPD, cell population data; LALS, low angle light scatter; LMALS, lower median angle light scatter; LY, lymphocyte; MALS, median angle light scatter; MAP, mild acute pancreatitis; MN, mean, SD, standard deviation; MO, monocyte. Q1, lower quartile; MSAP, moderately severe acute pancreatitis; NE, neutrophil; Q3, upper quartile; SAP, severe acute pancreatitis; UMALS, upper median angle light scatter; V, volume.
Note: P‐value is reported for overall comparison between three groups (in Kruskal‐Wallis ANOVA), the letters in superscript indicate the results of post hoc tests: a significant difference between the MAP and SAP groups in post hoc comparison; b significant difference between the MSAP and SAP groups in post hoc comparison; c significant difference between the MAP and MSAP groups in post hoc comparison.
FIGURE 1.

Four CPD parameters (MN_V_NE, SD_MALS_LY, SD_V_MO, and SD_AL2_MO) were highest in SAP on admission and were continuously different among MAP, MSAP, and SAP during all 3 days of hospital stay. Data are shown as median (Q1; Q3). CPD, cell population data; MAP, mild acute pancreatitis; MSAP, moderately severe acute pancreatitis; SAP, severe acute pancreatitis; MN, mean, SD, standard deviation; V, volume; MALS, median angle light scatter; AL2, axial light loss; NE, neutrophil; LY, lymphocyte; MO, monocyte
3.3. | Diagnosis value of CPD parameters for SAP and ICU transfer or death
Before screening for biomarkers for early identification of SAP, we first compared levels of all 42 CPD parameters between AP patients and healthy controls on admission. As shown in Table S7, majority of the CPD parameters had significantly different levels between 2 groups, whereas only 4 (MN_V_LY, MN_LMALS_LY, SD_C_MO, and MN_MALS_MO) showed no difference. We used univariate logistic regression analysis to select parameters correlated with the occurrence of SAP. As listed in Table 7, 17 CPD parameters were screened. Then, we used stepwise multivariate logistic regression model to screen for optimal parameters and identified a set of 4 CPD parameters (SD_LALS_NE, MN_LALS_LY, SD_LMALS_MO, and SD_AL2_MO) that made the model best fitted. We then established a simple scoring system using these 4 CPD parameters. As listed in Table 8, cutoff values of each CPD parameter were calculated by ROC curve analysis and the scoring system was optimized upon AUCs of different combination of 4 cutoff values. As a result, according to the presence of SD_LALS_NE<36.17, MN_LALS_LY>34.50, SD_LMALS_MO<16.62 and SD_AL2_MO<17.27, 1 point for each CPD parameter was assigned, which leads to a scale of 0 to 4 points for each patient. Median scores of SAP and non‐SAP were 1 and 3, respectively.
TABLE 7.
Odds ratios (95% confidence intervals) for CPD parameters in prediction of unfavorable course of AP
| Univariate analysis | Multivariate analysis | |||
|---|---|---|---|---|
| OR (95% CI) | P‐value | OR (95% CI) | P‐value | |
| MN_V_NE | 1.09 (1.04; 1.16) | 0.002 | ||
| SD_V_NE | 1.40 (1.16; 1.75) | 0.001 | ||
| MN_MALS_NE | 0.88 (0.81; 0.94) | 0.001 | 0.91 (0.78; 1.04) | 0.180 |
| MN_LMALS_NE | 0.91 (0.85; 0.95) | 0.001 | ||
| SD_LMALS_NE | 1.24 (1.07; 1.50) | 0.010 | ||
| MN_LALS_NE | 0.99 (0.97; 1.00) | 0.028 | 1.04 (1.00; 1.08) | 0.055 |
| SD_LALS_NE | 1.15 (1.07; 1.25) | 0.001 | 1.13 (1.03; 1.27) | 0.021 |
| SD_AL2_NE | 1.34 (1.08; 1.71) | 0.013 | ||
| SD_MALS_LY | 1.24 (1.06; 1.50) | 0.014 | ||
| SD_UMALS_LY | 1.20 (1.04; 1.42) | 0.020 | ||
| SD_LMALS_LY | 1.26 (1.05; 1.55) | 0.020 | ||
| MN_LALS_LY | 0.94 (0.89; 1.00) | 0.043 | 0.81 (0.68; 0.95) | 0.013 |
| SD_AL2_LY | 1.55 (1.15; 2.21) | 0.009 | ||
| SD_V_MO | 1.35 (1.17; 1.61) | 0.001 | ||
| SD_LMALS_MO | 1.31 (1.06; 1.67) | 0.019 | 0.63 (0.40; 0.93) | 0.031 |
| MN_LALS_MO | 0.98 (0.96; 1.00) | 0.045 | ||
| SD_AL2_MO | 1.57 (1.29; 2.03) | 0.001 | 1.83 (1.43; 2.55) | 0.001 |
Abbreviations: AL2, axial light loss; CI, confidence interval; CPD, cell population data; LALS, low angle light scatter; LMALS, lower median angle light scatter; LY, lymphocyte; MALS, median angle light scatter; MN, mean; MO, monocyte; NE, neutrophil; OR, odds ratio; SD, standard deviation; UMALS, upper median angle light scatter; V, volume.
TABLE 8.
Scoring system of 4 CPD parameters for prediction of unfavorable course of AP
| Cutoff | Score | Median (Q1; Q3) | ||
|---|---|---|---|---|
| SAP | Non‐SAP | |||
| SD_LALS_NE | <36.17 | 1 | 1 (1; 2) | 3 (2; 4) |
| MN_LALS_LY | >34.50 | 1 | ||
| SD_LMALS_MO | <16.62 | 1 | ||
| SD_AL2_MO | <17.27 | 1 | ||
Abbreviations: AL2, axial light loss; CPD, cell population data; LALS, low angle light scatter; LMALS, lower median angle light scatter; LY, lymphocyte; MN, mean; MO, monocyte; NE, neutrophil; Non‐SAP, mild acute pancreatitis, moderately severe acute pancreatitis; SAP, severe acute pancreatitis; SD, standard deviation.
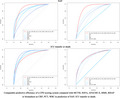
By using this scoring system, this set of 4 CPD parameters had a sensitivity of 96.8%, specificity of 65.3% and AUC of 0.87 for diagnostic accuracy on early identification of SAP. We drew ROC curve of this set of 4 CPD parameters and compared its AUC with other criteria (MCTSI, SOFA, APACHE II, MMS, BISAP) or biomarkers (CRP, PCT, WBC) that had been widely applied in SAP identification. As shown in Figure 2, Tables 9 and 10, this set of 4 CPD parameters showed an AUC of 0.87 which was comparable with 0.72, 0.85, 0.85, 0.87, 0.80 of MCTSI, SOFA, APACHE II, MMS, and BISAP, respectively. It even showed a higher AUC compared with CRP (0.67), PCT (0.79), WBC (0.57), and combination of these 3 biomarkers (0.74).
FIGURE 2.

Receiver operating characteristic (ROC) curves for the the scoring system of 4 CPD parameters on day 1 in prediction of SAP (A and B), and ICU transfer or death (C and D). For comparison, ROC curves are shown for other scoring systems and biomarkers of AP severity measured on day 1. CPD, cell population data; MN, mean, SD, standard deviation; MALS, median angle light scatter; LALS, low angle light scatter; AL2, axial light loss; NE, neutrophil; LY, lymphocyte; MO, monocyte; SAP, severe acute pancreatitis; ICU, intensive care unit; MCTSI, modified computed tomography severity index; SOFA, sequential organ failure assessment; APACHE II, acute physiology and chronic health evaluation II; MMS, modified Marshall score; BISAP, bedside index for severity in acute pancreatitis; CRP, C‐reactive protein; PCT, procalcitonin; WBC, white GA blood cell; CRP, C‐reactive protein; PCT, procalcitonin; WBC, white blood cell
TABLE 9.
Comparison of diagnostic accuracy of 4 CPD parameters’ scoring system with other criteria scoring systems measured on day 1 for prediction of unfavorable course of AP
| SAP | ICU transfer or death | |||||||
|---|---|---|---|---|---|---|---|---|
| AUC (95% CI) | Cutoff | Specificity | Sensitivity | AUC (95% CI) | Cutoff | Specificity | Sensitivity | |
| SD_LALS_NE+MN_LALS_LY+SD_LMALS_MO+SD_AL2_MO | 0.87 (0.80; 0.93) | 2.5 | 65.3% | 96.8% | 0.81 (0.72; 0.89) | 2.5 | 79.5% | 74.6% |
| MCTSI | 0.72 (0.63; 0.82) | 1.5 | 97.2% | 48.4% | 0.86 (0.80; 0.93) | 3.0 | 61.5% | 95.2% |
| SOFA | 0.85 (0.78; 0.91) | 3.5 | 54.2% | 93.5% | 0.86 (0.78; 0.93) | 1.5 | 59.0% | 96.8% |
| APACHE II | 0.85 (0.78; 0.92) | 5.0 | 83.3% | 67.7% | 0.88 (0.81; 0.95) | 5.5 | 82.1% | 85.7% |
| MMS | 0.87 (0.80; 0.94) | 4.5 | 90.3% | 64.5% | 0.87 (0.81; 0.94) | 1.5 | 79.5% | 76.2% |
| BISAP | 0.80 (0.71; 0.89) | 6.5 | 62.5% | 87.1% | 0.91 (0.85; 0.97) | 1.5 | 89.7% | 87.3% |
Abbreviations: AL2, axial light loss; APACHE II, acute physiology and chronic health evaluation II; AUC, area under the receiver operating characteristic curve; BISAP, bedside index for severity in acute pancreatitis; CI, confidence interval; CPD, cell population data; ICU, intensive care unit; LALS, low angle light scatter; LMALS, lower median angle light scatter; LY, lymphocyte; MCTSI, modified computed tomography severity index; MMS, modified Marshall score; MN, mean; MO, monocyte; NE, neutrophil; SAP, severe acute pancreatitis; SD, standard deviation; SOFA, sequential organ failure assessment.
TABLE 10.
Comparison of diagnostic accuracy of 4 CPD parameters’ scoring system with biomarkers of AP severity measured on day 1 for prediction of unfavorable course of AP
| SAP | ICU transfer or death | |||||||
|---|---|---|---|---|---|---|---|---|
| AUC (95% CI) | Cutoff | Specificity | Sensitivity | AUC (95% CI) | Cutoff | Specificity | Sensitivity | |
| SD_LALS_NE+MN_LALS_LY+SD_LMALS_MO+SD_AL2_MO | 0.87 (0.80; 0.93) | 2.5 | 65.3% | 96.8% | 0.81 (0.72; 0.89) | 2.5 | 79.5% | 74.6% |
| CRP | 0.67 (0.56; 0.78) | 216.5 | 72.2% | 61.3% | 0.76 (0.67; 0.86) | 202.5 | 89.7% | 58.7% |
| PCT | 0.79 (0.69; 0.88) | 1.1 | 76.1% | 71.0% | 0.79 (0.70; 0.88) | 1.15 | 92.3% | 57.1% |
| WBC | 0.57 (0.44; 0.70) | 9.2 | 72.2% | 48.4% | 0.51 (0.39; 0.62) | 13.5 | 74.4% | 36.5% |
| CRP+PCT+WBC | 0.74 (0.64; 0.84) | 0.3 | 73.2% | 71.0% | 0.83 (0.75; 0.91) | 0.6 | 84.6% | 69.8% |
Abbreviations: AL2, axial light loss; AUC, area under the receiver operating characteristic curve; CI, confidence interval; CPD, cell population data; CRP, C‐reactive protein (mg/L); ICU, intensive care unit; LALS, low angle light scatter; LMALS, lower median angle light scatter; LY, lymphocyte; MN, mean; MO, monocyte; NE, neutrophil; PCT, procalcitonin (ng/ml); SAP, severe acute pancreatitis; SD, standard deviation; WBC, white blood cell (*109/L).
We also evaluated this scoring system on the prediction of ICU transfer or death. It had a sensitivity of 74.6%, specificity of 79.5%, and AUC of 0.81 to predict ICU transfer or death (Tables 9 and 10). Its AUC was slightly lower than other criteria like MCTSI (0.86), SOFA (0.86), APACHE II (0.88), MMS (0.87), and BISAP (0.91) but higher than biomarkers as CRP (0.76), PCT (0.79), WBC (0.51), and combination of these 3 biomarkers (0.83) (Figure 2, Tables 9 and 10).
Finally, we performed onset time subgroup analysis on our scoring system. As shown in Table 11, AUCs of our scoring system remained stable among patients who admitted to hospital within 24, 24–48, and 48–72 h after disease onset for prediction of SAP (0.88, 0.88, and 0.75, respectively) and ICU transfer or death (0.82, 0.77, and 0.84, respectively).
TABLE 11.
Onset time subgroup analysis of diagnostic accuracy of 4 CPD parameters’ scoring system measured on day 1 for prediction of unfavorable course of AP
| Onset time | SAP | ICU transfer or death | ||||||
|---|---|---|---|---|---|---|---|---|
| AUC (95% CI) | Cutoff | Specificity | Sensitivity | AUC (95% CI) | Cutoff | Specificity | Sensitivity | |
| ≤24 h | 0.88 (0.80; 0.96) | 2.5 | 72.5% | 100.0% | 0.82 (0.71; 0.93) | 2.5 | 84.0% | 75.8% |
| >24 h, ≤48 h | 0.88 (0.76; 0.99) | 1.5 | 85.7% | 77.8% | 0.77 (0.60; 0.95) | 3.5 | 50.0% | 90.0% |
| >48 h, ≤72 h | 0.75 (0.47; 1.00) | 2.5 | 72.7% | 75.0% | 0.84 (0.69; 0.99) | 2.5 | 100.0% | 60.0% |
Abbreviations: AUC, area under the receiver operating characteristic curve; CI, confidence interval; CPD, cell population data; h, hour; ICU, intensive care unit; SAP, severe acute pancreatitis.
4. | DISCUSSION
It continues to be a challenge of early prognostic prediction in AP. If the precise and rapid determination of disease course in the early stage of AP can be achieved, appropriate therapeutic intervention will be introduced in time. That is the reason why the availability of accessible and practical parameters, for example, ones measured by modern hematological analyzers, could be a valuable perspective. 28
Many biomarkers have been evaluated previously with respect to their value for predicting AP results. 6 , 7 , 8 , 9 , 10 , 29 Unlike those biomarkers, the white blood cell (WBC) count is among the first laboratory tests available. Unfortunately, previous studies 30 , 31 and our results (Figure 2) suggested that WBC count elevation alone was nonspecific for SAP identification. However, several studies implied that the morphologic alteration of leukocytes also generates important diagnostic information characteristically. 32 , 33
Potential clinical utilities of leukocyte CPD have been widely studied in the last several years. Nevertheless, using CPD to measure morphologic alteration in acute pancreatitis has not been fully investigated. Evaluation of peripheral blood leukocyte CPD is analogous to the microscopic examination of the leukocyte morphology on a peripheral blood smear but uses the modern technology to automatically define the cellular morphology with increased accuracy and consistency. 34
In our study, SD_V_MO (standard deviation of monocyte volume), which is also named MDW (monocyte volume distribution width), increased significantly in SAP patients during the first 3 days of admission. Most recently, the MDW, cleared by FDA for emergency department clinicians to identify patients with sepsis or increased risk of developing sepsis, became the first leukocyte morphologic parameter for clinical diagnosis. 33 , 35 , 36 SAP and sepsis have some similarities in the early stage, including organ function damage, 5 SIRS (diagnosed by Sepsis‐2 criteria 37 ) and a probability of infection. 38
It has been previously recognized that morphologic changes of circulating immune cells could be an early sign of infection. In response to microbial “danger signals,” circulating immune cells, especially monocytes and neutrophils, are rapidly activated, which can be characterized by changes in their size and shape 39 , 40 as well as the release of chemokines and cytokines. 41 , 42 The circulating monocytes are first‐line responders to infections, 43 , 44 and such response is proportional to the intensity of the exposure to either bacterial, fungal, or viral pathogens, 45 resulting in an acute increase in cell size. 46 , 47 We observed the increase of SD_V_MO in SAP patients and posited that it may be related to the secondary infection and SIRS in the process of SAP and SD_V_MO reflects the inflammatory process in these patients. We also found that MN_V_NE and SD_V_NE are significantly higher in SAP patients than those in MAP and MSAP patients during the first 3 days of admission (Figure 1). These two parameters have been reported their wide use in the early prediction of bacterial infection and sepsis, 48 , 49 and their increase in SAP patients may also predict the infection.
The VCS technology measures the mean of cellular volume and conductivity as well as the light scatter. 50 The parameter combinations we selected to predict SAP were all light scatter correlation, including low angle light scatter (LALS), lower median angle light scatter (LMALS), and axial light loss measurement (AL2). Among them, LALS is an indicator of nuclear complexity, suggesting nuclear hypo‐segmentation or chromatin condensation. LMALS implies cytoplasmic degranulation. AL2 suggests the change of cellular transparency or opacity. 34 These light scatter changes likely reflect the alterations corresponding to intrinsic biophysical properties of activated leukocytes either due to underlying inflammation or infection. Reviewing the previous studies, F Chaves et al reported the light scatter of neutrophil decreased significantly in acute bacterial infection patients. 51 P Arora et al also found that mean neutrophil scatter was significantly lower in cases as compared to that of the controls, and a significantly higher mean monocyte scatter was observed in sepsis patients than in controls. 52 YJ Jung et al's research shows that all neutrophil light scatter parameters were lower in the children with viral infection relative to the normal controls, and SD_MALS_MO was higher in viral infection than tuberculosis. 53 DH Park reported that LALS of lymphocytes value has good sensitivity and specificity in the discrimination of fungemia from bacteremia. 32 However, the exact pathological mechanisms of the light scatter changes seen among AP are not entirely clear. It can be confirmed that SIRS 5 and a probability of infection 38 exist in the early stage of pancreatitis. Infection could cause a series of pathological change such as toxic vacuolization in cells to increase the complexity of cell internal structure, resulting in the increase of light scatter. 54 SIRS is closely related with immunological function change. Monocytes and lymphocytes are mainly types of cells in immune response, activation of monocytes and lymphocytes by SIRS, which can trigger cell death. During the process of cell death, signal transduction, nuclear, and protein synthesis will increase or decrease depending on different kind of genes, which accumulate to change on morphological level and lead to cell apoptosis. 55 And the light scatter can measure the morphology changes of the nuclear structure. Therefore, we speculate that these light scatter parameters may reflect the morphological changes of leukocyte in different types of infection and inflammation in the pathogenesis of SAP.
The combination of CPD parameters has been reported to indicate local bacterial infection in cancer patients. 54 In our study, the scoring system of 4 CPD parameters has the largest AUC compared with that of CRP, PCT, and WBC, also larger then MCTSI, SOFA, APACHE II, and BISAP scores. It could be clinically valuable not only because they show a good diagnostic accuracy on SAP identification but also are readily obtained by hematology analyzer during automated leukocyte sorting with no additional cost. Furthermore, this scoring system is easy to calculate manually or even faster by computer program automatically to trigger‐specific test.
Additionally, it should be noted that SAP patients were not significantly higher in terms of BMI, age, pre‐existing comorbidities, and triglyceride in our study. The association between these indicators and severity of AP was reported to be controversial. Some studies proved that age increases with AP severity, 56 , 57 while other cohort studies reported no significant difference in age between non‐SAP and SAP, 58 , 59 , 60 which is also consistent with our current study and previous cohort study of 238 AP patients. 61 Furthermore, central obesity, hypertriglyceridemia (HTG), hypertension (HT), and diabetes mellitus (DM), a set of comorbidities termed metabolic syndrome (MetS), 62 were also reported ambiguous correlation with SAP. 59 , 63 Explanation for these paradoxical findings can be varied. For example, previous opinion that BMI is a predictor of the severity of AP 64 , 65 was challenged, because BMI does not distinguish between truncal and visceral obesity, 64 leading to a weaker correlation with disease states not as strongly as intra‐abdominal and visceral fat measurement like waist circumference. 66 , 67 Alternatively, different etiologies of AP patients enrolled in study may also affect the conclusion. In the case of HTG, we did not find triglyceride increasing significantly in SAP, which was in line with that reported by Pothoulakis et al. 68 and Balachandra et al. 69 In contrast, others reported that the severity of pancreatitis increases with elevated levels of triglycerides. 70 , 71 This may because some of these studies only enrolled patients with hyperlipidemic AP or hyperlipidemia, but we enrolled AP patients with all common etiologies. Third, study design and the ability to control for confounding variables can be another reason. For the impact of DM on AP severity, a retrospective cohort study reported a higher risk of SAP in DM patients, 72 whereas another retrospective cohort study suggested no significant difference on AP severity between those with and without DM by multivariate analysis. 73 Forth, few study has analyzed the effect of arterial HT on the severity of AP except Szentesi et al. reported it as an independent risk factor for severity. 74 Further investigation is needed. Finally, explanation for conflicting findings may be due to the variations among studies regarding race. Evidence showed that the effect of obesity on AP severity seemed to be worse in South Africa, 75 moderate in Mexico, 76 and least severe in Taiwan. 77
We acknowledge the limitations of this study. The main limitation of our study is the relative small sample size. We attempted to minimize these limitations by using strict inclusion and exclusion criteria, conducting the treatment for all patients by the same clinical team to avoid the bias. In addition, we used multivariate regression analysis to screen the diagnostic indicators of CPD statistically and excluded confounding factors. A prospective multicenter study is in warrant.
Another limitation is that we enrolled patients within 72 h of onset, for the course of the disease could change dynamically during the first three days, making an urgent need to diagnose disease severity in the early stage of AP. According to the 2012 Atlanta guideline, the early stage of AP is defined as the first week after abdominal pain. We enrolled AP patients with the median onset time of 24, 24, 30, and 24 h for overall, MAP, MSAP, and SAP, respectively. Furthermore, we performed subgroup analysis on our scoring system of CPD parameters and found comparable diagnostic efficiency among patients who admitted to hospital within 24, 48, and 72 h after onset for prediction of SAP (0.88, 0.88, and 0.75, respectively) and ICU transfer or death (0.82, 0.77, and 0.84, respectively).
In conclusion, the leukocyte CPD parameters that we studied, these objective, quantitative, and more sensitive parameters, can ultimately be incorporated into a predictive marker for the severity of acute pancreatitis.
CONFLICT OF INTEREST
The authors declare that they have no competing interests.
ETHICAL APPROVAL
The study was approved by the Institutional Ethics Committee of Ruijin Hospital. Written informed consent was obtained from each participant or their family members.
Supporting information
TablesS1‐S7
ACKNOWLEDGMENTS
This study was supported by National Natural Science Foundation of China (No. 81600501) and National Natural Science Foundation Youth Project (No. 81601665).
Wang Y, Xu Z, Zhou Y, et al. Leukocyte cell population data from the blood cell analyzer as a predictive marker for severity of acute pancreatitis. J Clin Lab Anal. 2021;35:e23863. 10.1002/jcla.23863
Contributor Information
Bing Zhao, Email: zhaobing124@163.com.
Enqiang Mao, Email: maoeq@yeah.net.
DATA AVAILABILITY STATEMENT
The data that support the findings of this study are available from the corresponding author upon reasonable request.
REFERENCES
- 1. Demcsák A, Soós A, Kincses L, et al. Acid suppression therapy, gastrointestinal bleeding and infection in acute pancreatitis – an international cohort study. Pancreatology. 2020;20(7):1323‐1331. [DOI] [PubMed] [Google Scholar]
- 2. Paragomi P, Spagnolo DM, Breze CR, et al. Introduction and validation of a novel acute pancreatitis digital tool: interrogating large pooled data from 2 prospectively ascertained cohorts. Pancreas. 2020;49:1276–1282. [DOI] [PMC free article] [PubMed] [Google Scholar]
- 3. Mederos MA, Reber HA, Girgis M. Acute pancreatitis: a review. JAMA. 2021;325(4):382‐390. [DOI] [PubMed] [Google Scholar]
- 4. Boxhoorn L, Voermans RP, Bouwense SA, et al. Acute pancreatitis. Lancet. 2020;396(10252):726‐734. [DOI] [PubMed] [Google Scholar]
- 5. Banks PA, Bollen TL, Dervenis C, et al. Classification of acute pancreatitis–2012: revision of the Atlanta classification and definitions by international consensus. Gut. 2012;62(1):102‐111. [DOI] [PubMed] [Google Scholar]
- 6. Mikó A, Vigh É, Mátrai P, et al. Computed tomography severity index vs. other indices in the prediction of severity and mortality in acute pancreatitis: a predictive accuracy meta‐analysis. Front Physiol. 2019;10:1002. [DOI] [PMC free article] [PubMed] [Google Scholar]
- 7. Farkas N, Hanák L, Mikó A, et al. A multicenter, international cohort analysis of 1435 cases to support clinical trial design in acute pancreatitis. Front Physiol. 2019;10:1092. [DOI] [PMC free article] [PubMed] [Google Scholar]
- 8. Tian F, Li H, Wang L, et al. The diagnostic value of serum C‐reactive protein, procalcitonin, interleukin‐6 and lactate dehydrogenase in patients with severe acute pancreatitis. Clin Chim Acta. 2020;510:665‐670. [DOI] [PubMed] [Google Scholar]
- 9. Gupta S, Shekhawat V, Kaushik G. D‐dimer, a potential marker for the prediction of severity of acute pancreatitis. Clin Lab. 2015;61(9):1187‐1195. [DOI] [PubMed] [Google Scholar]
- 10. Fisic E, Poropat G, Bilic‐Zulle L, Licul V, Milic S, Stimac D. The Role of IL‐6, 8, and 10, sTNFr, CRP, and pancreatic elastase in the prediction of systemic complications in patients with acute pancreatitis. Gastroenterol Res Pract. 2013;2013(2):1‐6. [DOI] [PMC free article] [PubMed] [Google Scholar]
- 11. Urrechaga E, Bóveda O, Aguirre U, García S, Pulido E. Neutrophil cell population data biomarkers for acute bacterial infection. J Pathol Infect Dis. 2018;1(1):1–7. [Google Scholar]
- 12. Urrechaga E. Reviewing the value of leukocytes cell population data (CPD) in the management of sepsis. Ann Transl Med. 2020;8(15):953‐963. [DOI] [PMC free article] [PubMed] [Google Scholar]
- 13. Zhu Y, Cao X, Tao G, Xie W, Hu Z, Xu D. The lymph index: a potential hematological parameter for viral infection. Int J Infect Dis. 2013;17(7):e490‐e493. [DOI] [PubMed] [Google Scholar]
- 14. Buoro S, Manenti B, Seghezzi M, et al. Abnormal scattergrams and cell population data generated by fully automated hematological analyzers: new tools for screening malaria infection? Int J Lab Hematol. 2018;40(3):326‐334. [DOI] [PubMed] [Google Scholar]
- 15. Zeeshanhaider R, Shamsi TS, Ujjan ID. Cell population data‐driven acute promyelocytic leukemia flagging through artificial neural network predictive modeling. Transl Oncol. 2020;13(1):11‐16. [DOI] [PMC free article] [PubMed] [Google Scholar]
- 16. Hong S, Jie Z, Yunhua L. The clinical application of neutrophil VCS parameters in the detection of bacterial infection and stringency diseases. Lab Med. 2012;27(12):1027‐1030. [Google Scholar]
- 17. Liu L, Wang C, Luo T, Li L. Effects of fluid resuscitation on organ failure and mortality in patients with acute pancreatitis and systemic inflammatory response syndrome‐ a retrospective cohort study. Biomed J Sci Tech Res. 2019;22(5):17021‐17029. [Google Scholar]
- 18. Wilson J, Zarabi S. SIRS criteria as a way of predicting mortality in acute pancreatitis. Emerg Med J. 2017;34(9):621‐622. [DOI] [PubMed] [Google Scholar]
- 19. Kumar A, Chari ST, Vege SS. Can the time course of systemic inflammatory response syndrome score predict future organ failure in acute pancreatitis? Pancreas. 2014;43(7):1101‐1105. [DOI] [PubMed] [Google Scholar]
- 20. Johnson CD, Besselink MG, Carter R. Acute pancreatitis. BMJ. 2014;349(3):601‐608. [DOI] [PubMed] [Google Scholar]
- 21. Chen Y, Ke L, Tong Z, Li W, Li J. Association between severity and the determinant‐based classification, Atlanta 2012 and Atlanta 1992, in acute pancreatitis: a clinical retrospective study. Medicine. 2015;94(13):e638. [DOI] [PMC free article] [PubMed] [Google Scholar]
- 22. Zhao J, Liao Q, Zhao Y, Hu Y. Mortality indicators and risk factors for intra‐abdominal hypertension in severe acute pancreatitis. Int Surg. 2014;99(3):252‐257. [DOI] [PMC free article] [PubMed] [Google Scholar]
- 23. Gougol A, Paragomi P, Pothoulakis I, Talukdar R, Papachristou GI. Temporal relationship between SIRS, organ failure, and death in acute pancreatitis: data from a large, multicenter, international study (APPRENTICE Study Group). Pancreas. 2018;47(10):1389‐1393. [Google Scholar]
- 24. van Geenen EJM, van der Peet DL, Bhagirath P, Mulder CJJ, Bruno MJ. Etiology and diagnosis of acute biliary pancreatitis. Nat Rev Gastroenterol Hepatol. 2010;7(9):495‐502. [DOI] [PubMed] [Google Scholar]
- 25. Scherer J, Singh VP, Pitchumoni CS, Yadav D. Issues in hypertriglyceridemic pancreatitis: an update. J Clin Gastroenterol. 2014;48(3):195‐203. [DOI] [PMC free article] [PubMed] [Google Scholar]
- 26. Lee P, Papachristou G. New insights into acute pancreatitis. Nat Rev Gastroenterol Hepatol. 2019;16(8):479‐496. [DOI] [PubMed] [Google Scholar]
- 27. Mao E. Intensive management of severe acute pancreatitis. Ann Transl Med. 2019;7(22):687. [DOI] [PMC free article] [PubMed] [Google Scholar]
- 28. Micha L, GraYna R. Immature granulocytes predict severe acute pancreatitis independently of systemic inflammatory response syndrome. Pancreatology. 2017;12:140‐144. [DOI] [PMC free article] [PubMed] [Google Scholar]
- 29. Choudhuri A, Duggal S, Biswas P, Uppal R. A comparison of acute physiology and chronic health evaluation II score and serum procalcitonin change for predicting mortality in acute pancreatitis. Indian J Crit Care Med. 2020;24(3):190‐194. [DOI] [PMC free article] [PubMed] [Google Scholar]
- 30. Lipinski M, Rydzewska‐Rosolowska A, Rydzewski A, Cicha M, Rydzewska G. Soluble urokinase‐type plasminogen activator receptor (suPAR) in patients with acute pancreatitis (AP) ‐ progress in prediction of AP severity. Pancreatology. 2016;17(1):24‐29. [DOI] [PubMed] [Google Scholar]
- 31. Wang Y, Fuentes HE, Attar BM, Jaiswal P, Demetria M. Evaluation of the prognostic value of neutrophil to lymphocyte ratio in patients with hypertriglyceridemia‐induced acute pancreatitis. Pancreatology. 2017;17(6):893‐897. [DOI] [PubMed] [Google Scholar]
- 32. Park D‐H, Park K, Park J, et al. Screening of sepsis using leukocyte cell population data from the Coulter automatic blood cell analyzer DxH800. Int J Lab Hematol. 2011;33(4):391‐399. [DOI] [PubMed] [Google Scholar]
- 33. Crouser ED, Parrillo JE, Seymour CW, et al. Monocyte distribution width: a novel indicator of sepsis‐2 and sepsis‐3 in high‐risk emergency department patients. Crit Care Med. 2019;47(8):1018‐1025. [DOI] [PMC free article] [PubMed] [Google Scholar]
- 34. Sun T, Li J, Wu B, et al. Effects of blood storage on cell population data. Clin Lab. 2020;66:1501–1508. [DOI] [PubMed] [Google Scholar]
- 35. Crouser ED, Parrillo J, Martin GS, Huang DT, Tejidor L. Monocyte distribution width enhances early sepsis detection in the emergency department beyond SIRS. J Intens Care. 2020;8:33. [DOI] [PMC free article] [PubMed] [Google Scholar]
- 36. Agnello L, Bivona G, Vidali M, et al. Monocyte distribution width (MDW) as a screening tool for sepsis in the Emergency Department. Clin Chem Lab Med. 2020;58(11):1951‐1957. [DOI] [PubMed] [Google Scholar]
- 37. American College of Chest Physicians/Society of Critical Care Medicine Consensus Conference . Definitions for sepsis and organ failure and guidelines for the use of innovative therapies in sepsis. Crit Care Med. 1992;20(6):864‐874. [PubMed] [Google Scholar]
- 38. Leppäniemi A, Tolonen M, Tarasconi A, et al. 2019 WSES guidelines for the management of severe acute pancreatitis. World J Emerg Surg. 2019;14(1):27. [DOI] [PMC free article] [PubMed] [Google Scholar]
- 39. Kim MJ, Cheng G, Agrawal DK. Cl‐ channels are expressed in human normal monocytes: a functional role in migration, adhesion and volume change. Clin Exp Immunol. 2010;138(3):453‐459. [DOI] [PMC free article] [PubMed] [Google Scholar]
- 40. Leckie MJ. Automated quantitation of circulating neutrophil and eosinophil activation in asthmatic patients. Thorax. 2000;55(6):471‐477. [DOI] [PMC free article] [PubMed] [Google Scholar]
- 41. Mifsud EJ, Tan ACL, Jackson DC. TLR agonists as modulators of the innate immune response and their potential as agents against infectious disease. Front Immunol. 2014;5:79. [DOI] [PMC free article] [PubMed] [Google Scholar]
- 42. Mukherjee R, Kanti Barman P, Kumar Thatoi P, Tripathy R, Kumar Das B, Ravindran B. Non‐classical monocytes display inflammatory features: validation in sepsis and systemic lupus erythematous. Sci Rep. 2015;5:13886. [DOI] [PMC free article] [PubMed] [Google Scholar]
- 43. Henderson R, Hobbs J, Mathies M, Hogg N. Rapid recruitment of inflammatory monocytes is independent of neutrophil migration. Blood. 2003;102(1):328‐335. [DOI] [PubMed] [Google Scholar]
- 44. Italiani P, Boraschi D. From monocytes to M1/M2 macrophages: phenotypical vs. Functional Differentiation. Frontiers Immunol. 2014;5(514):1‐22. [DOI] [PMC free article] [PubMed] [Google Scholar]
- 45. Xu D. Clinical applications of leukocyte morphological parameters. Int J Pathol Clin Res. 2015;1:1‐12. [Google Scholar]
- 46. Mccullough KC, Basta S, Knötig S, et al. Intermediate stages in monocyte–macrophage differentiation modulate phenotype and susceptibility to virus infection. Immunology. 2010;98(2):203‐212. [DOI] [PMC free article] [PubMed] [Google Scholar]
- 47. Wang SY, Mak KL, Chen LY, Chou MP, Ho CK. Heterogeneity of human blood monocyte: two subpopulations with different sizes, phenotypes and functions. Immunology. 1992;77(2):298‐303. [PMC free article] [PubMed] [Google Scholar]
- 48. Zhu Y, Cao X, Chen Y, et al. Neutrophil cell population data: useful indicators for postsurgical bacterial infection. Int J Lab Hematol. 2012;34(3):295‐299. [DOI] [PubMed] [Google Scholar]
- 49. Bhargava M, Saluja S, Sindhuri U, Saraf A, Sharma P. Elevated mean neutrophil volume+CRP is a highly sensitive and specific predictor of neonatal sepsis. Int J Lab Hematol. 2014;36(1):e11‐e14. [DOI] [PubMed] [Google Scholar]
- 50. Tang H, Jing J, Bo D, Xu D. Biological variations of leukocyte numerical and morphologic parameters determined by UniCel DxH 800 hematology analyzer. Arch Pathol Lab Med. 2012;136(11):1392‐1396. [DOI] [PubMed] [Google Scholar]
- 51. Fernando C, Bethany T, Dongsheng XU. Quantitative determination of neutrophil VCS parameters by the coulter automated hematology analyzer. Am J Clin Pathol. 2005;124(3):440‐444. [DOI] [PubMed] [Google Scholar]
- 52. Arora P, Gupta PK, Lingaiah R, Mukhopadhyay AK. Volume, conductivity, and scatter parameters of leukocytes as early markers of sepsis and treatment response. J Lab Physicians. 2019;11(1):29‐33. [DOI] [PMC free article] [PubMed] [Google Scholar]
- 53. Jung Y‐J, Kim J‐H, Park Y‐J, et al. Evaluation of cell population data on the UniCel DxH 800 Coulter Cellular Analysis system as a screening for viral infection in children. Int J Lab Hematol. 2012;34(3):283‐289. [DOI] [PubMed] [Google Scholar]
- 54. Li D, Zhou N, Liu L, Zeng Q, Song X. VCS parameters of neutrophils, monocytes and lymphocytes may indicate local bacterial infection in cancer patients who accepted cytotoxic chemotherapeutics. Eur J Clin Microbiol Infect Dis. 2016;35(1):41‐48. [DOI] [PubMed] [Google Scholar]
- 55. Shao R, Fang Y, Yu H, Zhao L, Jiang Z, Li CS. Monocyte programmed death ligand‐1 expression after 3–4 days of sepsis is associated with risk stratification and mortality in septic patients: a prospective cohort study. Crit Care. 2016;20:3–4. [DOI] [PMC free article] [PubMed] [Google Scholar]
- 56. Márta K, Lazarescu A‐M, Farkas N, et al. Aging and comorbidities in acute pancreatitis i: a meta‐analysis and systematic review based on 194,702 patients. Front Physiol. 2019;10:328. [DOI] [PMC free article] [PubMed] [Google Scholar]
- 57. Szakács Z, Gede N, Pécsi D, et al. Aging and comorbidities in acute pancreatitis II.: a cohort‐analysis of 1203 prospectively collected cases. Front Physiol. 2019;9:1776. [DOI] [PMC free article] [PubMed] [Google Scholar]
- 58. Zhang QI, Li LE, Chen H, et al. Soluble urokinase plasminogen activator receptor associates with higher risk, advanced disease severity as well as inflammation, and might serve as a prognostic biomarker of severe acute pancreatitis. J Clin Lab Anal. 2020;34(3).e23097 [DOI] [PMC free article] [PubMed] [Google Scholar]
- 59. Sawalhi S, Al‐Maramhy H, Abdelrahman A, Allah S, Al‐Jubori S. Does the presence of obesity and/or metabolic syndrome affect the course of acute pancreatitis?: A prospective study. Pancreas. 2014;43(4):565‐570. [DOI] [PubMed] [Google Scholar]
- 60. Wu Q, Zhong XI, Fu M, et al. High‐density lipoprotein cholesterol to low‐density lipoprotein cholesterol ratio in early assessment of disease severity and outcome in patients with acute pancreatitis admitted to the ICU. BMC Gastroenterol. 2020;20(1):164. [DOI] [PMC free article] [PubMed] [Google Scholar]
- 61. Zhao B, Sun S, Wang Y, et al. Cardiac indicator CK‐MB might be a predictive marker for severity and organ failure development of acute pancreatitis. Ann Transl Med. 2021;9(5):368. [DOI] [PMC free article] [PubMed] [Google Scholar]
- 62. Alberti K, Eckel RH, Grundy SM, et al. Harmonizing the metabolic syndrome: a joint interim statement of the International Diabetes Federation Task Force on Epidemiology and Prevention; National Heart, Lung, and Blood Institute; American Heart Association; World Heart Federation; International Atherosclerosis Society; and International Association for the Study of Obesity. Circulation. 2009;120(16):1640‐1645. [DOI] [PubMed] [Google Scholar]
- 63. Mikolasevic I, Milic S, Orlic L, et al. Metabolic syndrome and acute pancreatitis. Eur J Intern Med. 2016;32:79‐83. [DOI] [PubMed] [Google Scholar]
- 64. Li LK, Dennison AR, Garcea G. Association of visceral adipose tissue on the incidence and severity of acute pancreatitis: a systematic review. Pancreatology. 2020;20:1056‐1061. [DOI] [PubMed] [Google Scholar]
- 65. Dobszai D, Mátrai P, Gyöngyi Z, et al. Body‐mass index correlates with severity and mortality in acute pancreatitis: a meta‐analysis. World J Gastroenterol. 2019;25(6):729‐743. [DOI] [PMC free article] [PubMed] [Google Scholar]
- 66. Després J. Health consequences of visceral obesity. Ann Med. 2001;33(8):534‐541. [DOI] [PubMed] [Google Scholar]
- 67. Goodger R, Asrani V, Windsor J, Petrov M. Impact of metabolic comorbidities on outcomes of patients with acute pancreatitis: a scoping review. Panminerva Med. 2016;58(1):86‐93. [PubMed] [Google Scholar]
- 68. Pothoulakis I, Paragomi P, Archibugi L, et al. Clinical features of hypertriglyceridemia‐induced acute pancreatitis in an international, multicenter, prospective cohort (APPRENTICE consortium). Pancreatology. 2020;20(3):325‐330. [DOI] [PubMed] [Google Scholar]
- 69. Balachandra S, Virlos IT, King NKK, Siriwardana HPP, France MW, Siriwardena AK. Hyperlipidaemia and outcome in acute pancreatitis. Int J Clin Pract. 2010;60(2):156‐159. [DOI] [PubMed] [Google Scholar]
- 70. Olesen S, Harakow A, Krogh K, Drewes A, Handberg A, Christensen P. Hypertriglyceridemia is often under recognized as an aetiologic risk factor for acute pancreatitis: a population‐based cohort study. Pancreatology. 2021;21(2):334‐341. [DOI] [PubMed] [Google Scholar]
- 71. Mosztbacher D, Hanák L, Farkas N, et al. Hypertriglyceridemia‐induced acute pancreatitis: a prospective, multicenter, international cohort analysis of 716 acute pancreatitis cases. Pancreatology. 2020;20(4):608‐616. [DOI] [PubMed] [Google Scholar]
- 72. Shen H, Lu C, Li C. Effect of diabetes on severity and hospital mortality in patients with acute pancreatitis: a national population‐based study. Diabetes Care. 2012;35:1061‐1066. [DOI] [PMC free article] [PubMed] [Google Scholar]
- 73. Nawaz H, O'Connell M, Papachristou G, Yadav D. Severity and natural history of acute pancreatitis in diabetic patients. Pancreatology. 2015;15(3):247‐252. [DOI] [PubMed] [Google Scholar]
- 74. Szentesi A, Párniczky A, Vincze Á, et al. Multiple hits in acute pancreatitis: components of metabolic syndrome synergize each other's deteriorating effects. Front Physiol. 2019;10:1202. [DOI] [PMC free article] [PubMed] [Google Scholar]
- 75. Funnell IC, Bornman PC, Weakley SP, Terblanche J, Marks IN. Obesity: an important prognostic factor in acute pancreatitis. Br J Surg. 1993;80(4):484‐486. [DOI] [PubMed] [Google Scholar]
- 76. Suazo‐Baráhona J, Carmona‐Sánchez R, Robles‐Díaz G, et al. Obesity: a risk factor for severe acute biliary and alcoholic pancreatitis. Am J Gastroenterol. 1998;93(8):1324‐1328. [DOI] [PubMed] [Google Scholar]
- 77. Tsai CJ. Is obesity a significant prognostic factor in acute pancreatitis? Dig Dis Sci. 1998;43(10):2251‐2254. [DOI] [PubMed] [Google Scholar]
Associated Data
This section collects any data citations, data availability statements, or supplementary materials included in this article.
Supplementary Materials
TablesS1‐S7
Data Availability Statement
The data that support the findings of this study are available from the corresponding author upon reasonable request.