Abstract
In this protocol, we describe a method to monitor cell proliferation and death by live-cell imaging of propidium iodide (PI)-stained adherent mammalian cells. PI is widely used to assess cell death. However, it is usually used in end-point assays. Recently, we implemented the use of PI for real-time cell death assessment by automated imaging. Cells are seeded in a 96-well format, and after attachment, the treatments are added directly to the wells together with PI. Thereafter, cells are subjected to automated time-lapse imaging and quantification by computer software. Combined analyses of phase-contrast and fluorescence images allow assessment of treatment effects on cell proliferation as well as the extent and kinetics of cell death.
Keywords: Cell death, Cell proliferation, Live-cell imaging, Propidium iodide, Thapsigargin, Time-lapse imaging
Background
A variety of cell-based assays are available to determine cell death, but most of them, including the MTT (3-(4,5-dimethylthiazol-2-yl)-2,5-diphenyltetrazolium bromide) assay, crystal blue staining, and various flow cytometry-based methods, have the limitation of being end-point assays. Recently, we employed propidium iodide (PI) for live-cell assessment of cell death using an automated fluorescence imaging system (IncuCyte ZOOM from Essen Bioscience) ( Sehgal et al., 2017 ). By combined analysis of phase-contrast images, cytostatic and cytotoxic effects can be simultaneously detected. This method proved to be reliable and reproducible, as well as very simple and cheap. In our recent publication, we used it in three different cancer cell lines (LNCaP, PC3 and MCF7) to efficiently determine and compare the toxicities of various drug analogs of the ER Ca2+ pump inhibitor thapsigargin (Tg) ( Sehgal et al., 2017 ). The use of PI for real-time analysis of cell death has been described and validated by others ( Wlodkowic et al., 2009 ; Zhao et al., 2010 ), but the analysis methods employed previously (e.g., flow cytometry, or lab-on-chip platforms) are more laborious and time-consuming than the simple analysis method we present here. In short, we quantify cell death using the integrated algorithms of the IncuCyte ZOOM software to calculate the confluence of PI-positive (red-fluorescent) cells and divide that by the total cell confluence (obtained by analysis of phase-contrast images). This simple analysis approach minimizes the time and efforts needed for data processing and analysis, and increases the throughput of the method. We have validated the method for cell death assessment through a side-by-side comparison with flow cytometry-based end-point measurements of PI-stained cells.
Materials and Reagents
In the current protocol we use:
96-well tissue culture plates (Corning, Falcon®, catalog number: 353072)
Sterile 50 ml tubes (VWR, catalog number: 525-0402)
0.2 µm filter with PES membranes (VWR, catalog number: 514-0073)
50 ml syringe (VWR, catalog number: 613-2053)
LNCaP cells (ATCC, catalog number: CRL-1740)
PC3 cells (ATCC, catalog number: CRL-1435)
RPMI1640 medium (Thermo Fisher Scientific, GibcoTM, catalog number: 21875)
Fetal bovine serum (Sigma-Aldrich, catalog number: F7524; use at 10% final concentration in RPMI 1640 medium to make complete growth medium)
Dimethyl sulfoxide (DMSO) (Sigma-Aldrich, catalog number: D2650)
0.25% Trypsin-EDTA (1x) (Thermo Fisher Scientific, GibcoTM, catalog number: 25200056)
PBS (Thermo Fisher Scientific, GibcoTM, catalog number: 20012)
Propidium Iodide (Merck, Calbiochem®, catalog number: 537059)
Thapsigargin (Sigma-Aldrich, catalog number: T9033)
Propidium iodide, 1 mg/ml stock solution in PBS (see Recipes)
Thapsigargin (Tg), 5 mM stock solution in DMSO (see Recipes)
Equipment
Multi-Channel pipette, 8-channel, 30-300 µl (Eppendorf, catalog number: 3122000051)
Autoflow IR Direct Heat CO2 Incubator (NuAire, model: NU-5510E)
IncuCyte ZOOM live-cell analysis system (Essen Bioscience, model: IncuCyte® ZOOM)
FACSCanto II Flow Cytometer (BD, BD Bioscience, model: FACSCanto II)
Software
IncuCyte ZOOM software (Essen Bioscience)
Flow cytometry Software (Perttu Terho)
Procedure
-
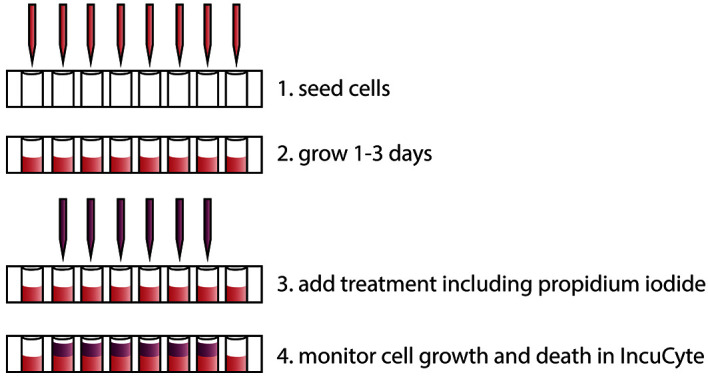
Seed cells in 100 µl complete growth medium in a 96-well plate using a multi-channel pipette, at a cell density whereby they will reach 40-80% confluence after 1-3 days (Figure 1).
Note: We seed approximately 2 x 10⁴ LNCaP cells and 2 x 10³ PC3 cells per well to obtain an appropriate confluence after 2 days. The assay can be adapted to other plate formats, like 384-well plates to include even more conditions.
Grow cells at 37 °C in a humidified incubator with 5% CO2 for 1-3 days.
-
Add the experimental treatments in 100 µl complete growth medium containing 5 µg/ml PI (200x dilution from the 1 mg/ml stock solution) directly to the wells. Include proper controls. For instance, treat cells with the same amount of vehicle as the experimental agent is dissolved in. Both treatments and PI should be 2x concentrated since they will be added to the 100 µl of cell medium that is in the wells (i.e., the final concentration of PI will be 2.5 µg/ml). In 96-well plates, it is advisable to exclude the outer wells from the experiment due to evaporation effects. To counteract evaporation effects in the rest of the wells, fill the outer wells with medium, or more conveniently, simply seed cells in all of the wells (in Step 1). Generally, we perform each treatment condition in three replicate wells.
Note: We routinely use 2.5 µg/ml PI. However it can be advisable to test out a dilution row of PI for new cell lines to define optimal concentrations.
-
Perform automated phase-contrast and red-fluorescent imaging using the IncuCyte ZOOM instrument placed in a normal humidified incubator at 37 °C with 5% CO2. Scans can be taken at any desired time interval. We generally record 3 images per well every 3 h at 10x magnification (image resolution: 1.22 µm/pixel) to monitor cell proliferation and death for the desired time frame (for instance 3 days, or as long as is meaningful for the particular experimental treatments/conditions and cell type used). Use the default settings for image acquisition time in the red channel (800 msec).
Note: The instrument uses the following excitation/emission wavelengths for the red channel: 565-605 nm/625-705 nm. The IncuCyte ZOOM also has 4x and 20x objectives (with image resolutions of 3.05 and 0.61 µm/pixel, respectively). However, we have only tested the protocol using the 10x objective, with which it is possible to capture 1-4 images per 96-well well at fixed positions in the wells (starting from the center of the well and outwards). We have not experienced that any specific portions of the well should be preferentially imaged and/or avoided. It should be entirely possible to use other live-cell imaging systems to capture and analyze the PI signal. However, we have only tested the protocol using the IncuCyte ZOOM instrument.
Figure 1. Overview of the procedure to monitor cell death in real time using propidium iodide and the IncuCyte ZOOM instrument.
Data analysis
-
Representative examples of data
When applying the protocol described above, and recording red fluorescence and phase-contrast images in real time over a range of drug concentrations and time points, cell death and cell growth curves are simultaneously obtained. This is illustrated in Figure 2, where we have treated LNCaP or PC3 prostate cancer cells with increasing concentrations of thapsigargin (Tg) for up to 70 h. Data obtained from the same wells can be analyzed for absolute cell confluence (Figure 2A), relative cell confluence (normalized to the 0 h time point–i.e., the time of treatment initiation–in Figure 2B), and cell death kinetics (Figure 2C). This combined output allowed us to identify experimental conditions where cell proliferation was inhibited, but no cell death occurred ( Sehgal et al., 2017 ). Such a cytostatic condition can be observed when comparing growth curves (Figures 2A and 2B) with cell death curves (Figure 2C) obtained with 6 or 12 nM Tg in LNCaP cells. Pictures taken by the IncuCyte ZOOM can be exported to visually demonstrate cell shrinkage and red-fluorescent PI staining (Figure 3).
In separate IncuCyte ZOOM experiments, we have validated that PI by itself does not affect cell proliferation in LNCaP, PC3, MCF7, and HCT116 cells (data not shown), thus providing further validation for the suitability of using live-dead stains such as PI for monitoring cell death in real-time ( Wlodkowic et al., 2009 ; Zhao et al., 2010 ).
Lastly, we have performed a side-by-side cell death assessment comparison using the protocol described here versus flow cytometry-based end-point PI-staining measurement. To that end, we treated PC3 cells with a range of Tg concentrations. After 42 h of treatment, we quantified cell death using the current protocol and subsequently harvested the cells to quantify cell death by flow cytometry, following a previously described protocol ( Crowley et al., 2016 ). As shown in Figure 4, we obtained comparable results with both methods, with similar dose response curves and virtually identical EC50 values.
In summary, the protocol presented here allows for the simultaneous assessment of cell death and cell growth in a reliable, easy, low-cost, and high-throughput manner.
-
Data analysis
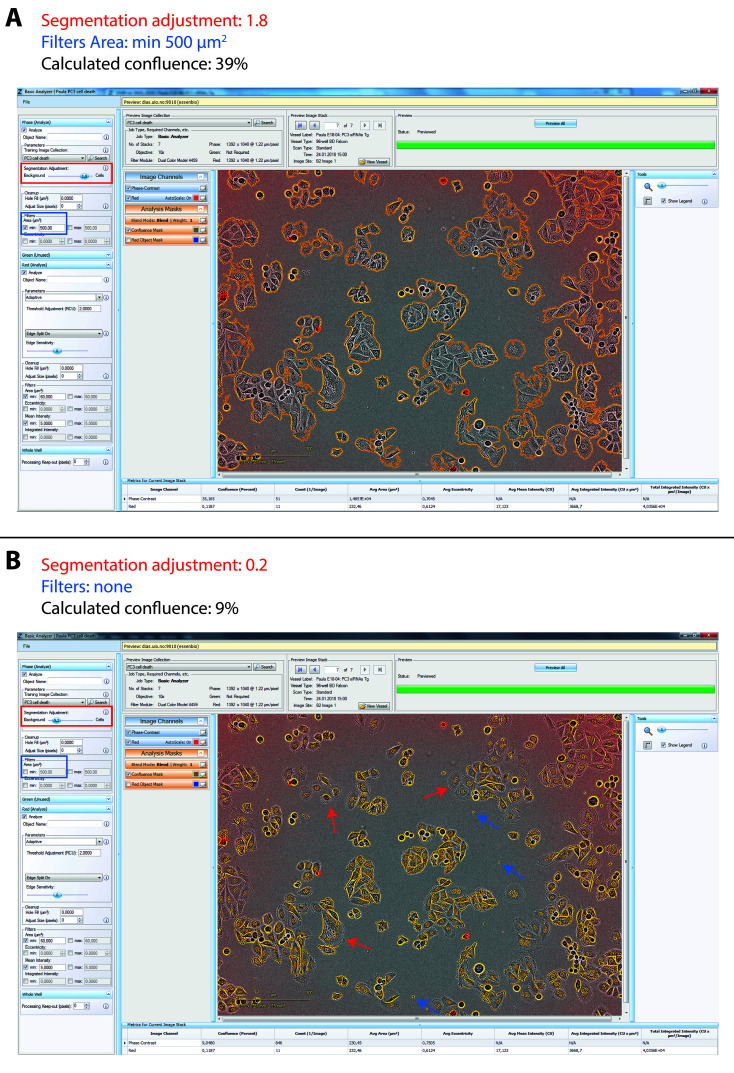
For data analysis, we use the integrated algorithms of the IncuCyte ZOOM software to calculate PI-positive cell confluence (based on the red fluorescence images) and total cell confluence (based on the phase-contrast images). The IncuCyte ZOOM software allows adjustments in the processing definition for analysis jobs to optimize the confluence mask for fluorescence and phase-contrast images, see Figure 5. The default settings are already quite accurate, but for most cell lines the settings for segmentation adjustment (a tool in the IncuCyte software to adjust for cell translucency) must be somewhat altered for the phase-contrast images (either towards the background or the cells, depending on cell translucency). Moreover, it is also useful to exclude small debris (for instance filtering out objects smaller than 500 µm2 is suitable for LNCaP and PC3 cells). Once suitable settings for a particular cell line have been defined, the same settings should be used in all subsequent experiments. The confluence values (the area covered by cells or red fluorescence in percentage of the total surface area) are exported for further processing, e.g., calculation of red fluorescence to total cell confluence ratios, normalization of total cell confluence values, and averaging of the values obtained from replicate wells. When plotting only cell confluence data (without showing red confluence data) to examine developments in cell densities over time (as in Figures 2A and 2B), it can be useful to set the cell confluence to 1 for the 0 h time point, to even out differences in seeding densities (as done in Figure 2B from the data shown in Figure 2A).
It should be noted that the approach presented here does not produce cell counts, and since dead/dying cells tend to be smaller than viable cells, and since PI only stains the cell nuclei, the red fluorescence to total cell confluence ratio may give a slight underestimation of the true percentage of cell death in the culture. This can be seen for PC3 cells in Figure 4. Thus, the protocol described here can be used to reliably compare the relative extent and kinetics of cell death, but not the actual percentage of dead cells. The advantages are the high-throughput and consistent, real-time data obtained.
Figure 2. Analysis of cell confluence and cell death using the IncuCyte ZOOM system.
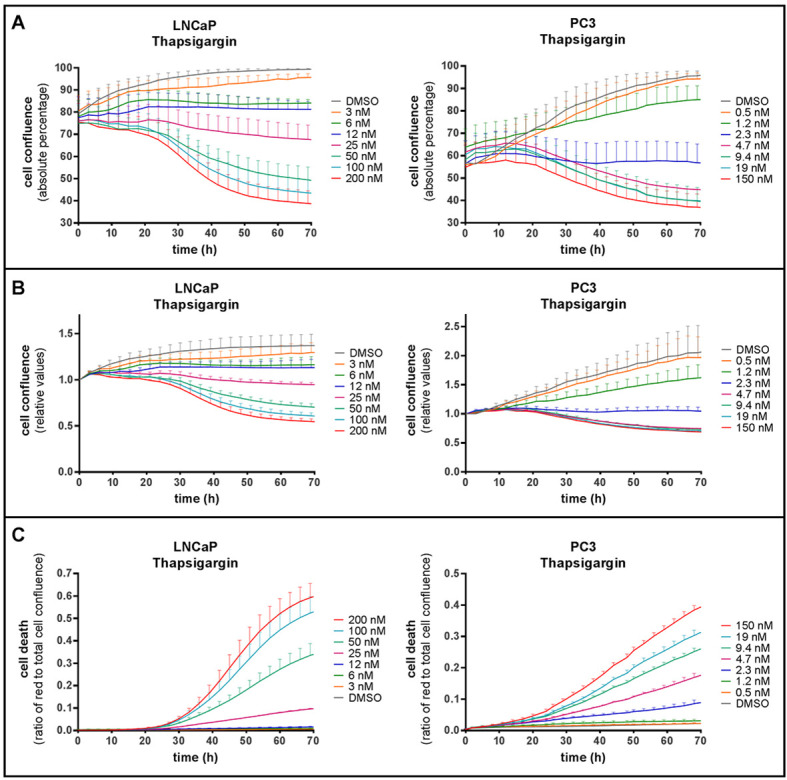
LNCaP (left) or PC3 (right) cells were treated with DMSO or increasing concentrations of thapsigargin, as indicated, in the presence of 2.5 µg/ml PI. A and B. Cell confluence (the proportion of the surface covered by cells, as determined by phase-contrast images) of LNCaP and PC3 cells plotted over time as absolute percentage (A) or relative to start confluence (B). C. The ratio of red fluorescent (PI-positive) to total cell confluence plotted over time. Means ± SEM of 3 (LNCaP) or 6 (PC3) independent experiments.
Figure 3. Examples of live-cell images using the IncuCyte ZOOM system.
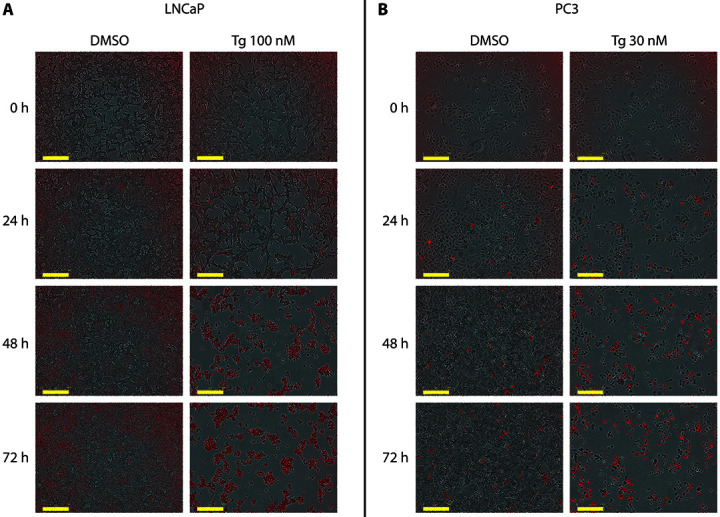
Overlayed phase-contrast and fluorescence images (10x magnification) of LNCaP (A) and PC3 (B) cells after 0 h, 24 h, 48 h and 72 h of treatment with DMSO or thapsigargin (Tg), in the presence of PI. Scale bar represents 300 µm.
Figure 4. Direct comparison of PI-based cell death analysis using the IncuCyte ZOOM or Flow Cytometry.
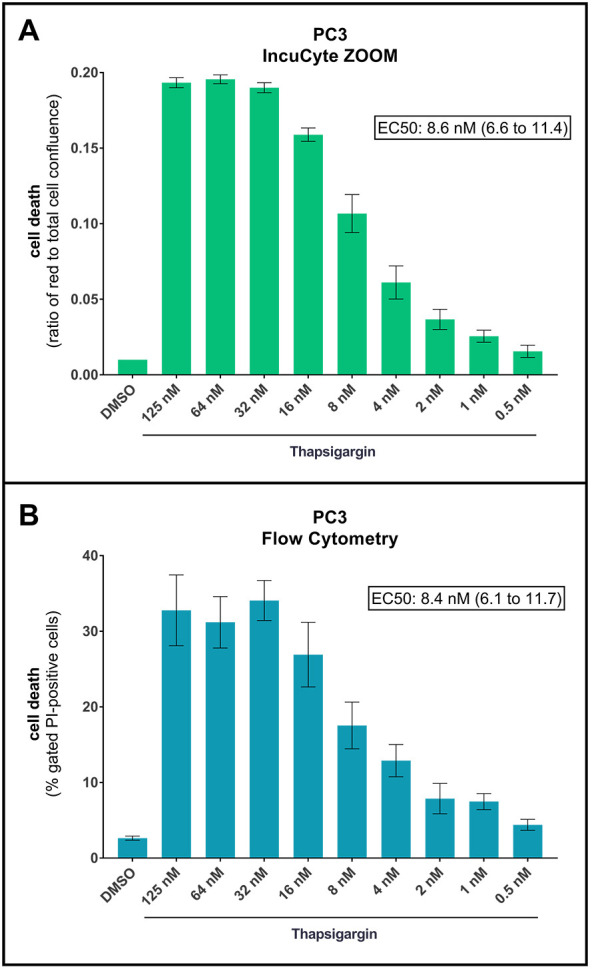
PC3 cells were treated for 42 h with DMSO or increasing concentrations of thapsigargin, as indicated, in the presence of PI. Cell death was first analyzed by live-cell imaging using the IncuCyte ZOOM (A), and subsequently by flow cytometry (using BD Bioscience FACSCanto II and the Flowing Software by Perttu Terho) from the same wells (B). For flow cytometry, the cells were harvested with 0.25% Trypsin-EDTA (1x), and 10,000 events were acquired and analyzed as previously described ( Crowley et al., 2016 ). Cellular debris were excluded by gating forward/side scatter plots, and PI-positive cells were gated based on forward scatter/PI fluorescence plots, as described ( Crowley et al., 2016 ). Shown are ratios of red fluorescence to total cell confluence (A) and percentages of gated PI-positive cells (B). Means ± SEM of 3 independent experiments. EC50 values of the maximal thapsigargin effect (with 95% Confidence Intervals) are shown.
Figure 5. Examples of confluence mask adjustment using the IncuCyte ZOOM system.
Screenshots of the IncuCyte ZOOM software Analyzer tool for confluence mask (yellow outlines). A. Appropriate adjustment for PC3 cells with segmentation adjustment of 1.8 towards cells (red rectangle) and Filter for areas smaller than 500 µm2 (blue rectangle). B. Example of inappropriate adjustment for PC3 cells with segmentation adjustment of 0.2 towards background (red rectangle) and no Filter (blue rectangle). Marked with arrows are examples of cells/parts of cells which are not included in the confluence mask (red arrows) and debris which are not filtered out (blue arrows). Due to incorrect segmentation adjustment the calculated confluence is too low (9% instead of 39%).
Recipes
-
Propidium iodide, 1 mg/ml stock solution in PBS
Weigh out 40 mg PI in a sterile 50 ml tube and add 40 ml 37 °C pre-heated, sterile PBS
Rotate the tube until the PI is dissolved. This may take a while (more than 1 h)
Sterile filter through a 0.2 µm filter into a new sterile 50 ml tube
The stock solution is stable for years when stored at 4 °C and protected from light
-
Thapsigargin (Tg), 5 mM stock solution in DMSO
Dissolve 5 mg Tg in 1.54 ml sterile DMSO by pipetting (Tg dissolves very easily)
The stock solution is stable for years when stored at -20 °C
Acknowledgments
This work was financially supported by the Research Council of Norway, the University of Oslo, the Anders Jahre Foundation, the Nansen Foundation, the Legacy in the memory of Henrik Homan, and the Lundbeck Foundation. The protocol was first described in the methods section of Sehgal et al., 2017 . The authors declare that they have no conflicts of interest.
Citation
Readers should cite both the Bio-protocol article and the original research article where this protocol was used.
References
- 1. Crowley L. C., Scott A. P., Marfell B. J., Boughaba J. A., Chojnowski G. and Waterhouse N. J.(2016). Measuring cell death by propidium iodide uptake and flow cytometry. Cold Spring Harb Protoc 7: pdb.prot087163. [DOI] [PubMed] [Google Scholar]
- 2. Sehgal P., Szalai P., Olesen C., Praetorius H. A., Nissen P., Christensen S. B., Engedal N. and Moller J. V.(2017). Inhibition of the sarco/endoplasmic reticulum(ER) Ca2+-ATPase by thapsigargin analogs induces cell death via ER Ca2+ depletion and the unfolded protein response . J Biol Chem 292(48): 19656-19673. [DOI] [PMC free article] [PubMed] [Google Scholar]
- 3. Wlodkowic D., Skommer J., McGuinness D., Faley S., Kolch W., Darzynkiewicz Z. and Cooper J. M.(2009). Chip-based dynamic real-time quantification of drug-induced cytotoxicity in human tumor cells. Anal Chem 81(16): 6952-6959. [DOI] [PMC free article] [PubMed] [Google Scholar]
- 4. Zhao H., Oczos J., Janowski P., Trembecka D., Dobrucki J., Darzynkiewicz Z. and Wlodkowic D.(2010). Rationale for the real-time and dynamic cell death assays using propidium iodide. Cytometry A 77(4): 399-405. [DOI] [PMC free article] [PubMed] [Google Scholar]


