
Fig. 6.
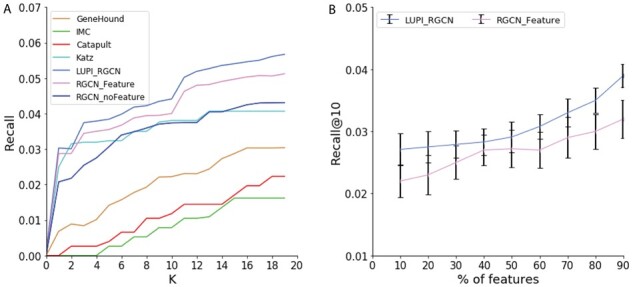
Performance comparison of different models on the singleton genes association prediction. (A) Recall@K of different models. The x-axis indicates the top K predictions. (B) Recall@10 of model LUPI_RGCN and RGCN when using different percent of features in the test data