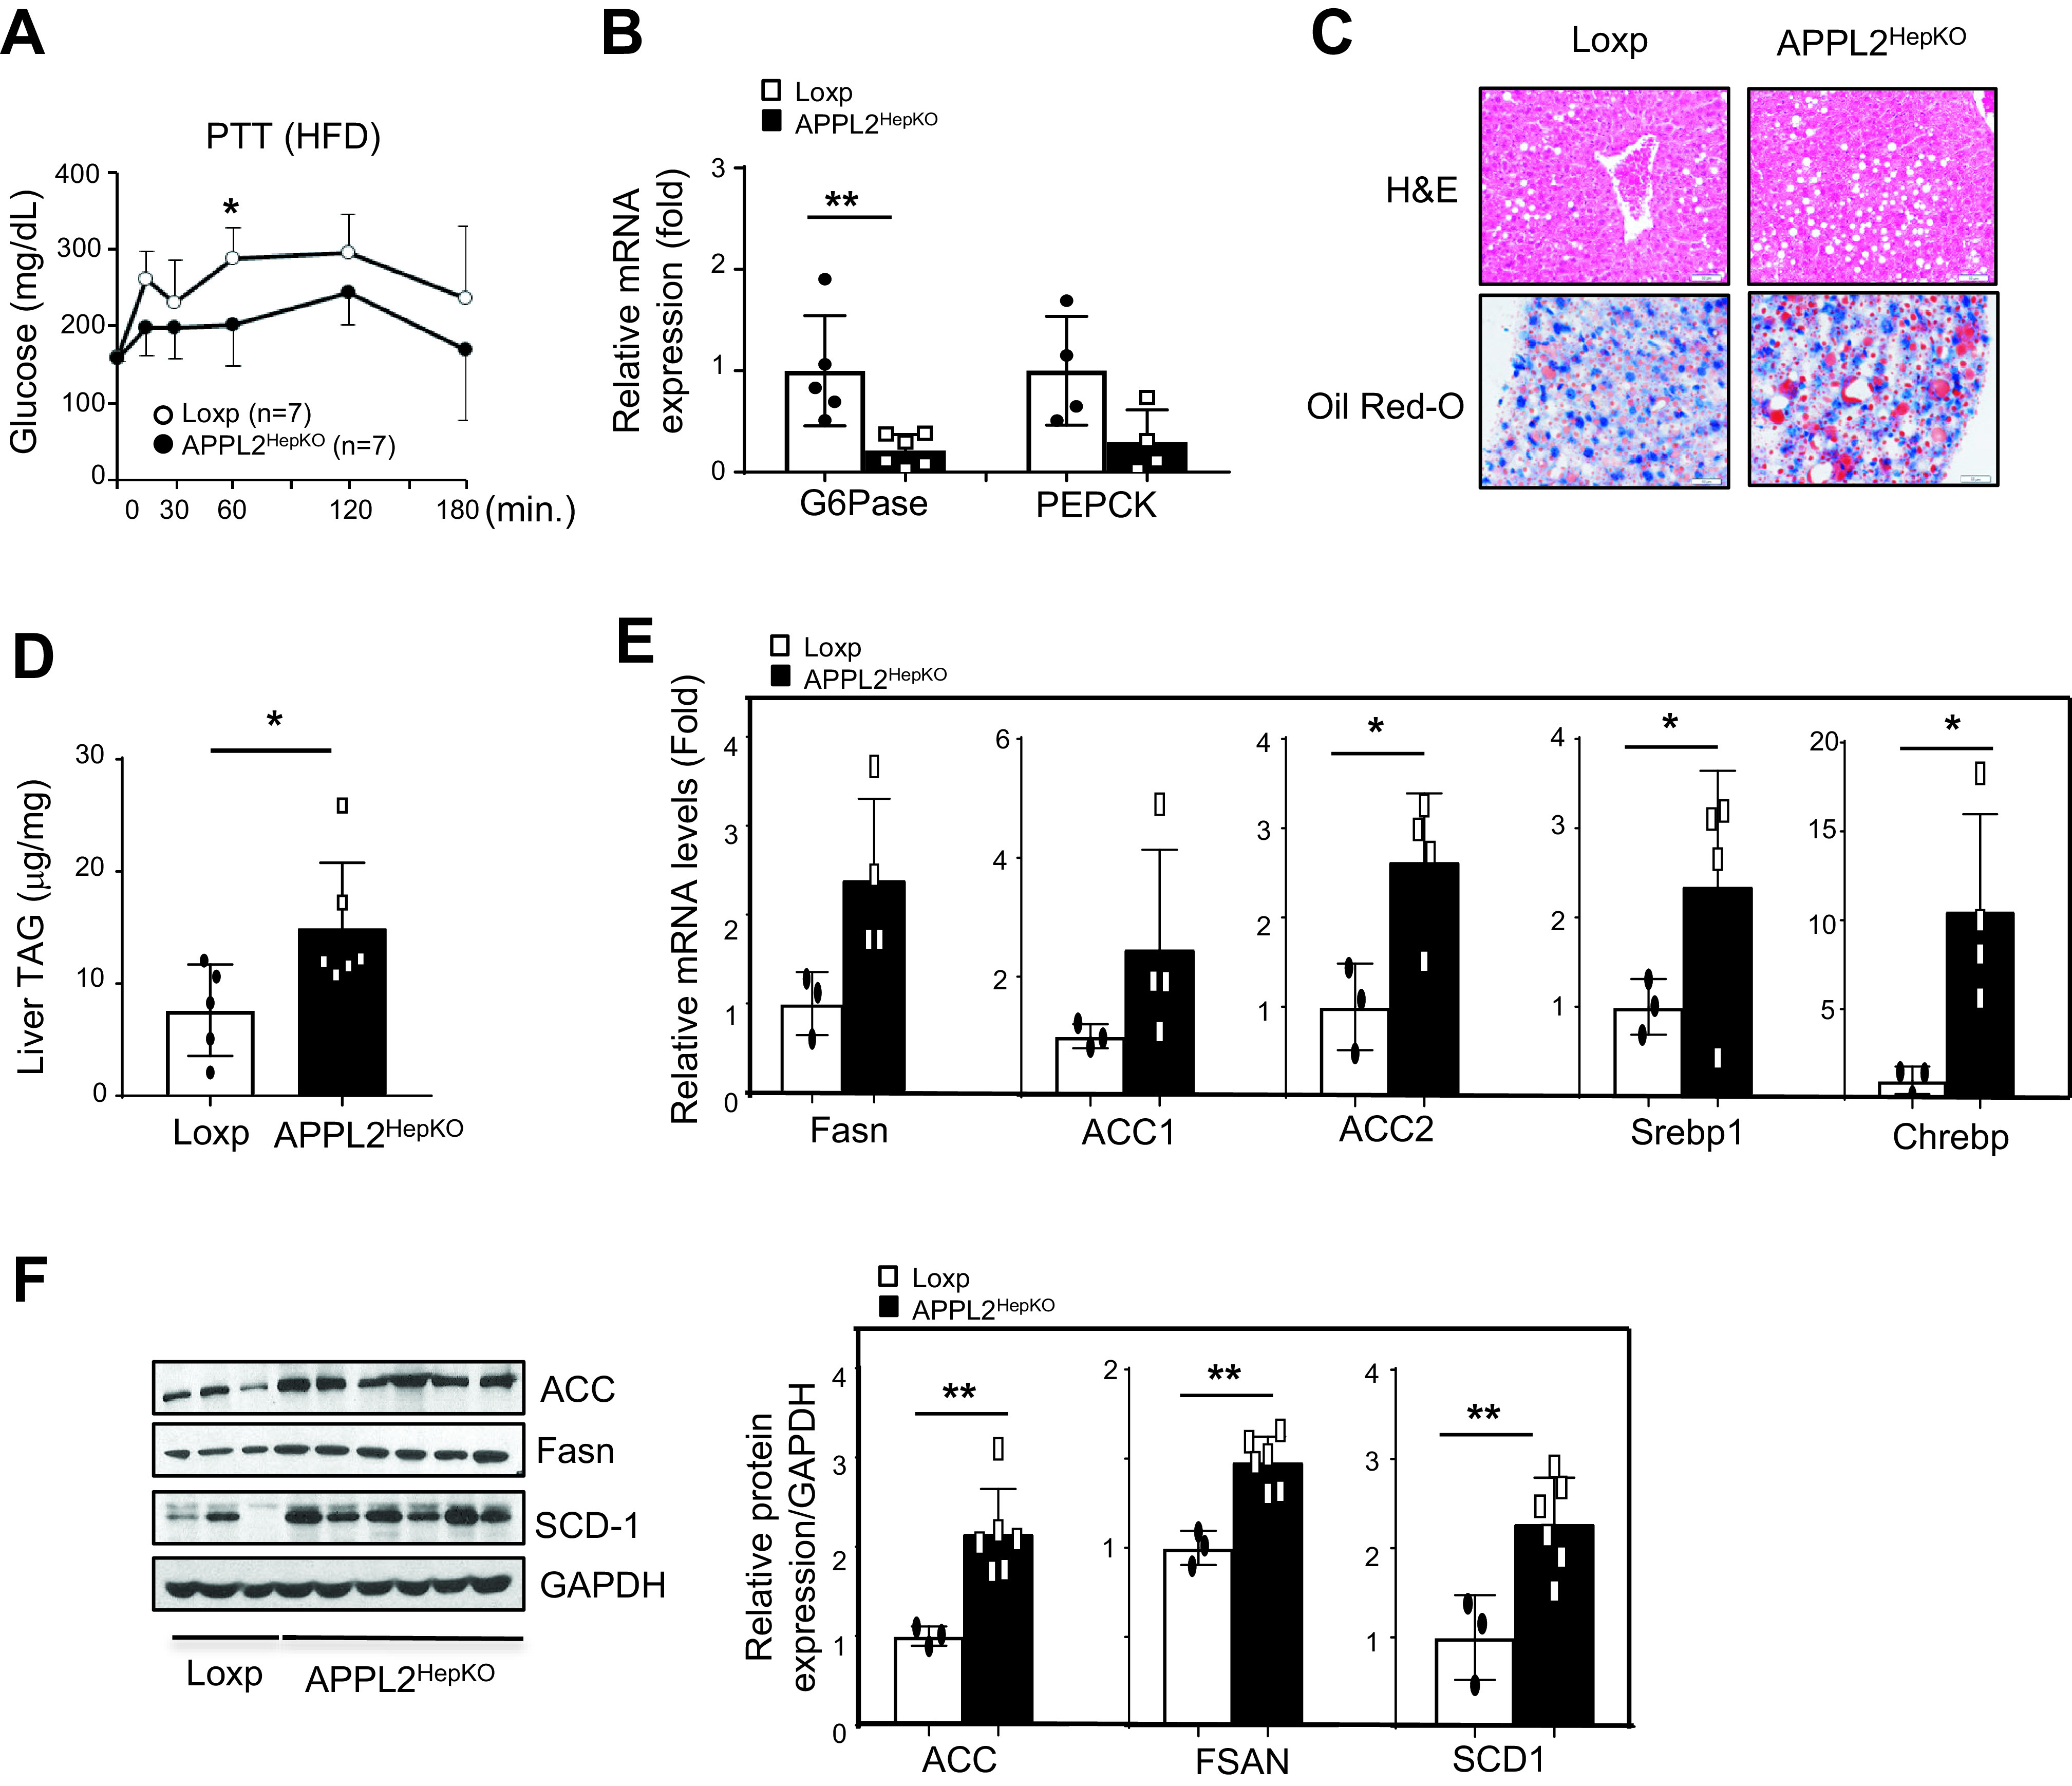
Figure 2.

APPL2HepKO mice have reduced gluconeogenesis and enhanced lipogenesis under HFD feeding. A: Pyruvate tolerance test (PTT) of the KO and Loxp mice under 14 weeks HFD. B: mRNA expression of gluconeogenic genes in the mouse liver tissues. C: Hematoxylin-eosin (H&E) staining of the mouse liver tissues. Lipid accumulation in liver tissues was detected by Oil Red O staining. The scale bar indicates 50 μm. D: TAG contents in the mouse liver tissues. E: mRNA levels of lipogenic genes in liver tissues. F: Protein levels of lipogenic genes in the mouse liver tissues. Bar graphs represent the relative protein expression over the levels of GAPDH. All results are presented as mean ± SD, and P values were calculated with use of two-way ANOVA or Student t test (*P < 0.05 and **P < 0.01). hr, hour
