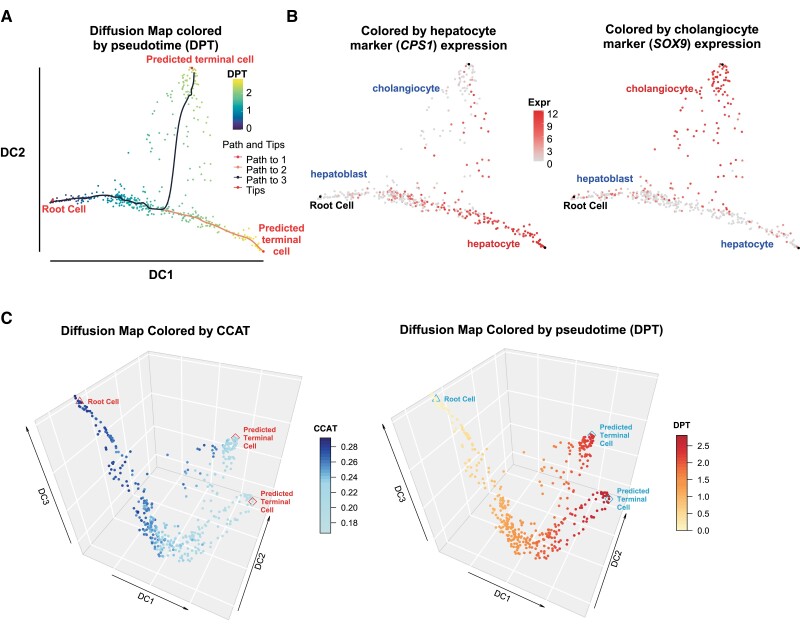
Fig. 2.
Using CCAT to infer root-state and lineage trajectories in liver development. (A) Two-dimensional diffusion map plot displaying the root-cell as identified with CCAT, and the lineage trajectories into hepatocytes and cholangiocytes, with cells colored according to diffusion pseudotime (DPT). (B) As (A), but now with cells colored according to CPS and SOX9 expression, which are markers for hepatocytes and cholangiocytes, respectively. (C) Three dimensional diffusion map plot, displaying the positioning of the cells along the top 3 DCs, with cells colored by the estimated CCAT values (left panel) and diffusion pseudotime (right panel)

