Abstract
Flow-cytometric demonstration of the typical chronic lymphocytic leukemia (CLL) immunophenotype is vital for diagnosis. CLL has a characteristic immunophenotype, expressing CD5, CD19, dim CD20, dim CD22, CD23, bright CD43, dim CD45, dim to negative CD79b, dim CD81, CD200, and dim monoclonal surface immunoglobulin. This characteristic immunophenotype allows a definitive diagnosis and the ruling out of another leukemia or lymphoma. Flow cytometry also provides important prognostic information and accurate assessment of response to therapy. Here we describe optimal specimen collection, red cell lysis, appropriate panel, cell staining, acquisition on a flow cytometer, and analysis for CLL specimens.
Keywords: Flow cytometry, Immunophenotype, Chronic lymphocytic leukemia, Minimal residual disease
1. Introduction
Chronic lymphocytic leukemia/small lymphocytic lymphoma (CLL/SLL) is a neoplasm of mature B-lymphocytes involving peripheral blood (PB), bone marrow (BM), and secondary lymphoid tissues (spleen, lymph nodes). CLL is the most common leukemia of adults in western countries and it accounts for 7% of non-Hodgkin lymphomas. The diagnosis is established by blood count, morphology, and immunophenotyping by flow cytometry (FC) of circulating B-lymphocytes [1].
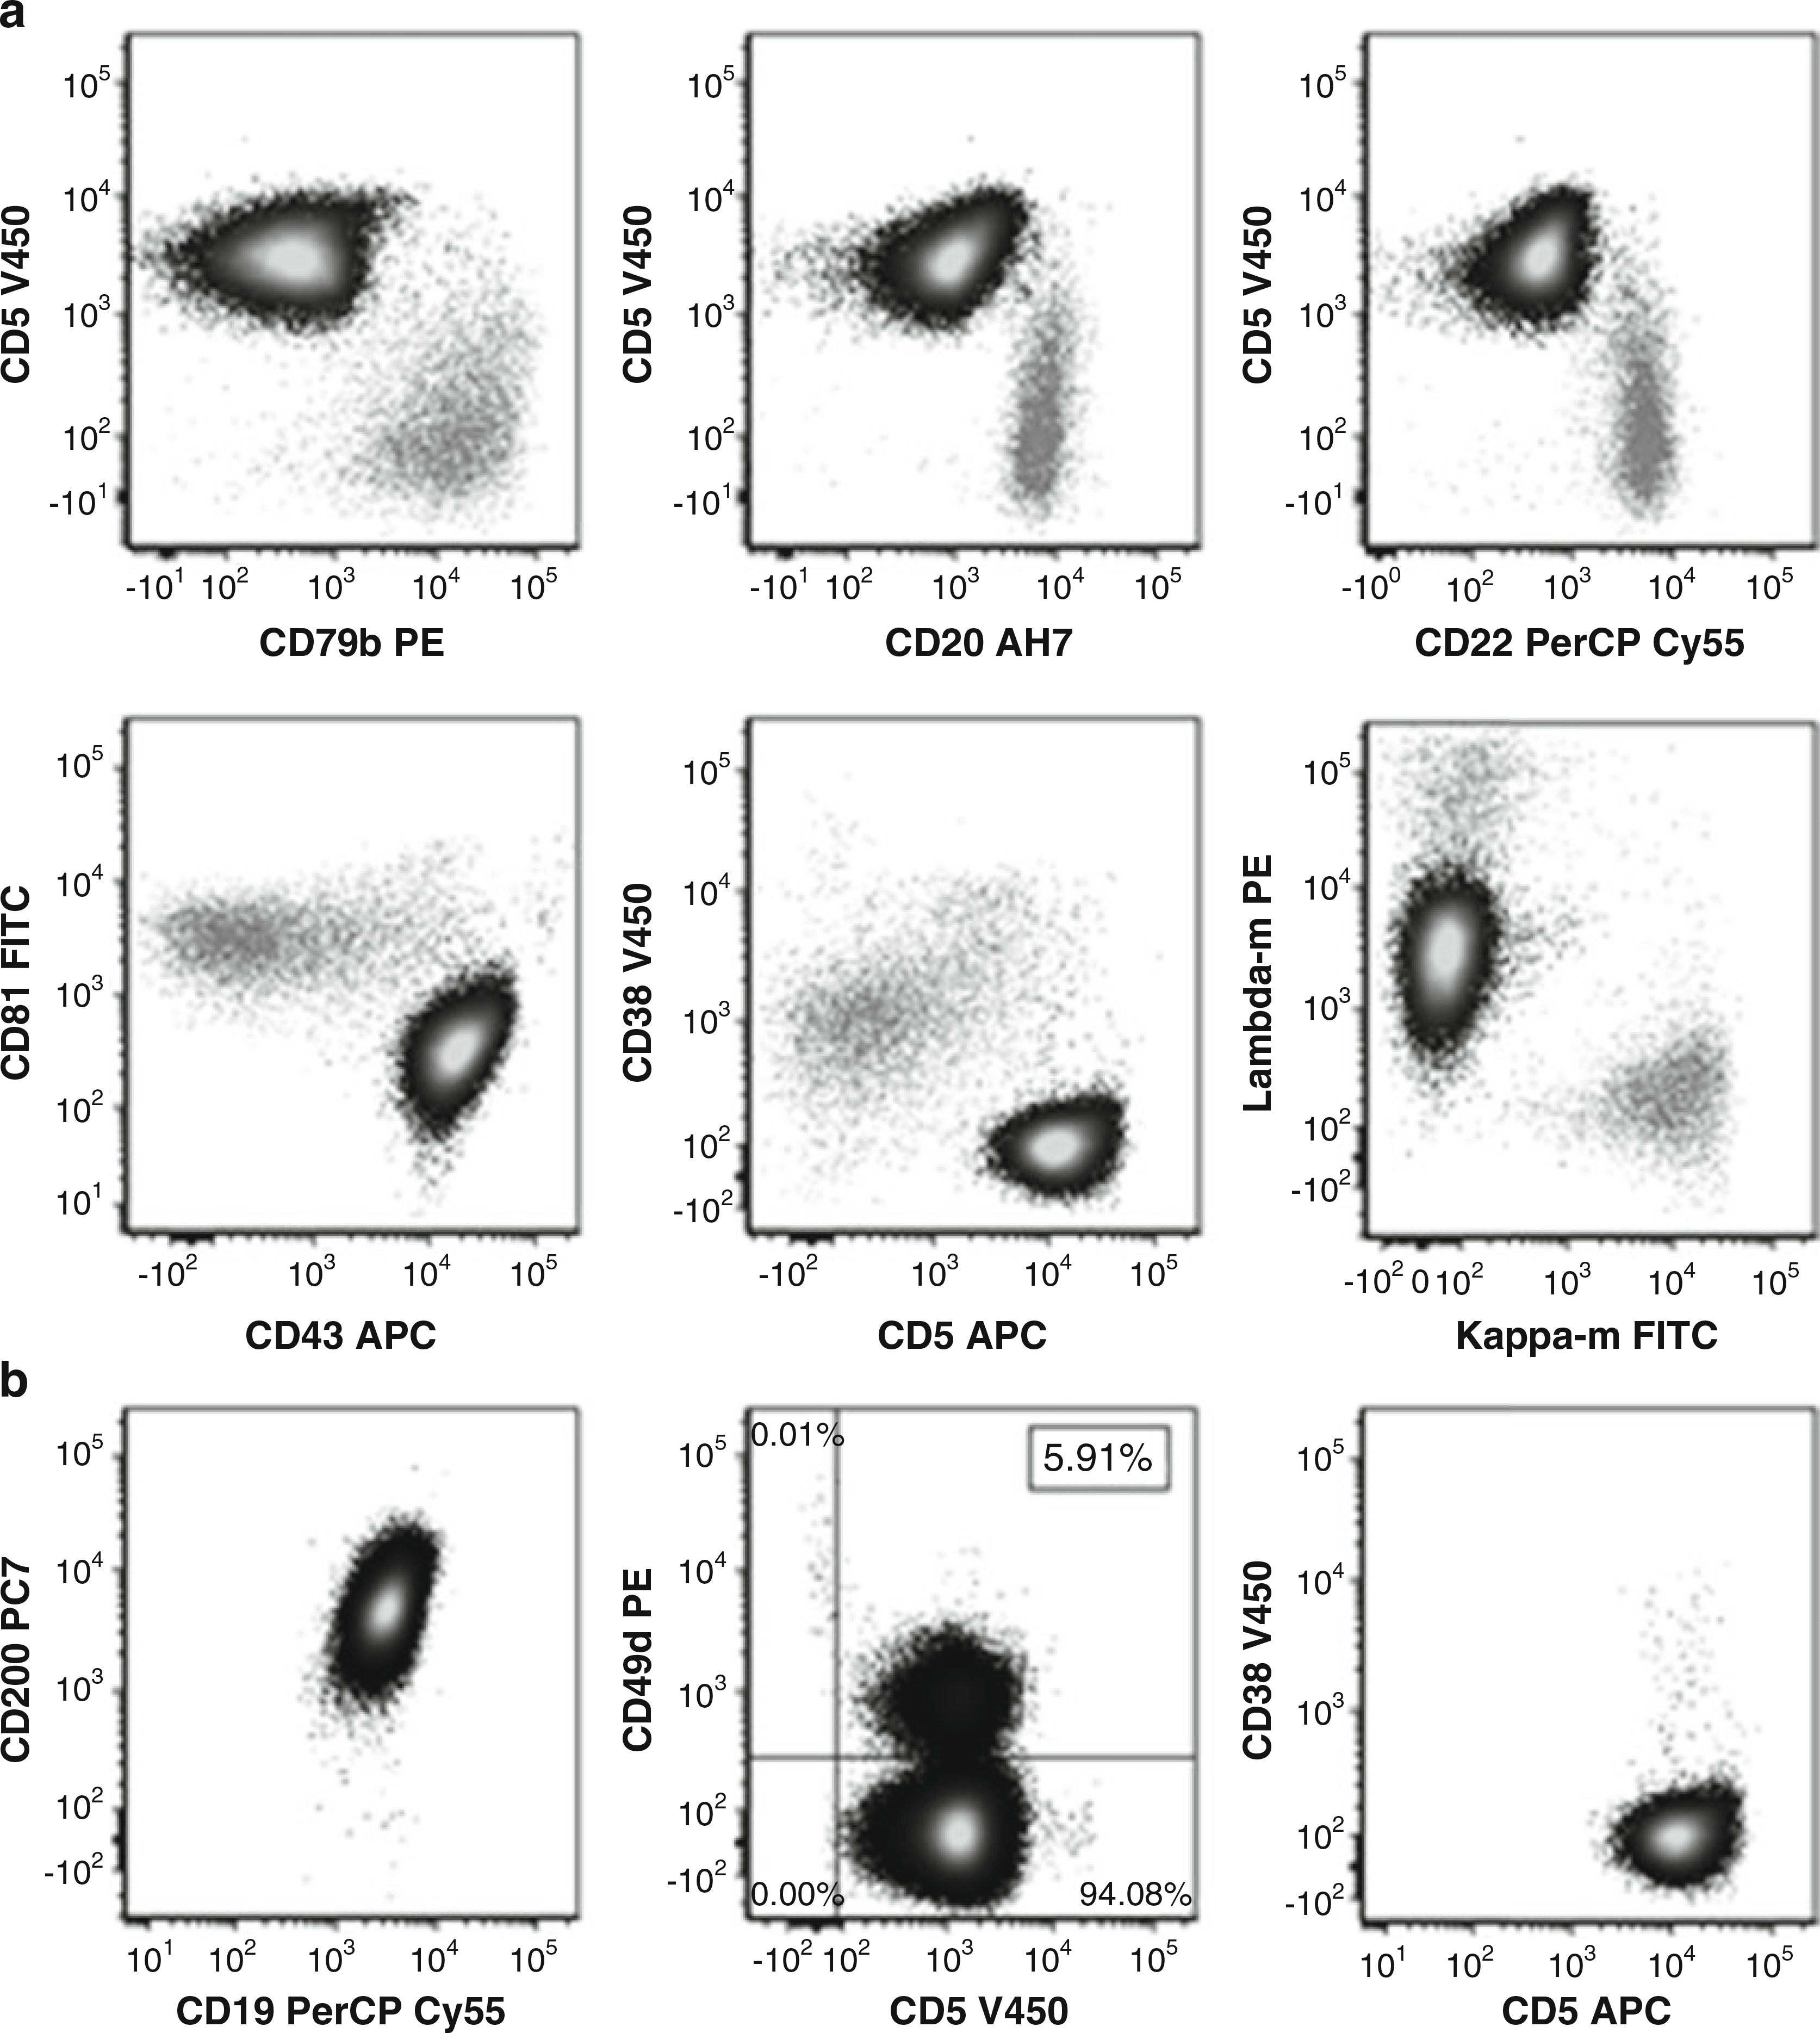
FC demonstration of the typical CLL immunophenotype is vital for diagnosis. CLL typically displays a characteristic immunophenotype, expressing CD5, CD19, dim CD20, dim CD22, CD23 (see Note 1), bright CD43, dim CD45, dim-to-negative CD79b, dim CD81, CD200, and dim monoclonal surface immunoglobulin (Ig) (Fig. 1) [2] but negative for CD10, CD103, and CD123 as well as other T-cell and myeloid antigens [3, 4]. Diagnosis of CLL requires ≥5 × 10³/μl circulating monoclonal B-lymphocytes with a CLL immunophenotype in the PB. The term SLL designates the cases with a circulating CLL cell count <5 × 10³/μl and recognized nodal, splenic, or other extramedullary involvement. The differential diagnosis of CLL/SLL primarily includes monoclonal B-cell lymphocytosis (MBL) and mantle cell lymphoma (MCL). MBL is the presence of <5 × 10³/μl circulating monoclonal B-lymphocytes in absence of any associated lymphadenopathy, organomegaly, extramedullary involvement, or any other feature of B-cell lymphoproliferative disorders [5]. MBL CLL-type (75% of MBL cases) has an immunophenotype identical to CLL. The expression of CD200 and CD23 in combination with dim CD20, CD22, CD45, CD79b, and CD81 as well as bright CD43 differentiates CLL from MCL [4]. Infrequently CLL cases may have an atypical immunophenotype such as lack of CD5 and CD23, normal intensity of CD20, CD22, and CD79b, aberrant expression of T-cell, myeloid or other B-cell antigens [6–8].
Fig. 1.

(a) Gated on CD19 positive lymphocytes. Abnormal CLL cells (black) with normal B-cells (gray) in background. CLL cells are positive for CD5, have bright CD43, and have dim CD79b, CD20, CD22, and CD81. CD38 is negative. The CLL cells are monoclonal, dim positive for lambda surface light chain and negative for kappa surface light chain. (b) Gated on abnormal CLL cells. Cells are CD200 positive. Prognostic markers CD49d (less than 30% positive) and CD38 are negative
In addition to its role in diagnosis of CLL, FC also provides important prognostic information. CD38 expression in 30% or greater of the CLL cells was found to be associated with aggressive clinical course and to correlate with Ig heavy chain mutational status [9–11]. CD49d expression by 30% or greater of the CLL cells is an independent indicator of CLL prognosis and is superior to CD38 in predicting clinical progression in CLL patients. CD49d in CLL is associated with unfavorable cytogenetic profile and is particularly associated with trisomy12 [12, 13]. CD49d expression is stable over time and determination of a positive or negative status is straightforward [14, 15]. FC detection of minimal residual disease (MRD) levels during and after therapy has also been shown to be an independent predictor of progression-free and overall survival in CLL [16, 17].
2. Materials
2.1. Lysing Solution (1×)
Weigh 8.29 g ammonium chloride (NH4Cl) and 1 g potassium bicarbonate (KHCO3) and place them into 1000 ml glass or clear plastic bottle.
Add 4 ml 0.5 M EDTA solution, and fill to a volume of 1000 ml with distilled water (H2O). Cap and mix well.
Store at room temperature for up to 6 months.
2.2. Wash Solution: Phosphate Buffered Saline (PBS) with 10% Bovine Serum Albumin (BSA) and Sodium Azide
Weigh 4 g BSA and add to 4 l of 1× PBS with 0.1% sodium azide. Cap and mix well by inverting several times. Allow wash solution to sit at room temperature for 30 min, mix again, and check to be sure the BSA has dissolved.
Perform pH testing after BSA is in solution and while the solution is at room temperature. Adjust pH to 7.3–7.5 by adding small amounts of concentrated HCL (if the pH is >7.5) or concentrated NaOH (if the pH is <7.3) (see Notes 2 and 3).
Store at 4 °C for 2 months from preparation.
2.3. Fixative: 0.5% Formalin Fixative Solution
Mix 50 ml of 10% buffered formaldehyde with 950 ml of PBS in a bottle, cap and mix well (see Note 4).
Wrap bottle with foil and tape to protect from light. Check PH and adjust to 7.3–3.5 (see Subheading 2.2).
Store at room temperature for up to 1 year.
3. Method
3.1. Cocktails and Panels
The panel in Table 1 is an example of an 8 color panel that can be used to diagnose CLL and monitor disease post therapy. Each cocktail is made by addition of the appropriate volumes of different Antibody (Ab) as recommended by the vendor and/or titration. The amount of the cocktail to be added during staining tube (Subheading 3.6, step one below) is based on the sum of the different Ab volumes in this cocktail. The cocktail should be stored at 4 °C and light exposure minimalized. The stability of these cocktails should be determined by each clinical laboratory.
Table 1.
Antibody panel for CLL diagnosis/follow-up
| FITC | PE | PerCP | PC7 | APC | AH7 | v450 | v500 | |
|---|---|---|---|---|---|---|---|---|
| 1 | CD103 | CD25 | CD123 | CD19 | CD23 | CD20 | CD11c | CD45 |
| 2 | CD81 | CD79b | CD22 | CD19 | CD43 | CD20 | CD5 | CD3 |
| 3 | Kappa-m | Lambda-m | CD20 | CD19 | CD5 | CD14 | CD38 | CD45 |
3.2. Specimen Collection
PB and BM are the primary samples to be examined, although lymph node (LN) biopsy or fine needle aspiration (FNA) may be indicated. PB and BM specimens collected in sodium heparin are stable at room temperature for up to 72 h and 24 h respectively while EDTA PB and BM specimens are stable for 24 and 12 h respectively. Improper or lengthy specimen storage can negatively impact results. Overnight shipment of specimens with the possibility of exposing the specimen to temperature extremes has been shown to alter antigen expression [18]. An LN biopsy must be made into a cell suspension using mechanical tissue disaggregation (using commercial devices or manual tools). FNA samples usually do not require additional disaggregation. FNA or cell suspension can be stored in RPMI with 10% fetal bovine serum for up to 18 h at 4 °C.
3.3. Pre-lysis, Cell Count, and Viability Assessment [18, 19]
Minimizing sample treatment before staining and timely sample processing greatly reduces the risk of losing cells of interest (especially in case of CLL MRD) and maintains cell viability and integrity.
Transfer ≤5 ml of either PB or BM into labelled 50 ml conical tube(s).
Add ammonium chloride lysing Solution (see Subheading 2.1) to fill each conical tube. Cap and invert several times to mix. Incubate 10 min room temperature, inverting to mix occasionally and at end.
Centrifuge tubes at 500 × g for 5 min, check for pellet and aspirate or decant supernatant into waste container (see Note 5).
Cap and vortex tube(s) gently for less than 5 s to dislodge pellet (s). Fill the tube with PBS, cap, and invert to mix. Repeat step 3 above (see Note 6).
Cap and vortex tube gently to dislodge the entire cell pellet. Add PBS to the cell pellet according to the pellet size (0.2–2 ml for small pellets and 3–5 ml for larger pellets), and flick or vortex gently to mix. Record the final cell suspension volume to be used later to adjust the cell count.
Assess viability and perform a cell count by using a viability dye that is excluded from viable cells and automated cell counters or a hemocytometer [20]. Samples with less than 75% viability should be rejected unless the sample is irreplaceable.
3.4. Cell Concentration Adjustment
Divide the total WBCs count (obtained by multiplying the cell count in the “count” tube by the dilution factor multiplied by the preparation volume in Subheading 3.3, step 5) by the target WBCs count to get the amount of the required final volume. Example: if the total WBCs count = 15.0 × 10⁶ and the target count is 20 × 106/ml, then the final volume should be 0.75 ml.
Adjust the final volume of the cell suspension to reach the target cell concentration of 20 × 106 cells/ml (see Note 7).
3.5. Staining Cells with Antibodies [18, 19 ]
Deliver the appropriate volume of the premade cocktail (Subheading 3.1) to the bottom of the labeled 12 × 75 mm tubes using automatic pipette.
Add 100 μl patient cell preparation to each tube and vortex briefly to mix. Incubate 30 min at room temperature protected from the light.
Wash stained tubes by adding 3–4 ml wash solution to each tube; vortex to mix then centrifuge at 500 × g for 5 min, check for pellet and aspirate or decant tube into waste container, flick or vortex tube to dislodge entire cell pellet.
Repeat wash step 3 above.
Add 200–300 μl formalin fixative and vortex to mix and store stained and fixed cells at 4 °C until acquisition (see Note 8).
3.6. Acquisition
Data is acquired on a cytometer. Care should be taken not to exclude low FSC events. Acquisition of ungated data is stored as list mode data. 1,000,000 to 2,000,000 events (dependent on level of MRD detection required) are acquired when cellular content is adequate. In specimens with low cell count (e.g., FNA) acquire as many events as possible. Acquiring a high number of events is crucial for MRD detection. At the minimum all fluorescence channels, time, FCS-A, FSC-H and SSC-A should be acquired.
3.7. Analysis
Sequential gating of the list mode data is performed to distinguish abnormal cells of interest from normal cells based on light scatter and antigen profile. An example of a typical sequence of hierarchical analysis gating follows:
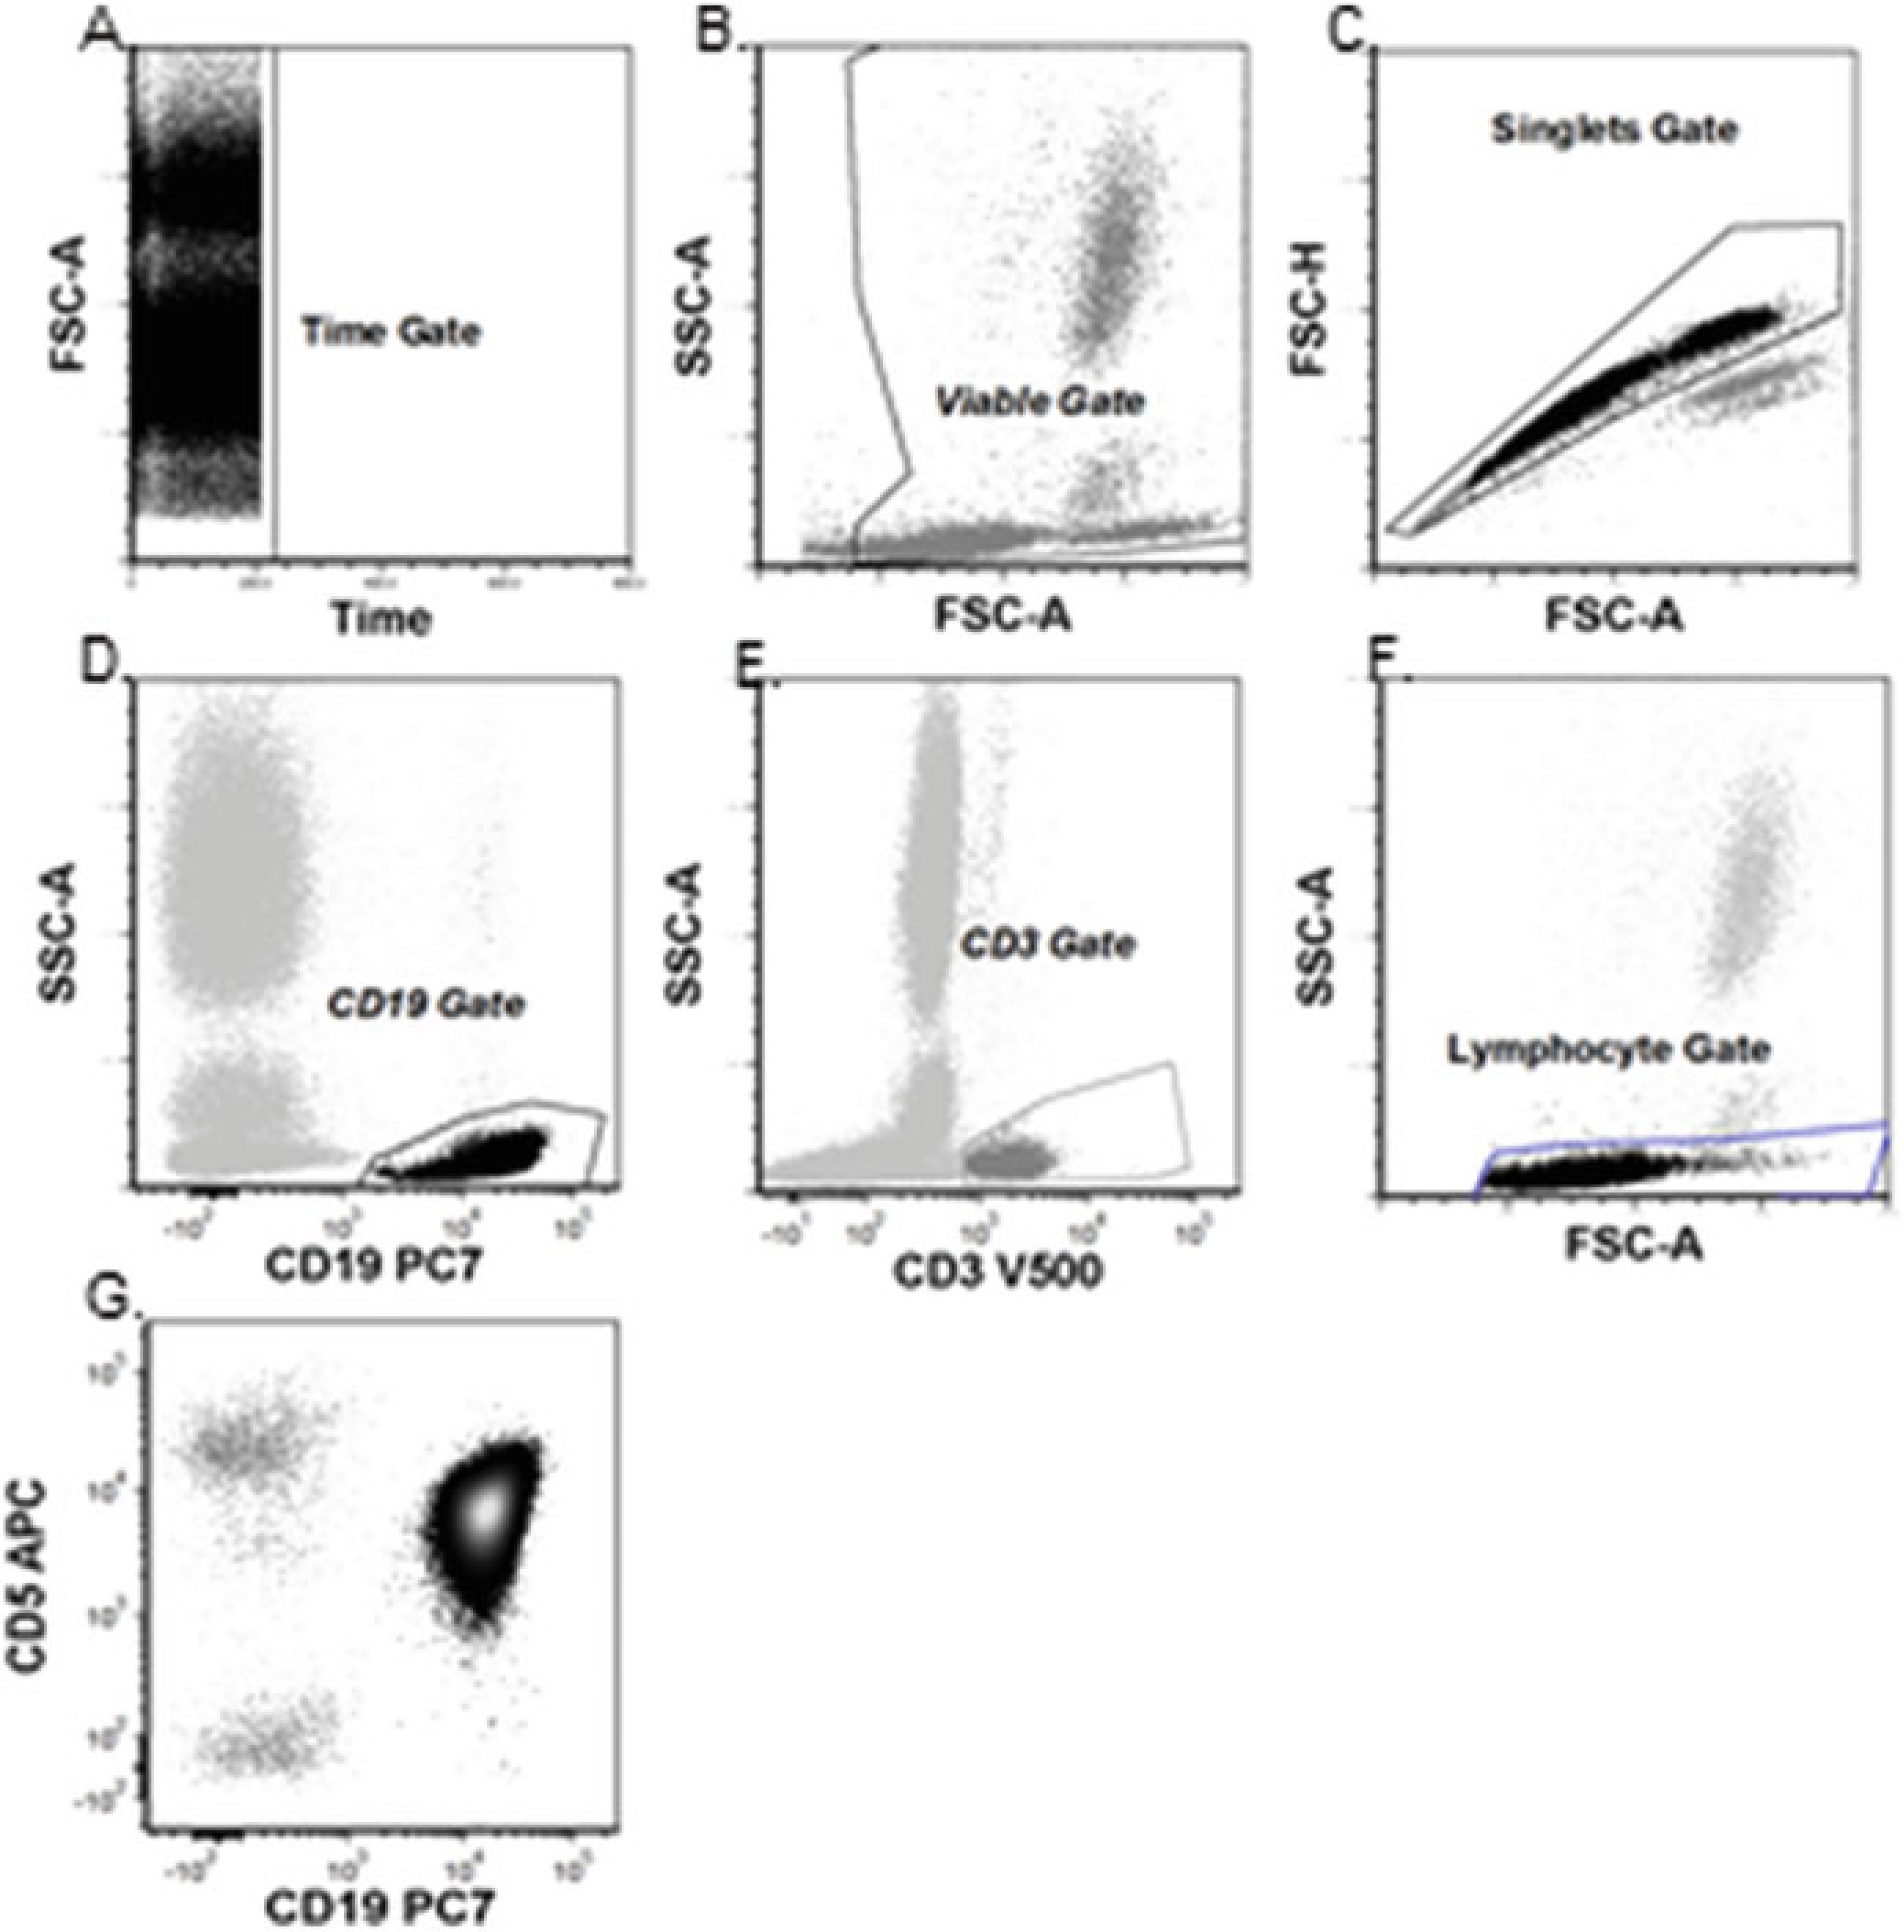
The FSC-A vs. time plot of ungated cells is evaluated for discontinuity indicating fluidic disturbances (e.g. bubbles, clogs, or in the case of low cell number the tube being acquired dry). A time gate is drawn to exclude such events (Fig. 2).
A viable gate is drawn on the time gated SSC-A vs. FSC-A plot to exclude debris with very low scatter properties (Fig. 2) and is placed under the time gate.
A singlets gate is drawn on the viable gated FSC-H vs. FSC-A plots to exclude doublets (Fig. 2) and is placed under the viable gate.
Antigen vs. SSC gates are drawn to define T-cells (CD3+) and B-cells (CD19+) (Fig. 2) and placed under the singlet gate.
The antigen based gates are displayed on a FSC-A vs. SSC-A plot to create a scatter gate that includes all lymphocytes (Fig. 2). This lymphocyte gate is placed under the singlet gate.
The antigen profile of the lymphoid cells is evaluated under the lymphocyte and B cell antigen gates to identify the CLL immunophenotype (Fig. 1).
- For MRD assessment, low level CLL involvement must be detected among a predominately polyclonal B-cell background. There are two general analysis approaches.
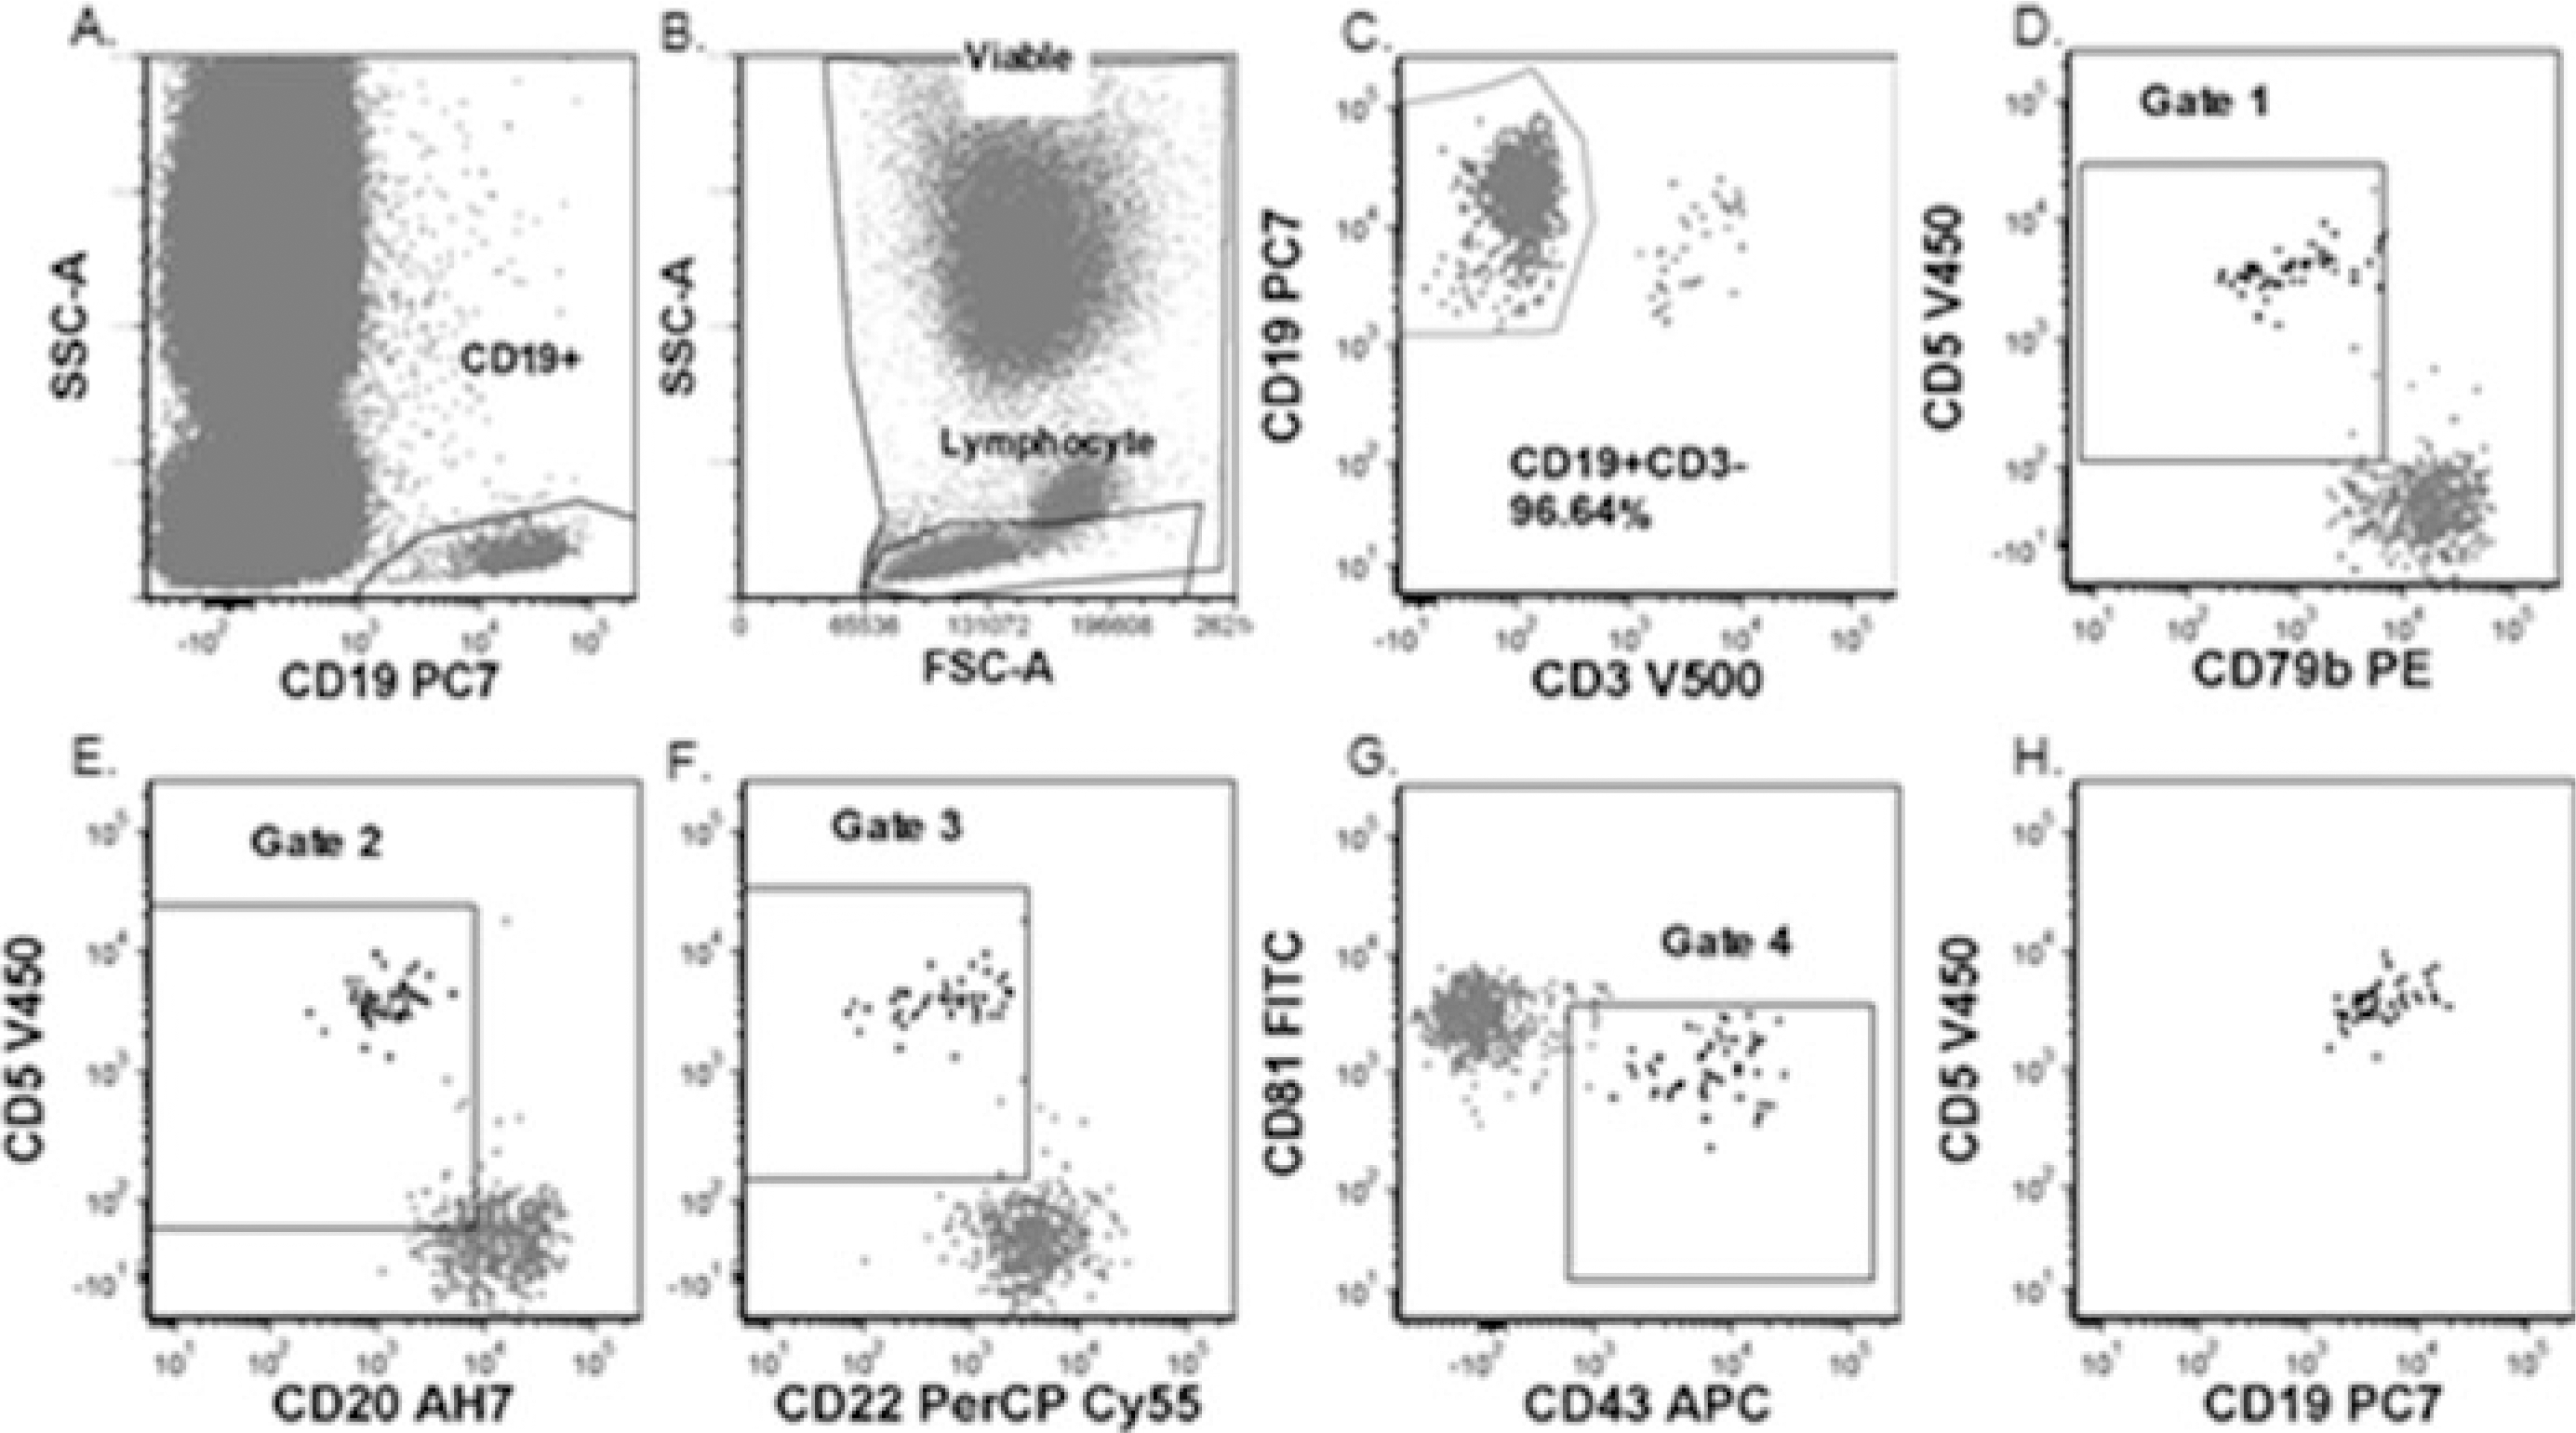
- Method 1: Based upon European Research Initiative in CLL (ERIC) method [2, 16, 21]. The ERIC method utilizes cells stained with cocktail 2 in Table 1 and a Boolean gating strategy in which CD19 positive B-cells are evaluated and a series of analysis gates are created in areas where normal B-cell populations are not observed (Fig. 3): A lymphocyte scatter gate that includes all CD19 positive cells is the first gate. A gate of CD19 positive and CD3 negative cells is placed under this gate. Then four gates are created: gate 1; CD5 positive CD79b dim to negative, gate 2; CD5 positive CD20 dim to negative, gate 3; CD5 positive CD22 dim to negative, and gate 4; CD43 positive and CD81 dim to negative. The CLL analysis gate consists of all cells in the lymphocyte scatter gate, CD19 positive, CD3 negative, and present in gates 1, 2, 3, and 4. Normal B-cells do not meet all of these criteria.
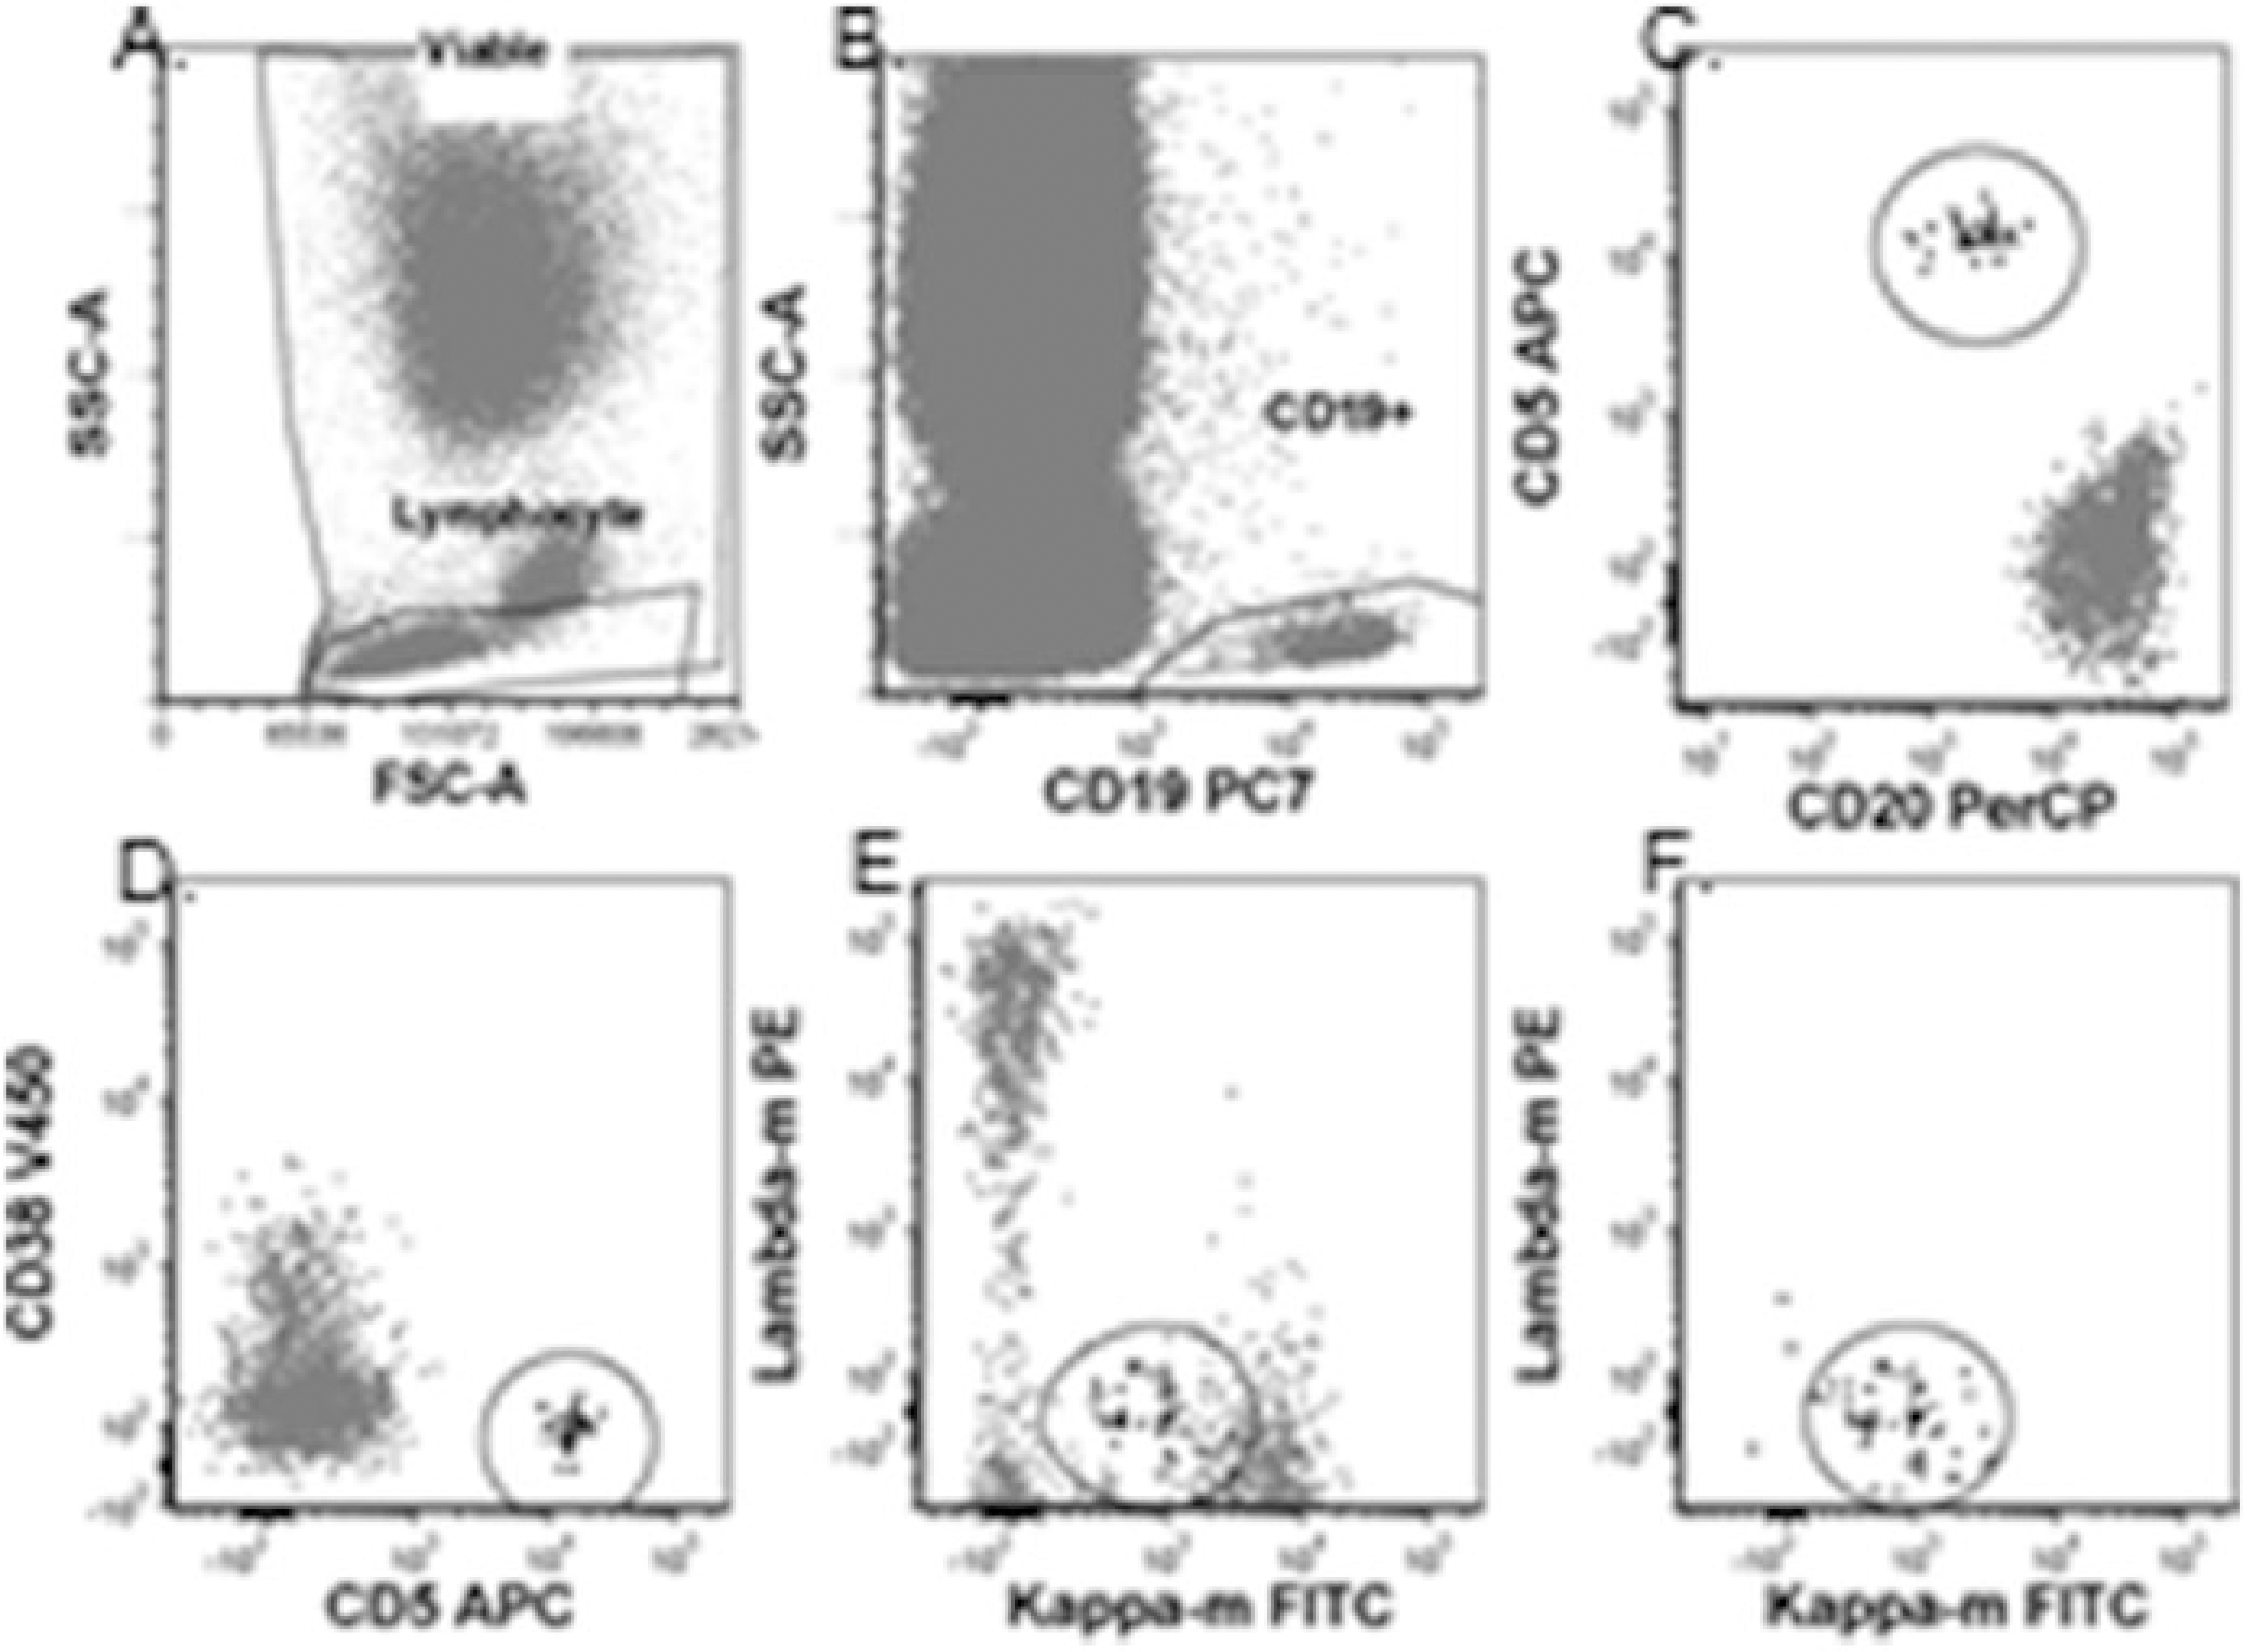
- Method 2: Hierarchical gate based upon abnormal antigen expression to define a monoclonal B cell population (Fig. 4). Steps 1 through 5 are performed. A CD19 positive gate is drawn within the lymphocyte scatter gate. The B-cells in the CD19 gate are interrogated and light chain expression is evaluated in the cells expressing CD5, dim CD20, and atypical CD38.
Fig. 2.

Basic analysis for CLL: (a) Time gate. (b) Time gate displayed. Viable gate to exclude debris. (c) Time gate displayed. Singlets gated to exclude doublets. (d) Gated on Time, Viable, and Singlets gates. Antigen vs. SSC gates to define T-cells (CD3+) (e) Antigen vs. SSC gates to define B-cells. (f) Gated on time, viable, and singlets gates. Antigen-based gates are displayed on a FSC-A vs. SSC-A plot to ensure lymphocyte gate includes all lymphocytes. (g) Final analysis gate: Gated on time, viable, singlets, and lymphocyte gates
Fig. 3.

CLL MRD Method 1: (a) Viable and Lymphocyte gates. (b) CD19+ gate. (c) CD19+CD3− gate. (d–g) Gated on viable, singlet, lymphocyte and CD19+CD3− gates. The four gates of this method. (h) Minimal residual CLL. Gated on Viable, Singlet, Lymphocyte, CD19+CD3− gates and gates 1–4
Fig. 4.

CLL MRD analysis method 2: (a) Viable and lymphocyte gates. (b) CD19+ gate. (c) Gated on viable, singlet, lymphocyte, and CD19+ gates. Abnormal CLL cells CD20 dim and CD5+ in ellipse. (d) Gated on viable, singlet, lymphocyte and CD19+ gates. Abnormal CLL cells CD5+ and homogeneously CD38 negative in ellipse. (e) Gated on viable, singlet, lymphocyte and CD19+ gates. Abnormal CLL cells in ellipse masked by polyclonal B cells. (f) Gated on viable, singlet, lymphocyte, CD19+, and abnormal CD5, CD20, and CD38 gates. Abnormal CLL cells in ellipse are monoclonal, dim positive for kappa and negative for lambda
4. Notes
CD23 is labile and can decrease with specimen storage prior to processing.
The wash solution should be checked with a fresh PB sample before use in patients (see Subheading 3). The supernatant from the lysed control blood should be clear. If there is evidence of hemolysis, discard solution and prepare a new one.
As this solution contains sodium azide, its vapor should not be breathed, and it should not be poured down the sink where explosive conditions may develop.
Formaldehyde is a known carcinogen and acutely hazardous; do not inhale and upon skin contact flush with water.
Post removal of supernatant during red cell lysis, gauze or a cotton swap can be used to carefully wipe debris from the insides of the tube(s); do not disturb the pellet before wiping inside the tube.
Washing cells with room temperature PBS prior to staining removes cytophilic antibody (bound immunoglobulin from the serum). As cytophilic antibody may be still bound to NK and T-cells, kappa and lambda expression is analyzed in association with a B-cell marker, such as CD19, CD20, or CD22, (besides exclusion of CD3 and or CD14 positive events) in order to remove the monocytes, T and NK cells with bound extrinsic Ab from the analysis.
- Preparation of target cell concentration:
- If greater than 20 × 106/ml (Increase the final PBS volume).
- Divide WBC concentration by 20, multiply by cell volume to get the final PBS volume.
- Add PBS up to the new volume and note on Flow QA sheet.
- Example 1: If cell count is 20 × 106/ml in 5 ml, 20/20 = 1 × 5 = 5 ml; add PBS to 5 ml.
- Example 2: If cell count is 80 × 106/ml in 3 ml, 80/20 = 4 × 3 = 12.0 ml; add PBS to 12.0 ml.
- If less than 10 × 106/ml (Re-concentrate to decrease the final PBS volume):
- Centrifuge specimen at 300 × g for 10 min.
- Divide WBC concentration by 20, multiply by cell volume to get the final PBS volume.
- Remove supernatant down to the new final.
- Example: If cell count is 3.0 × 10⁶/ml in 3 ml, 3/20 = 0.15 ml × 3 = 0.45 ml final volume.
For best results, acquire stained fixed cells within 24 h.
References
- 1.Campo E, Ghia P, Montserrat E et al. (2017) Chronic lymphocytic leukemia/small lymphocytic lymphoma. In: Swerdlow SH, Campo E, Harris NL, Pileri SA, Jaffe ES, Stein H, Thiele J et al. (eds) WHO classification of tumours of hematopoietic and lymphoid tissues, 4th edn. IRAC, Lyon, pp 216–221 [Google Scholar]
- 2.Rawstron AC, Villamor N, Ritgen M et al. (2007) International standardized approach for flow cytometric residual disease monitoring in chronic lymphocytic leukaemia. Leukemia 21(5):956–964. 10.1038/sj.leu.2404584 [DOI] [PubMed] [Google Scholar]
- 3.Muller-Hermelink HKME, Catovsky D, Campo E, Harris NL, Stien H(2007) Chronic lymphocytic leukemia/small lymphocytic lymphoma. WHO classification of hematopoietic and lymphoid tissues. IARC, Lyon [Google Scholar]
- 4.Alapat D, Coviello-Malle J, Owens R et al. (2012) Diagnostic usefulness and prognostic impact of CD200 expression in lymphoid malignancies and plasma cell myeloma. Am J Clin Pathol 137(1):93–100. 10.1309/ajcp59uorcyzevqo [DOI] [PMC free article] [PubMed] [Google Scholar]
- 5.Marti G, Rawstron AC, Ghia P, Hillmen P, Houlston RS, Kay N, Aurran Schleinitz T, Caporaso N, on behalf of The International Familial CLL Consortium (2005) Diagnostic criteria for monoclonal B-cell lymphocytosis (MBL). Br J Haematol 130:325–332 [DOI] [PubMed] [Google Scholar]
- 6.Ahmad E, Steinberg SM, Goldin L, Hess CJ, Caporaso N, Kreitman RJ, Wiestner A, Wilson W, White T, Marti G, Stetler-Stevenson M (2008) Immunophenotypic features distinguishing familial chronic lymphocytic leukemia from sporadic chronic lymphocytic leukemia. Cytometry B Clin Cytom 74:221–226 [DOI] [PubMed] [Google Scholar]
- 7.Kingma DW, Imus P, Xie XY, Jasper G, Sorbara L, Stewart C, Stetler-Stevenson M (2002) CD2 is expressed by a sub-population of normal B cells and is frequently present in mature B cell neoplasms. Cytometry B Clin Cytom 50:243–248 [DOI] [PubMed] [Google Scholar]
- 8.Kampalath B, Barcos MP, Stewart C (2003) Phenotypic heterogeneity of B cells in patients with chronic lymphocytic leukemia/small lymphocytic lymphoma. Am J Clin Pathol 119 (6):824–832. 10.1309/4agut3lkeurd7t7k [DOI] [PubMed] [Google Scholar]
- 9.Damle R, Wasil T, Fais F et al. (1999) Ig V gene mutation status and CD38 expression as novel prognostic indicators in chronic lymphocytic leukemia. Blood 94:1840–1847 [PubMed] [Google Scholar]
- 10.Durig J, Naschar M, Schmucker U, Renzing-Kohler K, Holter A, Huttmann T, Duhrsen U (2002) CD38 expression is an important prognostic marker in chronic lymphocytic leukaemia. Leukemia 16:30–35 [DOI] [PubMed] [Google Scholar]
- 11.Hamblin TJ, Orchard JA, Ibotson RE et al. (2002) CD38 expression and immunoglobulin variable region mutations are independent prognostic variables in chronic lymphocytic leukemia but CD38 expression may vary during the course of the disease. Blood 99:1023–1029 [DOI] [PubMed] [Google Scholar]
- 12.Bulian P, Shanafelt TD, Fegan C et al. (2014) CD49d is the strongest flow cytometry-based predictor of overall survival in chronic lymphocytic leukemia. J Clin Oncol 32(9):897–904. 10.1200/jco.2013.50.8515 [DOI] [PMC free article] [PubMed] [Google Scholar]
- 13.Chiorazzi N (2012) Implications of new prognostic markers in chronic lymphocytic leukemia. Hematology Am Soc Hematol Educ Program 2012:76–87. 10.1182/asheducation-2012.1.76 [DOI] [PubMed] [Google Scholar]
- 14.Gattei V, Bulian P, Del Principe MI et al. (2008) Relevance of CD49d protein expression as overall survival and progressive disease prognosticator in chronic lymphocytic leukemia. Blood 111(2):865–873. 10.1182/blood-2007-05-092486 [DOI] [PubMed] [Google Scholar]
- 15.Gooden CE, Jones P, Bates R et al. (2018) CD49d shows superior performance characteristics for flow cytometric prognostic testing in chronic lymphocytic leukemia/small lymphocytic lymphoma. Cytometry B Clin Cytom 94 (1):129–135. 10.1002/cyto.b.21384 [DOI] [PubMed] [Google Scholar]
- 16.Rawstron AC, Kennedy B, Evans PA et al. (2001) Quantitation of minimal disease levels in chronic lymphocytic leukemia using a sensitive flow cytometric assay improves the prediction of outcome and can be used to optimize therapy. Blood 98:29–35 [DOI] [PubMed] [Google Scholar]
- 17.Moreton P, Kennedy B, Lucas G et al. (2005) Eradication of minimal residual disease in B-cell chronic lymphocytic leukemia after alemtuzumab therapy is associated with prolonged survival. J Clin Oncol 23 (13):2971–2979. 10.1200/jco.2005.04.021 [DOI] [PubMed] [Google Scholar]
- 18.Wayne P (2007) Clinical flow Cytometric analysis of neoplastic Hematolymphoid cells; approved guideline, 2nd ed. CLSI document H43-A2, 2nd edn. Clinical and Laboratory Standards Institute, Wayne [Google Scholar]
- 19.Stelzer GT, Marti G, Hurley A et al. (1997) U. S.-Canadian consensus recommendations on the immunophenotypic analysis of hematologic neoplasia by flow cytometry: standardization and validation of laboratory procedures. Cytometry 30(5):214–230 [DOI] [PubMed] [Google Scholar]
- 20.Cadena-Herrera D, Esparza-De Lara JE, Ramirez-Ibanez ND et al. (2015) Validation of three viable-cell counting methods: manual, semi-automated, and automated. Biotechnol Rep (Amst) 7:9–16. 10.1016/j.btre.2015.04.004 [DOI] [PMC free article] [PubMed] [Google Scholar]
- 21.Rawstron AC, Bottcher S, Letestu R et al. (2013) Improving efficiency and sensitivity: European research initiative in CLL (ERIC) update on the international harmonised approach for flow cytometric residual disease monitoring in CLL. Leukemia 27 (1):142–149. 10.1038/leu.2012.216 [DOI] [PubMed] [Google Scholar]


