

Abstract
Metastases from primary breast cancer result in poor survival. βIII-tubulin (TUBB3) has been established as a therapeutic target for breast cancer metastases specifically to the brain. In this study, we conducted a systematic analysis to determine the regulation of TUBB3 expression in breast cancer metastases to the brain and strategically target these metastases using vinorelbine (VRB), a drug approved by the U.S. Food and Drug Administration (FDA). We found that human epidermal growth factor receptor 2 (HER2) signaling regulates TUBB3 expression in both trastuzumab-sensitive and trastuzumab-resistant neoplastic cells. We further discovered that bromodomain and extra-terminal domain (BET) inhibition increases TUBB3 expression, rendering neoplastic cells more susceptible to apoptosis by VRB. Orthotopic xenograft assays using two different breast cancer cell models revealed a reduction in tumor volume with BET inhibition and VRB treatment. In addition, in vivo studies using a model of multiple brain metastasis (BM) showed improved survival with the combination of radiation + BET inhibitor (iBET-762) + VRB (75% long-term survivors, P < 0.05). Using in silico analysis and BET inhibition, we found that the transcription factor myeloid zinc finger-1 (MZF-1) protein binds to the TUBB3 promoter. BET inhibition decreases MZF-1 expression and subsequently increases TUBB3 expression. Overexpression of MZF-1 decreases TUBB3 expression and reduces BM in vivo, whereas its knockdown increases TUBB3 expression in breast cancer cells. In summary, this study demonstrates a regulatory mechanism of TUBB3 and provides support for an application of BET inhibition to sensitize breast cancer metastases to VRB-mediated therapy.
INTRODUCTION
Breast cancer metastasizes to various organs including bone, lungs, and the brain. Brain metastases (BMs) result in poor prognosis and dismal clinical outcomes, particularly because of the lack of blood-brain barrier (BBB) permeable targeted drug therapies (1, 2). The incidence of breast cancer BMs varies according to the breast cancer molecular profile. In estrogen receptor (ER)–positive/progesterone-positive tumors and triple-negative breast cancers (TNBCs), BMs occur only 5 to 10 and 20% of the time, respectively. The incidence of BM increases to 30 to 55% in patients with human epidermal growth factor receptor 2 (HER2)–positive breast cancers (3–5). The management of patients with one to three brain metastatic lesions requires tumor debulking followed by stereotactic radiosurgery (SRS), whereas patients with >3 metastases undergo different therapies, including SRS or whole-brain radiation therapy (WBRT) (6). Despite these aggressive treatment regimens, the median survival of patients with BM is less than a year after diagnosis (7).
Trastuzumab is a humanized monoclonal antibody that has revolutionized the treatment of HER2-positive breast cancer (8). However, the BBB prevents reaching the effective dose of trastuzumab in the brain, rendering this therapy ineffective for BM (9). HER2 overexpression in BM increases the outgrowth of neoplastic cells (10), and patients with breast cancer receiving trastuzumab therapy often relapse, with the brain being the site of recurrence (5). Central nervous system involvement is further complicated by the acquisition of resistance to anti-HER2 therapies including trastuzumab, lapatinib, and BKM-120, further limiting the treatment of patients with BM (11–14). This warrants the development of new and clinically meaningful therapeutic strategies.
βIII-tubulin (TUBB3) overexpression in BM is a potential target for treatment. We have previously reported that TUBB3 plays an important role in the process of BM (15). Vinorelbine (VRB), a U.S. Food and Drug Administration (FDA)–approved drug for non–small cell lung cancer (NSCLC), targets TUBB3-expressing cells by acting as a mitotic poison to destabilize α- and β-tubulins. The disruption of microtubule networks, in turn, leads to the induction of programmed cell death (16). In NSCLC, the presence of TUBB3 sensitizes neoplastic cells to VRB-mediated therapy (17–19). Therefore, higher expression of TUBB3 is considered a favorable prognostic marker for VRB-mediated therapy (18, 19).
High expression of a molecular target can increase the therapeutic efficacy of a drug. For example, restoration of ERα expression through epigenetic drugs 5-aza-2’-deoxycytidine (5Aza) or trichostatin sensitizes ER-negative cells to tamoxifen (ER inhibitor) (20, 21). TUBB3 expression is also increased by epigenetic drugs like 5Aza and 4-phenylbutyric acid (PBA) (22). Recently, epigenetic readers such as bromodomain and extra-terminal domain (BET) proteins have become attractive targets for cancer therapeutics. BET family proteins consist of bromodomain 2 (BRD2), BRD3, BRD4, and testis-specific BRDT proteins. The importance of BET bromodomain proteins in the regulation of cellular homeostasis and their overexpression in cancer has led to the development of various BET inhibitors (23, 24). However, BET inhibitors have underperformed in ongoing clinical trials as single agents, suggesting that they may work better in combination therapy for the treatment of cancer (24).
In this work, we conducted a systematic analysis and demonstrated that HER2 signaling regulates TUBB3 expression. We identified that BET inhibition increases TUBB3 expression in breast cancer cells, which renders the cancer cells more vulnerable to anti-TUBB3 therapy. We also identified myeloid zinc finger-1 (MZF-1) protein as a negative regulator of TUBB3. In summary, our work establishes a regulatory mechanism of TUBB3 gene expression and provides a rational application of BET inhibition to sensitize preexisting BMs to FDA-approved VRB therapy.
RESULTS
HER2 signaling regulates TUBB3 expression
TUBB3 is overexpressed in cancer and is associated with resistance to taxane therapies and poor prognosis (17, 25, 26). In our previous work, we demonstrated that TUBB3 expression correlates with distant metastases and is greater in BM compared to primary breast cancers (15). TUBB3 was also shown to be correlated with high HER2 expression in clinical breast cancer samples (27). Therefore, we assessed TUBB3 expression in a panel of breast cancer cell lines and found that TUBB3 correlates with HER2 expression (Fig. 1A). To evaluate whether HER2 signaling regulates TUBB3 protein and RNA expression, we assessed the effect of HER2 signaling inhibition on TUBB3 expression in HER2-positive brain metastatic cells (28). BT-474Br cells were treated with HER2 pathway inhibitors, including an anti-HER2 antibody (trastuzumab), phosphatidylinositol 3-kinase (PI3K) inhibitor (BKM-120), extracellular signal–regulated kinase 1/2 (ERK1/2) inhibitor (apigenin), a dual inhibitor of HER2 and epidermal growth factor receptor (EGFR) (lapatinib), and a mammalian target of rapamycin (mTOR) inhibitor (everolimus). Treatment with these agents decreased TUBB3 expression (Fig. 1, B to F, and fig. S1). Capecitabine treatment did not alter the TUBB3 expression, indicating that TUBB3 alterations are not related to cellular stress induced by chemotherapy (fig. S2).
Fig. 1. HER2 signaling regulates TUBB3 expression.
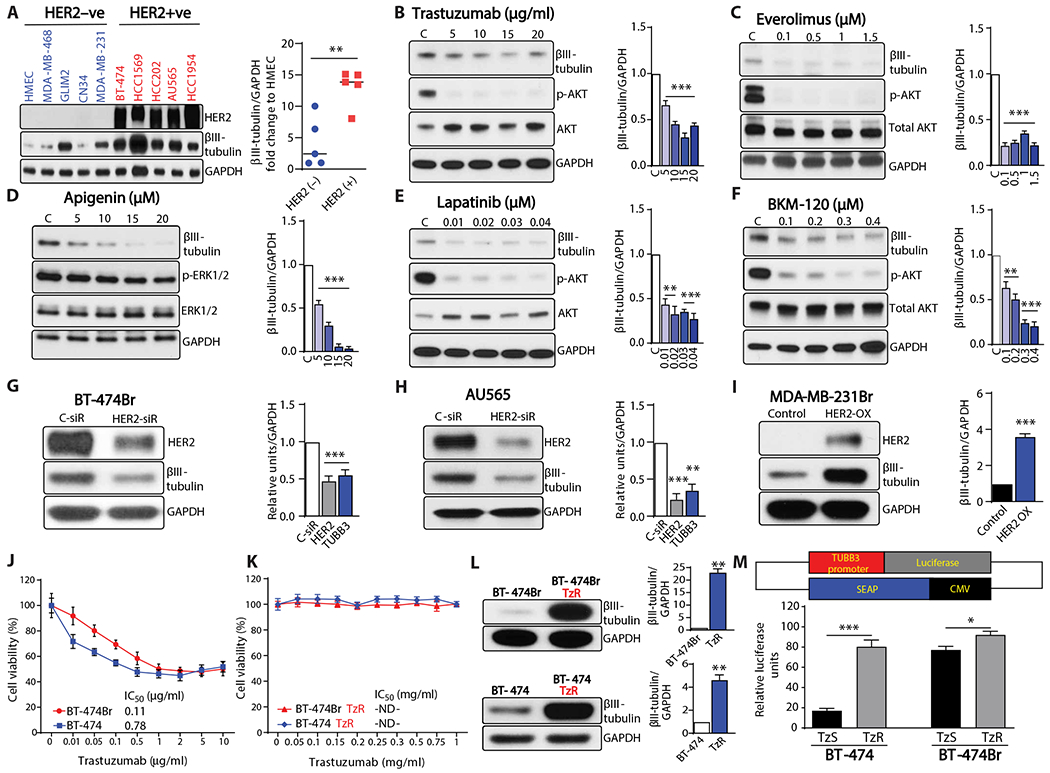
(A) Western blot analysis of TUBB3 in a panel of breast cancer cell lines. (B to F) Western blot analysis of TUBB3 after 2 days of treatment with various concentrations of (B) trastuzumab (HER2 dimerization inhibitor), (C) everolimus (mTOR inhibitor), (D) apigenin (ERK1/2 inhibitor), (E) lapatinib (dual HER2/EGFR inhibitor), and (F) BKM-120 (PI3K inhibitor); C stands for dimethyl sulfoxide (DMSO) control. (G and H) Western blot analysis of TUBB3 after transient knockdown of HER2 in BT-474Br cells (G) and AU565 cells (H). (I) Western blot analysis of TUBB3 after overexpression of HER2 in HER2-negative MDA-MB-231Br cells. (J and K) Viability assay for the trastuzumab-sensitive (J) and trastuzumab-resistant (K) BT-474 and BT-474Br cell lines, n = 6 technical replicates. (L) Western blot analysis of TUBB3 expression in trastuzumab-sensitive and trastuzumab-resistant BT-474 and BT-474Br cell lines. (M) Top panel shows a schematic diagram of the TUBB3 promoter construct, and bottom panel shows relative luciferase activity of TUBB3 promoter in trastuzumab-resistant cell lines as compared to trastuzumab-sensitive cell lines; TzS stands for trastuzumab-sensitive cell lines, and TzR stands for trastuzumab-resistant cell lines (technical replicates, n = 8 for BT-474, n = 4 for BT-474Br). Graphs next to Western blots show densitometry analysis with glyceraldehyde-3-phosphate dehydrogenase (GAPDH) as a loading control (biological replicates, n = 3). Unpaired t test was used to analyze (A), (I), and (M), and one-way ANOVA with Dunnett’s multiple comparison test was performed for (B) to (H). Unpaired t test with Welch’s correction was used for (L). *P < 0.05; **P < 0.01; ***P < 0.001. ND, not determined.
Transient HER2 small interfering RNA (siRNA) transfection experiments were performed to demonstrate a direct link between HER2 and TUBB3 expression. Silencing HER2 expression decreased TUBB3 compared to control siRNA in BT-474Br and AU565 cells (Fig. 1, G and H). To further evaluate whether HER2 overexpression in TNBC cells increases TUBB3, we overexpressed full-length HER2 in MDA-MB-231Br cells and found that this resulted in a concomitant increase in TUBB3 expression (Fig. 1I).
Patients often develop trastuzumab resistance and cancer progression despite antibody therapy (29). It was therefore of interest to know whether TUBB3 is implicated in resistance to the standard therapeutic regimen for HER2-positive breast cancer cells. To evaluate this, we generated trastuzumab-resistant breast cancer and brain-metastatic cells by treating BT-474 and BT-474Br cells with trastuzumab (10 μg/ml) for 1 year. BT-474/BT-474Br cells exhibit a half maximal inhibitory concentration (IC50) of 0.11/0.78 μg/ml for trastuzumab, whereas the IC50 of trastuzumab-resistant cells could not be determined (Fig. 1, J and K). This resistance was also accompanied by an increase in TUBB3 (Fig. 1L). The trastuzumab-resistant BT-474Br proliferated faster (fig. S3) and did not respond to trastuzumab-mediated TUBB3 reduction (fig. S4). To evaluate whether the increase in TUBB3 expression is attributable to a hyperactive promoter, we conducted promoter activity analysis and found that trastuzumab-resistant cells exhibited TUBB3 promoter hyperactivity (Fig. 1M). BT-474Br cells also showed higher baseline TUBB3 promoter activity when compared to parental BT-474 cells (Fig. 1M).
BET inhibition increases TUBB3 expression
The presence of high expression of TUBB3 sensitizes the tumors to VRB-mediated therapy in patients with NSCLC (17–19, 30). Therefore, we reasoned that an increase in target proteins would sensitize the cancer cells to targeted therapy. We conducted expression analysis using the epigenetic modifier JQ-1 (BET inhibitor) to evaluate whether increasing TUBB3 expression will prime BM for treatment. Quantitative reverse transcription polymerase chain reaction (q-RT-PCR) analysis of 37 different genes involved in invasion and metastasis demonstrated a decreased gene expression as compared to control (Fig. 2, A and B). However, TUBB3 RNA expression was markedly up-regulated in two breast cancer cell lines (HCC1569 and BT-474Br) treated with JQ-1 (Fig. 2, A to C). In addition, treatment with JQ-1 did not inhibit the ability of HER2-targeted therapies to reduce the cells’ viability (fig. S5).
Fig. 2. BET bromodomain inhibitors increase TUBB3 expression.
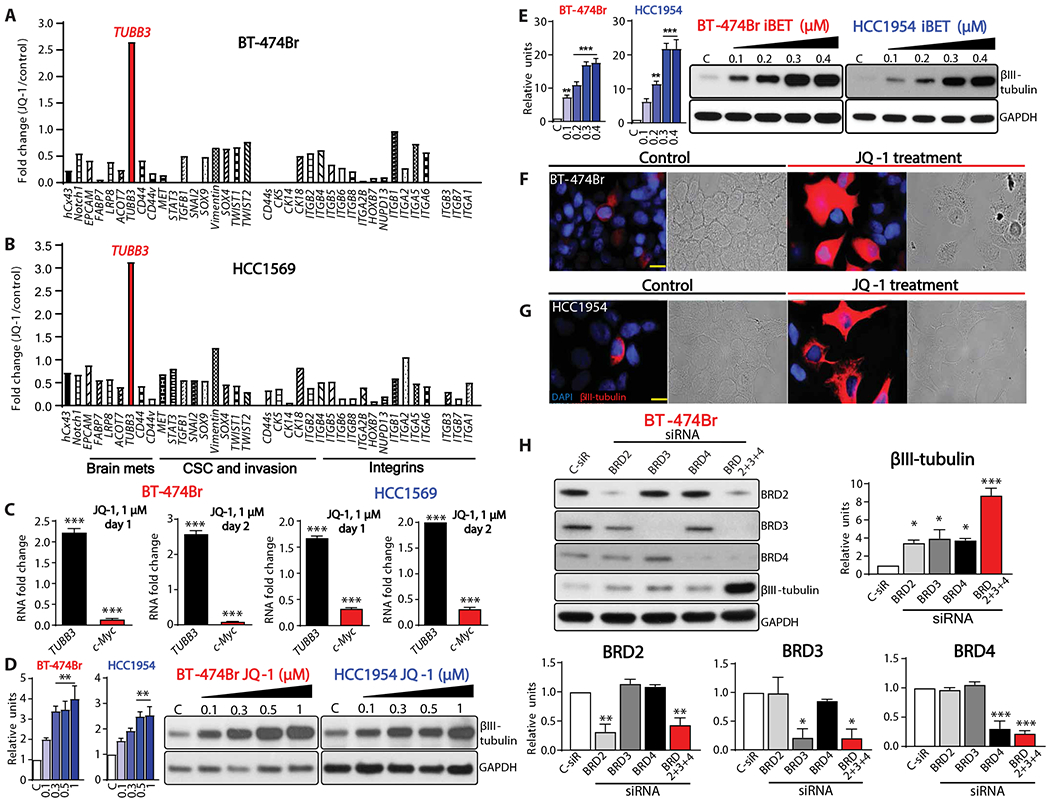
(A and B) q-RT-PCR analysis of various genes in BT-474Br (A) and HCC1569 (B) cells treated with JQ-1, n = 1. (C) q-RT-PCR of TUBB3 after 1 or 2 days of treatment with JQ-1. GAPDH was used as internal control, and c-Myc was used as a positive control, n = 3. (D and E) Western blot analysis of TUBB3 in BT-474Br and HCC1954 cells treated with JQ-1 (D) or iBET (E); left panel shows densitometry analysis, and C stands for DMSO control. (F and G) Immunofluorescence and bright field images of TUBB3 in BT-474Br (F) and HCC1954 (G) cells. Scale bars, 20 μm. (H) Western blot analysis of BRD2, BRD3, BRD4, and TUBB3 after transient knockdown of BET bromodomain proteins in BT-474Br cells. The bottom and right panels demonstrate densitometry analysis. For all Western blots, biological replicates were used (n = 3). One-way ANOVA with Dunnett’s multiple comparison test was performed for (C) to (E) and (H). *P < 0.05; **P < 0.01; ***P < 0.001.
To assess whether BET inhibitors influence TUBB3 protein expression, we treated breast cancer cell lines (BT-474Br, HCC1954, SUM 149 PT, CN34 Br, HCC1937, BT-474, MDA-MB-231Br, SUM159PT, HCC1143, and CN34) with BET inhibitors. We found that TUBB3 was overexpressed and further confirmed the findings at the RNA level (Fig. 2, D and E, and fig. S6). Immunofluorescence analysis of JQ-1–treated cells further confirmed increased TUBB3 expression (Fig. 2, F and G).
To identify which BET bromodomain proteins are responsible for TUBB3 expression, we silenced BRD2/3/4, individually and in combination, using siRNA. Knockdown of each of the BRD proteins increased TUBB3 expression; however, only combined knockdown of all BRD proteins together markedly increased TUBB3 expression (Fig. 2H).
BET inhibition sensitizes breast cancer cells to VRB
Previous reports demonstrated that VRB can penetrate the BBB in a heterogeneous manner (31). It has also been shown that response to VRB depends on TUBB3 protein expression in patients with ovarian and lung cancers (17–19). Given that BET increases TUBB3 expression, which may sensitize cancer cells to VRB, we conducted cell death assays on multiple cell lines—HCC1806, HCC1143, and HCC1954—using JQ-1, VRB, and their combination. Combination treatment significantly increased cell death as compared to single drug treatment (P < 0.0001) (Fig. 3, A to D, and fig. S7).
Fig. 3. BET bromodomain inhibitors sensitize breast cancer cells to VRB in vitro.
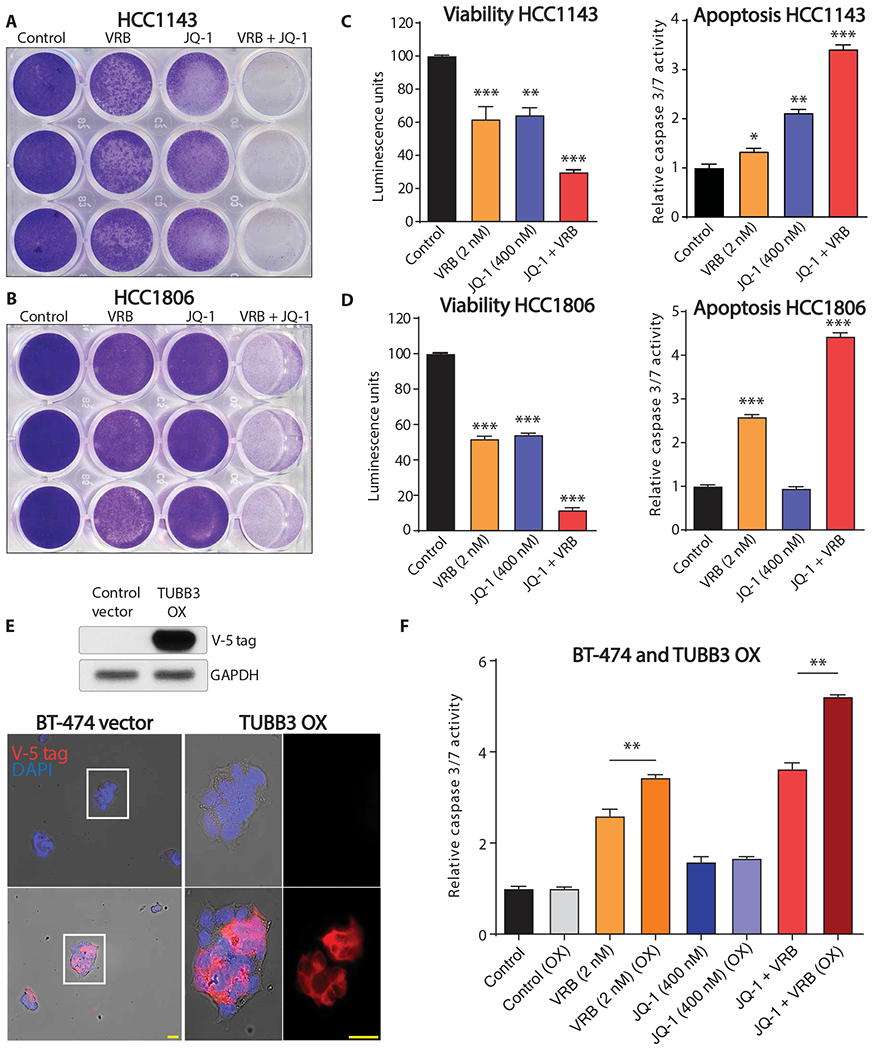
Crystal violet staining of (A) HCC1143 and (B) HCC1806 cells treated with DMSO control, VRB, JQ-1, or the combination of VRB and JQ-1 (technical replicates, n = 3). Viability and apoptosis assays for (C) HCC1143 and (D) HCC1806 cells treated with DMSO control, VRB, JQ-1, or the combination of VRB and JQ-1 (technical replicates, n = 3). (E) Top panel shows ectopic overexpression of V5-tagged TUBB3 in BT-474 cells. Bottom panel shows immunofluorescence analysis using V5-tagged antibody with Alexa 555 as a secondary antibody, yellow bars = 25 μm. (F) Apoptosis assay of vector control and TUBB3-overexpressing BT-474 cells treated with DMSO control, VRB, JQ-1, or the combination of VRB and JQ-1 (technical replicates, n = 4). One-way ANOVA with Dunnett’s multiple comparison test was performed for (C) and (D). Unpaired t tests were used to analyze the four sets of data in (F) separately. *P < 0.05; **P < 0.01; ***P < 0.001.
To evaluate whether ectopic expression of TUBB3 increases the sensitivity of breast cancer cells to VRB, we overexpressed V-5–tagged TUBB3 in BT-474 cells (Fig. 3E). Overexpression of TUBB3 followed by VRB treatment increased the number of apoptotic cells, as revealed by cleaved caspase 3/7 assay (Fig. 3F). Moreover, combination treatment further increased caspase 3/7 activity in TUBB3-overexpressing cells (Fig. 3F). Knockdown of TUBB3 in BT-474Br cells resulted in a loss of cytotoxic effect of the combination therapy (fig. S8). These results collectively indicate that the increase in TUBB3 expression sensitized breast cancer cells to VRB.
We further evaluated the efficacy of combination therapy with BET inhibitor and VRB using in vivo models. HCC1954 cells were injected into the mammary fat pads of nude mice. The four treatment groups consisted of: intraperitoneal injection of vehicle (25% captisol); intraperitoneal injection of JQ-1 (25 mg/kg); VRB (5 mg/kg) by oral gavage; and combination treatment with JQ-1 followed by VRB the next day. Half of the effective dose reported in the literature for both inhibitors was used (Fig. 4A) (32, 33). Tumor volume and weight were significantly decreased (P < 0.001) in the group receiving a sequential combination treatment (Fig. 4, B to D). This decrease in tumor size was also accompanied by increased cleaved caspase in the combination treatment group (Fig. 4E). To further confirm the effect of this combination therapy, we used another model of breast cancer, HCC1569 cells. iBET-762, a BET inhibitor used in clinical trials, was used in place of JQ-1 because of its superior stability in vivo (34). Measurement of tumor mass revealed a significant reduction (P < 0.001) with combination treatment compared to treatment with either single agent alone (Fig. 4, F to H). Further analysis of isolated tumor tissue revealed increased number of cleaved caspase-positive cells in the combination therapy group (Fig. 4, I to L). Collectively, these data show that sequential treatment with BET inhibitor and VRB induces cell death in vivo in two different models of breast cancer.
Fig. 4. BET bromodomain inhibitors sensitize breast cancer cells to VRB.
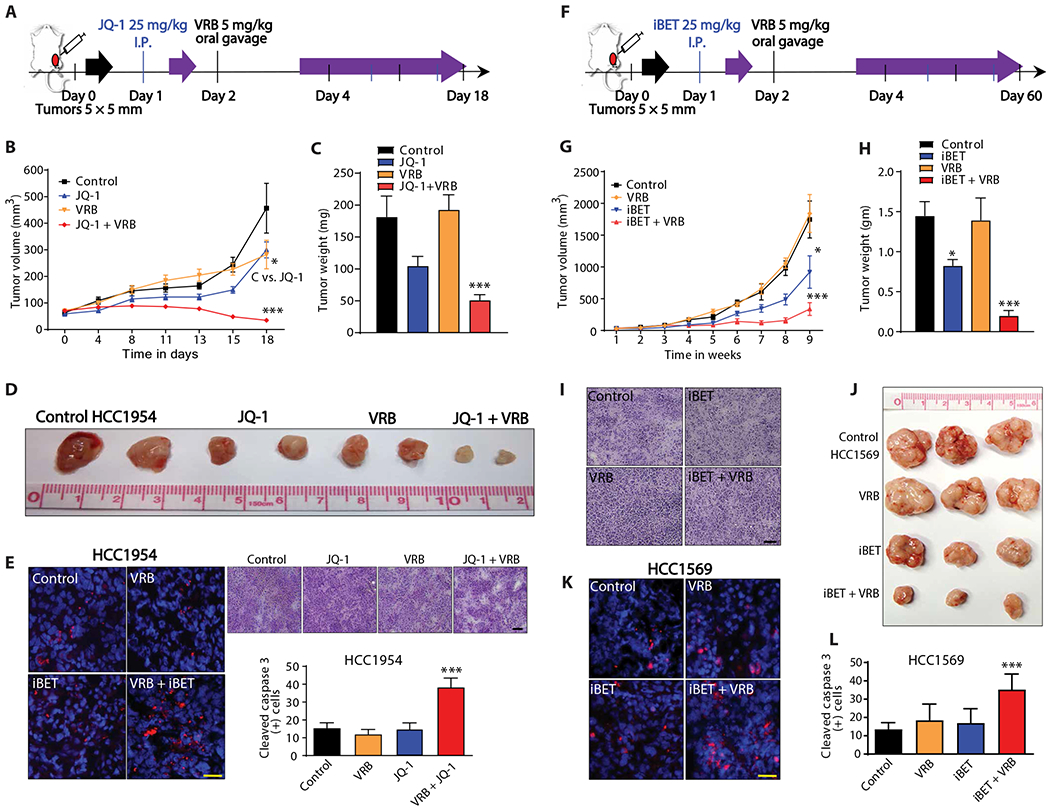
(A) Schematic description of experimental design for HCC1954 xenografts. Animals were randomized and dosed with vehicle control (25% captisol), JQ-1 (25 mg/kg), VRB (5 mg/kg), or the combination of JQ-1 and VRB. (B) Tumor was measured every 3 and 4 days after drug treatment, n = 7 per group, x axis is not to scale. (C) Tumor weight at 18 days for vehicle control (25% captisol), JQ-1 (25 mg/kg), VRB (5 mg/kg), and JQ-1 + VRB treatment, n = 7 per group. (D) Photographs of HCC1954 tumors resected after 18 days of treatment. (E) Cleaved caspase 3 in the different treatment groups, red color indicates cleaved caspase 3, and blue color represents 4′,6-diamidino-2-phenylindole (DAPI). Yellow scale bar, 25 μm. Right panel shows H&E staining of tumors treated with vehicle control, JQ-1, VRB, or the combination of drugs. Black scale bar, 200 μm; bottom panel shows analysis of cleaved caspase 3, n = 4 for VRB and n = 5 for all other groups. (F) Schematic description of experimental design for HCC1569 xenografts. Animals were randomized and dosed with vehicle control (25% captisol), iBET (25 mg/kg), VRB (5 mg/kg), or iBET + VRB. (G) Tumors volume measured every week. (H) Tumor weights measured at the end of 9 weeks. (I) H&E staining of tumors treated with vehicle control, iBET, VRB, or the combination of drugs. Black scale bar, 200 μm. (J) Photographs of HCC1569 tumors. (K) Cleaved caspase 3 staining, red color indicates cleaved caspase 3, and blue color represents DAPI. Yellow scale bar, 25 μm. (L) Quantitation of cleaved caspase 3–positive cells, red color indicates cleaved caspase 3, and blue color represents DAPI, n = 5 per group. For (B) and (G), linear mixed model was fitted, and the differences between control and other groups were calculated with the least squares means method and then adjusted using Dunnett’s method. For (C), (E), (H), and (L), one-way ANOVA with Dunnett’s multiple comparison test was used. *P < 0.05; ***P < 0.001. I.P., intraperitoneal.
Combination of iBET and VRB improves survival in metastatic breast cancer
Next, we evaluated whether the combination of BET inhibition and VRB could improve survival in BM models. The control, VRB, and iBET-treated mice exhibited a median survival of 67, 56, and 67 days, respectively (n = 7 for VRB group and n = 8 for other groups, P > 0.05). However, the combination group treated with iBET + VRB showed a median survival of 80.5 days. This translates to a 20% survival improvement in comparison to control and iBET-treated mice and 43% improvement as compared to the VRB-treated group (P < 0.01) (Fig. 5, A and B). Analysis of caspase 3 cleavage indicated increased apoptosis in the combination-treated group (Fig. 5C). The combination treatment did not elicit any toxicity, as determined by histology of vital organs and weight measurements (fig. S9). These results demonstrate that the combination therapy of BET inhibition and VRB improves survival in breast cancer BM model without any apparent side effects.
Fig. 5. Combination of iBET and VRB improves survival in a model of multiple brain metastasis.

(A) Schematic description of experimental design. BT-474Br cells were intracranially injected, and animals were randomized into four groups treated with vehicle control (25% captisol), iBET (25 mg/kg), VRB (5 mg/kg), or the combination of iBET and VRB. (B) Survival analysis of animals, n = 7 for VRB and n = 8 for all other groups. (C) Cleaved caspase 3 staining in treatment groups, red color indicates cleaved caspase 3, and blue color represents DAPI. Yellow scale bar, 25 μm. Histology of mice bearing intracranial injection of BT-474Br cells. Yellow scale bar, 100 μm. (D) Schematic description of experimental design. BT-474Br cells were injected via intracarotid artery to generate multiple metastases. Mice were divided into irradiated and nonirradiated groups. Each group was randomized to treatment with vehicle control (25% captisol), iBET (25 mg/kg), VRB (5 mg/kg), or the combination of iBET and VRB. (E) Survival analysis of nonirradiated animals with or without drug treatments; n = 7 per group. (F) Survival analysis of irradiated animals with or without drug treatments; n = 7 per group. Survival curves were compared using log-rank test for those with proportional hazards and Renyi statistics for those with crossing hazards. **P < 0.01; ***P < 0.001. NS, not significant.
Radiation therapy is the standard therapeutic regimen for the management of BM (6). It also increases the expression of βIII-tubulin (fig. S10). Therefore, we validated our data in a model of multiple BMs established via intracarotid artery injection of BT-474Br cells in combination with radiation. Injected mice were randomly divided into two radiotherapy groups. Twenty-eight mice remained without radiation (group 1), and 28 mice were irradiated with 10 grays (Gy) fractionated to 2 Gy daily for five consecutive days (group 2). Next, each of the groups was further randomized to receive 25% captisol (control), VRB, iBET, or VRB + iBET together (n = 7 for each group). After treatment of group 1, the control and VRB-treated groups exhibited a median survival of 143 and 172 days, respectively (P > 0.05), and the iBET-treated group demonstrated a median survival of 144 days (P > 0.05). Group 1 animals treated with the iBET + VRB combination exhibited a median survival of 214 days—a 50% increase compared to the corresponding control (P < 0.05) (Fig. 5, D and E). The mice of group 2 that were treated with radiation alone and iBET + radiation exhibited a median survival of 140 days. The treatment regimen that exhibited the best survival outcome received radiation followed by subsequent cycles of VRB and iBET. The median survival could not be determined in this group, because 70% of mice remained alive at 295 days after treatment (P < 0.05) (Fig. 5F). These preclinical data show that the sequential combination of BET inhibition and VRB is a powerful treatment together with radiation, a standard of care for patients with BM.
MZF-1 directly binds to the TUBB3 promoter
Considering that BET protein inhibition increases TUBB3 expression, we aimed to understand the mechanism for this regulation. It has been described in the literature that TUBB3 is regulated by various transcription factors including paired box gene 3 (PAX3), specificity protein 1 (SP1) and hypoxia-inducible factor 2-α (HIF2α) (35–37). However, its regulators in breast cancer BM remained to be identified. We conducted an in silico analysis of murine and human TUBB3 promoters using Conserved Regulatory Elements anchored Alignment (CONREAL) (38). This revealed multiple transcription factors (MZF-1, ZEB-1, SPI-B, SP-1, TFAP2A, NFE2L1, ETS1, PAX2, LYF1, and AP4) that are capable of binding to the TUBB3 promoter (Fig. 6A). We hypothesized that perhaps one of these transcription factors could act as a direct repressor of TUBB3. By assessing the expression of the putative transcription factors, we identified MZF-1 as significantly down-regulated after JQ-1 treatment in BT-474Br cells (P < 0.01) (Fig. 6, B and C). Furthermore, analysis of patient datasets showed that MZF-1 overexpression imparts a favorable prognosis in patients with breast cancer (P < 10−14), whereas TUBB3 overexpression imparts a poor prognosis (P < 10−16) (Fig. 6D) (39). MZF-1 expression also correlated inversely with HER2 expression in patients with BMs (fig. S11). BET inhibition resulted in overexpression of ZEB-1 in vitro (Fig. 6B). In addition, ZEB-1 overexpression in breast cancer patient samples imparted good prognosis (Fig. 6E), which implied that it cannot act as a repressor of TUBB3. The remaining transcription factors (which were reduced upon BET inhibition) did not correlate with a good prognosis, except for NFE2L1 (Fig. 6E). To see whether NFE2L1 negatively regulates TUBB3 expression, we assessed its expression in JQ-1–treated breast cancer cells and found no significant change in NFE2L1 protein expression (P > 0.05) (Fig. 6F). All together, these results support MZF-1 as a regulator of TUBB3 expression.
Fig. 6. Identification of MZF-1 as a regulator of TUBB3 expression.
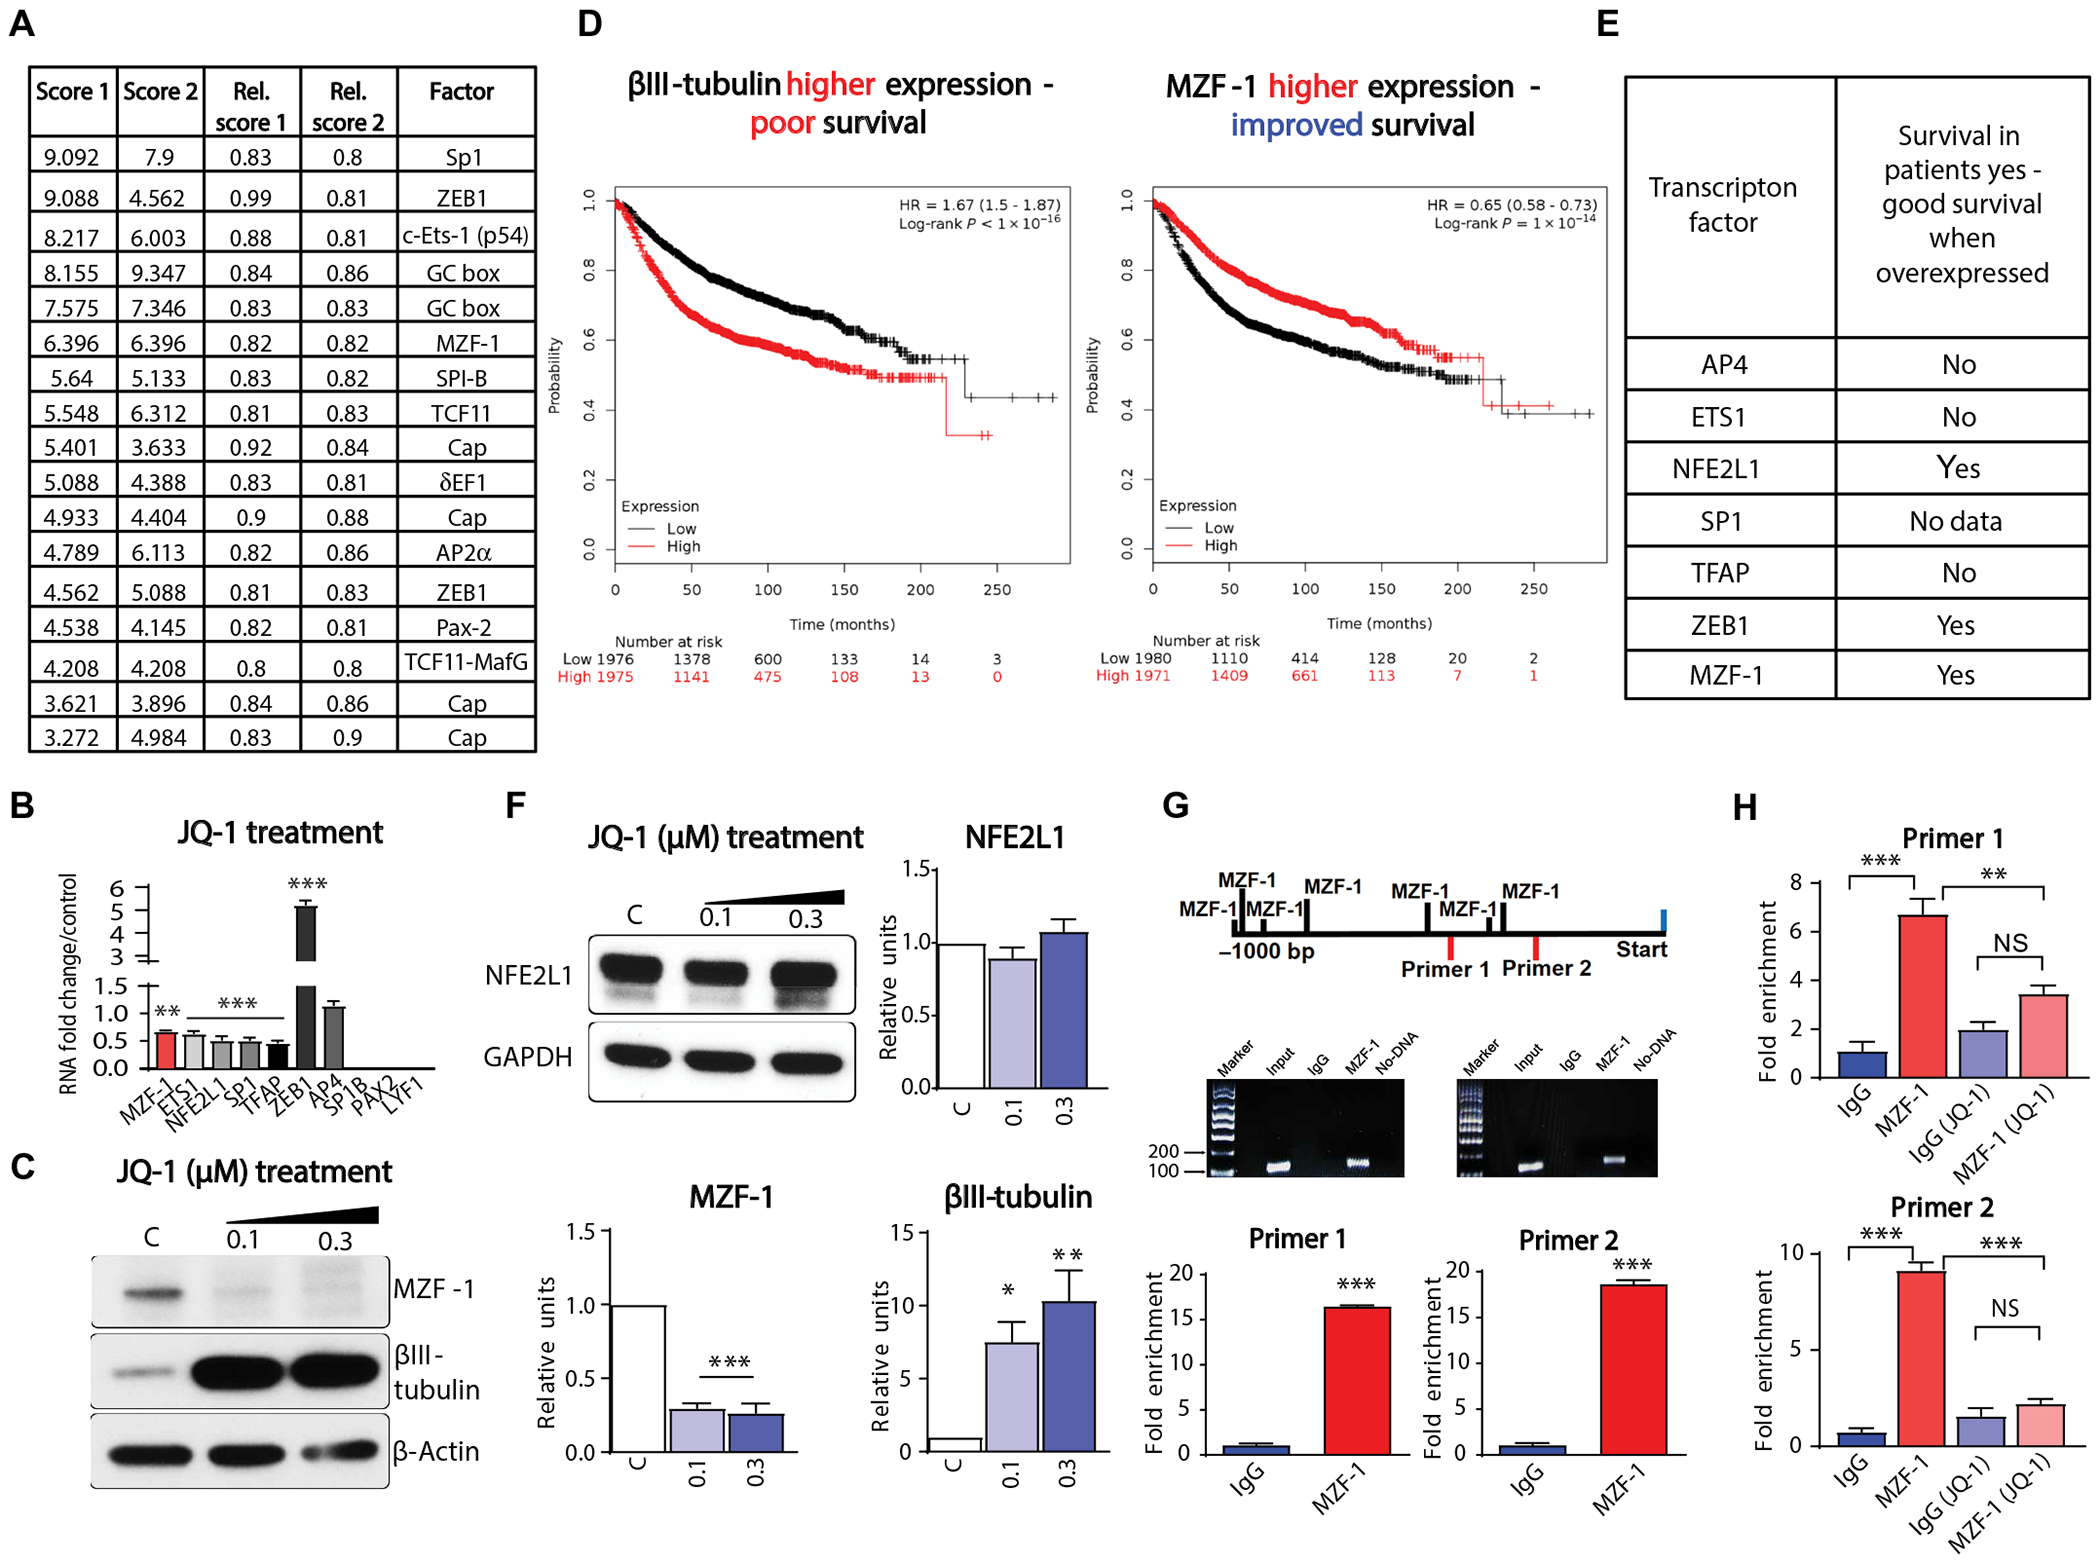
(A) CONREAL analysis of human and mouse TUBB3 promoter. (B) Identified transcription factors from CONREAL analysis of the promoter were analyzed by q-RT-PCR after JQ-1 treatment. (C) Western blot analysis of MZF-1 and TUBB3 in BT-474Br cells treated with JQ-1. Right panels show densitometry analysis of MZF-1 and βIII-tubulin, and C stands for DMSO control (biological replicates, n = 3). (D) Survival probabilities of breast cancer patients with high TUBB3 and MZF-1. HR, hazard ratio. (E) List of transcription factors identified from CONREAL analysis of TUBB3 promoter and their correlation in patient dataset. (F) Western blot analysis of NFE2L1 in BT-474Br cells treated with JQ-1. Right panels show densitometry analysis of NFE2L1, and C stands for DMSO control (biological replicates, n = 3). (G) Quantitation of MZF-1 bound to TUBB3 promoter through ChIp-q-RT-PCR analysis (biological replicates, n = 3). (H) Quantitation of MZF-1 bound to TUBB3 promoter through ChIp-q-RT-PCR analysis after JQ-1 treatment (biological replicates, n = 3). One-way ANOVA with Dunnett’s multiple comparisons test was used for (C) and (F) and that with Tukey’s test was used for (H). Unpaired t tests were used for (G). *P < 0.05; **P < 0.01; ***P < 0.001.
Further, using PROMO analysis, we identified putative MZF-1 binding sites that are 600 base pairs upstream of the TUBB3 promoter at −352 to −360, −378 to −384, and −503 to −510 (data file S1) (40). Next, we conducted a chromatin immunoprecipitation (ChIP)–qPCR analysis using antibodies against MZF-1. BT-474Br cells were subjected to ChIP-qPCR using two different TUBB3 promoter primers. We found up to 20-fold enrichment after pulldown by MZF-1 antibody as compared to that by immunoglobulin G (IgG) alone (Fig. 6G). Moreover, JQ-1 treatment also reduced the binding of MZF-1 to TUBB3 promoter (Fig. 6H). These results confirm that MZF-1 directly binds to the TUBB3 promoter.
MZF-1 represses TUBB3 expression
To evaluate whether MZF-1 regulates TUBB3 expression in vitro, we conducted transient transfection experiments using siRNA. Knockdown of MZF-1 in MDA-MB-231 cells resulted in increased TUBB3 expression at both the RNA and protein levels (Fig. 7, A and B). The stable knockdown of MZF-1 in HCC1954, CN34, and MDA-MB-231 cells increased TUBB3 expression (Fig. 7, C to E). These results were further supported by endogenous higher expression of MZF-1 and lower expression of TUBB3 in parental CN34 cells as compared to the BM counterpart of CN34Br cells (Fig. 7F). The stable knockdown of MZF-1 did not affect HCC1954 and CN34 cell proliferation in vitro or in vivo (fig. S12 and data file S2). On the other hand, transient overexpression of MZF-1 in HCC1569 resulted in down-regulation of TUBB3 expression (Fig. 7G). Stable overexpression of MZF-1 in BT-474Br, HCC1954, and CN34Br cell lines showed decreased TUBB3 expression (Fig. 7, H and I, and fig. S13A) but did not affect the proliferation of cells in vitro (HCC1954 and BT-474 Br) (fig. S13, B and C) or tumor growth in vivo (HCC1954) (fig. S13D). Immunofluorescence studies on the transiently transfected HCC1954 and HCC1569 cells and on CN34Br stable cells overexpressing MZF-1 revealed that MZF-1 in the nucleus virtually abolished TUBB3 expression (Fig. 7, J to L). Furthermore, the knockdown of MZF-1 in two different cell lines rendered the cells insensitive to combination therapy (fig. S14). These results demonstrate that augmented MZF-1 expression negatively regulates TUBB3 expression in breast cancer cells. Knockdown of c-Myc increased TUBB3 expression similar to MZF-1 knockdown, and combined knockdown of both transcription factors further increased TUBB3 expression (fig. S15). However, in our analysis, we did not find a c-Myc binding site in the TUBB3 promoter (Fig. 6A).
Fig. 7. MZF-1 regulates TUBB3 expression.
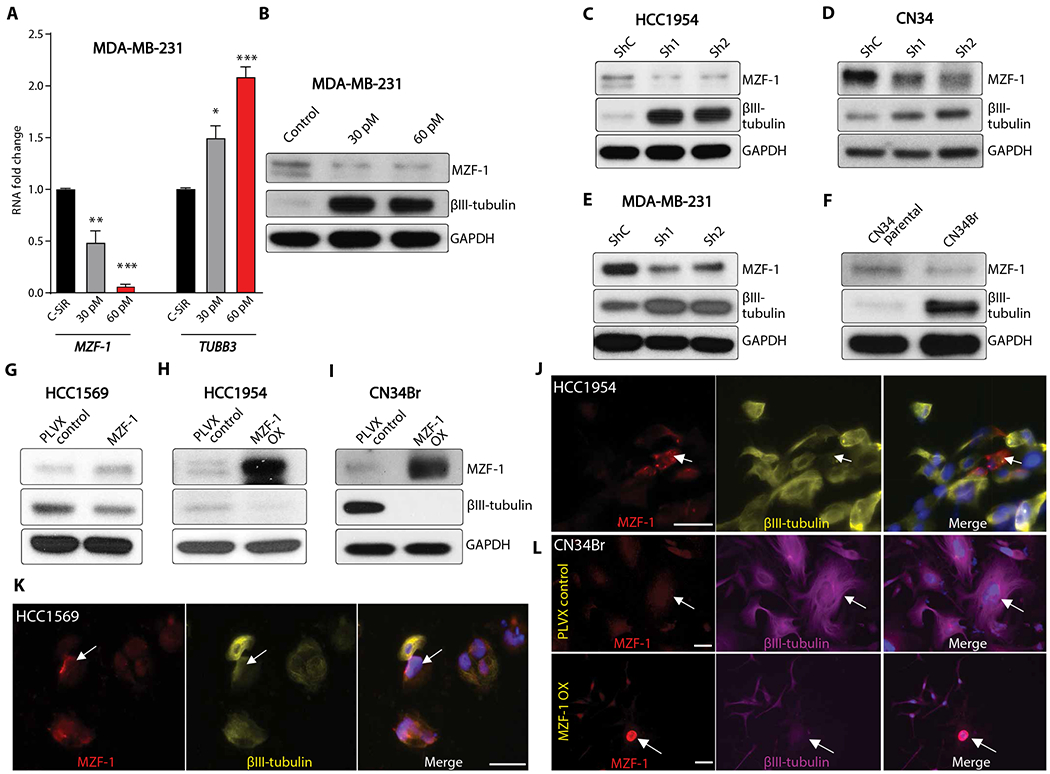
(A and B) q-RT-PCR (A) and Western blot (B) analysis of TUBB3 and MZF-1 after transient knockdown of MZF-1 in MDA-MB-231 cells. (C to E) Western blot analysis of TUBB3 and MZF-1 after stable knockdown of MZF-1 in (C) HCC1954 cells, (D) CN34, and (E) MDA-MB-231 cells. (F) Western blot analysis of TUBB3 and MZF-1 in paired parental and brain metastatic cells CN34/CN34Br. (G) Transient overexpression of MZF-1 in HCC1569 cells. (H and I) Stable overexpression of MZF-1 in HCC1954 (H) and CN34Br (I) cells and Western blot analysis of MZF-1 and TUBB3. (J and K) Immunofluorescence analysis of HCC1954 (J) and HCC1569 (K) cells after transient overexpression of MZF-1. White scale bars, 50 μm. (L) Immunofluorescence analysis of CN34Br cells after stable overexpression of MZF-1. White scale bars, 50 μm. Red, MZF-1; yellow, TUBB3; blue, DAPI; arrows indicate MZF-1 staining. One-way ANOVA with Dunnett’s multiple comparisons test was used for (A). *P < 0.05; **P < 0.01; ***P < 0.001.
MZF-1 binds to TUBB3 promoter and regulates metastasis
To evaluate whether MZF-1 could alter the invasive capability of breast cancer cells, we investigated MZF-1–overexpressing HCC1954 cells in an invasion assay. MZF-1–overexpressing cells exhibited a 3.7-fold decrease in invasive capability as compared to controls (Fig. 8A).
Fig. 8. MZF-1 binds to TUBB3 promoter and regulates BM.
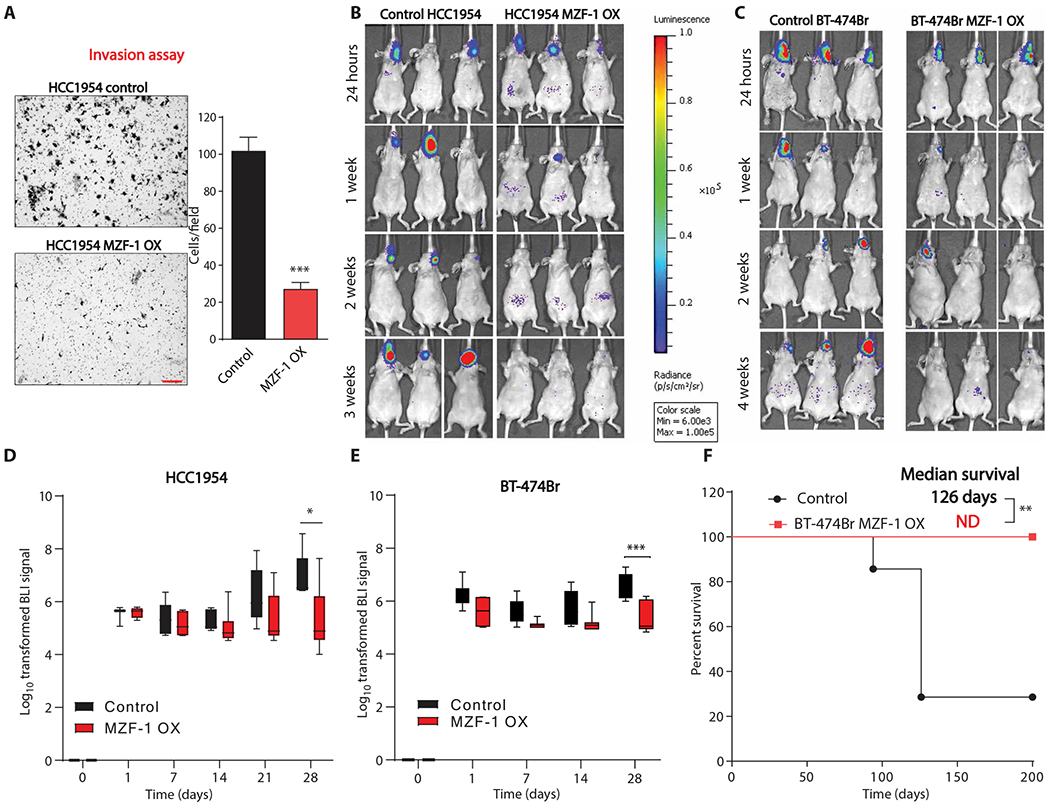
(A) Invasion assay of HCC1954 control cells and HCC1954 cells overexpressing MZF-1. Red scale bar, 200 μm. Right panel shows quantitation of invasion, n = 3 biological replicates. (B and C) Bioluminescence imaging of mice with intracarotid injection of control or MZF-1–overexpressing HCC1954 (B) and BT-474Br (C) cells. (D) Quantitation of bioluminescence imaging of control and MZF-1–overexpressing HCC1954 cells, n = 5 for control group and n = 6 for MZF-1–overexpressing group. (E) Quantitation of bioluminescence imaging of control and MZF-1–overexpressing BT-474Br cells, n = 7 per group. (F) Survival analysis of mice injected with control or MZF-1–overexpressing cells, n = 7 per group. Unpaired t test was used for (A). Linear mixed model was fitted for both (D) and (E), and the differences between the two groups for each time point were calculated using the least squares means method and adjusted using Sidak’s method. Log-rank test was used to compare the two survival curves in (F). *P < 0.05; **P < 0.01; ***P < 0.001. BLI, bioluminescence.
We then evaluated whether MZF-1 overexpression in breast cancer cells regulates brain-metastatic capability of cells. We performed intracarotid artery injections of MZF-1–overexpressing, mCherry and luciferase-positive HCC1954 and BT-474Br cells in mice. Injection accuracy was confirmed by luciferase signal in the brain at 24 hours (Fig. 8, B and C). At the 4-week time point, there was a significant reduction in luciferase signal in the HCC1954 MZF-1 OX cells and BT-474Br MZF-1 OX cells as compared to controls, respectively (P < 0.05) (Fig. 8, D and E). The overexpression of MZF-1 did not alter the proliferation ability of HCC1954 when injected into mammary fat pads (fig. S13D). These results demonstrate that MZF-1 overexpression decreases the brain-metastatic ability of breast cancer cells in two separate models. Furthermore, we evaluated the survival ability of mice, injected with BT-474Br MZF-1 OX cells, and found a significant improvement in survival of mice injected with MZF-1–overexpressing cells (P < 0.01) (Fig. 8F). These data indicate that MZF-1 regulates TUBB3 protein expression and thus the brain metastatic capability of breast cancer cells (fig. S16).
DISCUSSION
Metastasis is a hallmark of cancer that involves complex processes to establish tumors in distant organs (41). Numerous studies have aimed to identify proteins crucial for mediating each stage of metastasis (42–44). However, literature on the treatment of preexisting BMs remains scarce.
Tubulin proteins have been targets for anticancer therapy since the discovery of microtubule poisons like colchicine, vinca alkaloids, and taxanes. Vinca alkaloids destabilize the microtubule, which leads to microtubule disassembly and cell death (16). VRB is a second-generation semisynthetic vinca alkaloid, which is extensively used in the clinic as a first-line drug for the treatment of metastatic NSCLC. It is also used in patients with advanced breast cancer in conjunction with trastuzumab (45). VRB crosses the BBB in a limited fashion (31) and is relatively safe as compared to vinblastine and vincristine, which have adverse effects on axonal microtubules, resulting in nonspecific neurotoxicity (46).
High expression of a molecular target can increase the therapeutic efficacy of the targeting drug. For example, epigenetic drugs 5Aza and trichostatin increase ERα expression in breast cancer cells, which sensitizes the cells to ER inhibition by tamoxifen (20, 21). Restoration of aryl hydrocarbon receptor (AhR) through the epigenetic drug vorinostat sensitizes breast cancer cells to aminoflavone (therapeutic target for AhR) (47). Moreover, overexpression or reexpression of known therapeutic target proteins such as BubR1 sensitizes neoplastic cells to nocodazole in otherwise resistant cancer cells (48). Hence, the presence of target protein expression helps determine the sensitivity of cancer cells to chemotherapy.
In this study, we evaluated the regulation of TUBB3 and its feasibility as a target for therapy in preexisting BM. Our results demonstrate that TUBB3 expression increases through BET inhibition (JQ-1 and iBET). This increase rendered cancer cells sensitive to VRB-mediated cell death in an orthotopic breast cancer model. Furthermore, our results in a model of multiple BM demonstrated a significant survival benefit with combination treatment using VRB and iBET (P < 0.01). Through in silico and in vitro studies, we identified MZF-1 as a negative regulator of TUBB3 expression and confirmed its role through knockdown and overexpression experiments. MZF-1 binds to the promoter region of TUBB3 and represses transcription. Further pharmacological down-regulation of MZF-1 through BET inhibition also correlates with increased TUBB3 expression. We found that the combination of BET inhibition with VRB is lethal to cancer cells, because high TUBB3 expression sensitizes neoplastic cells to VRB-mediated therapy.
WBRT and SRS remain the mainstay of treatment for patients with unresectable multiple BM (6). We evaluated the combination therapy of iBET and VRB in conjunction with radiation. Our results demonstrated a significant increase in the survival of mice (P < 0.01). Seventy percent of the mice remained alive 295 days after triple combination therapy with radiation, iBET, and VRB. This improvement in survival is attributed not only to the iBET-mediated increase in TUBB3 expression but also to radiation, which further sensitizes cancer cells to VRB. This combination of radiation along with BET inhibitor and VRB may be effective in improving the survival of patients with BM. It is known that radiation disrupts the functional integrity of the BBB (49), which could further assist in the delivery of effective doses of both drugs to impart survival benefit. All together, these findings indicate that BET inhibition sensitizes BM cells to VRB.
TUBB3 expression is required for metastases (15), and we anticipate that the sensitization of cancer cells to VRB therapy requires high TUBB3 expression, not just a marginal increase of two- to fourfold of TUBB3 as exhibited by the brain metastatic cells studied here (15). Our results on ectopic overexpression of TUBB3-V5 tag demonstrated that VRB alone increased apoptosis in TUBB3-V5 tag overexpressing cells, whereas the combination treatment (JQ-1 + VRB) further increased cell death in TUBB3-V5 tag overexpressing cells. Microarray and RNA sequencing results indicate that TUBB3 is up-regulated in response to BET inhibition in multiple cancer models, including TNBC (50) and diffuse intrinsic pontine glioma (51). Hence, in theory, the clinical utility of our work could be extrapolated to other cancers, where TUBB3 expression can be increased through BET inhibition. Given the clinical utility of many anti-microtubule agents and considering that BET inhibitors act synergistically with microtubule inhibitors (52), our work highlights the potential of BET inhibitors in increasing the sensitivity of cancer cells to anti-microtubule agents.
MZF-1 is a multifaceted protein, which acts as both a transcriptional activator and repressor (53–57). Many studies have portrayed its controversial role in tumor growth (56–60). For example, targeted disruption of MZF-1 in mouse germ line results in neoplastic progression in the myeloid compartment (58). In gastric and prostate cancer cells, MZF-1 functions as a tumor suppressor (56, 57), whereas in colorectal, cervical, and hepatocellular cancer cells, MZF-1 has been shown to promote tumor progression (59, 60). However, the role of MZF-1 in the brain metastatic process remained undetermined. In our work, we found that MZF-1 overexpression reduces BMs in vivo. This is attributed to a reduction in TUBB3, which ultimately regulates BMs (15).
One of the limitations to our study is the use of patient-derived xenograft models of BM and the use of a single cell line model for the analysis of therapeutic efficacy in combination treatment. PDXs are limited in availability, and at present, only a few are described in the scientific community. Nevertheless, this work warrants further exploration in other models of BM. In addition, we have not explored the possibility of posttranslational modification of MZF-1, which is bound to influence gene expression (61). Despite these limitations, our work provides a rationale for further testing of the FDA-approved drug VRB in combination with iBET for the treatment of BM.
MATERIALS AND METHODS
Study design
The purpose of the study was to evaluate the in vitro and in vivo efficacy of combination therapy of BET inhibitor and VRB in breast cancer. Power calculation estimated seven mice per group to detect the effect of VRB + iBET treatment group compared with control group (Stata v14.2, for a hazard ratio of 0.115 calculated using SAS v9.4 based on our pilot experiment, with α = 0.05, power = 0.80). Mice were randomized into various groups, and investigators were not blinded for the animal experiments. Experiments were repeated at least three different times, and technical replicates are reported for viability and apoptosis assays. Three biological replicates were used for quantification of Western blots.
Statistical analysis
Statistical analyses were performed using GraphPad Prism Version 8 for Windows (GraphPad Software, www.graphpad.com), SAS 9.4 (SAS Institute Inc.), and R version 3.5.2 (R Foundation for Statistical Computing). For continuous variables, data were reported as means ± SEM. For categorical variables, data were reported as number (percentage). For continuous variables, depending on whether the assumption of normality and the assumption of equal variance were met, Student’s unpaired t test (when both assumptions were met) or unpaired t test with Welch’s correction (when only the assumption of equal variance was not met) was used for two unpaired groups. One-way analysis of variance (ANOVA) test with Tukey’s or Dunnett’s multiple comparisons tests were performed for multiple group comparisons. For data with two independent variables, for example, treatment and time, linear mixed model was fitted, and the differences among groups were evaluated using the least squares means method and adjusted by Sidak’s method or Dunnett’s method, as indicated in the figure legends. Kaplan-Meier survival curves were plotted and compared using log-rank test for proportional hazard rates or Renyi statistics for crossing hazard rates as indicated in the figure legends (62). Statistical significance is indicated as *P < 0.05; **P < 0.01; ***P < 0.001. Original data are shown in data file S3, and the original, unprocessed Western blots are presented in the Supplementary Materials (figs. S17 to S20).
Animal experiments
All animal studies were completed per the National Institutes of Health guidelines on the care and use of laboratory animals for research purposes. The Institutional Committee on Animal Use at the Northwestern University approved the protocols. Six- to eight-week-old athymic nude female mice were obtained from Charles River and maintained in a specific pathogen–free facility. Mice were anesthetized with an intraperitoneal injection of 100 μl of a stock solution containing ketamine HCl (25 mg/ml) and xylazine (2.5 mg/ml). For the stereotactic intracranial injection, the surgical site was prepared with 70% ethyl alcohol. A midline incision was made, and a 1-mm-diameter parietal burr hole, centered 2 mm posterior to the coronal suture and 2 mm lateral to the sagittal suture, was drilled. Mice were placed in a stereotactic frame, and 5 × 10⁵ BT-474Br cells previously resuspended in 5 μl of sterile phosphate-buffered saline (PBS) were intracranially injected with a 26-gauge needle at a depth of 3 mm. The needle was removed, and the skin was sutured with a 4–0 absorbable, synthetic braided suture. Mice were monitored for 2 months and euthanized when meeting the established Institutional Animal Care and Use Committee (IACUC) criteria for euthanasia (63). For mammary gland injections, 1 × 10⁶ HCC1954 and HCC1569 cells were diluted 1:1 with Matrigel Matrix (BD Biosciences) for a final volume of 40 μl and injected in the inguinal mammary fat pad of nude female mice. Two weeks after tumor cell injection, mice were randomly divided into four treatment groups: (i) vehicle (25% captisol) through intraperitoneal injection, (ii) VRB (5 mg/kg) through oral gavage, (iii) iBET-762 or JQ-1 (25 mg/kg) through intraperitoneal injection, and (iv) combination with iBET or JQ-1 followed by VRB the next day. Tumor growth was monitored twice a week by caliper measurement.
For intracranial injections and survival analysis, BT-474Br cells were intracranially injected. After 1 week, mice were randomly divided among four treatment groups: vehicle (25% captisol) through intraperitoneal injection, VRB (5 mg/kg) through gavage, iBET (25 mg/kg) through intraperitoneal injection, and the combination of iBET followed by VRB the following day. With respect to the dosing schedule, the combination group was treated with iBET on days 1 and 4, whereas VRB was administered on days 2 and 5. The group receiving iBET alone was given iBET on days 1 and 4. The group receiving VRB alone was given VRB on days 2 and 5. The mice were treated as such for a total of 3 months.
For triple combination therapy (radiation + iBET + VRB), 3 weeks after intracarotid injections, mice were randomly divided into two groups. Group 1, 28 mice were irradiated with 10 Gy fractionated to 2 Gy every day for 5 days; whereas group 2, 28 mice remained untreated. Each of these two groups was further randomly subdivided into four pharmacologic treatment groups: vehicle (25% captisol) through intraperitoneal injection, VRB (5 mg/kg) through oral gavage, iBET (25 mg/kg) through intraperitoneal injection, or the combination of iBET + VRB. After 1 week of recovery from radiation, the pharmacologic treatment with saline, VRB, iBET, or both was initiated. The treatment was dosed as described before for intracranial injections. Animals were treated for a total of 4 months. Brain tissues and mammary gland tumors were embedded in optimal cutting temperature (OCT) freezing reagent, and sections with a thickness of 5 μm were cut, air-dried, and stained with hematoxylin and eosin (H&E).
Intracarotid injections
The animal studies were approved by the IACUC of Northwestern University, Chicago. The brain metastatic BT-474Br cells were harvested and passed through a 70 μM strainer to obtain single cells. The cells were then centrifuged at 350g for 5 min and washed with cold PBS. The cells were counted and aliquoted, with 1 million cells in 200 μl of cold PBS. Six- to eight-week-old nude mice were anesthetized by intraperitoneal injection of ketamine/xylazine cocktail and positioned in dorsal recumbency. Eye lubricant was applied into the eyes to prevent corneal ulcer formation. The surgical field at the ventral side of the neck was draped and sterilized by applying povidone-iodine followed by 70% alcohol solution application. A 1-cm-long skin incision was created using a surgical blade. The underlying subcutaneous tissue was gently dissected, and the sternohyoid muscle was bluntly separated from sternomastoid muscle to expose the left common carotid artery. Then, digastric muscle was bluntly separated to expose the external and internal branches of the common carotid artery. Further, the vagus nerve was gently separated from the carotid artery using surgical forceps under a dissection microscope. A tight surgical knot was placed at the caudal end of the common carotid artery. A cotton ball dipped in sterile PBS was placed below the carotid artery to assist in injection and to maintain moisture over the artery. A second tight surgical knot was placed over the external branch of the carotid artery, and a loose surgical knot was then placed over the internal branch of the artery to secure the inserted injection cannula. Before arteriotomy, a hemoclip was placed over the common carotid artery to control bleeding. An arteriotomy was performed, and a 34-gauge cannula was inserted into the lumen of artery followed by infusion of 100 μl of cells. Once the infusion of cells was completed, the internal branch of the common carotid artery was permanently tightened to prevent the leakage of cells. Previously bluntly separated muscles were moved to the original sites, and subcutaneous tissue and skin were closed with 6-0 size nylon surgical sutures in a simple interrupted fashion.
Bioluminescence imaging
The brain-metastatic capabilities of BT-474BrM3-mCherry-Luc and HCC1954-mCherry-Luc cells were monitored weekly. Mice were administered Luciferin (15 mg/ml) (in sterile PBS) (GoldBio) through intraperitoneal injection. The mice were sedated with isoflurane anesthesia and placed in the bioluminescence camera box of IVIS spectrum imager for about 10 min, and bioluminescence was measured.
Supplementary Material
Acknowledgments:
We would like to thank A. Lopez-Rosas for technical assistance. We thank D. Horiuchi for cell lines and V5-tagged antibody. We thank E. Gonzalez-Buendia for assistance with ChIP analysis and J. R. Kane for critically reading the manuscript. We would like to thank J. Massague (MSKCC) for providing the MDA-MB-231Br, CN34, and CN34Br cell lines. We would like to thank D. Yu (MD Anderson Cancer Centre) for providing the BT-474 and BT-474Br cell lines.
Funding:
This work was supported by NIH grants R35CA197725, R01NS093903, and P50CA221747 to M.S.L., R01NS87990 to M.S.L. and I.V.B., R01NS106379 01A1 to I.V.B., 1R01NS096376-01A1 to A.U.A., 5R21CA220625 to K.K., and R01NS102669 to C.H.
Footnotes
Competing interests: The authors declare that they have no competing interests.
Data and materials availability:
All data associated with this study are present in the paper or the Supplementary Materials.
REFERENCES AND NOTES
- 1.Steeg PS, Camphausen KA, Smith QR, Brain metastases as preventive and therapeutic targets. Nat. Rev. Cancer 11,352–363 (2011). [DOI] [PMC free article] [PubMed] [Google Scholar]
- 2.Fares J, Kanojia D, Cordero A, Rashidi A, Miska J, Schwartz CW, Savchuk S, Ahmed AU, Balyasnikova IV, Cristofanilli M, Gradishar WJ, Lesniak MS, Current state of clinical trials in breast cancer brain metastases. Neurooncol. Pract. 6, 392–401 (2019). [DOI] [PMC free article] [PubMed] [Google Scholar]
- 3.Kodack DP, Askoxylakis V, Ferraro GB, Fukumura D, Jain RK, Emerging strategies for treating brain metastases from breast cancer. Cancer Cell 27, 163–175 (2015). [DOI] [PMC free article] [PubMed] [Google Scholar]
- 4.Kennecke H, Yerushalmi R, Woods R, Cheang MCU, Voduc D, Speers CH, Nielsen TO, Gelmon K, Metastatic behavior of breast cancer subtypes. J. Clin. Oncol 28, 3271–3277 (2010). [DOI] [PubMed] [Google Scholar]
- 5.Lin NU, Amiri-Kordestani L, Palmieri D, Liewehr DJ, Steeg PS, CNS metastases in breast cancer: Old challenge, new frontiers. Clin. Cancer Res. 19, 6404–6418 (2013). [DOI] [PMC free article] [PubMed] [Google Scholar]
- 6.Eichler AF, Loeffler JS, Multidisciplinary management of brain metastases. Oncologist 12, 884–898 (2007). [DOI] [PubMed] [Google Scholar]
- 7.Arvold ND, Lee EQ, Mehta MP, Margolin K, Alexander BM, Lin NU, Anders CK, Soffietti R, Camidge DR, Vogelbaum MA, Dunn IF, Wen PY, Updates in the management of brain metastases. Neuro Oncol. 18, 1043–1065 (2016). [DOI] [PMC free article] [PubMed] [Google Scholar]
- 8.Slamon DJ, Leyland-Jones B, Shak S, Fuchs H, Paton V, Bajamonde A, Fleming T, Eiermann W, Wolter J, Pegram M, Baselga J, Norton L, Use of chemotherapy plus a monoclonal antibody against HER2 for metastatic breast cancer that overexpresses HER2. N. Engl. J. Med 344, 783–792 (2001). [DOI] [PubMed] [Google Scholar]
- 9.Mehta AI, Brufsky AM, Sampson JH, Therapeutic approaches for HER2-positive brain metastases: Circumventing the blood–brain barrier. Cancer Treat. Rev. 39, 261–269 (2013). [DOI] [PMC free article] [PubMed] [Google Scholar]
- 10.Palmieri D, Bronder JL, Herring JM, Yoneda T, Weil RJ, Stark AM, Kurek R, Vega-Valle E, Feigenbaum L, Halverson D, Vortmeyer AO, Steinberg SM, Aldape K, Steeg PS, Her-2 overexpression increases the metastatic outgrowth of breast cancer cells in the brain. Cancer Res. 67, 4190–4198 (2007). [DOI] [PubMed] [Google Scholar]
- 11.Ni J, Ramkissoon SH, Xie S, Goel S, Stover DG, Guo H, Luu V, Marco E, Ramkissoon LA, Kang YJ, Hayashi M, Nguyen Q-D, Ligon AH, Du R, Claus EB, Alexander BM, Yuan G-C, Wang ZC, Iglehart JD, Krop IE, Roberts TM, Winer EP, Lin NU, Ligon KL, Zhao JJ, Combination inhibition of PI3K and mTORC1 yields durable remissions in mice bearing orthotopic patient-derived xenografts of HER2-positive breast cancer brain metastases. Nat. Med 22, 723–726 (2016). [DOI] [PMC free article] [PubMed] [Google Scholar]
- 12.Kabraji S, Ni J, Lin NU, Xie S, Winer EP, Zhao JJ, Drug resistance in HER2-positive breast cancer brain metastases: Blame the barrier or the brain? Clin. Cancer Res. 24, 1795–1804 (2018). [DOI] [PMC free article] [PubMed] [Google Scholar]
- 13.Kodack DP, Askoxylakis V, Ferraro GB, Sheng Q, Badeaux M, Goel S, Qi X, Shankaraiah R, Cao ZA, Ramjiawan RR, Bezwada D, Patel B, Song Y, Costa C, Naxerova K, Wong CSF, Kloepper J, Das R, Tam A, Tanboon J, Duda DG, Miller CR, Siegel MB, Anders CK, Sanders M, Estrada MV, Schlegel R, Arteaga CL, Brachtel E, Huang A, Fukumura D, Engelman JA, Jain RK, The brain microenvironment mediates resistance in luminal breast cancer to PI3K inhibition through HER3 activation. Sci. Transl. Med 9, eaal4682 (2017). [DOI] [PMC free article] [PubMed] [Google Scholar]
- 14.Kodack DP, Chung E, Yamashita H, Incio J, Duyverman AMMJ, Song Y, Farrar CT, Huang Y, Ager E, Kamoun W, Goel S, Snuderl M, Lussiez A, Hiddingh L, Mahmood S, Tannous BA, Eichler AF, Fukumura D, Engelman JA, Jain RK, Combined targeting of HER2 and VEGFR2 for effective treatment of HER2-amplified breast cancer brain metastases. Proc. Natl. Acad. Sci. U.S.A 109, E3119–E3127 (2012). [DOI] [PMC free article] [PubMed] [Google Scholar]
- 15.Kanojia D, Morshed RA, Zhang L, Miska JM, Qiao J, Kim JW, Pytel P, Balyasnikova IV, Lesniak MS, Ahmed AU, βIII-tubulin regulates breast cancer metastases to the brain. Mol. Cancer Ther. 14, 1152–1161 (2015). [DOI] [PMC free article] [PubMed] [Google Scholar]
- 16.Kavallaris M, Microtubules and resistance to tubulin-binding agents. Nat. Rev. Cancer 10, 194–204 (2010). [DOI] [PubMed] [Google Scholar]
- 17.Mozzetti S, Ferlini C, Concolino P, Filippetti F, Raspaglio G, Prislei S, Gallo D, Martinelli E, Ranelletti FO, Ferrandina G, Scambia G, Class III β-tubulin overexpression is a prominent mechanism of paclitaxel resistance in ovarian cancer patients. Clin. Cancer Res. 11 , 298–305 (2005). [PubMed] [Google Scholar]
- 18.Hirai Y, Yoshimasu T, Oura S, Ota F, Naito K, Nishiguchi H, Hashimoto S, Okamura Y, Is class III β-tubulin a true predictive marker of sensitivity to vinorelbine in non-small cell lung cancer? Chemosensitivity data evidence. Anticancer Res. 31,999–1005 (2011). [PubMed] [Google Scholar]
- 19.Seve P, Lai R, Ding K, Winton T, Butts C, Mackey J, Dumontet C, Dabbagh L, Aviel-Ronen S, Seymour L, Whitehead M, Tsao M-S, Shepherd FA, Reiman T, Class III β-tubulin expression and benefit from adjuvant cisplatin/vinorelbine chemotherapy in operable non–small cell lung cancer: Analysis of NCIC JBR.10. Clin. Cancer Res. 13, 994–999 (2007). [DOI] [PubMed] [Google Scholar]
- 20.Sharma D, Saxena NK, Davidson NE, Vertino PM, Restoration of tamoxifen sensitivity in estrogen receptor–negative breast cancer cells: Tamoxifen-bound reactivated ER recruits distinctive corepressor complexes. Cancer Res. 66, 6370–6378 (2006). [DOI] [PMC free article] [PubMed] [Google Scholar]
- 21.Jang ER, Lim S-J, Lee ES, Jeong G, Kim T-Y, Bang Y-J, Lee J-S, The histone deacetylase inhibitor trichostatin A sensitizes estrogen receptor α-negative breast cancer cells to tamoxifen. Oncogene 23, 1724–1736 (2004). [DOI] [PubMed] [Google Scholar]
- 22.Izutsu N, Maesawa C, Shibazaki M, Oikawa H, Shoji T, Sugiyama T, Masuda T, Epigenetic modification is involved in aberrant expression of class III β-tubulin, TUBB3, in ovarian cancer cells. Int. J. Oncol 32, 1227–1235 (2008). [DOI] [PubMed] [Google Scholar]
- 23.Filippakopoulos P, Qi J, Picaud S, Shen Y, Smith WB, Fedorov O, Morse EM, Keates T, Hickman TT, Felletar I, Philpott M, Munro S, McKeown MR, Wang Y, Christie AL, West N, Cameron MJ, Schwartz B, Heightman TD, La Thangue N, French CA, Wiest O, Kung AL, Knapp S, Bradner JE, Selective inhibition of BET bromodomains. Nature 468, 1067–1073 (2010). [DOI] [PMC free article] [PubMed] [Google Scholar]
- 24.Stathis A, Bertoni F, BET proteins as targets for anticancer treatment. Cancer Discov. 8, 24–36 (2018). [DOI] [PubMed] [Google Scholar]
- 25.Kavallaris M, Kuo DY, Burkhart CA, Regl DL, Norris MD, Haber M, Horwitz SB, Taxol-resistant epithelial ovarian tumors are associated with altered expression of specific beta-tubulin isotypes. J. Clin. Invest 100, 1282–1293 (1997). [DOI] [PMC free article] [PubMed] [Google Scholar]
- 26.Koh Y, Jang B, Han S-W, Kim T-M, Oh D-Y, Lee S-H, Kang CH, Kim D-W, Im S-A, Chung DH, Kim YT, Kim T-Y, Kim Y-W, Kim JH, Heo DS, Bang Y-J, Expression of class III β-tubulin correlates with unfavorable survival outcome in patients with resected non-small cell lung cancer. J. Thorac. Oncol 5, 320–325 (2010). [DOI] [PubMed] [Google Scholar]
- 27.Pentheroudakis G, Batistatou A, Kalogeras KT, Kronenwett R, Wirtz RM, Bournakis E, Eleftheraki AG, Pectasides D, Bobos M, Papaspirou I, Kamina S, Gogas H, Koutras AK, Pavlidis N, Fountzilas G, Prognostic utility of β-tubulin isotype III and correlations with other molecular and clinicopathological variables in patients with early breast cancer: A translational Hellenic Cooperative Oncology Group (HeCOG) study. Breast Cancer Res. Treat. 127, 179–193 (2011). [DOI] [PubMed] [Google Scholar]
- 28.Zhang S, Huang W-C, Zhang L, Zhang C, Lowery FJ, Ding Z, Guo H, Wang H, Huang S, Sahin AA, Aldape KD, Steeg PS, Yu D, SRC family kinases as novel therapeutic targets to treat breast cancer brain metastases. Cancer Res. 73, 5764–5774 (2013). [DOI] [PMC free article] [PubMed] [Google Scholar]
- 29.Nahta R, Esteva FJ, Trastuzumab: Triumphs and tribulations. Oncogene 26, 3637–3643 (2007). [DOI] [PubMed] [Google Scholar]
- 30.Zhang Y, Yang H, Liu J, Deng Q, He P, Lin Y, Jiang J, Gu X, Mo M, Pan H, Xiong X, Qiu Y, He J, High expression levels of class III β-tubulin in resected non-small cell lung cancer patients are predictive of improved patient survival after vinorelbine-based adjuvant chemotherapy. Oncol. Lett 6, 220–226 (2013). [DOI] [PMC free article] [PubMed] [Google Scholar]
- 31.Samala R, Thorsheim HR, Goda S, Taskar K, Gril B, Steeg PS, Smith QR, Vinorelbine delivery and efficacy in the MDA-MB-231BR preclinical model of brain metastases of breast cancer. Pharm. Res 33, 2904–2919 (2016). [DOI] [PMC free article] [PubMed] [Google Scholar]
- 32.Leal AS, Williams CR, Royce DB, Pioli PA, Sporn MB, Liby KT, Bromodomain inhibitors, JQ1 and I-BET 762, as potential therapies for pancreatic cancer. Cancer Lett. 394, 76–87 (2017). [DOI] [PubMed] [Google Scholar]
- 33.Knick VC, Eberwein DJ, Miller CG, Vinorelbine tartrate and paclitaxel combinations: Enhanced activity against in vivo P388 murine leukemia cells. J. Natl. Cancer Inst. 87, 1072–1077 (1995). [DOI] [PubMed] [Google Scholar]
- 34.Mirguet O, Gosmini R, Toum J, Clément CA, Barnathan M, Brusq J-M, Mordaunt JE, Grimes RM, Crowe M, Pineau O, Ajakane M, Daugan A, Jeffrey P, Cutler L, Haynes AC, Smithers NN, Chung C.-w., Bamborough P, Uings IJ, Lewis A, Witherington J, Parr N, Prinjha RK, Nicodème E, Discovery of epigenetic regulator I-BET762: Lead optimization to afford a clinical candidate inhibitor of the BET bromodomains. J. Med. Chem 56, 7501–7515 (2013). [DOI] [PubMed] [Google Scholar]
- 35.Vetter NS, Kolb EA, Mills CC, Sampson VB, The microtubule network and cell death are regulated by an miR-34a/Stathmin 1/βIII-tubulin axis. Mol. Cancer Res. 15, 953–964 (2017). [DOI] [PMC free article] [PubMed] [Google Scholar]
- 36.Cao S, Du J, Lv Y, Lin H, Mao Z, Xu M, Liu M, Liu Y, PAX3 inhibits β-Tubulin-III expression and neuronal differentiation of neural stem cell. Biochem. Biophys. Res. Commun 485, 307–311 (2017). [DOI] [PubMed] [Google Scholar]
- 37.Bordji K, Grandval A, Cuhna-Alves L, Lechapt-Zalcman E, Bernaudin M, Hypoxia-inducible factor-2α (HIF-2α), but not HIF-1α, is essential for hypoxic induction of class III μ-tubulin expression in human glioblastoma cells. FEBS J. 281,5220–5236 (2014). [DOI] [PubMed] [Google Scholar]
- 38.Berezikov E, Guryev V, Plasterk RHA, Cuppen E, CONREAL: Conserved regulatory elements anchored alignment algorithm for identification of transcription factor binding sites by phylogenetic footprinting. Genome Res. 14, 170–178 (2004). [DOI] [PMC free article] [PubMed] [Google Scholar]
- 39.Györffy B, Lanczky A, Eklund AC, Denkert C, Budczies J, Li Q, Szallasi Z, An online survival analysis tool to rapidly assess the effect of 22,277 genes on breast cancer prognosis using microarray data of 1,809 patients. Breast Cancer Res. Treat. 123, 725–731 (2010). [DOI] [PubMed] [Google Scholar]
- 40.Messeguer X, Escudero R, Farré D, Núñez O, Martínez J, Albà MM, PROMO: Detection of known transcription regulatory elements using species-tailored searches. Bioinformatics 18, 333–334 (2002). [DOI] [PubMed] [Google Scholar]
- 41.Massagué J, Obenauf AC, Metastatic colonization by circulating tumour cells. Nature 529, 298–306 (2016). [DOI] [PMC free article] [PubMed] [Google Scholar]
- 42.Bos PD, Zhang XH-F, Nadal C, Shu W, Gomis RR, Nguyen DX, Minn AJ, van de Vijver MJ, Gerald WL, Foekens JA, Massagué J, Genes that mediate breast cancer metastasis to the brain. Nature 459, 1005–1009 (2009). [DOI] [PMC free article] [PubMed] [Google Scholar]
- 43.Valiente M, Obenauf AC, Jin X, Chen Q, Zhang XH-F, Lee DJ, Chaft JE, Kris MG, Huse JT, Brogi E, Massagué J, Serpins promote cancer cell survival and vascular co-option in brain metastasis. Cell 156, 1002–1016 (2014). [DOI] [PMC free article] [PubMed] [Google Scholar]
- 44.Cordero A, Kanojia D, Miska J, Panek WK, Xiao A, Han Y, Bonamici N, Zhou W, Xiao T, Wu M, FABP7 is a key metabolic regulator in HER2+ breast cancer brain metastasis. Oncogene 38, 6445–6460 (2019). [DOI] [PMC free article] [PubMed] [Google Scholar]
- 45.Weber BL, Vogel C, Jones S, Harvey H, Hutchins L, Bigley J, Hohneker J, Intravenous vinorelbine as first-line and second-line therapy in advanced breast cancer. J. Clin. Oncol 13, 2722–2730 (1995). [DOI] [PubMed] [Google Scholar]
- 46.Fellous A, Ohayon R, Vacassin T, Binet S, Lataste H, Krikorian A, Couzinier JP, Meininger V, Biochemical effects of Navelbine on tubulin and associated proteins. Semin. Oncol 16, 9–14 (1989). [PubMed] [Google Scholar]
- 47.Stark K, Burger A, Wu J, Shelton P, Polin L, Li J, Reactivation of estrogen receptor α by vorinostat sensitizes mesenchymal-like triple-negative breast cancer to aminoflavone, a ligand of the aryl hydrocarbon receptor. PLOS ONE 8, e74525 (2013). [DOI] [PMC free article] [PubMed] [Google Scholar]
- 48.Schnerch D, Schmidts A, Follo M, Udi J, Felthaus J, Pfeifer D, Engelhardt M, Wäsch R, BubR1 is frequently repressed in acute myeloid leukemia and its re-expression sensitizes cells to antimitotic therapy. Haematologica 98, 1886–1895 (2013). [DOI] [PMC free article] [PubMed] [Google Scholar]
- 49.Qin D, Ou G, Mo H, Song Y, Kang G, Hu Y, Gu X, Improved efficacy of chemotherapy for glioblastoma by radiation-induced opening of blood-brain barrier: Clinical results. Int. J. Radiat. Oncol. Biol. Phys 51, 959–962 (2001). [DOI] [PubMed] [Google Scholar]
- 50.Vázquez R, Riveiro ME, Astorgues-Xerri L, Odore E, Rezai K, Erba E, Panini N, Rinaldi A, Kwee I, Beltrame L, Bekradda M, Cvitkovic E, Bertoni F, Frapolli R, D’Incalci M, The bromodomain inhibitor OTX015 (MK-8628) exerts anti-tumor activity in triple-negative breast cancer models as single agent and in combination with everolimus. Oncotarget 8, 7598–7613 (2017). [DOI] [PMC free article] [PubMed] [Google Scholar]
- 51.Piunti A, Hashizume R, Morgan MA, Bartom ET, Horbinski CM, Marshall SA, Rendleman EJ, Ma Q, Takahashi Y.-h., Woodfin AR, Misharin AV, Abshiru NA, Lulla RR, Saratsis AM, Kelleher NL, James CD, Shilatifard A, Therapeutic targeting of polycomb and BET bromodomain proteins in diffuse intrinsic pontine gliomas. Nat. Med 23, 493–500 (2017). [DOI] [PMC free article] [PubMed] [Google Scholar]
- 52.Liu PY, Sokolowski N, Guo ST, Siddiqi F, Atmadibrata B, Telfer TJ, Sun Y, Zhang L, Yu D, McCarroll J, Liu B, Yang RH, Guo XY, Tee AE, Itoh K, Wang J, Kavallaris M, Haber M, Norris MD, Cheung BB, Byrne JA, Ziegler DS, Marshall GM, Dinger ME, Codd R, Zhang XD, Liu T, The BET bromodomain inhibitor exerts the most potent synergistic anticancer effects with quinone-containing compounds and anti-microtubule drugs. Oncotarget 7, 79217–79232 (2016). [DOI] [PMC free article] [PubMed] [Google Scholar]
- 53.Yan Q-W, Reed E, Zhong X-S, Thornton K, Guo Y, Yu JJ, MZF1 possesses a repressively regulatory function in ERCC1 expression. Biochem. Pharmacol 71,761–771 (2006). [DOI] [PubMed] [Google Scholar]
- 54.Morris JF, Rauscher III FJ, Davis B, Klemsz M, Xu D, Tenen D, Hromas R, The myeloid zinc finger gene, MZF-1, regulates the CD34 promoter in vitro. Blood 86, 3640–3647 (1995). [PubMed] [Google Scholar]
- 55.Perrotti D, Melotti P, Skorski T, Casella I, Peschle C, Calabretta B, Overexpression of the zinc finger protein MZF1 inhibits hematopoietic development from embryonic stem cells: Correlation with negative regulation of CD34 and c-myb promoter activity. Mol. Cell. Biol 15, 6075–6087 (1995). [DOI] [PMC free article] [PubMed] [Google Scholar]
- 56.Lin S, Wang X, Pan Y, Tian R, Lin B, Jiang G, Chen K, He Y, Zhang L, Zhai W, Jin P, Yang L, Li G, Wu Y, Hu J, Gong W, Chang Z, Sheng J.-q., Lu Y, Wang JM, Huang J, Transcription factor myeloid zinc-finger 1 suppresses human gastric carcinogenesis by interacting with metallothionein 2A. Clin. Cancer Res. 25, 1050–1062 (2019). [DOI] [PubMed] [Google Scholar]
- 57.Chen Y, Zhang Z, Yang K, Du J, Xu Y, Liu S, Myeloid zinc-finger 1 (MZF-1) suppresses prostate tumor growth through enforcing ferroportin-conducted iron egress. Oncogene 34, 3839–3847 (2015). [DOI] [PubMed] [Google Scholar]
- 58.Gaboli M, Kotsi PA, Gurrieri C, Cattoretti G, Ronchetti S, Cordon-Cardo C, Broxmeyer HE, Hromas R, Pandolfi PP, Mzf1 controls cell proliferation and tumorigenesis. Genes Dev. 15, 1625–1630 (2001). [DOI] [PMC free article] [PubMed] [Google Scholar]
- 59.Hsieh Y-H, Wu T-T, Tsai J-H, Huang C-Y, Hsieh Y-S, Liu J-Y, PKCα expression regulated by Elk-1 and MZF-1 in human HCC cells. Biochem. Biophys. Res. Commun 339, 217–225 (2006). [DOI] [PubMed] [Google Scholar]
- 60.Mudduluru G, Vajkoczy P, Allgayer H, Myeloid zinc finger 1 induces migration, invasion, and in vivo metastasis through Axl gene expression in solid cancer. Mol. Cancer Res. 8, 159–169 (2010). [DOI] [PubMed] [Google Scholar]
- 61.Brix DM, Tvingsholm SA, Hansen MB, Clemmensen KB, Ohman T, Siino V, Lambrughi M, Hansen K, Puustinen P, Gromova I, James P, Papaleo E, Varjosalo M, Moreira J, Jäättelä M, Kallunki T, Release of transcriptional repression via ErbB2-induced, SUMO-directed phosphorylation of myeloid zinc finger-1 serine 27 activates lysosome redistribution and invasion. Oncogene 38, 3170–3184 (2019). [DOI] [PMC free article] [PubMed] [Google Scholar]
- 62.Davis M, Xie SX, Caution: Hazards crossing! Using the Renyi test statistic in survival analysis (Pharma SUG, 2011), pp. 7–8. [Google Scholar]
- 63.Council NR, Guide for the Care and Use of Laboratory Animals (National Academies Press, 2010). [Google Scholar]
Associated Data
This section collects any data citations, data availability statements, or supplementary materials included in this article.
Supplementary Materials
Data Availability Statement
All data associated with this study are present in the paper or the Supplementary Materials.