
Figure 8.
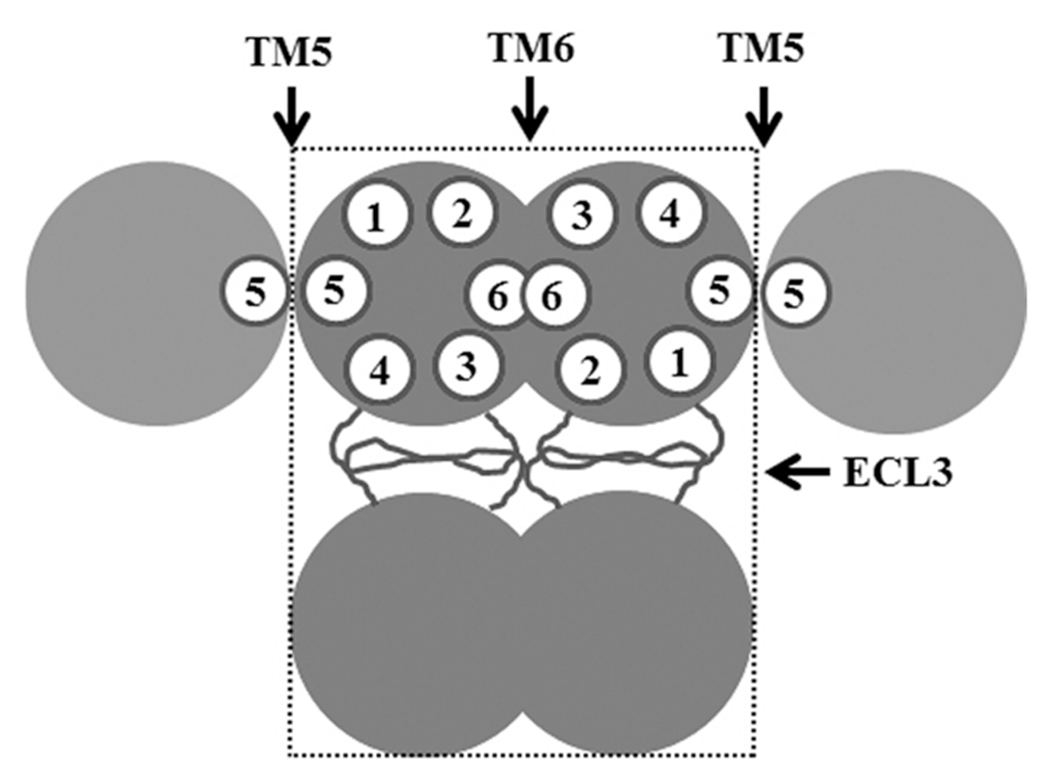
Schematic model of ABCG2 interactions. Three different possible interaction sites contributed by TM5, TM6, and ECL3 are shown. The minimal stable tetrameric unit is shown in a box with dashed lines. The empty circles with numbers represent TM segments.