

Abstract
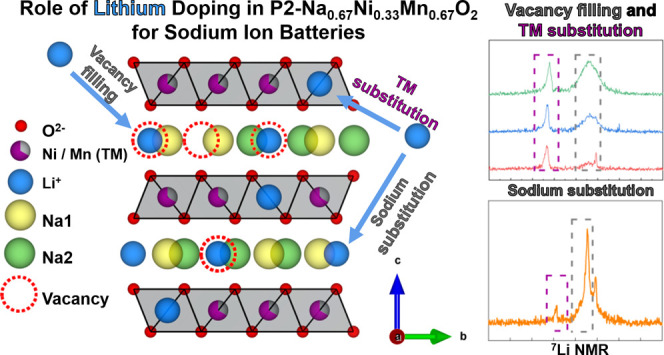
P2-structured Na0.67Ni0.33Mn0.67O2 (PNNMO) is a promising Na-ion battery cathode material, but its rapid capacity decay during cycling remains a hurdle. Li doping in layered transition-metal oxide (TMO) cathode materials is known to enhance their electrochemical properties. Nevertheless, the influence of Li at different locations in the structure has not been investigated. Here, the crystallographic role and electrochemical impact of lithium on different sites in PNNMO is investigated in LixNa0.67–yNi0.33Mn0.67O2+δ (0.00 ≤ x ≤ 0.2, y = 0, 0.1). Lithium occupancy on prismatic Na sites is promoted in Na-deficient (Na < 0.67) PNNMO, evidenced by ex situ and operando synchrotron X-ray diffraction, X-ray absorption spectroscopy, and 7Li solid-state nuclear magnetic resonance. Partial substitution of Na with Li leads to enhanced stability and slightly increased specific capacity compared to PNNMO. In contrast, when lithium is located primarily on octahedral TM sites, capacity is increased but at the cost of stability.
Introduction
The surging demand in the world’s lithium supply due to the growing markets for Li-ion batteries (LIBs) has led to a rapid rise in Li raw material cost, which intensifies the needs for the development of alternatives to LIBs. Na-ion batteries (SIBs) are considered one of the most promising candidates to substitute lithium in key applications due to sodium’s high abundance and low cost. Although Na-ion batteries have advantages in terms of resources and price (compared to lithium-ion batteries), their lower energy density and cycling stability are still major obstacles against their practical applications. To this end, much effort has been devoted in the design and development of electrode materials for high-performance SIBs. As cathode materials are key in determining the energy and stability of SIBs, extensive efforts have been invested in their development. Various compounds, including oxides,1−4 frameworks,5−7 hexacyanoferrates,8,9 and polyanionic compounds,10,11 have been investigated as potential cathode materials. Among the reported cathode candidates, layered sodium transition-metal oxides (TMOs) and their derivatives have received considerable attention due to their ease of synthesis and high theoretical capacities. Two common types of TMO cathodes have been widely studied: O3 type, in which Na ions reside in octahedral sites with oxygen coordination, and P2-type, in which Na ions are located in TMO6 at trigonal prismatic sites, according to the notation suggested by Delmas et al.12 Compared with the O3 phase that has a Na-ion migration pathway through face-shared interstitial tetrahedral sites with adjacent NaO6 octahedra, P2-type structure is more attractive because Na ions migrate between two face-shared trigonal prismatic sites in the Na layers with lower diffusion barrier for enhanced rate capability.2,13−15 However, compared with layered cathode materials used in Li-ion batteries, the P2-type layered Na-ion cathodes still suffer from a rapid capacity decay due to the larger ionic radius of Na+ ion (1.02 Å), comparing to that of Li+ ion (0.76 Å), with a higher kinetic barrier for Na+-ion transport in the crystal structure and detrimental phase transitions during cycling.16 More efforts need to be devoted to understanding the fundamental barriers in layered oxide-based cathode materials. Methods that combat the adverse effects of the large Na+ ion are needed to enhance performance metrics such as energy density and cycle life to increase the viability of the sodium-ion technologies.
Commonly used approaches in P2-type cathode materials for improving their electrochemical properties include varying the composition and substitution with electrochemically active elements (Li, Fe, Ti, Co, etc.)17−19 and/or electrochemically inactive elements (Al, Cu, Mg, Ca, etc.).20−23 Among the reported substituting elements, Li has been found to have a positive impact on the structural stability and electrochemistry of the layered cathode materials.24−26 When used in a layered cathode for Na-ion batteries, the added Li-ions can stabilize the structure and improve Na+ diffusion through the typical prismatic sites.25,26 More importantly, substitution of lithium can also suppress the Jahn–Teller effect and can delay detrimental phase transitions at high voltages, leading to improved electrochemical properties.25,27−29 Considering that the ionic radius of Li-ions is similar to the transition-metal cations, there has been a prevailing hypothesis that the Li-ion dopant in layered sodium TMOs tends to occupy TM sites in TMO6 octahedra (TM layer). A previous report26 showed that Li in the TM layer in the P2 structure could suppress P2–O2 phase transition and stabilize the structure at high voltages. This was achieved through highly reversible phase transition pathways and small volume changes. Li-ions were observed to partially and reversibly hop between the TM layer and Na-layer.26 Nevertheless, the possibility of lithium substitution into Na sites in P2-type cathodes is barely discussed in the open literature.
Here, the potential crystallographic role and electrochemical impact of lithium at different sites in P2 Na0.67Ni0.33Mn0.67O2 (PNNMO) are investigated. Simultaneous modification of the Na/TM ratio and Li content allows for the location of Li to be manipulated, as observed by 7Li solid-state nuclear magnetic resonance (NMR), high-energy synchrotron X-ray diffraction (HEXRD), and extended X-ray absorption fine structure (EXAFS). In samples with sodium-deficient compositions (Na = 0.57), the substitution of Li primarily into prismatic sodium sites can be observed (LSN samples). In fully sodiated (Na = 0.67) samples, Li is observed to fill vacancies in the Na-layer (LFN samples) and occupy the octahedral sites in the TM layer. In LSN, the transition-metal layers (octahedral sites) are almost completely filled with Ni and Mn, so only a small quantity of Li can be mixed into the TM layer, but the Na deficiency promotes Li occupation in the Na-layer. In LFN, fewer vacancies exist in the Na-layer, so greater occupancy of Li in the TM layer occurs compared to LSN. The different Li configurations in the P2 structure are shown to have significant, distinct impacts on the structural and electrochemical properties.
Experimental Section
Materials Synthesis
Pure P2 Na0.67Ni0.33Mn0.67O2 and Li-modified LixNa0.67Ni0.33Mn0.67O2 (x = 0.05, 0.1, 0.2) and Li-substituted Li0.1Na0.57Ni0.33Mn0.67O2 materials were prepared by a solid-state reaction using the Ni0.33Mn0.67(OH)2 precursor with Na2CO3 and Li2CO3 salts. The Ni0.33Mn0.67(OH)2 precursor was prepared by a co-precipitation method adopted from the work by Dahn et al.30 Subsequently, the Ni0.33Mn0.67(OH)2 powder and Na2CO3 were thoroughly mixed with a 2:1.1 molar ratio for pure P2 Na0.67Ni0.33Mn0.67O2, while the same mixture of Ni0.33Mn0.67(OH)2 powder and Na2CO3 was combined with a designed mole ratio of Li2CO3 for LixNa0.67Ni0.33Mn0.67O2 and Li0.1Na0.57Ni0.33Mn0.67O2 samples. All samples were mixed in an acoustic mixer. The mixed powders for each sample were then calcined at 850 °C for 20 h in air. The samples were allowed to cool down to 500 °C. At 500 °C, the samples were removed immediately from the furnace and transferred to the glovebox to avoid exposure to the moisture in air.
Characterizations
Structural Characterizations
Operando and ex situ high-energy synchrotron X-ray diffraction measurements were carried out at sector 11-ID-C of Advanced Photon Source (APS) in the Argonne National Laboratory. The wavelength of the X-ray source used was 0.1173 Å. Operando HEXRD was conducted with a hole-bore coin cell sealed with Kapton tape; the 2D diffraction patterns were converted to 1D diffraction patterns by Fit2D.31,32 The structural information and lattice parameters were determined using Rietveld refinement by FullProf software.33 Solid-state 7Li magic-angle-spinning (MAS) NMR experiments were performed on a Bruker Avance III spectrometer in a 7.05 T magnetic field with a 7Li Larmor frequency of 116.60 MHz. Electrodes were packed into 1.3 mm rotors and spun at a MAS rate of 50 kHz. The MATPASS sequence was employed, with a recycle delay of 0.2 s and the 90° pulse length was 1.6 μs. LiCl(s) with a 7Li chemical shift at 0 ppm was used as a reference. The synchrotron X-ray absorption spectroscopy (XAS) at Ni and Mn K-edge was conducted at the 20-BM beamline (APS) in the Argonne National Laboratory. The X-ray photon energy was monochromatized by a Si(111) double-crystal monochromator. All spectra were collected at room temperature in transmission mode.
Electrochemical Characterizations
The cathode laminate was prepared by screen printing (MTI) a slurry of 80 wt % active material, 10 wt % C45 (Timcal), and 10 wt % poly(vinylidene fluoride) onto an aluminum foil current collector by a doctor blade. After drying in a vacuum oven at 100 °C overnight, electrode disks (14 mm) were punched and weighed. The loading density of the active material was 2 mg cm–2. All cells were prepared in an argon-filled glovebox under conditions that the contents of moisture and oxygen were both below 0.5 ppm. The half-cells were assembled in CR2032 coin cells with the cathode, a glassy fiber separator (Sartorius), and a sodium metal (Sigma Aldrich) counter electrode in an electrolyte of 1.0 M sodium hexafluorophosphate (NaPF6, Alfa Aesar) in propylene carbonate (PC, BASF).
The electrochemical testing was conducted with a MACCOR cycler between 2.0 and 4.0 V vs Na/Na+ under a constant current rate of 9 mA g–1 (C/10, 1C rate: charge/discharge in 1 h) at room temperature (20 ± 2 °C). The interfacial electrochemical measurements were conducted using an in-house-developed high-precision electrochemical measurement system. After formation, the coin cells were conditioned in an environmental chamber at 30 °C; a high-precision source meter (Keithley 2401) was used to charge/discharge the cell to a specific potential before measuring the static leakage current. The working electrodes were held at a different constant potential from 3.1 to 4.0 V vs Na/Na+ for 40 h, presuming that the state of charge (SOC) or the sodium concentration in the working electrode will reach an equilibrium state after the constant–voltage charge/discharge. The measured leakage current is used as a quantitative index for the reaction rate of parasitic (side) reactions between the working electrode and the electrolyte.
Results and Discussion
A series of P2-type layered TMOs (LixNa0.67–yNi0.33Mn0.67O2+x, 0.00 ≤ x ≤ 0.2, y = 0, 0.1) with different stoichiometric ratios of lithium and sodium to the transition metals were synthesized by solid-state reaction. The sample with composition Na0.67Ni0.33Mn0.67O2 (hereafter referred to as PNNMO) has two prismatic sites in the sodium layer (Wyckoff 2b and 2d), which are only partially occupied by the 0.67 Na. Noting this fact, the filling of the remaining vacancies with Li could allow for the modification of the properties of PNNMO while retaining the P2 structure.
Samples designed with Li filled into the vacancies of the sodium layer (LFN) were prepared by adding Li content at x = 0.05, 0.1, and 0.2 while maintaining a constant ratio of Na to the transition metals (y = 0). These samples are called LFN5, LFN10, LFN20, respectively. In contrast, a sample with Na substituted with Li (LSN10) was prepared by decreasing the amount of Na from 0.67 to 0.57 (y = 0.1) and substituting the resulting Na vacancies with Li stoichiometrically (x = 0.1), yielding Li0.1Na0.57Ni0.33Mn0.67O2.
The high-energy synchrotron X-ray diffraction patterns as well as the Rietveld refinements for as-prepared PNNMO and Li-filled PNNMO, LFN05, LFN10, and LFN20 (x = 0.05, 0.1, 0.2), are shown in Figure 1. The refined lattice parameters are summarized in Table 1. For the PNNMO sample, all of the diffraction peaks of the XRD pattern can be well indexed to a single hexagonal P2-type phase with the space group P63/mmc. After introducing an additional 0.05 Li (LFN05), a new phase appeared, which we assigned to the cubic spinel phase with the space group Fd3̅m. The spinel phase was not included in the refinement. After increasing the Li content to 0.1 and 0.2, the spinel (111) peak (among other spinel peaks) intensity increased. This suggests that the ratio of the secondary phase (spinel) in the composite increases with Li addition. The lattice of the secondary phase did not vary with increasing Li, as the (111) peak position remained unchanged (Figure S1, Supporting Information). The added Li influenced the P2-layered structure, as suggested by the variations in the lattice parameters. The lattice parameter c, which represents the interlayer spacing, was found to decrease from 11.1580 to 11.0476 Å with increasing Li content from 0 to 0.2. On the other hand, the lattice parameter a, which represents the ab plane, did not have a distinct change from 2.8895 to 2.8903 Å. This indicates that the added Li affects mostly the interlayer spacing rather than the ab plane.
Figure 1.

Rietveld refinements of synchrotron X-ray diffraction patterns of (a) PNNMO, (b) LFN5, (c) LFN10, and (d) LFN20 pristine samples. The inset in (a) represents the P2-layered structure.
Table 1. Refined Crystallographic Parameters Obtained by Rietveld Refinements.
| lattice
parameters [Å] |
||||
|---|---|---|---|---|
| sample | a | c | Bragg R factor (RB, %) | χ2 (%) |
| PNNMO | 2.8895 | 11.1580 | 4.32 | 10.9 |
| LFN5 | 2.8900 | 11.1001 | 6.33 | 8.25 |
| LFN10 | 2.8900 | 11.0922 | 6.41 | 17.2 |
| LFN20 | 2.8903 | 11.0476 | 11.14 | 23.9 |
To elucidate the Li location in LFNs, solid-state 7Li NMR was conducted. 7Li NMR has been used previously to successfully differentiate various local environments of Li in both crystalline and amorphous phases.34,35Figure 2a shows the Li pj-MATPASS spectra of the LFN samples. Three resonances were observed at chemical shifts ∼550, ∼750, and ∼1650 ppm. The resonances at ∼1650 ppm can be assigned to Li sites in a honeycomb-like arrangement within the transition-metal layers.34,35 The resonance at ∼750 ppm was previously attributed to Li-ions in the Na-layer.26,36 The resonance at ∼550 ppm stems from the minor spinel component, which agrees well with the XRD results, based on the previous 7Li NMR study.26 The relative amount of Li at different environments was quantified through the 7Li solid-state NMR (Figure S2, Supporting Information). For the peak around 1650 ppm, there are at least two resonances visible for the LFN20 sample: one is sharper and the other one is broader. This is associated with a more complex coordination of Li in the TM layer. Variations such as possible ion exchange between Li and TM, changes of the Li–TM bond angle and the second coordination shell as well as neighboring coordination of Mn and Ni would give rise to new Li environments. Similar behavior was observed in the LFN10 and LFN5 samples, but it was challenging to resolve the peak given the smaller amount of Li. The peak at ∼750 ppm is very broad and overlaps strongly with the 550 ppm peak of the spinel. The spinel component (∼550 ppm) also exhibits significant broadening with the increasing Li content, likely due to increasing variations of the Li coordinating environment similar to those described for the Li in the TM layer. Nevertheless, the relative content of Li in spinel (∼550 ppm) and in the Na-layer (∼750 ppm) increases with the increasing Li concentration. Meanwhile, the Li in the TM layer (∼1650 ppm) decreases with the increasing Li concentration (Figure S2, Supporting Information). Importantly, the NMR results suggest that the addition of Li may promote more Li to be localized in the Na layers, occupying Na vacancies, which agrees well with the apparent decrease in interlayer spacing (c lattice parameter) from the XRD refinement results.
Figure 2.

(a) 7Li solid-state NMR spectra of the LFN5, LFN10, and LFN20 samples; (b) TM–TM scattering path (purple arrows) and the TM–Na1 scattering path (green arrows); (c, d) Fourier-transformed EXAFS spectra (not phase shift corrected) at Ni and Mn K-edge of PNNMO, LFN5, LFN10, and LFN20 samples; (e) initial voltage profiles of PNNMO, LFN5, LFN10, and LFN20 samples; and (f) cycling stability of PNNMO, LFN5, LFN10, and LFN20 samples.
X-ray absorption spectroscopy (XAS) measurements were carried out for each sample to elucidate the local structural changes as well as oxidation states of the transition metals. The Ni and Mn K-edge X-ray absorption near edge structure (XANES) spectra are shown in Figure S3 (Supporting Information). For Ni and Mn, the main edge of all samples is close to the NiO and MnO2 reference compounds, respectively. The oxidation states of the samples can be deduced from the comparison of the edge position of the sample with standard materials in XANES. The edge positions of all of the samples are close to the NiO reference compound, as shown in Figure S3a (Supporting Information). For Mn K-edge XANES (Figure S3b, Supporting Information), it is very clear that all of the samples’ main edges are close to the MnO2 reference compound. Taken all accounts together, XANES results indicate that the oxidation states of Ni and Mn ions in all LFN samples are predominately +2 and +4, respectively. Furthermore, both Ni and Mn valence do not appear to change to any appreciable extent with increasing Li content. This suggests that the amount of Li that is introduced into the transition-metal layers is likely too small to affect their valence states. To investigate the local structure of the Ni and Mn, the extended X-ray absorption fine structure (EXAFS) was also conducted. The Fourier-transformed EXAFS spectra for Ni and Mn are shown in Figure 2c,d, respectively. Two peaks at ∼1.6 and ∼2.5 Å, which correspond to the backscattering from the nearest oxygen anions and TM metal ions, respectively, can be seen at both Ni and Mn K-edge. It is worth noting that no significant changes to the peak position were observed in the EXAFS, indicating that the addition of Li did not significantly alter the bonding environment of both TMs. According to our NMR characterization, the added Li could either migrate into the TM layer (into the TM–TM path) and/or the Na-layer (TM–Na path). There are two different Na crystallographic sites in the P2 structure: Wyckoff 2b and Wyckoff 2d, designated as Na1 and Na2, respectively.12 Since Li is a very weak scatter of X-rays, its addition into the TM layer should reduce the scattering amplitude of the TM–TM path.37 These scattering paths are illustrated in Figure 2b. It is observed from Mn K-edge EXAFS (Figure 2d) that when Li content is increased from 0 (PNNMO) to 0.20 (LFN20), the ratio between the TM–TM and TM–O peak height decreases. As the coordination number (CN) is highly correlated to the area under the FT-EXAFS peaks, it suggests that the coordination near TM within the samples decreases with the increase of Li content.
To determine whether the reduction in the TM–TM/TM–O integrated peak intensity ratio is due to the spinel phase or Li in the TM layer, EXAFS was fitted to obtain a more quantitative view. Both the Ni K-edge and Mn K-edge EXAFS data were fit to our P2 model (results in Table 2). It is important to note that based on the same P2 structure we used for the XRD refinement, there should also be a backscattering path from the absorber atom (Ni or Mn, denoted as TM) to the Na1 atom. Since the backscattering path lengths of TM–TM and TM–Na1 are very similar, they are too convoluted to be fitted simultaneously. Furthermore, the TM–Na1 path is rather weak since the expected coordination number (CN) is only 2 (low scattering intensity). While it might be attractive to fit for the TM–Na1 path, we found that it was extremely difficult to obtain useful information from fitting TM–Na1, as shown in Table 2 (with CN of TM–TM held at 6). Accordingly, one restriction that we imposed was to fit the two different paths separately while holding the other constant. For the Debye–Waller factor (σ2), we first obtained a value from fitting the EXAFS of the pure P2 material. This fitted Debye–Waller factor was assumed to be the same across all samples for each shell fit, as illustrated in Table 2.
Table 2. Local Structural Parameters around TM and Na1 in Na-Cell Obtained from EXAFS Fitting, Holding CN of the TM–Na1 Constant at 2 for TM–TM, and CN of the TM–TM Constant at 6 for TM–Na1a.
| path | sample | CN | σ2 [Å2] | R factor |
|---|---|---|---|---|
| Ni–TM | PNNMO | 6 | 0.0048 | 0.004 |
| LFN5 | 5.88 ± 0.30 | 0.003 | ||
| LFN10 | 5.62 ± 0.33 | 0.003 | ||
| LFN20 | 5.72 ± 0.26 | 0.002 | ||
| Mn–TM | PNNMO | 6 | 0.0054 | 0.005 |
| LFN5 | 5.64 ± 0.23 | 0.005 | ||
| LFN10 | 5.60 ± 0.19 | 0.003 | ||
| LFN20 | 5.26 ± 0.23 | 0.005 | ||
| Ni–Na1 | PNNMO | 2 | 0.0043 | 0.004 |
| LFN5 | 1.86 ± 0.20 | 0.003 | ||
| LFN10 | 1.88 ± 0.24 | 0.003 | ||
| LFN20 | 1.90 ± 0.19 | 0.002 | ||
| Mn–Na1 | PNNMO | 2 | 0.0043 | 0.004 |
| LFN5 | 1.99 ± 0.39 | 0.003 | ||
| LFN10 | 1.82 ± 0.32 | 0.003 | ||
| LFN20 | 1.71 ± 0.37 | 0.002 |
The Debye–Waller is held constant at its fitted PNNMO value for each shell.
The fitting results indicate that the CN of the TM–TM layer decreases from 5.88 ± 0.3 (LFN5) to 5.62 ± 0.33 (LFN10) for the Ni K-edge and further for the Mn K-edge 5.64 ± 0.23 to 5.26 ± 0.23. Both are lower than the expected 6 for CN of TM–TM. This suggests that the addition of Li content into the P2 structure decreases the observed coordination number by substituting some of the TM ions with some preference of Li near Mn4+ in the TM layer, aligning well with our NMR data, indicating the existence of Li in the TM layer.
The Li localized at the Na layers could improve the capacity as shown in the dQ/dV plots (Figure S4, Supporting Information) where a new redox peak pair appeared in the voltage window of 3.8–4.0 V vs Na/Na+. In fact, the redox peaks became more defined and intense with increasing Li content, which was also accompanied with the increase in capacity. Thus, this set of redox peaks is assigned to the Li activity in the P2 structure. Shown in Figure 2e, the LFN20 sample delivered the highest capacity among all samples with a 104.9 mAh g–1 initial capacity because of the highest Li concentration, while the PNNMO sample only delivered 82.3 mAh g–1 at the first cycle, which shows a 27% increase in specific capacity compared to the PNNMO sample.
The LFN samples exhibited stable charge and discharge capacities (Figure 2f) with LFN05, LFN10, and LFN20 maintaining 97.6, 94.3, and 89.5% capacity retention after 95 cycles compared to 94.0% of the PNNMO (Figure S5, Supporting Information). Similar trends are observed for the energy density and energy density retention as for capacity. The voltage profiles over many cycles are shown in Figure S6 (Supporting Information). All samples show similar discharge voltage fade behavior. This indicates that despite a slightly lower average voltage than PNNMO, the enhanced energy density of Li-doped samples is due to their superior capacity, as shown in Figures S5 and S7 (Supporting Information). As the capacity fades, so does the energy density. The Coulombic efficiency for all samples for each cycle is presented in Figure S8 (Supporting Information). The small decrease in Coulombic efficiency for the Li-doped samples could be explained by their larger capacities, giving rise to an overall longer time for each galvanostatic cycle (Table S1, Supporting Information), allowing for more parasitic side reactions to occur. It is believed that Li addition can benefit the P2 structure (improving capacity for all LFN samples and stability for LFN5 and 10) by being present in both the TM and Na layers. It has been proven that Li doping in NaxTMO2 materials could stabilize the structure and benefit Na+ diffusion by staying in TM layers.25,26,38,39 Our work suggests that the structural stability of NaxTMO2 materials can be further enhanced by incorporating Li in both TM and Na layers.
There is a clear correlation between the capacity retention and Li concentration in LFN samples. The capacity retention of the samples decreases (Figure S5, Supporting Information) with increasing Li concentration, which corroborates with the dQ/dV plots shown in Figure S4 (Supporting Information) where the reversibility of the peak pair in 3.8–4.0 V is revealed to deteriorate with increasing Li content. It suggests that the material cannot maintain a high capacity from Li-filling and high cycling stability simultaneously. There appears to be an optimal Li content of 0.10 (LFN10) where the cycle stability is very similar to PNNMO at a retention rate of 94.3%, but with enhanced specific capacity. From these experiments, it appears that small addition of Li (below 0.2) could enhance the practical capacity of the P2 Na0.67Ni0.33Mn0.67O2 structure, but a Li level at 0.2 causes excessive local disorder and affects the cycling stability. We believe that this is why the LFN20 sample showed worse cycling stability when compared with other samples.
Although the LFN10 sample exhibited higher specific capacity and cycling stability over PNNMO, its cycling stability is still inferior to its Li-ion battery counterparts. Moreover, from our systematic study, it is unclear whether further improvements can be made on PNNMO solely based on an LFN strategy. In contrast to LFN, decreasing the Na-ion content (Na-ion deficient P2 structure) and stoichiometrically substituting it with Li (LSN) may promote the occupancy of Li in the Na-layer and reduce Li in the TM layer. Substitution of Na with Li is achieved by decreasing the Na content (stoichiometrically from 0.67 to 0.57) and simultaneously introducing Li stoichiometrically at 0.1, yielding Li0.1Na0.57Ni0.33Mn0.67O2 (LSN10).
In LSN10, a P2 main phase with a minor secondary phase was formed (the Rietveld refinement for the sample LSN10 is shown in Figure 3a). The secondary phase was determined to be a cubic spinel phase (space group Fd3̅m). The main phase was well-fitted to a P2 structure with space group P63/mmc. From the XRD refinement result, the c lattice parameter of the LSN10 sample was found to increase to 11.1800 Å (compared to 11.1576 Å of PNNMO). In contrast, the c lattice parameter of the LFN10 (without change of Na-ion stoichiometry) sample decreased to 11.0922 Å. We believe that since the size of Li is smaller than Na, its corresponding contribution to the electrostatic interaction with oxygen is smaller than that of Na. Therefore, the increase in the c lattice parameter of LSN10 could be attributed to a decrease in electrostatic attraction due to the substitution of Na with Li in the Na layers. The opposite is observed in the LFN10 (c value decreased by −0.0654 Å) as Li-ions are introduced into the Na vacancy sites. With an overall increase in alkali ions, the electrostatic attraction is increased along with a subsequent decrease in the interlayer spacing.
Figure 3.

Comparison of PNNMO, LSN10, and LSN10 samples: (a) Synchrotron X-ray diffraction pattern and Rietveld refinement of LSN10 (Li0.1Na0.57 Ni0.33Mn0.67O2); (b) 7Li solid-state NMR spectra of LSN10; (c, d) normalized XANES spectra at Ni and Mn K-edge of the LSN10 sample; and (e, f) Fourier-transformed EXAFS spectra (not phase shift corrected) at Ni and Mn K-edge.
7Li solid-state NMR was used to elucidate the local environments of Li in the LSN10 sample (Figure 3b). Quantification from NMR revealed that most Li was found in the Na-layer (750 ppm), only ∼5.7 at. % of the Li was located in the TM layers (1450 ppm). It should be noted that a small portion of Li formed the secondary spinel phase, which exhibited a peak around 550 ppm. From XANES, the oxidation states of Ni and Mn do not change with Li substitution and remain predominately in the +2 and +4 states, respectively (Figure 3c,d). For comparison, PNNMO and LFN10 samples were plotted along with LSN10 in Figure 3. Furthermore, the EXAFS fitting results of LSN10 yielded a coordination of TM, 6.44 ± 0.24 (Ni K-edge) and 6.01 ± 0.25 (Mn K-edge). The CN larger than 6 may be a result of the curve-fitting procedure. Fitting parameters such as the Debye–Waller factor may be strongly correlated with CN. As a result of the assumption of a constant value of the Debye–Waller factor for all samples, the CN could be artificially high to compensate for the different degree of structural stability in the sample compared to the value used from PNNMO. As aforementioned, if Li-ions were indeed in the TM layer, the CN should decrease. Therefore, a lack of a decrease in CN suggests that no significant amount of Li is in the TM layer for the LSN sample.
Figure 4a shows the voltage profiles of PNNMO, LFN10, and LSN10 at the initial cycle. The first charge capacity was 86.8, 79.5, and 96.74 mAh g–1, respectively, for PNNMO, LSN10, and LFN10 samples when the cells were charged to a cutoff potential of 4.0 V. The following discharge process delivered 84.3, 84.6, and 96.3 mAh g–1 for PNNMO, LSN10, and LFN10 samples, respectively, corresponding to 0.333, 0.334, and 0.379 Na+. The LSN10 sample achieved slightly higher capacity compared to PNNMO, with a higher Coulombic efficiency of 106%. The greater than 100% Coulombic efficiency may occur in the half-cell configuration with an excess Na metal counter electrode, which can supply additional Na to fill vacancies present in the as-prepared electrode.40,41
Figure 4.

Comparison of the electrochemical properties of PNNMO, LFN10, and LSN10 samples: (a) Voltage profile at the initial cycle; (b) dQ/dV plots corresponding to voltage profiles in (a); (c) cycling stability; and (d) static leakage current at different voltages.
From the voltage profile of LSN10 (Figure 4a), there was a new plateau at around 2.25 V during discharge, which contributed capacity and corresponded to the small peak that appeared in Figure 4b. Although Li activity led to a new redox peak, the initial capacity remained mostly the same as the pure P2 material and as expected, lower than the LFN10 (Li-filled) sample because there are stoichiometrically less alkali ions in the sample. The enhanced stability of Li-substituted P2 (LSN10) over the regular P2 and the LFN samples becomes apparent over many cycles, as shown in Figure 4c. The Li-substituted LSN10 sample showed a 99.3% capacity retention after 95 cycles, while the P2 PNNMO and Li-filled LFN10 only showed 94.0 and 94.3% retention, respectively (Figure S5). The dQ/dV plots over the course of 5 cycles for the Li-substituted LSN10 sample in Figure S9 (Supporting Information) show that the capacity associated with the new redox reaction was also highly reversible. The dQ/dV plots over many cycles for PNNMO, LSN10, and LFN10 are shown in Figure S10 (Supporting Information), indicating the long-term stability of the redox processes associated with Li doping.
We also directly measured the parasitic reactions of the cathode materials via the static leakage current test. As shown in Figure 4d, the recorded static current response was measured as a function of the potential, using a home-built high-precision leakage current measurement system.42 In general, static leakage current increased with higher potentials, indicating the electrochemical oxidation of electrolyte components at the surface of the cathode electrode. In our case, there is a bump at ∼3.4–3.5 V, most likely related to the oxidation of Ni2+ to Ni3+ (corresponding to the peak at 3.3 V in the dQ/dV curve). Under 3.4 V, no significant difference is found among the 3 samples, but above 3.4 V, it is apparent that smaller static leakage currents were found for both Li-modified samples (LFN10 and LSN10) compared to PNNMO. The Li-substituted LSN10 sample showed the smallest current compared to the other two samples. The smaller leakage current indicates a slower electron-transfer reaction and less solvent oxidation in a unit time. This suggests that Li substituting Na in TMOs could help modify the structure to decrease the parasitic reactions, in agreement with the enhanced electrochemical cycling stability of LSN samples.
There appears to be a significant effect from the way in which Li is incorporated into the P2 structure on its electrochemical properties. However, the reason for this observed enhancement is still unclear. As the structural reversibility is well known to be correlated to the capacity retention over many cycles, operando synchrotron XRD was performed to investigate the underlying contribution of the Li incorporation on structural evolution upon cycling. Figure 5a exhibits the operando XRD of the PNNMO sample during the initial cycle. It is observed that the PNNMO sample maintained a P2 phase within a voltage window of 2.0–4.0 V, as all peaks maintained a smooth variation in the peak position without new peaks appearing during the cycling process, consistent with the previous reports.43 During the charging process, the (002) and (106) peaks of PNNMO shifted to a lower angle, while the (100), (110), (102), and (112) peaks shifted to a higher angle. This suggests that the c axis expanded and the a axis contracted with the gradual desodiation of the sample. An opposite peak shift was observed during the discharge process, which indicates that the process was quite reversible. Figure 5b shows the phase evolution of the Li-substituted LSN10 sample, where the LSN10 sample showed the same phase evolution behavior as the PNNMO sample during cycling—expansion of c axis and contraction of a axis during charge and vice versa. The variation of the lattice parameters in PNNMO is due to Na/vacancy ordering processes, as shown from the previous investigations.43 Given the similar trend in variation of lattice parameters, it is likely that the same Na/vacancy ordering explanation applies to LSN10 as PNNMO. Although the variation of lattice parameters in LSN10 is similar to the PNNMO sample under 4.0 V, the lattice parameters a and c and corresponding unit cell volume showed some differences. The dependence of the unit cell dimensions on the state of charge (SOC) is shown in Figure 5c. The lattice parameters c and a for PNNMO and LSN10 were refined with the Rietveld refinement using the P2 structure (space group P63/mmc). We could see that c increased gradually upon desodiation, which was likely due to increased electrostatic repulsion between oxygen ions during sodium extraction. LSN10 experienced less expansion at 100% SOC compared to PNNMO, with only 1.72% expansion for LSN10 vs 2.03% for PNNMO. In both samples, a was found to shrink during desodiation, likely due to the smaller size of the oxidized transition-metal ions. LSN10 contracted less in a than PNNMO (1.16 vs 1.44%). Due to the smaller degree of change in c and a for LSN10 vs PNNMO, it also demonstrated a reduced unit cell volume change (−0.64 vs −0.90%). The reduced degree of structural distortion experienced by the LSN10 sample could explain its superior cycling stability.
Figure 5.

Operando synchrotron XRD as a function of voltage as shown to the right of the figure of the cathode material: (a) PNNMO and (b) LSN10. (c) Change (as the percentage relative to the first measurement) in unit cell volume and lattice parameters c and a as a function of the state of charge.
As demonstrated by its influence on capacity, cycling stability, structural distortion during cycling, and leakage current trends, it is apparent that the location of Li is important to the cycling stability of the material. More work is required to further elucidate the exact role of Li in each position and the mechanism of Li stabilization on the Na-layer.
Conclusions
It was determined that the manner in which Li+ is incorporated into P2-type Na0.67Ni0.33Mn0.67O2 is a parameter of significant interest. By tuning the relative stoichiometries of Li and Na with the TMs, improvements in the structure stability and electrochemical properties of the modified P2-Na0.67Ni0.33Mn0.67O2 material were observed. Specifically, two different Li modification strategies were investigated: (1) filling Li into both transition-metal sites and vacancies in the Na-layer of P2 structure (LFN), while keeping the Na/TM ratio constant and (2) decreasing the Na content and substituting that Na with Li (LSN) to insert Li primarily into the Na-layer. We first demonstrated that although the filling of Li into the TM and Na layers of P2 (LFN series) can be beneficial toward increasing capacity and stability, a high content of Li (Li ≥ 0.2) will destabilize the structure over many cycles. Conversely, we find that by substituting Na with Li while maintaining the same overall alkali metal stoichiometry (LSN series), the Li can be substituted mostly into the Na-layer, as suggested by our NMR, EXAFS, and XRD results. Li-substituted Na P2 showed significant enhancements in its cycling stability (84.6 mAh g–1 with >99% retention over 100 cycles) along with a minor increase in specific capacity compared to the lithium-free Na0.67Ni0.33Mn0.67O2. Furthermore, it is apparent that Li at different positions (in the TM layer and/or Na-layer) in the P2 structure has substantially different effects on the electrochemical properties. Further studies to track the dynamics of Li in P2 structures during cycling will be important to develop a fundamental understanding of its role in increasing capacity and stability.
Acknowledgments
This material is based upon work supported by the U.S. Department of Energy, Office of Science, Office of Basic Energy Sciences program under Award Number DE-SC0019121. M. Dustin acknowledges the support by the National Science Foundation via the REU Site: Materials for Society at Boise State University (DMR-1658076). NSF’s ChemMatCARS Sector 15 is supported by the Divisions of Chemistry (CHE) and Materials Research (DMR), National Science Foundation, under grant number NSF/CHE-1834750. This research used resources of the Advanced Photon Source; a U.S. Department of Energy (DOE) Office of Science User Facility operated for the DOE Office of Science by the Argonne National Laboratory under Contract No. DE-AC02-06CH11357. The work by E. Lee was supported by the Advanced Battery Materials Research (BMR) Program of the U.S. Department of Energy, Office of Energy Efficiency and Renewable Energy.
Supporting Information Available
The Supporting Information is available free of charge at https://pubs.acs.org/doi/10.1021/acs.chemmater.1c00569.
Peak position of the spinel phase as a function of lithium content in LFN samples, 7Li NMR fitting of LFN samples showing the percentage of Li in each environment, Ni and Mn K-edge XANES of PNNMO and LFN samples, differential capacity vs voltage for PNNMO and LFN samples, discharge capacity retention of all samples vs cycle number, coulombic efficiency of all samples vs cycle number, differential capacity over the first five cycles for LSN10 (PDF)
Author Contributions
Y.X. and H.X. conceived and designed all experiments. Y.X., E.G., H.Z., J.P., and M.D. synthesized the materials. Y.X. conducted all electrochemical measurements and operando synchrotron XRD experiments. L.F., Y.X., and Y.R. conducted the analysis of the XRD results. I.H. and C.S. conducted XAS measurements and analysis. X.L. conducted the measurements and analysis of 7Li NMR experiments. Z.C. designed the leakage current measurements. Y.X., H.X., E.G., Z.C., and E.L. analyzed the collected data. Y.X., E.G., H.X., Z.C., and M.L. wrote the manuscript.
The authors declare no competing financial interest.
Supplementary Material
References
- Wang H.; Liao X.-Z.; Yang Y.; Yan X.; He Y.-S.; Ma Z.-F. Large-Scale Synthesis of NaNi1/3Fe1/3Mn1/3O2 as High Performance Cathode Materials for Sodium Ion Batteries. J. Electrochem. Soc. 2016, 163, A565–A570. 10.1149/2.0011605jes. [DOI] [Google Scholar]
- Wang H.; Yang B.; Liao X.-Z.; Xu J.; Yang D.; He Y.-S.; Ma Z.-F. Electrochemical Properties of P2-Na2/3 [Ni1/3Mn2/3] O2 Cathode Material for Sodium Ion Batteries When Cycled in Different Voltage Ranges. Electrochim. Acta 2013, 113, 200–204. 10.1016/j.electacta.2013.09.098. [DOI] [Google Scholar]
- Saadoune I.; Maazaz A.; Menetrier M.; Delmas C. On the NaxNi0. 6Co0. 4o2system: Physical and Electrochemical Studies. J. Solid State Chem. 1996, 122, 111–117. 10.1006/jssc.1996.0090. [DOI] [Google Scholar]
- Liu G.; Wen L.; Li Y.; Kou Y. Synthesis and Electrochemical Properties of P2-Na 2/3 Ni 1/3 Mn 2/3 O 2. Ionics 2015, 21, 1011–1016. 10.1007/s11581-014-1249-2. [DOI] [Google Scholar]
- Fang Y.; Xiao L.; Ai X.; Cao Y.; Yang H. Hierarchical Carbon Framework Wrapped Na3V2 (PO4) 3 as a Superior High-rate and Extended Lifespan Cathode for Sodium-ion Batteries. Adv. Mater. 2015, 27, 5895–5900. 10.1002/adma.201502018. [DOI] [PubMed] [Google Scholar]
- Lee H.-W.; Wang R. Y.; Pasta M.; Lee S. W.; Liu N.; Cui Y. Manganese Hexacyanomanganate Open Framework as a High-Capacity Positive Electrode Material for Sodium-Ion Batteries. Nat. Commun. 2014, 5, 5280 10.1038/ncomms6280. [DOI] [PubMed] [Google Scholar]
- Lu Y.; Wang L.; Cheng J.; Goodenough J. B. Prussian Blue: A New Framework of Electrode Materials for Sodium Batteries. Chem. Commun. 2012, 48, 6544–6546. 10.1039/c2cc31777j. [DOI] [PubMed] [Google Scholar]
- Liu S.; Pan G.; Li G.; Gao X. Copper Hexacyanoferrate Nanoparticles as Cathode Material for Aqueous Al-Ion Batteries. J. Mater. Chem. A 2015, 3, 959–962. 10.1039/C4TA04644G. [DOI] [Google Scholar]
- You Y.; Yu X.; Yin Y.; Nam K.-W.; Guo Y.-G. Sodium Iron Hexacyanoferrate with High Na Content as a Na-Rich Cathode Material for Na-Ion Batteries. Nano Res. 2015, 8, 117–128. 10.1007/s12274-014-0588-7. [DOI] [Google Scholar]
- Bianchini M.; Xiao P.; Wang Y.; Ceder G. Additional Sodium Insertion into Polyanionic Cathodes for Higher-energy Na-ion Batteries. Adv. Energy Mater. 2017, 7, 1700514 10.1002/aenm.201700514. [DOI] [Google Scholar]
- Ni Q.; Bai Y.; Wu F.; Wu C. Polyanion-type Electrode Materials for Sodium-ion Batteries. Adv. Sci. 2017, 4, 1600275 10.1002/advs.201600275. [DOI] [PMC free article] [PubMed] [Google Scholar]
- Delmas C.; Fouassier C.; Hagenmuller P. Structural Classification and Properties of the Layered Oxides. Physica B+C 1980, 99, 81–85. 10.1016/0378-4363(80)90214-4. [DOI] [Google Scholar]
- Yabuuchi N.; Kubota K.; Dahbi M.; Komaba S. Research Development on Sodium-Ion Batteries. Chem. Rev. 2014, 114, 11636–11682. 10.1021/cr500192f. [DOI] [PubMed] [Google Scholar]
- Zhao J.; Xu J.; Lee D. H.; Dimov N.; Meng Y. S.; Okada S. Electrochemical and Thermal Properties of P2-Type Na2/3Fe1/3Mn2/3O2 for Na-Ion Batteries. J. Power Sources 2014, 264, 235–239. 10.1016/j.jpowsour.2014.04.048. [DOI] [Google Scholar]
- Zhou Y.-N.; Wang P.-F.; Zhang X.-D.; Huang L.-B.; Wang W.-P.; Yin Y.-X.; Xu S.; Guo Y.-G. Air-Stable and High-Voltage Layered P3-Type Cathode for Sodium-Ion Full Battery. ACS Appl. Mater. Interfaces 2019, 11, 24184–24191. 10.1021/acsami.9b07299. [DOI] [PubMed] [Google Scholar]
- Sun Y.; Guo S.; Zhou H. Adverse Effects of Interlayer-Gliding in Layered Transition-Metal Oxides on Electrochemical Sodium-Ion Storage. Energy Environ. Sci. 2019, 12, 825–840. 10.1039/C8EE01006D. [DOI] [Google Scholar]
- Li Z.-Y.; Zhang J.; Gao R.; Zhang H.; Hu Z.; Liu X. Unveiling the Role of Co in Improving the High-Rate Capability and Cycling Performance of Layered Na0. 7Mn0. 7Ni0. 3–x Co x O2 Cathode Materials for Sodium-Ion Batteries. ACS Appl. Mater. Interfaces 2016, 8, 15439–15448. 10.1021/acsami.6b04073. [DOI] [PubMed] [Google Scholar]
- Wang P.; Yao H.; Liu X.; Zhang J.; Gu L.; Yu X.; Yin Y.; Guo Y. Ti-Substituted NaNi0. 5Mn0. 5-xTixO2 Cathodes with Reversible O3– P3 Phase Transition for High-Performance Sodium-Ion Batteries. Adv. Mater. 2017, 29, 1700210 10.1002/adma.201700210. [DOI] [PubMed] [Google Scholar]
- Yuan D. D.; Wang Y. X.; Cao Y. L.; Ai X. P.; Yang H. X. Improved Electrochemical Performance of Fe-Substituted NaNi0.5Mn0.5O2 Cathode Materials for Sodium-Ion Batteries. ACS Appl. Mater. Interfaces 2015, 7, 8585–8591. 10.1021/acsami.5b00594. [DOI] [PubMed] [Google Scholar]
- Li Y.; Yang Z.; Xu S.; Mu L.; Gu L.; Hu Y.; Li H.; Chen L. Air-Stable Copper-Based P2-Na7/9Cu2/9Fe1/9Mn2/3O2 as a New Positive Electrode Material for Sodium-Ion Batteries. Adv. Sci. 2015, 2, 1500031 10.1002/advs.201500031. [DOI] [PMC free article] [PubMed] [Google Scholar]
- Singh G.; Tapia-Ruiz N.; Lopez del Amo J. M.; Maitra U.; Somerville J. W.; Armstrong A. R.; Martinez de Ilarduya J.; Rojo T.; Bruce P. G. High Voltage Mg-Doped Na0. 67Ni0. 3–x Mg x Mn0. 7O2 (X = 0.05, 0.1) Na-Ion Cathodes with Enhanced Stability and Rate Capability. Chem. Mater. 2016, 28, 5087–5094. 10.1021/acs.chemmater.6b01935. [DOI] [Google Scholar]
- Sun L.; Xie Y.; Liao X.; Wang H.; Tan G.; Chen Z.; Ren Y.; Gim J.; Tang W.; He Y.; et al. Insight into Ca-Substitution Effects on O3-Type NaNi1/3Fe1/3Mn1/3O2 Cathode Materials for Sodium-Ion Batteries Application. Small 2018, 14, 1704523 10.1002/smll.201704523. [DOI] [PubMed] [Google Scholar]
- Wang H.; Gao R.; Li Z.; Sun L.; Hu Z.; Liu X. Different Effects of Al Substitution for Mn or Fe on the Structure and Electrochemical Properties of Na0. 67Mn0. 5Fe0. 5O2 as a Sodium Ion Battery Cathode Material. Inorg. Chem. 2018, 57, 5249–5257. 10.1021/acs.inorgchem.8b00284. [DOI] [PubMed] [Google Scholar]
- Kim D.; Kang S.; Slater M.; Rood S.; Vaughey J. T.; Karan N.; Balasubramanian M.; Johnson C. S. Enabling Sodium Batteries Using Lithium-substituted Sodium Layered Transition Metal Oxide Cathodes. Adv. Energy Mater. 2011, 1, 333–336. 10.1002/aenm.201000061. [DOI] [Google Scholar]
- Xu J.; Lee D. H.; Clément R. J.; Yu X.; Leskes M.; Pell A. J.; Pintacuda G.; Yang X.-Q.; Grey C. P.; Meng Y. S. Identifying the Critical Role of Li Substitution in P2–Na x [Li y Ni z Mn1–y–z] O2 (0<x, y, Z<1) Intercalation Cathode Materials for High-Energy Na-Ion Batteries. Chem. Mater. 2014, 26, 1260–1269. 10.1021/cm403855t. [DOI] [Google Scholar]
- Yang L.; Li X.; Liu J.; Xiong S.; Ma X.; Liu P.; Bai J.; Xu W.; Tang Y.; Hu Y.-Y.; et al. Lithium-Doping Stabilized High-Performance P2–Na0. 66Li0. 18Fe0. 12Mn0. 7O2 Cathode for Sodium Ion Batteries. J. Am. Chem. Soc. 2019, 141, 6680–6689. 10.1021/jacs.9b01855. [DOI] [PubMed] [Google Scholar]
- Liu Y.; Wang C.; Zhao S.; Zhang L.; Zhang K.; Li F.; Chen J. Mitigation of Jahn–Teller Distortion and Na+/Vacancy Ordering in a Distorted Manganese Oxide Cathode Material by Li Substitution. Chem. Sci. 2020, 1062–1067. 10.1039/D0SC05427E. [DOI] [PMC free article] [PubMed] [Google Scholar]
- Tang K.; Wang Y.; Zhang X.; Jamil S.; Huang Y.; Cao S.; Xie X.; Bai Y.; Wang X.; Luo Z.; et al. High-Performance P2-Type Fe/Mn-Based Oxide Cathode Materials for Sodium-Ion Batteries. Electrochim. Acta 2019, 312, 45–53. 10.1016/j.electacta.2019.04.183. [DOI] [Google Scholar]
- Ding Z.; Liu Y.; Tang Q.; Jiang Q.; Lu J.; Xiao Z.; Yao P.; Monasterio M.; Wu J.; Liu X. Enhanced Electrochemical Performance of Iron-Manganese Based Cathode by Li Doping for Sodium-Ion Batteries. Electrochim. Acta 2018, 292, 871–878. 10.1016/j.electacta.2018.09.192. [DOI] [Google Scholar]
- Zhou F.; Zhao X.; van Bommel A.; Rowe A. W.; Dahn J. Coprecipitation Synthesis of Ni x Mn1– x (OH) 2 Mixed Hydroxides. Chem. Mater. 2010, 22, 1015–1021. 10.1021/cm9018309. [DOI] [Google Scholar]
- Hammersley A. FIT2D: An Introduction and Overview. Eur. Synchrotron Radiat. Facil. Intern. Rep. ESRF97HA02T 1997, 68, 58. [Google Scholar]
- Hammersley A.; Svensson S.; Hanfland M.; Fitch A.; Hausermann D. Two-Dimensional Detector Software: From Real Detector to Idealised Image or Two-Theta Scan. High Pressure Res. 1996, 14, 235–248. 10.1080/08957959608201408. [DOI] [Google Scholar]
- Rodríguez-Carvajal J. Recent Advances in Magnetic Structure Determination by Neutron Powder Diffraction. Phys. B 1993, 192, 55–69. 10.1016/0921-4526(93)90108-I. [DOI] [Google Scholar]
- Lee Y. J.; Wang F.; Grey C. P. 6Li and 7Li MAS NMR Studies of Lithium Manganate Cathode Materials. J. Am. Chem. Soc. 1998, 120, 12601–12613. 10.1021/ja9817794. [DOI] [Google Scholar]
- Grey C. P.; Dupré N. NMR Studies of Cathode Materials for Lithium-Ion Rechargeable Batteries. Chem. Rev. 2004, 104, 4493–4512. 10.1021/cr020734p. [DOI] [PubMed] [Google Scholar]
- Yang L.; del Amo J. M. L.; Shadike Z.; Bak S.; Bonilla F.; Galceran M.; Nayak P. K.; Buchheim J. R.; Yang X.; Rojo T.; et al. A Co-and Ni-Free P2/O3 Biphasic Lithium Stabilized Layered Oxide for Sodium-Ion Batteries and Its Cycling Behavior. Adv. Funct. Mater. 2020, 2003364 10.1002/adfm.202003364. [DOI] [Google Scholar]
- Karan N. K.; Slater M. D.; Dogan F.; Kim D.; Johnson C. S.; Balasubramanian M. Operando Structural Characterization of the Lithium-Substituted Layered Sodium-Ion Cathode Material P2-Na0. 85Li0. 17Ni0. 21Mn0. 64O2 by X-Ray Absorption Spectroscopy. J. Electrochem. Soc. 2014, 161, A1107. 10.1149/2.088406jes. [DOI] [Google Scholar]
- Lee E.; Lu J.; Ren Y.; Luo X.; Zhang X.; Wen J.; Miller D.; DeWahl A.; Hackney S.; Key B.; Kim D.; Slater M. D.; Johnson C. S. Layered P2/O3 Intergrowth Cathode: Toward High Power Na-Ion Batteries. Adv. Energy Mater. 2014, 4, 1400458 10.1002/aenm.201400458. [DOI] [Google Scholar]
- Clément R. J.; Xu J.; Middlemiss D.; Alvarado J.; Ma C.; Meng Y.; Grey C. Direct Evidence for High Na+ Mobility and High Voltage Structural Processes in P2-Na x [Li y Ni z Mn 1– Y– z] O 2 (x, y, Z≤ 1) Cathodes from Solid-State NMR and DFT Calculations. J. Mater. Chem. A 2017, 5, 4129–4143. 10.1039/C6TA09601H. [DOI] [Google Scholar]
- Yabuuchi N.; Kajiyama M.; Iwatate J.; Nishikawa H.; Hitomi S.; Okuyama R.; Usui R.; Yamada Y.; Komaba S. P2-Type Na x [Fe 1/2 Mn 1/2] O 2 Made from Earth-Abundant Elements for Rechargeable Na Batteries. Nat. Mater. 2012, 11, 512. 10.1038/nmat3309. [DOI] [PubMed] [Google Scholar]
- Martinez De Ilarduya J.; Otaegui L.; del Amo J. M. L.; Armand M.; Singh G. NaN3 Addition, a Strategy to Overcome the Problem of Sodium Deficiency in P2-Na0. 67 [Fe0. 5Mn0. 5] O2 Cathode for Sodium-Ion Battery. J. Power Sources 2017, 337, 197–203. 10.1016/j.jpowsour.2016.10.084. [DOI] [Google Scholar]
- Zeng X.; Xu G.-L.; Li Y.; Luo X.; Maglia F.; Bauer C.; Lux S. F.; Paschos O.; Kim S.-J.; Lamp P.; et al. Kinetic Study of Parasitic Reactions in Lithium-Ion Batteries: A Case Study on LiNi0. 6Mn0. 2Co0. 2O2. ACS Appl. Mater. Interfaces 2016, 8, 3446–3451. 10.1021/acsami.5b11800. [DOI] [PubMed] [Google Scholar]
- Lu Z.; Dahn J. In Situ X-Ray Diffraction Study of P 2 Na2/3 [Ni1/3Mn2/3] O 2. J. Electrochem. Soc. 2001, 148, A1225–A1229. 10.1149/1.1407247. [DOI] [Google Scholar]
Associated Data
This section collects any data citations, data availability statements, or supplementary materials included in this article.