

Abstract
HdeA is a small acid-stress chaperone protein found in the periplasm of several pathogenic gram-negative bacteria. In neutral pH environments HdeA is an inactive folded homodimer but when exposed to strong acidic environments it partially unfolds and, once activated, binds to other periplasmic proteins, protecting them from irreversible aggregation. Here we use a combination of hydrogen/deuterium exchange NMR experiments and constant pH molecular dynamics simulations to elucidate the role of HdeA’s N-terminus in its activation mechanism. Previous work indicates that the N-terminus is flexible and unprotected at high pH while exhibiting interactions with some HdeA client binding site residues. It, however, becomes partially solvent-protected at pH 2.6 – 2.8 and then loses protection again at pH 2.0. This protection is not due to the appearance of new secondary structure, but rather increased contacts between N-terminal residues and the C-terminus of the other protomer in the dimer, as well as concurrent loosening of its hold on the client binding site residues, priming HdeA for interactions with periplasmic client proteins. This work also uncovers unusual protonation profiles of some titratable residues and suggests a complex role in chaperone function.
Keywords: hydrogen/deuterium NMR, constant-pH molecular dynamics, acid-stress protein, chaperone protein, replica exchange molecular dynamics
Introduction
Gastrointestinal pathogenic gram-negative bacteria like Escherichia coli, Shigella flexneri, and Brucella abortus can survive in highly acidic conditions in mammalian stomachs. In these pathogens, protein denaturation and aggregation in acidic conditions is prevented by maintaining a pH of 4.5 in the cytoplasm [3, 4] and by activating pH-dependent chaperone proteins in the periplasm [5] that can bind the periplasmic proteins to prevent their aggregation after unfolding. Acid-induced periplasmic protein HdeA (Histone-like nucleoid structuring dependent expression A) has been identified as one of these chaperone proteins in Escherichia coli [6], Shigella flexneri [7, 8] and Brucella abortus [9].
HdeA is a small 89-residue homodimer that is inactive at pHs greater than 3.0. In this inactive state, HdeA is a well-folded homodimer (Figure 1), but once the bacteria encounter low pH environments (pH ~2 – 3, such as found in an animal stomach) HdeA becomes activated. In this activated state, HdeA partially unfolds, using its newly exposed hydrophobic regions to bind other periplasmic proteins, preventing their irreversible aggregation and (along with its closely related homolog HdeB) facilitating their refolding to functional forms when the environment returns to higher pHs (in the intestines) [10].
Figure 1.

NMR structure of HdeA homodimer (PDB ID: 5WYO [2]). Helices A – D are labeled on one protomer and the numbers of the terminal helix residues are labeled on the other protomer.
The first atomic resolution structures of homodimeric HdeA from E. coli appeared in 1998 (at pH 3.6, PDB ID: 1BG8 [11]) and 2000 (at pH 4, PDB ID: 1DJ8 [12]) using x-ray diffraction based methods. In the latter study, the homodimeric structure of HdeA was obtained at 2 Å resolution and the functional studies showed a dimer to monomer transition at acidic pH that suppressed aggregation of acid-denatured proteins. Neither of these studies could resolve the structure of ~8 – 9 residues at HdeA’s N-terminus and 2 – 4 residues at the C-terminus. More recently, however, an NMR-based full-length structure of E. coli HdeA was obtained at pH 3 (PDB ID: 5WYO [2]). In this study, HdeA was shown to bind its client proteins (SurA, MalE, OppA) heterogeneously through amphiphilic interactions and adaptive conformational populations at low pH. In another study, the conserved amphiphilic feature of HdeA (involving exposure of conserved hydrophobic residues and highly charged terminal regions) was found to be essential for its chaperone activity at low pH. For example, mutations that disrupt this feature in HdeA markedly reduce chaperone activity, and the hydrophobic region near V52/V58 in HdeA was found to be critical for in vivo chaperone activity [13].
Computational methods have been utilized to probe the structure and function of HdeA as a function of pH. Zhang et al. used constant pH molecular dynamics (CpHMD) simulations to estimate the pKas of Glu/Asp residues, which identified E37 as the titratable residue with the largest pKa shift from that of an isolated Glu residue [14]. They proposed the driver of HdeA dissociation at low pH to be the change in monomer charge from -4 (at pH > 6.0) to +6 (at pH 2.5) and loss of the ionic interactions of acidic residues (D43, E46, D47, D51) on one subunit with the lysine residues on the other subunit. Foit et al. identified two Asp residues (D20 and D51) to be critical for HdeA function and then designed a constitutively active double mutant at pH 7.0 based on those residues [15].
The structural plasticity of HdeA that is necessary for its activation has also attracted the use of numerous NMR-based and other biophysical methods to probe its dynamics. Hong et al. were first to show that HdeA adopts a globally disordered conformation under acid-stress conditions (pH < 3) [16]. Zhai et al. used 19F NMR to reveal that HdeA unfolding is necessary but not sufficient for activation and that multiple conformations are present in the activated functional state [17]. They also showed that the partially folded conformation of HdeA is essential for its chaperone function and the intrinsic disulfide bond is required to maintain this partially folded conformation. Garrison and Crowhurst measured the pKas of all titratable Glu/Asp residues in HdeA to be in the range 3.7 – 4.6 (except E37, which could only be estimated at > 5.0) and used H/D exchange to demonstrate the loosening of the tertiary and quaternary structure of HdeA as pH was lowered [1]. They concluded that neutralization of Glu/Asp residues is not likely to be the main trigger for HdeA dissociation and unfolding since the protein remains a well-folded dimer at pH 3. Salmon et al. provided evidence for a complex acid-induced unfolding pathway for HdeA [18], as their dissociation constant measurements showed a stabilization of the HdeA dimer in mildly acidic conditions and when E37 (embedded in hydrophobic pocket) is protonated. Their experiments also hinted at the existence of a low-population partially folded intermediate structure that can assist in chaperone function. Yu et al. recently provided further evidence that activated HdeA is largely disordered and exposes two hydrophobic patches for client interactions upon activation [19]. They also showed that activated HdeA is in equilibrium between partially folded monomer and dimer conformations, and concluded that HdeA activation is a complex multi-step activation mechanism, where intrinsic protein disorder facilitates chaperone function and the ordered structure leads to self-inhibition.
Yet, despite all these studies, there is still an incomplete picture of the underlying mechanism of acid-induced HdeA activation and client interactions. Since the experimentally measured pKa values of Glu/Asp residues fall in the ~3.7 – 5 range [1] it has been determined that the neutralization of Glu/Asp residues is unlikely to be the main factor that causes protein activation below pH 3.0. This requires looking at the mechanistic role of specific clusters of residues or motifs in HdeA in its function at low pH (< 3). In this study, we recorded H/D exchange NMR experiments in small pH increments between pH 3 and 2, in combination with molecular dynamics (MD) simulations, to probe the structural role of different HdeA motifs in its activation. We show that the N-terminus of HdeA becomes more protected at low pH (between 2 – 3) compared to neutral pH and plays an important role in HdeA function by steadily loosening its hold on the hydrophobic residues that are important for chaperone function.
Results and Discussion
NMR spectra and chemical shift assignment
In a previous publication we reported on changes that took place within HdeA in 1.0 pH unit increments between pH 6.0 and 3.0, in preparation for unfolding [1]. In our current effort to obtain detailed data on the unfolding and activation process of HdeA, we recognized the need to study the protein in smaller increments between pH 3.0 and 2.0, since it is clear that significant conformational and functional changes occur within this one pH unit (Supplementary Figures S1 and S2). Although the chemical shift differences between pH 3.0, 2.8 and 2.6 are small, it was still necessary to perform supplemental chemical shift assignment for a few shifted peaks; additionally, there are new peaks (for residues 5 – 7) that appear at pH 2.8 and become more pronounced at pH 2.6, corresponding to alternate conformational ensembles at the N-terminus. The chemical shifts of these additional (“b”) peaks are different than seen in the unfolded state; these alternative conformations may play a role in the increased solvent protection of this region (see MD simulation results, below).
The spectrum recorded at pH 2.4 illustrates another interesting and unusual phenomenon: it contains approximately twice the expected number of peaks, with half of the resonances overlaying with the folded spectrum recorded at pH 2.6, and the other half closely matching the chemical shifts of the unfolded protein at pH 2.0 (Supplementary Figures S1 and S3). This indicates that at pH 2.4 HdeA is in slow exchange between its folded and unfolded states. It also means that there is significant overlap in the central region of the spectrum from peaks in both folded (2.4f) and unfolded (2.4u) states. Because of this overlap, and because many of our experiments suggest that the data for 2.4f and 2.4u states are very similar to data recorded at pH 2.6 and 2.0, respectively, we have used these other pHs as a close substitute for pH 2.4. This helps to explain the gap in experimental data presented for HdeA between pH 2.6 and 2.0.
Hydrogen/deuterium (H/D) exchange provides a detailed look at changes in protection as a function of pH
A set of hydrogen/deuterium (H/D or 1H/2H) exchange experiments were performed on HdeA at pH 2.0, 2.4, 2.6, 2.8 and 3.0 (Supplementary Table S1) in order to observe further loosening (above what was previously observed for pH ≥ 3) [1] or unfolding of the protein as it becomes activated for chaperone function. The set of data at pH 3.0 was used as a “reference” that broadly represents the H/D exchange profiles reported at higher pHs [1]. We assessed these data from two different perspectives: first in visually evaluating which peaks were the most persistent (Figure 2), and second in numerically comparing solvent protection factors between the pHs (Figure 3). Even quick glances at these figures illustrate the significant changes in HdeA solvent protection (and therefore structure and flexibility) that occur over these small pH increments.
Figure 2.
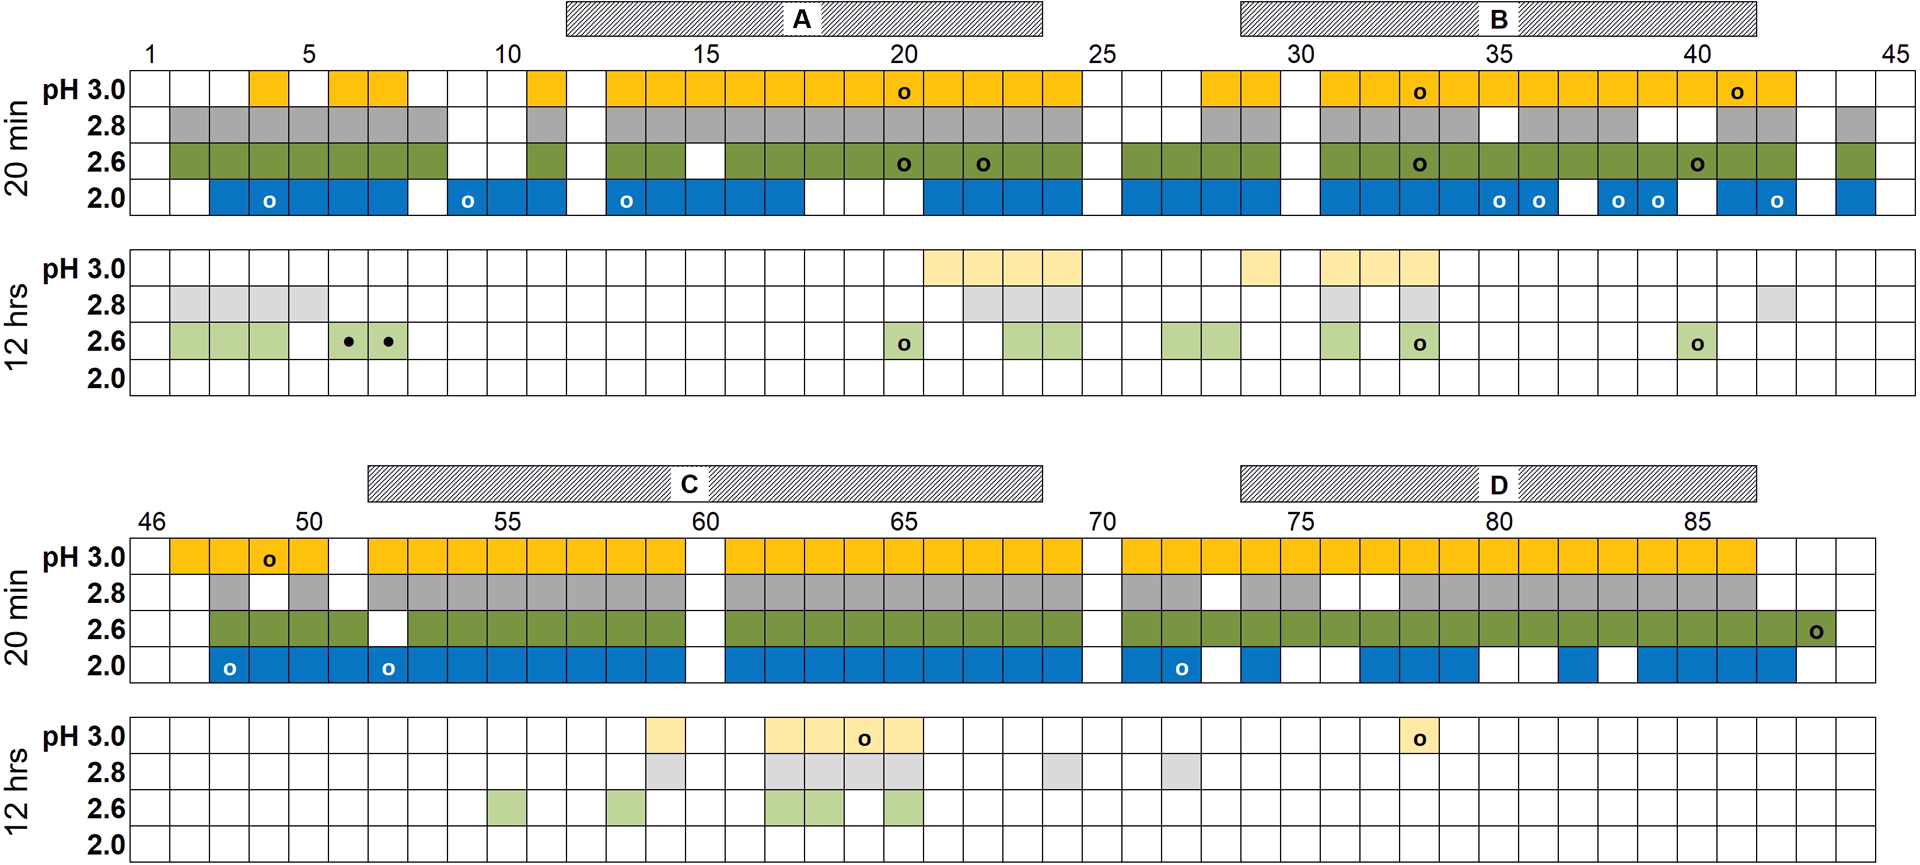
Summary of H/D exchange experimental results over the pH range 3.0 to 2.0 (the pH 3.0 data set is colored yellow, 2.8 is grey, 2.6 is green and 2.0 is blue). Boxes with strong colors represent HdeA residues whose peaks were observable at that specific pH in a 1H-15N HMQC spectrum immediately after the protein was exchanged into deuterated buffer (after approximately 20 min). Boxes with lighter shades correspond to residues at the respective pH for which peaks were still observable at the end of the exchange experiment (after ~12 h). Open circles represent positions where the presence or absence of the peak is ambiguous due to overlap with, or close proximity to, another peak. Closed circles (at residues 6 and 7) indicate that the peaks for both “a” and “b” conformations are visible in the spectrum after 12 hours. Hatched bars above the data indicate the location of helices A – D in the folded protein.
Figure 3.
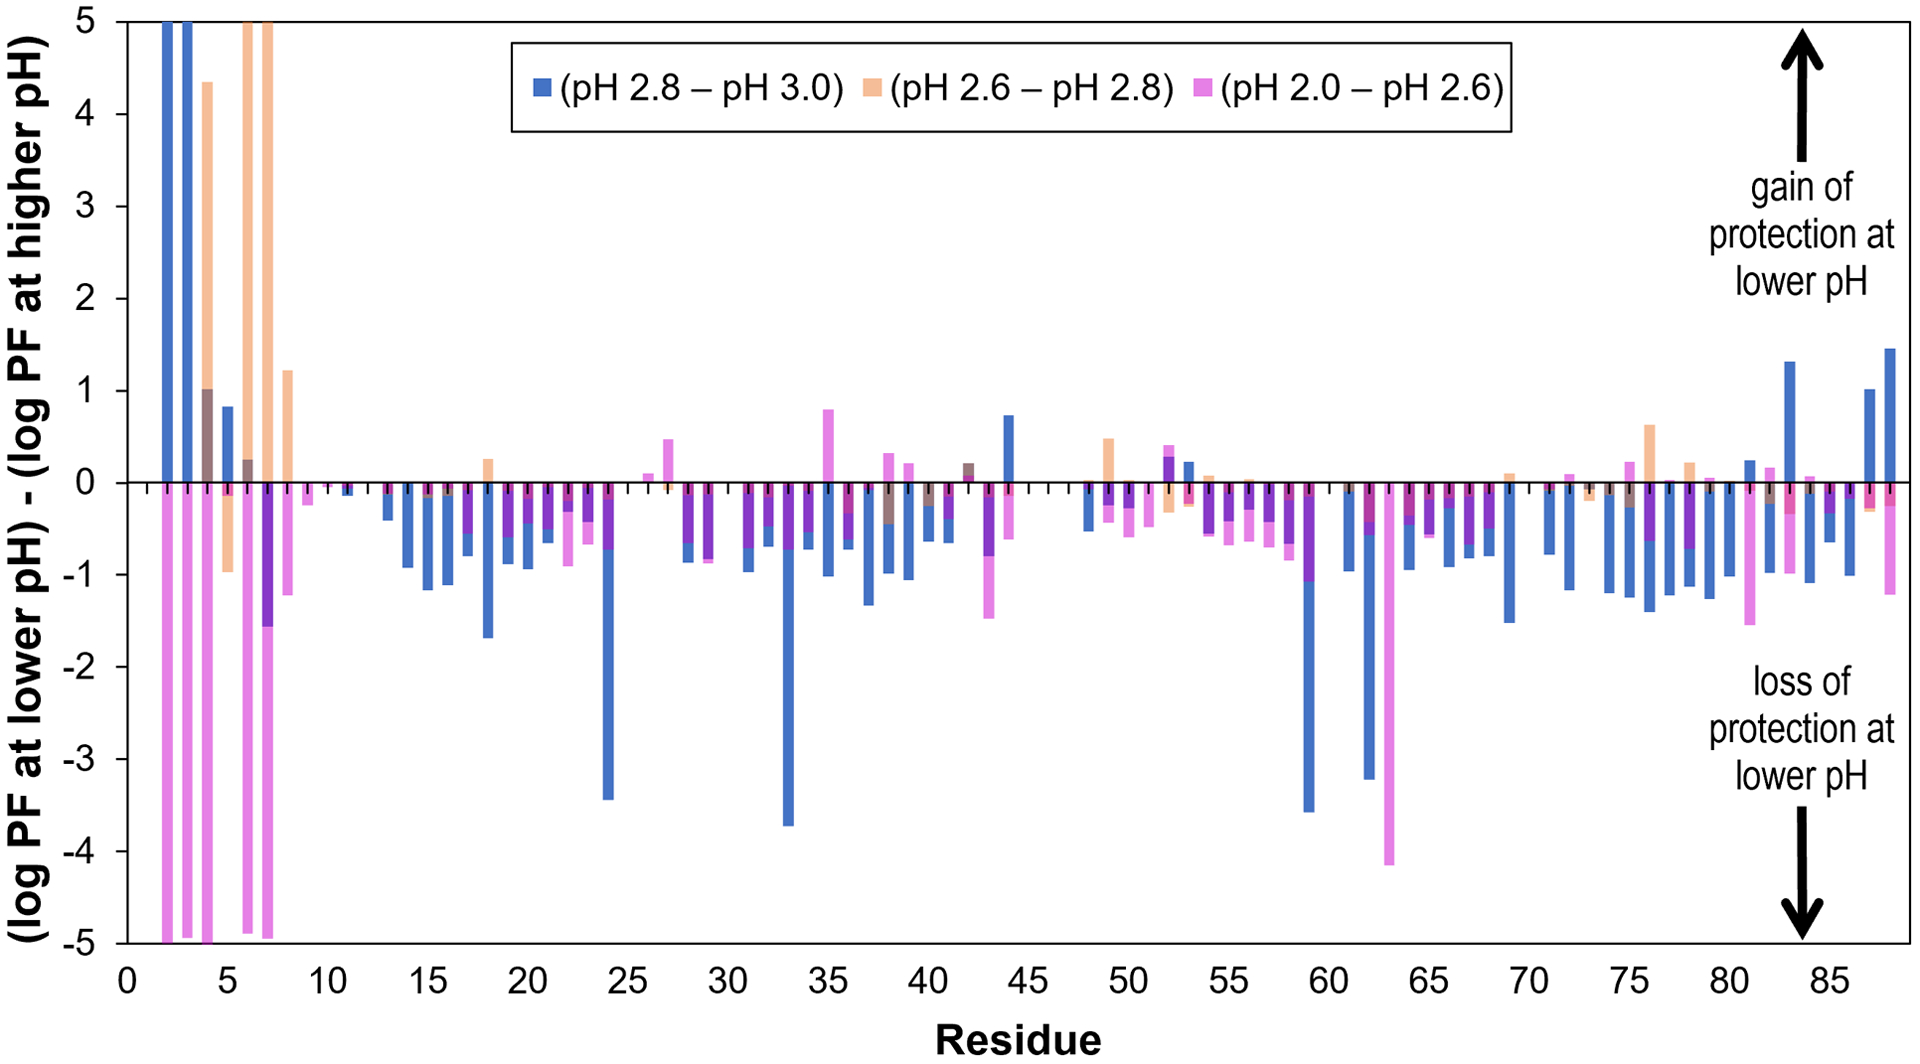
Illustration of the changes in log(protection factor) that are observed in HdeA as the pH is decreased. Change of log(PF) in moving from pH 3.0 to 2.8, 2.8 to 2.6 and 2.6 to 2.0 is shown in blue, peach and magenta, respectively. Positive values indicate gain of solvent protection at the lower pH, while negative values indicate loss of protection.
Figure 2 illustrates which residues are visible in a SOFAST-15N-HMQC spectrum approximately 20 minutes (darker colored boxes) and 12 hours (lighter colored boxes) after the protein sample is exchanged into 100 % deuterated buffer at the indicated pH. There are at least three noteworthy observations from the results shown in this figure, as outlined below.
First, we see increased protection of the N-terminus at lower pH. This is perhaps the most remarkable observation from the data in Figure 2: the N-terminal residues of HdeA are more protected at pH 2.8 and 2.6, compared to pH 3.0, where there is little protection of this flexible region after 20 minutes, and none after 12 hours. At pHs higher than 3.0 there is no protection at all, even after short exchange times [1]. This protection is largely lost again when HdeA becomes partially unfolded at pH 2.0. Even so, there are five protected residues at pH 2.0 after 20 minutes, compared to only three residues at pH 3.0. Thus, the unusual protection seen at pH 2.6 and 2.8 is maintained, to a lesser degree, in the partially unfolded state.
Second, there is protection near the disulfide bond C18-C66. We observe persistent protection of clusters of residues at 20 – 24 and 62 – 65 in the folded state of the protein (down to at least pH 2.6), which are adjacent to disulfide-bonded residues C18 and C66. At pHs 3.0, 2.8 and 2.6 most of these residues are among the few that are observable even after 12 hours. This may not be altogether surprising – the disulfide helps to maintain a compact structure in its vicinity which can result in higher solvent protection. These two clusters face each other in the folded structure: residues 20 – 24 are found in the AB loop and 62 – 65 are located in helix C (Figure 1). V63 is the most consistently solvent-protected residue in the folded protein; between pH 6.0 and 2.6 it still has maximal protection after 12 hours. Although it is near the center of helix C and has proximity to the disulfide bond, there is nothing obvious to explain why it, specifically, is always highly protected when the protein is folded, and why it is one of the best protected residues in the partially unfolded state at pH 2.0 (see below).
Conversely, it is interesting that there is no backbone protection on the opposite side of the disulfide, or at the cysteines, themselves; residues 66 – 70 are in close contact to 17 – 18 and may therefore be expected to have similar protection to residues on the opposite side of the disulfide. In examining the structure, there is no clear indication why these latter positions should be less protected than 20 – 24 and 62 – 65.
The third intriguing observation from the data shown in Figure 2 is that partially unfolded HdeA still maintains some protection at pH 2.0. Although it is understood that the disulfide bond helps HdeA maintain some residual structure in its “unfolded” state, it is still quite noteworthy that such a large number of peaks are protected at pH 2.0 after 20 minutes; with the exception of helix D, which has decreased protection, HdeA is well-protected at pH 2.0 in most of the same segments as the folded protein at pH 2.6, with evidence for added short-term protection at the N-terminus (extended to residues 9 and 10). Although there are no peaks remaining in the spectrum after 12 hours at pH 2.0, we can still observe numerous resonances after 2 hours of exchange that map closely to the residues seen at the end of the experiment in the folded protein at pH 2.6, with the notable exception of the N-terminal residues (which disappear from the pH 2.0 spectrum after 30 minutes). The best-protected residues at pH 2.0 include I62 and V63: the peak for V63 is visible in the HMQC for 4.5 hours after exchange into deuterated buffer, followed closely by I62 which remains visible for 4 hours.
Protection factor values highlight changes in the monomer core and possible interactions between the N- and C-termini at low pH
By looking at the protection factor values themselves (Figure 3 and Supplementary Figure S3) we can see some additional detail that is not apparent from the information provided in Figure 2.
A significant loss of protection from solvent is observed (in moving from pH 3.0 to 2.8) at a primarily hydrophobic cluster that includes residues V24 (in the AB loop), V33 (at the center of helix B), as well as T59 and I62 (at the center of helix C), whose side chains face each other at the center of the folded monomer (Figure 3). In previous work we saw that the “outer” core of the protein fold (near the more exposed portions of helices A and C) experiences a substantial loss of solvent protection between pH 4.0 and 3.0 [1]. In lowering the pH by only 0.2 more pH units, the “inner” core of the protein is breached by solvent. Although previous investigations have focused on several of these residues individually [19], more work needs to be done to evaluate the level of importance of this hydrophobic cluster on HdeA fold stability.
Turning our focus again to the termini of HdeA, we observe that there is not only increased protection at the N-terminus (especially at residues D2, A3 and K5) in transitioning from pH 3.0 to 2.8, but there is additionally increased protection at C-terminal residues D83, K87 and D88 (Figure 3). We wondered if the termini come into contact at this pH; the N-terminus of one protomer could be within interaction range of the C-terminus of the second protomer in the dimer. Since at least 90% of the acidic Asp side chains are neutralized at pH 2.8 (based on previously measured pKas [1]), we determined that any stabilization of the interaction between these components must be due to hydrogen bonding rather than charge-charge contacts. At pH 2.6 there is a further expansion of protection at N-terminal residues, with higher protection factors at Q4, A6, A7 and D8; while we still observe C-terminal protection at pH 2.6, the protection factor values are slightly lower than at pH 2.8 (Supplementary Figure S4).
Construction of HdeA structural models
We decided that molecular modeling would help us to better understand some of the phenomena observed experimentally, with a special focus on investigating how the N-terminus of HdeA gains solvent protection (and therefore some stabilized structure) at pH 2.6 and 2.8. The molecular structure of the HdeA dimer was modeled in two ways, as described in the Materials and Methods. The NMR-based HdeA model used as a starting structure for MD simulations is shown in Figure 4A. It shows the two protomers in a stable dimer along with an unstructured N-terminus. Since the NMR template structure was obtained at pH 3.0 [2] and our NMR results show that HdeA behaves in a similar fashion in the pH 3.0 – 7.0 range, this structure provides a good starting point for both low (pH < 3.0) and higher pH simulations. A hybrid model is shown in Figure 4B, obtained by replacing the N-terminus of the NMR structure with a partially helical N-terminus obtained from the Robetta server [20]. Because our NMR H/D exchange results show that the N-terminus is protected in a narrow pH range (2.0 < pH < 3.0), this structure was built to probe whether a potential helical structure of the N-terminus is responsible for the experimentally observed protection of this motif.
Figure 4.

(A) Structural model of HdeA dimer based on the NMR structure (PDB ID: 5WYO [2]). (B) Structural model of HdeA dimer based on the NMR structure (PDB ID: 5WYO [2]) and partial helical structure of the N-termini shown in black boxes. The two protomers of the HdeA dimer are shown in red and blue for both models. Helices A-D are labeled on one protomer for both models.
These structural models were subjected to pH-REMD simulations [21] to see which of the two models captured the experimental pKa of the acidic titratable residues. The results are discussed below.
pKas of Glu/Asp residues were calculated and used to determine which structural model was most compatible with the experimental data
HdeA has 16 acidic residues (11 Asp and 5 Glu) and 12 basic Lys residues, which can significantly affect electrostatic interactions within the protein. The Lys residues were not titrated in these simulations since their isolated side chains have pKa values of ~11, therefore all Lys residues were kept protonated (with a +1 charge) at all simulated pH values. The pH-REMD simulations [21] provide a way to calculate pKa values of individual residues during a simulation (setup described in Materials and Methods). The simulated pKa values for the Glu/Asp residues in both NMR and hybrid model structures were compared to previously measured pKa values obtained from NMR experiments [1] in Figure 5. The calculated pKa values from the NMR model (Figure 5A) are in closer agreement to the experimental values (with ~79% correlation) than those from the hybrid model (Figure 5B) (with ~38% correlation). We also compared the pKa values obtained for the NMR and hybrid models with those obtained by previous MD simulations that were based on the crystal structure 1BG8 [14]. This comparison is presented in Supplementary Table S2 and shows that our NMR model performs better than the 1BG8 based model, which in turn performs better than our hybrid model. The pKa comparison provides a stringent biochemical measure of the accuracy of a structural model for pH dependent simulations, so we carried out all subsequent simulations and analyses with the NMR model.
Figure 5.

Comparison of calculated pKa values of Glu/Asp residues (y-axis) with the experimental pKa values (x-axis) from Garrison and Crowhurst (2014) [1]. (A) NMR model; (B) Hybrid model. The green line corresponds to a perfect fit and the red line corresponds to the actual fit with the corresponding R2 reported in the top left corner of each panel.
Dynamical and structural analysis from CpHMD simulations
The NMR structural model was used in 1.1 μs long CpHMD simulations at each pH (1.0, 2.0, 2.4, 2.5, 3.0, 4.5, 5.0, and 7.0) to capture pH dependent dynamical effects in HdeA and to reconcile our previous NMR studies [1] at higher pH (3.0 – 6.0) with the current studies at low pH (2.0 – 3.0). These simulations are computationally less expensive than pH-REMD simulations but capture the pH-dependent conformational sampling well. The root-mean-squared-fluctuations (RMSF) of the HdeA residues were computed to capture the dynamical range of different residues, shown in Supplementary Figure S5 at different pHs. The N and C termini show high fluctuations as expected. Conserved residues, some of which are in the BC loop region, have large fluctuations, especially at pH 3.0. It is also interesting to note that the C terminal residues at pH 3.0 fluctuate (move) less. This could partially explain the increased protection of the C-terminal residues observed in the H/D exchange experiments within the narrow pH range 2.0 < pH < 3.0. The MD and NMR studies are indeed very sensitive to small pH changes, so even though MD shows a less dynamic C-terminus at pH 3.0, NMR experiments show increased protection (less flexibility) for C-terminal residues in the pH 2.6 – 2.8 range. This small deviation between MD and NMR for increased protection of the C-terminus is potentially due to insufficient conformational sampling in the simulations. Both NMR and MD results show reduced protection of the C-terminal residues at pH 2.0.
The helical secondary structure content observed as a function of pH during MD simulations is shown in Supplementary Figure S6 for HdeA dimer and monomer models. For the dimer, residues 7 – 9 near the N- terminus increase in helical structure at pH 2.0 compared to higher pHs, while only subtle helical structure remains for residues 13 – 17. pH 7.0 has the second lowest (of all pHs shown) helical content for this region (residues 13 – 17), while at pH 3.0, residues 13 – 15 show the highest helical propensity. For the monomer, residues 17 – 24 show similar helical content when comparing pH 2.4 to pH 2.0. Conversely, residues 45 – 49 and 59 – 66 have the greatest helical structure at pH 2.0 compared to other pHs in the monomer. This is interesting, as a previously reported hydrophobic client-binding region (residues 52 – 58) is located between these helical regions in the monomer at pH 2.0; the helices may provide constraints to hold the hydrophobic region in place for interaction with client proteins. The functional role of these helical motifs will become clear in the future, when these pH-dependent structural models are docked to their client binding proteins. At pH 3.0 residues 47 – 49 and residues 53 – 58 (one of the putative client binding regions) show an increased propensity to adopt helical structure compared to other pHs. On the other hand, residues 75 – 87, near the C terminus, show a clear decrease in helical structure at pHs 2.5 and 2.0 compared to higher pHs. For the monomer, there is no clear trend of helical structure distribution as a function of pH since some regions of HdeA have higher helicity at pHs 3.0, 2.0, and 1.0.
The overall secondary structure propensities (helix, beta sheet, bends, unstructured) for the HdeA dimer during MD simulations are shown in Supplementary Figure S7 at different pHs. It shows that the dimer loses structure below pH 3.0. The simulations are unable to capture full dissociation of the dimer at these pHs at our simulation time scales; however, a partially unfolded dimer at these pHs is consistent with functional studies that show that dimer structure (even if partially unfolded) is necessary for function [17].
Secondary structure cannot explain enhanced protection of HdeA N-terminus at low pH
It is often difficult to resolve the structures of the N and C termini of proteins as they tend to be very flexible. One of the first crystal structures of HdeA (PDB ID: 1DJ8) did not resolve the first 8 residues of the N-terminus or the last 2 residues of the C-terminus because of this high flexibility. As discussed above, the NMR H/D exchange data presented in this study show that residues in the N-terminus become protected at low pHs. At pH 3.0 only three residues (Q4, A6 and A7) are protected after 20 minutes while none of these residues remain protected after 12 hours. This contrasts strongly with data at pH 2.6 and 2.8, where all seven residues between 2 and 8 are protected after 20 minutes, and four (at pH 2.8) or five (at pH 2.6) are remaining after 12 hours. Even when partially unfolded at pH 2.0 HdeA has seven residues out of the first 10 in the sequence that are protected after 20 minutes (more than seen in fully folded HdeA at pH 3.0), although none of these residues are protected after 60 minutes.
Protection can be indicative of the presence of secondary structure elements through hydrogen bonding such as formation of a helix or a β sheet. In order to assess if this was the case for HdeA, secondary structure propensity analysis was done for monomer and dimer NMR model-based CpHMD simulations at various pHs. To reiterate, HdeA is found as a well folded inactive homodimer at neutral pH, and at low pHs (pH 2.5 and lower) it is partially unfolded. Supplementary Figure S8A and B shows the secondary structure content for the N-terminus (residues 1 – 10) in the dimer and monomer structure-based simulations in terms of helical, sheet or bend/turn propensity. Analysis of the secondary structure content of the dimer (Supplementary Figure S8A) shows that, overall, the N-terminus becomes slightly less structured as the pH decreases, except when moving from pH 2.5 to 2.0. The bend content also increases slightly when transitioning from pH 2.5 to 2.0. The beta sheet and helical content make up < 1 % of the secondary structure of the N-terminus, yet the helical content increases slightly going from pH 2.5 to pH 2.0. Overall, there is no significant difference in secondary structure content between low pH (< 3.0) and high pH (> 3.0) conditions. Supplementary Figure S8B shows the secondary structure analysis from the monomer simulation for only pHs in the range 3.0 – 1.0 since at higher pH values HdeA is found as a dimer. The structured content shows to be increasing as the pH decreases instead of what might typically be expected for an unstructured N-terminus. From pH 2.5 to pH 1.0 the bend content increases as the pH decreases. The beta sheet content is highest at pH 3.0 but remains constant and very low through all pHs. Although the helical content increases from pH 3.0 to 1.0 it doesn’t exceed 10%. Supplementary Figure S8C shows the helical and sheet propensity from NMR chemical shift data. Bend/turn content cannot be obtained from these data; however, these NMR data also show no significant difference in secondary structure content between low pH and high pH conditions.
As seen in Supplementary Figure S8, our studies suggest that the change in secondary structure as a function of pH is not significant; such a change therefore cannot explain the observed higher protection of some N-terminal residues at low pH. The CpHMD simulations of the hybrid model, where the helical content was built into the N-terminus, indicate that the helical structure of the N-terminus is not stable and is lost during the simulations. This also supports the conclusion that secondary structure cannot be the basis of the observed protection of some N-terminal residues at low pH [22].
HdeA N-terminal protection stems from increased tertiary contacts at low pH
Structural contact analysis was performed for the HdeA dimer from CpHMD simulations at each pH using the CPPTRAJ program from AmberTools as described in Materials and Methods. Snapshots saved for each 1.1 μs trajectory at the previously specified pH range were processed using the same parameters. The backbone nitrogen atoms for residues 1 through 10 were specified as the first selection set and all other atoms from residues 1 – 89 (for both HdeA protomers in the dimer) were used for the second selection set. A structural contact is defined by two residues, one of which will come from the first selection and the other one will come from the second selection. The distance constraint between both masks was set to 4 Å to ensure that if a contact was present with a specific backbone NH, similar to an NH that cannot undergo exchange in the H/D exchange experiment. As the N-terminus remains mostly unstructured, microsecond MD simulations cannot sample the full conformational space, hence the number of structural contacts made by backbone NH groups serves as a proxy for the observed protection of N-terminus at low pH.
The number of structural contacts made by the backbone NH groups of N-terminal residues 2 – 10 are shown in Figure 6A as a function of pH. As the pH is lowered from 7.0 to 4.5 there is a small increase in number of contacts which is lost as the pH is lowered further to 3.0. This is consistent overall with our NMR studies, which show that in the pH range 3.0 to 7.0 the protein behaves in a similar manner. As the pH is lowered further to 2.5, we observe an increase in the number of structural contacts made by the backbone NH groups, consistent with increased protection observed by NMR at pH < 3.0. As the pH is lowered further to 2.0, the number of contacts drops, consistent with some lost protection of the N-terminus observed in H/D exchange experiments presented earlier at pH 2.0.
Figure 6.
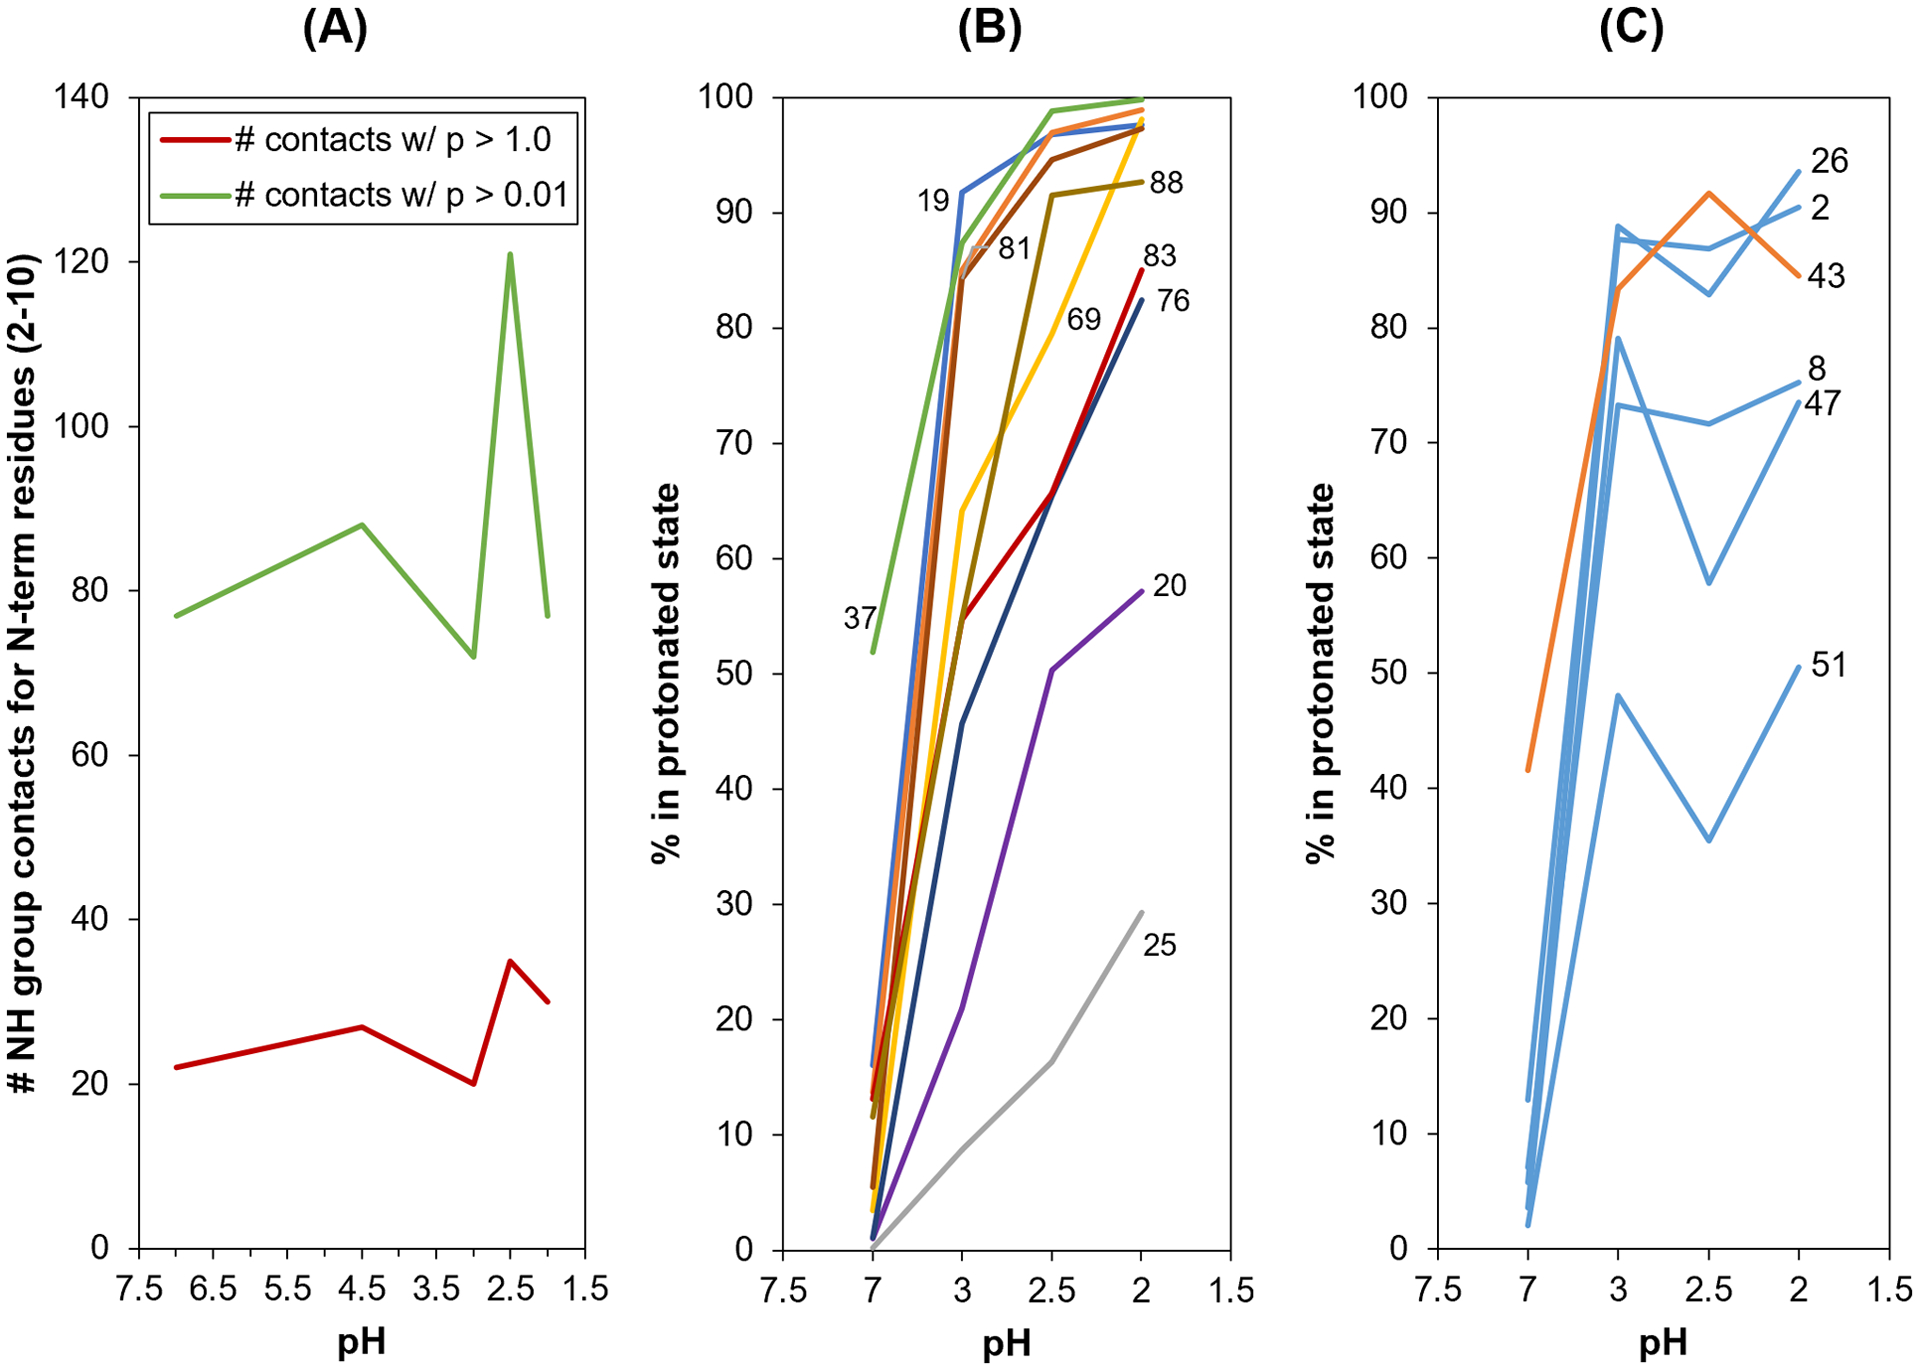
(A) Structural contact-based protection analysis of the HdeA N-terminus. The number of contacts observed during CpHMD simulations for backbone NH groups of residues 2 – 10 as a function of pH. Red points count contacts observed during at least 10% (p > 0.1) of the 1.1 μs simulation time and green points count contacts observed during at least 1% (p > 0.01) of the simulation time. (B) Protonation states of titratable residues for “well-behaved” residues, with residue number labeled beside its associated line. (C) Protonation states of titratable residues for “oddly behaved” residues (D2, D8, E26, D43, D47 and D51), for which their protonation level either flattens before reaching 100% or dips from pH 3.0 as the pH is reduced further.
To further understand a potential mechanism behind this pH-dependent protection of the N-terminal residues, we analyzed the percent protonation of the acidic titratable residues as the pH is lowered. Ideally, this number should approach 100% as the pH is lowered well below the respective pKas. Figure 6B shows the residues that are well-behaved and follow the expected pattern. Figure 6C, however, shows the six residues (D2, D8, E26, D43, D47 and D51) that do not behave per the expected pattern: their protonation states either flatten out below 100% or decrease when the pH is lowered below 3.0. This odd behavior prompted us to calculate protonation states for each acidic titratable residue separately in each protomer in the dimer. The results are shown in Supplementary Table S3. It shows an unusual asymmetry in protonation states at pH 3.0 and pH 2.5 for multiple residues (D8, D20, E46, D47, D51, D76, E81, D83, D88): at the most extreme, there is a 73 point difference in the % protonation of D20 side chains at pH 2.5, when comparing one protomer to the other within the dimer. No obvious patterns emerge between the residues that display this asymmetry and N-terminal protection behavior observed in the pH range 2.0 – 3.0. However, many of these residues (e.g., D20, E46, D47 and D51) have been implicated previously for their role in HdeA chaperone function [14, 15]. Our study therefore suggests that the mechanistic role of these residues may not be straightforward; further studies are needed to investigate the correlation between their observed protonated state asymmetry and their role in HdeA chaperone function. What is clear is that the dynamics of HdeA are turning out to be very rich and complex in the low pH range at which HdeA becomes activated.
One example of a key contact involving the N-terminus that becomes stronger at low pHs is the hydrogen bond (≤ 3.5 Å) interaction between K5:NH and A23:O, which is shown in Figure 7. The H/D exchange NMR data for K5 shows protection of its NH group for pH values below 3.0. At pH 2.5, the MD simulations indicate that K5 may form important backbone and side chain contacts with backbone carbonyl oxygens of several residues in addition to A23 (which is observed during 46 % of the simulation time), including D2/A3 (9.7 %), V24 (9 %), K70 (7.9 %) and A72 (6.7 %). This variety of contacts may help to explain why we observe additional (“b”) amide peaks for K5, A6 and A7 in 1H-15N HSQC NMR spectra at pH 2.8 (weak intensity) and 2.6 (stronger intensity), corresponding to at least one ensemble of stable alternate conformations at those positions that are in slow exchange with the primary conformation. Additionally, semi-stable interactions between residues A23 and V24 with K5 may help to explain why we observe enhanced protection of residues 20 – 24, even at pH 2.0, in the H/D exchange experiments (on the C-terminal side of C18 in the disulfide bond) compared to poorer protection of residues T17 and C18 (Supplementary Figure S4). The relatively high-occupancy hydrogen bond between K5:NH and A23:O (seen in Figure 7) provides a potential mechanism for the protection of K5.
Figure 7.

Intra-chain backbone contact between K5:NH and A23:O. The protection of K5 NH group becomes stronger as the pH is lowered due, in part, to interaction with the backbone carbonyl oxygen group of A23. Occupancy refers to fraction of the simulation time that the contact is observed.
pH-dependent mechanistic role of N-terminus in HdeA chaperone function
Yu et al. recently reported that residues 49 – 55 participate in client binding and they speculated that at high pHs the N-terminus of the opposing monomer interacts with this region and inhibits HdeA from activation. Yu et al. looked at mutant L50K to show that this was one key position that binds client proteins and is important for chaperone function [19]. The mutant also destabilizes the inactive dimer structure.
The L50 residue interactions were analyzed as a function of pH from the CpHMD simulations. At pH 7.0, it forms a van der Waals contact with K11 for ~50% of the simulation time. A L50K mutation at this pH would disrupt this contact due to charge-charge repulsion between K11 and K50 in the mutant, consistent with experiments [19]. At pH 2.0, the L50-K11 contact is present almost ~75% of the time in the CpHMD simulations, suggesting its importance for chaperone function and helping to explain why the L50K mutant is so disruptive. The charge-charge repulsion between K11 and K50 in the mutant with impaired chaperone function indicates that this interaction facilitates chaperone function and may facilitate the transition from an inactive to active state. In terms of comparison of CpHMD results with our H/D exchange experiments, the backbone amide of L50 interacts with K11 during ~64%, ~48%, ~71%, and ~97% of the simulation time at pHs 7.0, 3.0, 2.5, and 2.0 respectively. This correlates well with H/D exchange experiments, which show measurable, although not total, protection for this residue at all pHs.
Yu et al. also claimed that the N-terminus of the opposing HdeA chain blocks client binding site I (residues 49 – 55) at higher pHs. In our CpHMD simulations, at higher pHs (≥ 3.0) the client binding site closely interacts with the N-terminus of the opposing chain. Although not any single contact is very stable at these pHs (≥ 3.0), the sum of the different contacts maintains the N-terminus (residues 1 – 10) near the client binding site (residues 49 – 55). As the pH decreases to pH 2.5 and below, the N-terminus switches positions and associates closely with the C- terminus of the opposing chain, thus exposing a potential binding site for client proteins. Figure 8 shows the difference in N-terminal contacts between pH 7.0 and 2.0. A β sheet forms between the C-terminus and the N-terminus of the other chain. An interaction between K10:NH and L50:O is present for ~52% of a one microsecond simulation at pH 2.0. It seems that the N-terminus can alternate between interacting with the C-terminus of the opposite chain and interacting with part of the client binding site. This suggests that when the client protein is present, the increased protection at the N-terminus and interactions with the C-terminus help to keep the N-terminus “out of the way” of the client binding site (residues 49 – 55).
Figure 8.

Interaction of the HdeA’s N-terminus (blue) with its C-terminus (red) and/or client protein binding region (yellow). (A) pH 7.0; (B) pH 2.0. The purple box highlights the interaction between the N-terminus and client protein binding region, while the green box highlights the interaction between the N- and C-termini. These are perspective images, where the parts of the molecule closer to the viewer will appear larger.
Conclusions
In this work, we have used H/D exchange NMR experiments and constant-pH MD simulations to probe the mechanistic role of specific regions of HdeA in its acid-induced activation and chaperone function in the 2 – 3 pH range. The NMR study shows that the N- and C-termini of HdeA unexpectedly become more protected in this low pH range compared to higher pHs (> 3), while the rest of the protein structure is partially unfolded to enable HdeA’s chaperone function. Constant-pH MD simulations show that at high pHs (> 3), the N-terminus maintains a dynamic but sustained interaction with one of the putative client binding sites (residues 49 – 55). However, in the low pH range between 2 and 3, this interaction is weakened, exposing the client binding site for chaperone function. In addition, the N-terminus acquires an increased number of tertiary contacts in this low pH range, where some of interactions are made with the C-terminus residues, providing a mechanistic basis for the increased protection observed in the H/D exchange NMR experiments at low pH. To probe this further, a closer look at the protonation states of the titratable residues shows multiple Asp/Glu residues (E26, D47 and D51), whose protonation fraction unexpectedly drops as pH decreases from 3 to 2.5 and then rises again as pH transitions from 2.5 to 2.0. The titratable residues in the two protomers of the dimeric HdeA exhibit an asymmetry where the protonation fraction of the same residue behaves normally in one protomer but not in the other protomer. Many of these residues (D20, E46, D47 and D51) have been implicated in previous studies, which, combined with our findings, suggests a complex role played by these titratable residues in HdeA function and behavior at low pH. This also lays the groundwork for future studies where the role of each titratable residue in HdeA function will require careful investigation.
Materials and Methods
Protein sample expression and purification
The HdeA gene was expressed from a pET21a plasmid in BL21(DE3) E. coli in minimal medium containing 1 g 15NH4Cl, 2 g 13C glucose and 5% 15N, 13C-labeled BioExpress rich medium (Cambridge Isotope Laboratories), similarly to what was previously described [23].
Protein purification proceeded via a simplified protocol compared to previous reports [1, 23], in which the mixture was dialyzed directly into SP Sepharose buffer A (20 mM sodium acetate, 0.5 mM EDTA, pH 4.0) after periplasmic extraction. Following a short centrifugation to pellet the precipitate that was formed during dialysis, the supernatant was injected onto a pre-equilibrated SP Sepharose column and eluted via a pH-based gradient with SP Buffer B (50 mM HEPES, 2 mM EDTA, pH 7.0). Fractions containing HdeA were pooled and dialyzed into Superdex Buffer (50 mM sodium phosphate, 2 mM EDTA, 0.15 M NaCl, pH 7.2), concentrated, and then injected onto a Superdex 75 column to obtain highly pure HdeA.
In order to maintain consistency with the conditions used in previously published studies [1, 23], HdeA was dialyzed into 50 mM citrate buffer at the desired pH for NMR experiments. Sample concentrations ranged from 0.5 to 1.5 mM, and NMR experiments were performed at 25 °C on an Agilent DD2 600 MHz spectrometer with a room temperature triple resonance probe. All raw NMR data were processed using NMRPipe/NMRDraw [24, 25] and the resulting spectra were viewed and analyzed using NMRViewJ [26, 27].
NMR chemical shift assignment
Backbone chemical shift assignments of HdeA at pHs 2.6 and 2.8 were achieved with HNCaCb and CbCa(CO)NH experiments, while assignment of HdeA at pH 2.4 required HNCaCb, CbCa(CO)NH as well as HNCO and HN(Ca)CO spectra to resolve and assign both folded and unfolded backbone peaks. In many cases the data from pH 2.6 were used to aid assignment of the folded peaks at pH 2.4. Assignment of HdeA at pH 2.0 was achieved, in part utilizing the mutant HdeA-F28W at pH 1.5 [19], which results in elimination of the additional peaks that complicate assignment of the wild type at pH 2.0. Experiments for assignment of HdeA-F28W included HNCaCb, CbCa(CO)NH, HNCO, HN(Ca)CO and HNN spectra [28], which allowed for a more complete backbone assignment than previously reported [19]. Most peaks from the mutant could be mapped onto the spectrum of the wild type at pH 2.0, and the data were also used to help assign the unfolded peaks at pH 2.4. Secondary structure propensity (SSP) data for N-terminal residues 1 – 10 were calculated using 1HN, 15N, Cα and Cβ shifts [22].
NMR hydrogen/deuterium exchange
HdeA samples were rapidly exchanged from 50 mM citrate buffer in 90% H2O/10% D2O at the desired pH into 50 mM citrate in 100% D2O at the same (corrected) pH using Zeba Spin Desalting Columns (Thermo Scientific). The pH meter was calibrated before each use and the buffers were regularly checked with a different pH probe and meter to ensure accuracy. The measured pD of each buffer in D2O had been corrected to its equivalent pH using the equation: pH = (0.929)pD + 0.42 (as per [29]). A series of 72 SOFAST-15N-HMQC spectra [30] (9.5 minutes each) were then recorded sequentially for approximately 12 hours to track the disappearance of backbone amide peaks. The rate of exchange (kobs) for each amide was determined by fitting data to a standard exponential decay equation (y = aebx, where b = kobs) using NMRViewJ software [26, 27]. Protection factors (PF) were calculated using the ratio PF = kint/kobs where kint is the intrinsic rate of exchange, determined from amino acid pairs in the HdeA sequence at each pH using the program SPHERE [31].
HdeA structural models
NMR structure:
The full-length NMR structure of HdeA dimer was obtained from the Protein Data Bank (PDB ID: 5WYO [2]) and the first conformer was selected for MD simulations.
Hybrid structure:
As mentioned earlier, hydrogen-deuterium exchange experiments showed that several N-terminal residues of HdeA become protected at low pHs. This protection can be indicative of the presence of secondary structure elements (helix or a beta sheet) through hydrogen bonding involving backbone NH groups. The available HdeA structures (PDB ID: 1DJ8 [12] and 5WYO [2]), either did not resolve the N-terminus or lacked secondary structure properties in the N-terminus. The Robetta protein prediction server [20] was used to search for a model with a structured N-terminus. The 1DJ8 crystal structure was used as a template and one of the top scoring Robetta models with a partially helical N-terminus was selected to create a hybrid structural model of the HdeA dimer. This “hybrid model” was generated by merging the structured N-terminus for both monomer chains from the Robetta model (residues 1 – 11) with the remaining residues (12 – 89) from the NMR structure 5WYO.
Dimer/Monomer:
HdeA activation involves homodimer dissociation into monomers. To simulate both states MD simulations using the dimer and monomer structure were performed. The monomer structure was obtained by keeping one of the identical chains from the NMR structure (PDB ID: 5WYO).
pH-dependent models:
Constant pH MD simulations for both models (NMR and hybrid) were carried out as dimers and as monomers. Molecular systems for constant pH simulations and the corresponding input files were prepared by using the “tleap” program, which is part of the AmberTools biomolecular simulation package [32]. Preparation of the PDB files consisted of changing Asp and Glu residue names to AS4 and GL4 to indicate residues that will be titrated. Each of the two protomers in the dimer has a disulfide bond between residues 18 and 66, which was built by using the CYX residue type for the two involved cysteines.
MD Simulation Protocols
Classical MD:
AmberTools was used to prepare the topology and coordinate files for simulations. The AMBER FF14SB forcefield [33] was used for the protein, while the TIP3P forcefield [34] was used for the water molecules in the simulation box. The distance between the edge of the water box and HdeA molecule was at least 12 Å. The periodic boundary conditions were used for the simulations to mimic the physiological interactions beyond the simulation box. After solvation of the protein, Na+ ions were added to neutralize the system. Minimization, heating and equilibration were performed and then the system was subjected to 500 ns of MD simulation using a 2 fs time step at 298 K.
Hybrid model restrained MD:
To improve the side chain conformations of the hybrid model, the SCWRL4 program [35] was used. The hybrid model taken through standard MD steps (minimization, heating, relaxation), except during the equilibration and production steps where a restrained force constant of 10 kcal/mol/Å2 was added to the N-terminus for 500 ns at pH 2.0 and 3.0. After the simulations were completed, the frame with the lowest RMSD from pH 3.0 was used for further constant pH (CpHMD) and pH replica-exchange (pH-REMD) MD simulations.
CpHMD:
Once the 500 ns classical MD simulation was completed the minimized lowest RMSD structure was used for constant pH molecular dynamics (CpHMD) in explicit solvent. CpHMD is a widely used computational method [36, 37] to assess protonation state changes and their effect on protein structure and dynamics. Tleap, part of AmberTools, was used to prepare the topology and coordinate files for constant pH simulations as described earlier. The constant pH forcefield, FF10 (equivalent to the FF99SB [38]), was used for the protein, and the TIP3P forcefield [34] was used for the water box. The distance between the edge of the water box and any protein molecule was 12 Å, while utilizing periodic boundary conditions. After solvation of the protein, Na+ ions were added to neutralize the system. Cpinutil.py script was used to generate the corrected atomic radii topology and constant pH input (CPIN) file. The CPIN file instructs AMBER MD program about the residues that will be titrated. In order to sample the inactive to active conformations of HdeA, CpHMD simulations were performed at the following pHs: 1.0, 2.0, 2.4, 2.5, 3.0, 4.5, 5.0, and 7.0 for 1.0 μs at each pH. Each HdeA monomer contains 28 titratable basic and acidic residues. Out of the 28 titratable residues, 12 are basic Lys residues that have a side chain pKa of approximately ~11, therefore Lys side chain protonation states should remain unchanged and were excluded from titration. The remaining 16 acidic residues are Glu and Asp which have side chain pKas of ~4.0; consequently, they were included in the titrations. Protonation state changes were attempted every 100 steps (ntcnstph=100). After every 100 steps the explicit solvent simulation was halted, and water and ions were stripped away. The solvent model was exchanged from explicit solvent to Generalized Born solvent model and protonation state changes were randomly attempted. If the change in protonation state was accepted, the protein was held fixed and the solvent was relaxed for (ntrelax=100) 200 fs using canonical MD to help the solvent adjust to the electrostatic change in the environment. This was crucial for maintaining proper solvent geometry and interactions. The simulations were performed at 298 K and 1 atm pressure.
pH-REMD for pKa:
pKa values provide a sensitive biochemical metric to gauge if the two structural models (NMR and hybrid) are capturing the correct protonation changes as a function of pH. To obtain pKa values for the titratable Glu/Asp residues in the two structural models, pH replica exchange molecular dynamics (pH-REMD) was performed [21]. pH-REMD protocol is computationally expensive but enhances protonation state and conformational state sampling. To sample biologically relevant conformations, 14 replicas were used covering a pH range of 1.0 – 7.5 with 0.5 pH increments between each replica. Each replica input file included the same parameters with each input file only differing in solvent pH. The pH-REMD trajectories were analyzed to compute the pKa of all titratable Glu/Asp residues for comparison with experimental values obtained by Garrison and Crowhurst [1].
CPPTRAJ secondary structure analysis
Each trajectory was analyzed for secondary structure using the CPPTRAJ [39] program included in the AmberTools package. CPPTRAJ calculates secondary structure using the DSSP [40, 41] algorithm and the output file gives the mean structural propensities for each residue over all frames. The possible secondary structure outputs are: α helix, β bridge, extended strand, 310 helix, π helix, turn, and bend. DSSP defines the bend secondary structure as “regions with high curvature” and they require curvature of at least 70 degrees.
CPPTRAJ native contacts analysis
CPPTRAJ native contacts function was used to search for intra and intermolecular contacts between the N-terminus of HdeA and the rest of the protein. The goal of this analysis was to search for possible N-terminal backbone amide contacts in order to better understand hydrogen deuterium protection results. The first frame of each trajectory was used as a reference. The backbone amide nitrogen for residues in the N-terminus was used as the first mask and all atoms in the remaining residues (both monomers) were used as the second mask. The heavy-atom distance cut off for this search was set to 4 Å. The native contact analysis was also carried out to capture interactions between for all residues.
Supplementary Material
Acknowledgements
KAC, JSG and MAW are sincerely grateful to the NIH for support of their work (SC3-GM116745), and to the NSF for an instrumentation grant to purchase our 600 MHz NMR spectrometer (CHE-1040134). KAC also thanks Dane Geddes-Buehre for assistance with the preparation of some protein samples for NMR. RA would like to thank the NIH for their generous funding through the BUILD PODER grant (8RL5GM118975-02) to CSUN that supported SP’s research.
References
- [1].Garrison MA, Crowhurst KA, NMR-monitored titration of acid-stress bacterial chaperone HdeA reveals that Asp and Glu charge neutralization produces a loosened dimer structure in preparation for protein unfolding and chaperone activation, Protein Sci, 23 (2014) 167–178. DOI: 10.1002/pro.2402. [DOI] [PMC free article] [PubMed] [Google Scholar]
- [2].Yu XC, Yang C, Ding J, Niu X, Hu Y, Jin C, Characterizations of the Interactions between Escherichia coli Periplasmic Chaperone HdeA and Its Native Substrates during Acid Stress, Biochemistry, 56 (2017) 5748–5757. DOI: 10.1021/acs.biochem.7b00724. [DOI] [PubMed] [Google Scholar]
- [3].Foster JW, Escherichia coli acid resistance: tales of an amateur acidophile, Nat Rev Microbiol, 2 (2004) 898–907. DOI: 10.1038/nrmicro1021. [DOI] [PubMed] [Google Scholar]
- [4].Richard H, Foster JW, Escherichia coli glutamate- and arginine-dependent acid resistance systems increase internal pH and reverse transmembrane potential, J Bacteriol, 186 (2004) 6032–6041. DOI: 10.1128/JB.186.18.6032-6041.2004. [DOI] [PMC free article] [PubMed] [Google Scholar]
- [5].Hong W, Wu YE, Fu X, Chang Z, Chaperone-dependent mechanisms for acid resistance in enteric bacteria, Trends Microbiol, 20 (2012) 328–335. DOI: 10.1016/j.tim.2012.03.001. [DOI] [PubMed] [Google Scholar]
- [6].Tucker DL, Tucker N, Conway T, Gene expression profiling of the pH response in Escherichia coli, J Bacteriol, 184 (2002) 6551–6558. DOI: 10.1128/jb.184.23.6551-6558.2002. [DOI] [PMC free article] [PubMed] [Google Scholar]
- [7].Pieper R, Zhang Q, Parmar PP, Huang ST, Clark DJ, Alami H, Donohue-Rolfe A, Fleischmann RD, Peterson SN, Tzipori S, The Shigella dysenteriae serotype 1 proteome, profiled in the host intestinal environment, reveals major metabolic modifications and increased expression of invasive proteins, Proteomics, 9 (2009) 5029–5045. DOI: 10.1002/pmic.200900196. [DOI] [PMC free article] [PubMed] [Google Scholar]
- [8].Waterman SR, Small PL, Identification of sigma S-dependent genes associated with the stationary-phase acid-resistance phenotype of Shigella flexneri, Molecular microbiology, 21 (1996) 925–940. DOI: 0.1046/j.1365–2958.1996.00058.x. [DOI] [PubMed] [Google Scholar]
- [9].Valderas MW, Alcantara RB, Baumgartner JE, Bellaire BH, Robertson GT, Ng WL, Richardson JM, Winkler ME, Roop RM 2nd, Role of HdeA in acid resistance and virulence in Brucella abortus 2308, Vet Microbiol, 107 (2005) 307–312. DOI: 10.1016/j.vetmic.2005.01.018. [DOI] [PubMed] [Google Scholar]
- [10].Malki A, Le HT, Milles S, Kern R, Caldas T, Abdallah J, Richarme G, Solubilization of protein aggregates by the acid stress chaperones HdeA and HdeB, J Biol Chem, 283 (2008) 13679–13687. DOI: 10.1074/jbc.M800869200. [DOI] [PubMed] [Google Scholar]
- [11].Yang F, Gustafson KR, Boyd MR, Wlodawer A, Crystal structure of Escherichia coli HdeA, Nat Struct Biol, 5 (1998) 763–764. DOI: 10.1038/1796. [DOI] [PubMed] [Google Scholar]
- [12].Gajiwala KS, Burley SK, HDEA, a periplasmic protein that supports acid resistance in pathogenic enteric bacteria, J Mol Biol, 295 (2000) 605–612. DOI: 10.1006/jmbi.1999.3347. [DOI] [PubMed] [Google Scholar]
- [13].Wu YE, Hong W, Liu C, Zhang L, Chang Z, Conserved amphiphilic feature is essential for periplasmic chaperone HdeA to support acid resistance in enteric bacteria, Biochem J, 412 (2008) 389–397. DOI: 10.1042/BJ20071682. [DOI] [PubMed] [Google Scholar]
- [14].Zhang BW, Brunetti L, Brooks CL 3rd, Probing pH-dependent dissociation of HdeA dimers, J Am Chem Soc, 133 (2011) 19393–19398. DOI: 10.1021/ja2060066. [DOI] [PMC free article] [PubMed] [Google Scholar]
- [15].Foit L, George JS, Zhang BW, Brooks CL 3rd, Bardwell JC, Chaperone activation by unfolding, Proc Natl Acad Sci U S A, 110 (2013) E1254–1262. DOI: 10.1073/pnas.1222458110. [DOI] [PMC free article] [PubMed] [Google Scholar]
- [16].Hong W, Jiao W, Hu J, Zhang J, Liu C, Fu X, Shen D, Xia B, Chang Z, Periplasmic protein HdeA exhibits chaperone-like activity exclusively within stomach pH range by transforming into disordered conformation, J Biol Chem, 280 (2005) 27029–27034. DOI: 10.1074/jbc.M503934200. [DOI] [PubMed] [Google Scholar]
- [17].Zhai Z, Wu Q, Zheng W, Liu M, Pielak GJ, Li C, Roles of structural plasticity in chaperone HdeA activity are revealed by 19F NMR, Chem Sci, 7 (2016) 2222–2228. DOI: 10.1039/c5sc04297f. [DOI] [PMC free article] [PubMed] [Google Scholar]
- [18].Salmon L, Stull F, Sayle S, Cato C, Akgul S, Foit L, Ahlstrom LS, Eisenmesser EZ, Al-Hashimi HM, Bardwell JCA, Horowitz S, The Mechanism of HdeA Unfolding and Chaperone Activation, J Mol Biol, 430 (2018) 33–40. DOI: 10.1016/j.jmb.2017.11.002. [DOI] [PMC free article] [PubMed] [Google Scholar]
- [19].Yu XC, Hu Y, Ding J, Li H, Jin C, Structural basis and mechanism of the unfolding-induced activation of HdeA, a bacterial acid response chaperone, J Biol Chem, 294 (2019) 3192–3206. DOI: 10.1074/jbc.RA118.006398. [DOI] [PMC free article] [PubMed] [Google Scholar]
- [20].Kim DE, Chivian D, Baker D, Protein structure prediction and analysis using the Robetta server, Nucleic Acids Res, 32 (2004) W526–531. DOI: 10.1093/nar/gkh468. [DOI] [PMC free article] [PubMed] [Google Scholar]
- [21].Sabri Dashti D, Meng Y, Roitberg AE, pH-replica exchange molecular dynamics in proteins using a discrete protonation method, J Phys Chem B, 116 (2012) 8805–8811. DOI: 10.1021/jp303385x. [DOI] [PMC free article] [PubMed] [Google Scholar]
- [22].Marsh JA, Singh VK, Jia Z, Forman-Kay JD, Sensitivity of secondary structure propensities to sequence differences between alpha- and gamma-synuclein: implications for fibrillation, Protein Sci, 15 (2006) 2795–2804. DOI: 10.1110/ps.062465306. [DOI] [PMC free article] [PubMed] [Google Scholar]
- [23].Crowhurst KA, 13C, 15N and 1H backbone and side chain chemical shift assignment of acid-stress bacterial chaperone HdeA at pH 6, Biomol NMR Assign, 8 (2014) 319–323. DOI: 10.1007/s12104-013-9508-0. [DOI] [PubMed] [Google Scholar]
- [24].Delaglio F, NMRPipe / NMRDraw, NMR Science, North Potomac, MD, 2018. [Google Scholar]
- [25].Delaglio F, Grzesiek S, Vuister GW, Zhu G, Pfeifer J, Bax A, NMRPipe: a multidimensional spectral processing system based on UNIX pipes, J Biomol NMR, 6 (1995) 277–293. DOI: 10.1007/bf00197809. [DOI] [PubMed] [Google Scholar]
- [26].Johnson BA, NMRViewJ, One Moon Scientific, Inc., Newark, NJ, 2016. [Google Scholar]
- [27].Johnson BA, Blevins RA, NMR View - A computer-program for the visualization and analysis of NMR data, J Biomol NMR, 4 (1994) 603–614. DOI: 10.1007/BF00404272. [DOI] [PubMed] [Google Scholar]
- [28].Panchal SC, Bhavesh NS, Hosur RV, Improved 3D triple resonance experiments, HNN and HN(C)N, for HN and 15N sequential correlations in (13C, 15N) labeled proteins: application to unfolded proteins, J Biomol NMR, 20 (2001) 135–147. DOI: 10.1023/A:1011239023422. [DOI] [PubMed] [Google Scholar]
- [29].Krezel A, Bal W, A formula for correlating pKa values determined in D2O and H2O, Journal of inorganic biochemistry, 98 (2004) 161–166. DOI: 10.1016/j.jinorgbio.2003.10.001. [DOI] [PubMed] [Google Scholar]
- [30].Schanda P, Kupce E, Brutscher B, SOFAST-HMQC experiments for recording two-dimensional heteronuclear correlation spectra of proteins within a few seconds, J Biomol NMR, 33 (2005) 199–211. DOI: 10.1007/s10858-005-4425-x. [DOI] [PubMed] [Google Scholar]
- [31].Bai Y, Milne JS, Mayne L, Englander SW, Primary structure effects on peptide group hydrogen exchange, Proteins, 17 (1993) 75–86. DOI: 10.1002/prot.340170110. [DOI] [PMC free article] [PubMed] [Google Scholar]
- [32].Case DA, Cheatham TE 3rd, Darden T, Gohlke H, Luo R, Merz KM Jr., Onufriev A, Simmerling C, Wang B, Woods RJ, The Amber biomolecular simulation programs, J Comput Chem, 26 (2005) 1668–1688. DOI: 10.1002/jcc.20290. [DOI] [PMC free article] [PubMed] [Google Scholar]
- [33].Maier JA, Martinez C, Kasavajhala K, Wickstrom L, Hauser KE, Simmerling C, ff14SB: Improving the Accuracy of Protein Side Chain and Backbone Parameters from ff99SB, J Chem Theory Comput, 11 (2015) 3696–3713. DOI: 10.1021/acs.jctc.5b00255. [DOI] [PMC free article] [PubMed] [Google Scholar]
- [34].Jorgensen WL, Chandrasekhar J, Madura JD, Impey RW, Klein ML, Comparison of Simple Potential Functions for Simulating Liquid Water, J Chem Phys, 79 (1983) 926–935. DOI: Doi 10.1063/1.445869. [DOI] [Google Scholar]
- [35].Krivov GG, Shapovalov MV, Dunbrack RL Jr., Improved prediction of protein side-chain conformations with SCWRL4, Proteins, 77 (2009) 778–795. DOI: 10.1002/prot.22488. [DOI] [PMC free article] [PubMed] [Google Scholar]
- [36].Mongan J, Case DA, McCammon JA, Constant pH molecular dynamics in generalized Born implicit solvent, J Comput Chem, 25 (2004) 2038–2048. DOI: 10.1002/jcc.20139. [DOI] [PubMed] [Google Scholar]
- [37].Khandogin J, Brooks CL 3rd, Constant pH molecular dynamics with proton tautomerism, Biophys J, 89 (2005) 141–157. DOI: 10.1529/biophysj.105.061341. [DOI] [PMC free article] [PubMed] [Google Scholar]
- [38].Hornak V, Abel R, Okur A, Strockbine B, Roitberg A, Simmerling C, Comparison of multiple Amber force fields and development of improved protein backbone parameters, Proteins, 65 (2006) 712–725. DOI: 10.1002/prot.21123. [DOI] [PMC free article] [PubMed] [Google Scholar]
- [39].Roe DR, Cheatham TE 3rd, PTRAJ and CPPTRAJ: Software for Processing and Analysis of Molecular Dynamics Trajectory Data, J Chem Theory Comput, 9 (2013) 3084–3095. DOI: 10.1021/ct400341p. [DOI] [PubMed] [Google Scholar]
- [40].Kabsch W, Sander C, Dictionary of protein secondary structure: pattern recognition of hydrogen-bonded and geometrical features, Biopolymers, 22 (1983) 2577–2637. DOI: 10.1002/bip.360221211. [DOI] [PubMed] [Google Scholar]
- [41].Touw WG, Baakman C, Black J, te Beek TA, Krieger E, Joosten RP, Vriend G, A series of PDB-related databanks for everyday needs, Nucleic Acids Res, 43 (2015) D364–368. DOI: 10.1093/nar/gku1028. [DOI] [PMC free article] [PubMed] [Google Scholar]
Associated Data
This section collects any data citations, data availability statements, or supplementary materials included in this article.