

Abstract
Although the anterior temporal lobe (ATL) comprises several anatomic and functional subdivisions, it is often reduced to a homogeneous theoretical entity, such as a domain-general convergence zone, or “hub,” for semantic information. Methodological limitations are largely to blame for the imprecise mapping of function to structure in the ATL. There are two major obstacles to using fMRI to identify the precise functional organization of the ATL: the difficult choice of stimuli and tasks to activate, and dissociate, specific regions within the ATL; and poor signal quality because of magnetic field distortions near the sinuses. To circumvent these difficulties, we developed a data-driven parcellation routine using resting-state fMRI data (24 females, 64 males) acquired using a sequence that was optimized to enhance signal in the ATL. Focusing on patterns of functional connectivity between each ATL voxel and the rest of the brain, we found that the ATL comprises at least 34 distinct functional parcels that are arranged into bands along the lateral and ventral cortical surfaces, extending from the posterior temporal lobes into the temporal poles. In addition, the anterior region of the fusiform gyrus, most often cited as the location of the semantic hub, was found to be part of a domain-specific network associated with face and social processing, rather than a domain-general semantic hub. These findings offer a fine-grained functional map of the ATL and offer an initial step toward using more precise language to describe the locations of functional responses in this heterogeneous region of human cortex.
SIGNIFICANCE STATEMENT The functional role of the anterior aspects of the temporal lobes (ATL) is a contentious issue. While it is likely that different regions within the ATL subserve unique cognitive functions, most studies revert to vaguely referring to particular functional regions as “the ATL,” and, thus, the mapping of function to anatomy remains unclear. We used resting-state fMRI connectivity patterns between the ATL and the rest of the brain to reveal that the ATL comprises at least 34 distinct functional parcels that are organized into a three-level functional hierarchy. These results provide a detailed functional map of the anterior temporal lobes that can guide future research on how distinct regions within the ATL support diverse cognitive functions.
Keywords: anterior temporal lobe, concepts, cortical parcellation, language, resting-state fMRI, semantic memory
Introduction
Anatomical and functional brain imaging studies have documented that the most anterior aspects of the temporal lobes [commonly referred to as the anterior temporal lobe (ATL)] are composed of multiple subdivisions (Brodmann, 1909; Ding et al., 2009; Pascual et al., 2015; Glasser et al., 2016). Consistent with this view, there is now considerable evidence that different regions within the ATL appear to support different functions, although their precise anatomic locations remain to be determined. For example, the anterior aspects of the superior temporal gyrus have been associated with social and emotional processes (Olson et al., 2007; Zahn et al., 2007; Simmons et al., 2010; Mellem et al., 2016; Wang et al., 2017), while anterior regions of the fusiform gyrus have been associated with representing abstract properties of objects (Peelen and Caramazza, 2012; Malone et al., 2016), and the temporal poles have been linked to representing and naming unique entities (Grabowski et al., 2001; Damasio et al., 2004; Mesulam et al., 2013). In addition, it has been argued that the anterior region of the fusiform gyri acts as a domain-general hub for all semantic knowledge (Mion et al., 2010; Lambon Ralph, 2013; Hoffman et al., 2014; Binney et al., 2016). However, the exact location of this purported “semantic hub” has migrated considerably over the years, ranging from the temporal poles (Patterson et al., 2007), to nearly 5 cm posterior to the poles (Mion et al., 2010), to its current location in the anterior aspects of the fusiform gyri (Lambon Ralph, 2013; Hoffman et al., 2014; Binney et al., 2016). Thus, while each of the above studies suggests that different regions within the ATL may subserve unique functions, they all revert to vaguely referring to particular functional regions as the ATL, and the mapping of function to anatomy remains unclear.
Although functional magnetic resonance imaging (fMRI) provides adequately high spatial resolution for finding fine-grained functional subdivisions within the ATL, two major obstacles have hampered this effort. One obstacle is the poor temporal signal-to-noise ratio (tSNR) in this area, particularly in its most ventral and anterior aspects that lie adjacent to the sphenoidal sinuses (Devlin et al., 2000; De Panfilis and Schwarzbauer, 2005; Axelrod and Yovel, 2013). Indeed, previous attempts to use resting-state fMRI (rs-fMRI) to find functional parcellations across the whole brain leave the most ventral, medial, and anterior parts of the temporal lobe ill defined because of poor tSNR in this area (Power et al., 2011; Yeo et al., 2011; Glasser et al., 2016). A second, but not lesser, problem is that we lack a clear idea of which experimental paradigms, stimuli, and tasks will evoke dissociable responses in the ATL. Indeed, the inconsistencies found across the empirical findings that do suggest functional dissociations within the ATL may be due, in part, to the complex response profiles found in this area of the brain (Olson et al., 2007; Simmons and Martin, 2009; Bonner and Price, 2013). Therefore, the challenge of eliciting dissociable functional responses in the ATL is not one of poor signal quality alone, but also of using the proper methods, tasks, and stimuli in fMRI experiments.
A solution to the latter problem is to use rs-fMRI to reveal functionally relevant patterns of activity covariance between brain regions at rest. In this study, we developed a rigorous, data-driven rs-fMRI approach to parcellate the ATL in 88 adult participants. Our rs-fMRI approach combines an fMRI acquisition sequence that is optimized to enhance tSNR in the ATL with a data-driven parcellation method that focuses on correlations between voxels in the ATL with voxels in the rest of the brain. Our approach intrinsically incorporates stability and replicability of the parcellation by keeping only network distinctions that agree across halves of the data over multiple random iterations. After identifying distinct functional parcels within the ATL, we examined the hierarchical organization of the parcels and the distinct patterns of connectivity between each parcel and whole-brain functional networks.
Materials and Methods
Experimental design
Participants.
Eighty-eight individuals with no history of psychiatric or neurologic disorders [mean (SD) age, 21.2 years (7.6 years); 24 females] participated in the experiment. Subsets of the resting-state data from these individuals have been used in a number of our previous studies (Gotts et al., 2012; Ramot et al., 2017; Jasmin et al., 2019; Power et al., 2019). All participants gave informed consent under a National Institutes of Health Institutional Review Board-approved protocol (10M-0027; clinical trial #NCT01031407).
MRI data acquisition.
Scanning was completed on a Signa HDxt 3.0 T scanner (GE Healthcare) at the National Institutes of Health Clinical Center NMR Research Facility. For each participant, T2*-weighted blood oxygen level-dependent images covering the whole brain were acquired using an eight-channel receive-only head coil and a gradient echo single-shot echoplanar imaging (EPI) sequence [repetition time (TR) = 3500 ms; echo time = 27 ms; flip angle = 90°; 42 axial contiguous interleaved slices per volume; 3.0 mm slice thickness; field of view (FOV) = 22 cm; 128 × 128 acquisition matrix; single-voxel volume = 1.7 × 1.7 × 3.0 mm3]. An acceleration factor of 2 (ASSET) was used to reduce gradient coil heating during the session. This acquisition has been used in a number of our previous studies where we documented its success in imaging the ATL (Simmons et al., 2010; Gotts et al., 2012). Indeed, when compared with data from a well known resting-state parcellation (Yeo et al., 2011), this optimized acquisition resulted in significantly stronger tSNR in the anterior temporal lobes (Fig. 1). In addition to the functional images, a high-resolution T1-weighted anatomic image [magnetization-prepared rapid acquisition gradient echo (MPRAGE)] was obtained (124 axial slices; 1.2 mm slice thickness; FOV = 24 cm; 224 × 224 acquisition matrix).
Figure 1.
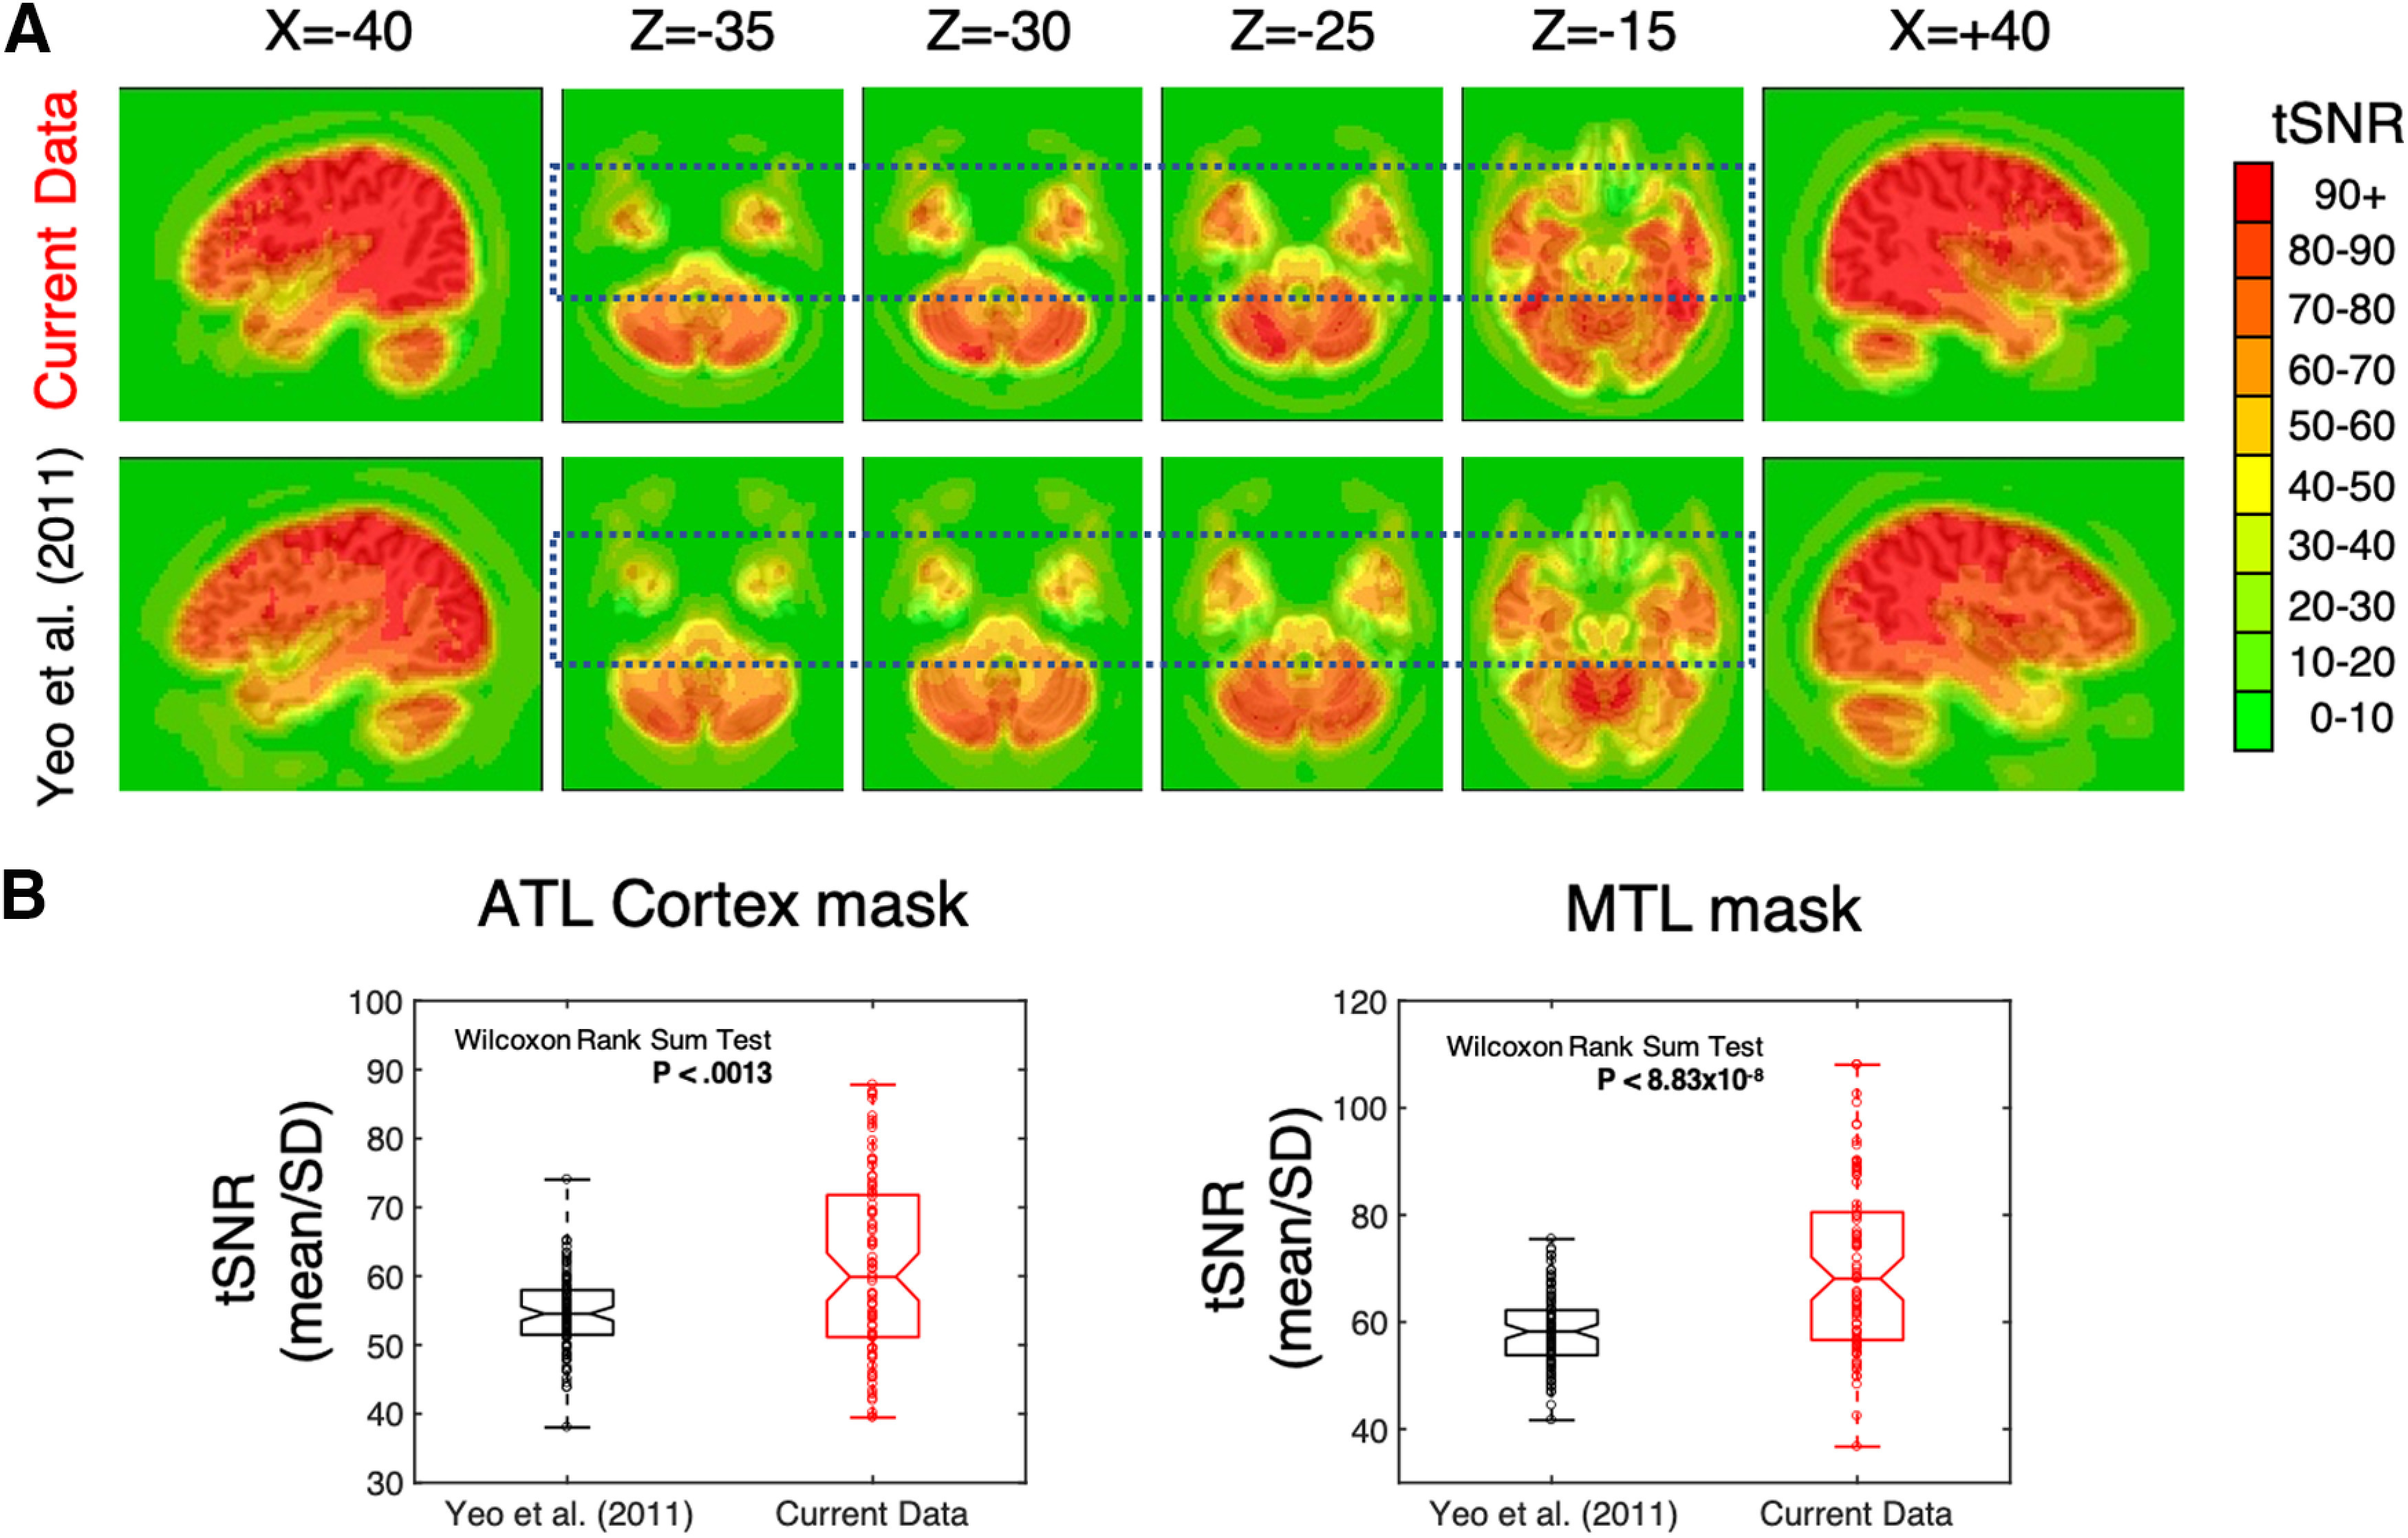
Improved tSNR in the ATL and MTL masks. We compared the tSNR in our data (N = 88) to a representative subset of the data used in the Yeo et al. (2011) parcellation study (N = 100). To do so, we downloaded the data used by Yeo et al. (2011; i.e., from the FCON1000 dataset) and processed them in the same way that we did our data (i.e., using 3dDespike, 3dTshift, and 3dvolreg in AFNI). Next, in each dataset, we calculated the tSNR in each voxel (i.e., time series mean divided by time series SD). Finally, we warped the tSNR maps to Talairach space and resampled the voxels to 2 mm3. A, The average tSNR in the ATL is stronger in our data (top) compared with that in the Yeo et al. (2011) study (bottom). The dashed rectangles outline the ATL region in both datasets. B, The average tSNR in each participant from the ATL and MTL masks, respectively, in both studies. The tSNR values in our data were significantly greater than those in the Yeo et al. (2011) data in both masks. In the box plots, each circle is a datapoint and the outermost horizontal lines represent the minimum and maximum values. The center line in each box plot represents the median, while the bottom and top lines of the boxes represent the 25th and 75th percentiles. The boundaries of the horizontal notches inside the 25th and 75th percentiles depict the 95% confidence limits of the median.
Procedure.
During the resting scans, participants were instructed to relax and keep their eyes fixated on a central cross. Each resting scan lasted 8 min and 10 s for a total of 140 consecutive whole-brain volumes. Independent measures of cardiac and respiratory cycles were recorded during scanning for later artifact removal.
Data preprocessing.
All data were preprocessed using the AFNI software package (Cox, 1996). First, the initial three TRs from each EPI scan were removed to allow for T1 equilibration. Next, 3dDespike was used to bound outlying time points in each voxel within 4 SDs of the time series mean, and 3dTshift was used to adjust for slice acquisition time within each volume (to t = 0). 3dvolreg was then used to align each volume of the resting-state scan series to the first retained volume of the scan. White matter and large ventricle masks were created from the aligned MPRAGE scan using Freesurfer (Fischl et al., 2002). These masks were then resampled to EPI resolution, eroded by 1 voxel to prevent partial volume effects with gray matter voxels, and applied to the volume-registered data to generate white matter and ventricle nuisance regressors before spatial blurring. Scans were then spatially blurred by a 6 mm Gaussian kernel (full-width at half-maximum) and divided by the voxelwise time series mean to yield units of percentage signal change.
The data were denoised using the ANATICOR preprocessing approach (Jo et al., 2010). Nuisance regressors for each voxel included the following: six head-position parameter time series (three translation, three rotation), one average eroded ventricle time series, one “localized” eroded white matter time series (averaging the time series of all white matter voxels within a 15-mm-radius sphere), eight RETROICOR time series (four cardiac, four respiration) calculated from the cardiac and respiratory measures taken during the scan (Glover et al., 2000), and five respiration volume per time series to minimize end-tidal CO2 effects from deep breaths (Birn et al., 2008). All regressors were detrended with a fourth-order polynomial before denoising, and the same detrending was applied during nuisance regression to the voxel time series. Finally, the residual time series were spatially transformed to standard anatomic space (Talairach–Tournoux) at both 2 and 6 mm3 isotropic resolutions for computational speed in later analyses.
Statistical analysis
Parcellation.
Our goal was to parcellate the anterior temporal lobes based on the connectivity patterns between ATL voxels and voxels in the rest of the brain. To ensure that the boundaries between parcels were stable, we required that they replicate across halves of the data over several random assignments. The overall approach of the data analysis involved 10 iterations of randomly splitting the participants into halves, calculating the average ATL-to-non-ATL functional connectivity matrices in each group at a range of thresholds, then parcellating the matrices into modules and quantifying the repeatability of the parcellations across the groups at each threshold. The results from each iteration were then combined, and the parcellation was evaluated. To accomplish this, we made masks of the cortical ATL voxels, subcortical ATL voxels (i.e., the hippocampus and amygdala), and non-ATL voxels (all cortical voxels outside of the ATL masks) using the Freesurfer cortical and subcortical segmentations (Fig. 2A; Filipek et al., 1994; Fischl et al., 2004). The cortical ATL mask covered the anterior temporal lobe cortex from the anterior tip of the temporal pole back to the Talairach coordinate, y = −35. The posterior cutoff of y = −35 was chosen to ensure that our ATL mask included the anterior portion of the fusiform gyrus that has been discussed as a possible domain-general semantic hub (Mion et al., 2010; Lambon Ralph, 2013). Voxels with poor tSNRs (<10) and prominent blood vessel signal (identified from an SD map of the volume registered EPI data; Kalcher et al., 2015) were removed from the masks. The cortical masks (ATL and non-ATL) were then downsampled to 6-mm3-resolution to speed up analysis run times, while the subcortical mask remained at 2 mm3, because of its much smaller starting volume.
Figure 2.
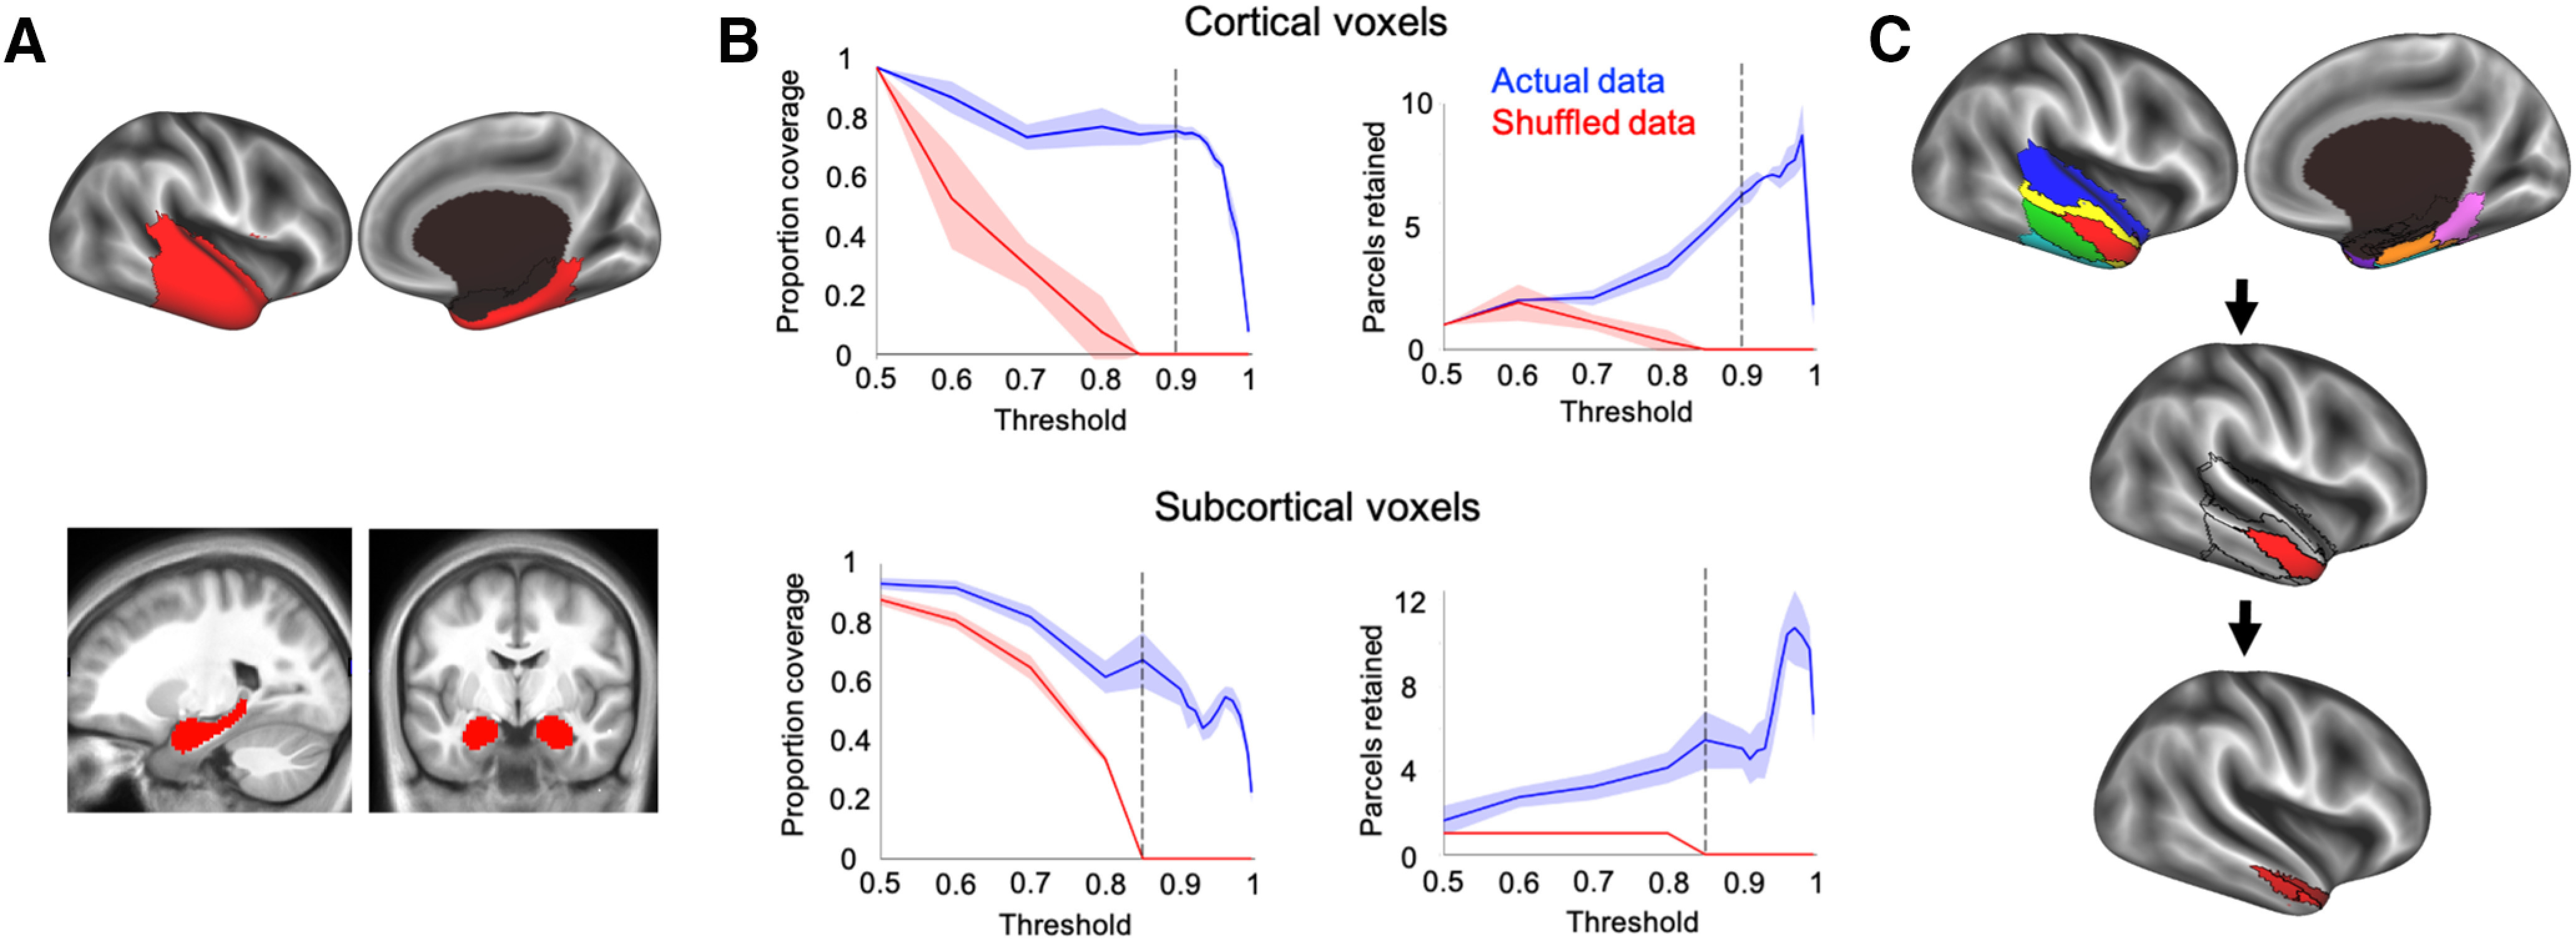
The initial parcellation routine. A, The first iteration of the parcellation focused on the cortical (top) and subcortical (bottom) masks separately. The cortical mask extended from the anterior tip of the temporal pole back to the Talairach coordinate, y = −35. The subcortical mask included the hippocampus and amygdala. B, The agreement curves were constructed across thresholds, picking the threshold that maximized split-half agreement and the number of detected networks (separately for cortical and subcortical masks). After 10 iterations, one average parcellation of the retained networks was formed, keeping any network that occurred in at least 50% of iterations. The split-half agreement and number of detected networks were jointly optimized at the 90% threshold in the cortical mask (top) and at the 85% threshold for the subcortical mask (bottom). The error in the line plots represents ±1 SEM. C, After the first pass of the InfoMap algorithm, the ATL was divided into eight bilateral parcels (top). We then ran the same parcellation routine on each of the eight parcels, in turn, to further fractionate each parcel (middle and bottom).
We searched for functional parcels within the ATL using the InfoMap clustering algorithm (Rosvall and Bergstrom, 2008, 2011). On each of 10 iterations, the 88 participants were randomly split in half and group-average correlation matrices between ATL and non-ATL voxels were calculated for each half of data (separately for the cortical ATL and subcortical voxels with the non-ATL voxels). These matrices were made square by correlating each column of the non-ATL × cortical ATL (or subcortical ATL) matrix with themselves. The real-valued correlation matrices were then thresholded into binary (0 or 1) undirected matrices at a range of threshold values (top percentages of connections: 50, 60, 70, 80, 85, 90, 91, 92, 93, 94, 95, 96, 97, 98, 99, and 99.5%). The thresholded matrices of each half were then clustered using the InfoMap algorithm to form optimal two-level partitions (i.e., the optimal solution found on 100 searches). Parcels were counted as replicating across halves on each iteration if the Dice coefficient, namely twice the volume of the intersection divided by the sum of the volumes in each half [(2*|X∩Y|)/(|X|+|Y|)], was >0.5, and the volume of the intersection was at least 2% of the size of the cortical or subcortical ATL mask, respectively (retaining the intersection of the two data halves). After repeating the above steps for each of the 10 iterations, one average parcellation of the retained parcels was formed, keeping voxels from any parcel that co-occurred in ≥50% of the iterations. Agreement curves were constructed across thresholds, and the threshold with the maximal split-half agreement and number of detected parcels (separately for cortical and subcortical ATL) was identified. We found that the split-half agreement and the number of detected parcels were jointly optimized at the 90% threshold in the cortical ATL mask and at the 85% threshold for the subcortical ATL mask (Fig. 2B), resulting in five cortical, and three subcortical, parcels. The detected parcels at the optimized thresholds in both the cortical and subcortical ATL masks were then assigned to each voxel in the original 2 mm3 ATL mask (including both cortical and subcortical parcellations) using a best-match criterion. Specifically, for each detected parcel, the average pattern of functional connectivity in the non-ATL mask was calculated with the corresponding ATL voxels. The pattern of functional connectivity between each ATL voxel and the non-ATL voxels was then compared with those of all of the detected parcels, assigning the parcel with the most similar pattern (Pearson correlation) to that voxel, provided the best match was within a threshold level of similarity (R2 > 0.5; i.e., the winning parcel pattern shared at least 50% of the variance with that of the voxel).
Since the cortical and subcortical voxels were combined before assigning a final parcel label to each voxel, cortical voxels could, in principle, be labeled as belonging to a “subcortical” parcel, and vice versa, according to the best-match criterion. The final parcellation contained an additional parcel that corresponded to poor tSNR voxels in the most ventral slice of the data acquisition. This presumed “noise” parcel was removed from the parcellation before further data analyses. Next, we ran a second iteration of the InfoMap algorithm on each of the eight parcels separately (Fig. 2C). Refocusing the size of the parcellation space to treat each of the eight initial parcels as smaller cohorts magnified the functional differences within each parcel, thus allowing the parcellation algorithm to detect more fine-grained differences between the voxels in each ATL parcel (Rosvall and Bergstrom, 2008). Within each parcel, we completed the same split-half routine that was used on the entire ATL mask in the first iteration and then combined the parcels in the same way (described above). We did not run a third iteration of the parcellation routine because the search space for each parcellation at this stage was too small to obtain reliable results that survived our requirements for replication across halves of the data. Therefore, the results from the second iteration of our parcellation represent the most fine-grained map obtainable using our method with the current data.
ATL-to-whole-brain connectivity analysis.
The connectivity between a particular ATL parcel and each voxel across the whole brain was identified through correlation analyses and statistical comparisons. First, in each participant, we correlated each voxel time series in the whole brain with the average time series of each of the 34 ATL parcels. We then used a winner-take-all approach, in which a voxel was labeled as preferentially connected to an ATL parcel if (1) the correlation coefficient was greater than the correlation between that voxel and all other parcels, (2) the maximum correlation value was >0.25, and (3) the maximum correlation was >2 SDs above the mean of all correlation values in that voxel. Second, we compared the whole-brain connectivity patterns between selected pairs of ATL parcels by calculating the correlation between the time series from each parcel and whole-brain voxels across participants, then by z scoring the correlation coefficients and using a paired-sample t test across participants in each voxel. We then corrected each parcel connectivity map for the number of whole-brain comparisons performed using false discovery rate (FDR; q < 0.001, p < 0.001), resulting in a whole-brain map of preferred connectivity to each parcel in the pair. See Figure 5B for the results of a pairwise comparison of the connectivity patterns from parcels that overlap the anterior and posterior hippocampi, respectively. We also compared a parcel that overlaps the bilateral anterior fusiform gyrus at the MNI y-coordinates that have been reported as candidate locations of the domain-general semantic hub in the anterior fusiform gyrus [y = −26 (Mion et al., 2010); y = −21 (Binney et al., 2016)] with a parcel that overlaps the parahippocampal gyrus. See Figure 6 for the results, which are displayed along with the outlines of functionally defined face-selective and scene-selective cortical regions of interest (ROIs). These ROIs were adopted from a previously published study that used functional localizers and an algorithmic, group-based method to define category-selective ROIs (Julian et al., 2012).
Figure 5.

Parcellation of the hippocampus and amygdala. A, The parcellation within the medial temporal masks separated the amygdala (purple) from the hippocampus and further divided the hippocampus into head (orange), body (magenta), and tail (pink). The brown parcel overlaps mostly rhinal cortex and inferolateral hippocampus. B, The differential connectivity patterns from the head (orange) and tail (pink) of the hippocampus displayed on the inflated cortical surface (the parcels are visible in the volume in A).
Figure 6.

Differential connectivity between the anterior fusiform gyrus and parahippocampal gyrus. A, A coronal view in the volume (y = −35) of the parcels that overlap the anterior fusiform gyrus (FG; teal) and parahippocampal gyrus (PHG; purple), respectively. B, The differential connectivity patterns from the FG and PHG displayed on the inflated cortical surface (the parcels are outlined with dotted lines and labeled). C, The connectivity patterns from each parcel displayed on the flattened cortex with face-selective and scene-selective regions outlined in solid black (the ATL parcels are outlined with dotted lines). The connectivity pattern from the FG parcel overlapped with face-selective ROIs, while the connectivity pattern from the PHG parcel overlapped scene-selective ROIs. The category-selective ROIs were defined in a separate study using functional localizers and an algorithmic, group-based method for defining regions of interest (Julian et al., 2012).
Hierarchical clustering.
Hierarchical relationships among the 34 detected parcels were examined using k-means cluster analyses with an approach tantamount to an inversion of the parcellation procedure. The average pattern of functional connectivity between each detected ATL parcel and the non-ATL voxels was entered as a column in a parcel prototype matrix (with rows as non-ATL voxels and detected parcels as columns). This prototype matrix was then converted into a square 34 × 34 matrix by correlating it with itself, thus representing the correlation among all possible combinations of parcel prototypes. The square prototype correlation matrix was iteratively analyzed with k-means cluster analysis at progressively larger numbers of clusters (k), and each choice of k was repeated 100 times for stability. The above k-means clustering routine was first performed on randomly assigned halves of the data over 10 iterations to generate an agreement curve across k clusters. The split-half agreement was used to identify local maxima in the agreement across halves. Next, we ran the k-means clustering routine again on the full dataset and evaluated the clustering at the points of local maxima (i.e., k = 8) in the split-half agreement curve. We then compared the k clustering to the results from the first iteration of the InfoMap parcellation, which resulted in eight parcels, to determine the structure of the hierarchy in the ATL parcels. Since the k = 8 solution was consistent with the results from the first iteration of our parcellation routine (see Results), we treated that parcellation as the intermediate level of the hierarchy. We then ran the k-means clustering routine on the eight clusters of the intermediate level to obtain the upper level of the hierarchy. Specifically, we entered the average pattern of functional connectivity between each of the eight clusters and the non-ATL voxels as a column in a cluster prototype matrix (with rows as non-ATL voxels and clusters as columns). This prototype matrix was then converted into a square 8 × 8 matrix by correlating it with itself. The square prototype correlation matrix was iteratively analyzed with k-means cluster analysis at progressively larger numbers of clusters, and each choice of k was repeated 100 times for stability. In addition to the k-means approach, we evaluated the 8 × 8 matrix using hierarchical clustering. To do so, the square network prototype correlation matrix was converted to Euclidean distances using the MATLAB pdist function and then submitted to hierarchical clustering analysis using the MATLAB linkage function. Results were then viewed as dendrograms. We first confirmed that the hierarchical clustering solution was stable by splitting the data in half and comparing the dendrograms from each random half. After confirming that the dendrogram was indeed stable across the halves of data, we created a dendrogram using the full dataset (which matched the results of the individual halves).
The connectivity patterns between the upper levels of the hierarchy (i.e., clusters) and voxels across the whole brain were identified using a partial correlation analysis. In each participant, we calculated the correlation between each voxel time series in the whole brain and the average time series from each ATL cluster in a particular level of the hierarchy, while partialling time series from the remaining clusters at the same level. This resulted in all voxels being given a connectivity value for each cluster that reflected the unique variance explained by each cluster. We then transformed the coefficients using the Fisher z transform and used paired-sample t tests to compare the connectivity value of each cluster against zero in each voxel across participants. We then corrected each cluster connectivity map using the FDR (q < 0.001, p < 0.001). Finally, the thresholded whole-brain maps for each cluster were directly compared with each other using paired t tests. A voxel was labeled as selectively connected to the cluster that explained significantly more variance than all of the other clusters in that voxel (FDR: q < 0.001, p < 0.001 for all comparisons).
Data availability
Data and code used to parcellate the ATL are publicly available online at Figshare.
Results
The resting-state parcellation of the ATL reveals 34 distinct functional regions
The first step in our analysis was to identify the highest number of unique functional parcels within the ATL based on the intrinsic connectivity between voxels in the ATL and voxels in the rest of the brain. After optimizing the split-half agreement and the number of detected parcels in the subcortical and cortical ATL masks separately (Fig. 2B), we identified eight large bilateral functional parcels (Fig. 2C). Next, we treated each parcel as a smaller unique cohort of voxels and repeated the parcellation scheme on each of the eight parcels separately (Fig. 2C). We again optimized the split-half agreement and the number of detected parcels in each of the eight original parcels separately to ensure that the boundaries between the new parcels were stable. All together, we identified 34 distinct functional parcels within the ATL cortex, hippocampus, and amygdala (Fig. 3). Since each ATL parcel was identified by its unique pattern of connectivity to voxels outside of the ATL, examining these patterns of connectivity can provide a more complete picture of how the ATL parcels are situated within functional networks and thus provide a clue to the function of each parcel. Therefore, we examined the functional connectivity between each of the 34 ATL parcels and voxels across the whole brain using a winner-take-all approach. The whole-brain connectivity map displays an orderly mosaic of functional networks across the cortex (Fig. 4). In the next section, we present an analysis that focuses on the connectivity between particular parcels and the rest of the brain.
Figure 3.

The parcellation of the ATL results in 34 distinct functional parcels. The ATL was divided into 34 parcels based on the patterns of functional connectivity between voxels in the ATL and the rest of the brain. The flat maps in the bottom panel are labeled to orient the reader. V1, primary visual cortex; A1, primary auditory cortex; Pole, temporal pole.
Figure 4.

Connectivity between the ATL parcels and the rest of the brain. The whole-brain connectivity map was derived from the winner-take-all analysis, in which the 34 ATL parcels (outlined in black) were treated as seeds and each voxel across the brain was labeled as preferentially connected to an ATL parcel if (1) the correlation coefficient was greater than the correlation between that voxel and all other parcels, (2) the maximum correlation value was >0.25, and (3) the maximum correlation was >2 SDs above the mean of all correlation values in that voxel.
In addition to the cortical ATL mask, we also included the amygdala and hippocampus in our parcellation (Fig. 2A). In addition to the contribution of these medial temporal masks to our parcellation of the cortex, we were able to identify functional parcels within the medial temporal structures themselves. Specifically, five parcels overlapped the amygdala and hippocampus. These five parcels separated the amygdala from the hippocampus and further divided the hippocampus into tail, body, and head (Fig. 5A). The divisions within the hippocampus are consistent with an anterior-to-posterior functional gradient within the hippocampus, often referred to as “long-axis specialization” (Fanselow and Dong, 2010; Ranganath and Ritchey, 2012; Nadel et al., 2013; Poppenk et al., 2013; Sekeres et al., 2018; Grady, 2020).
Differential connectivity between specific ATL parcels
To further examine how the parcels relate to known functional brain networks, we compared the connectivity patterns between two pairs of parcels in turn. The first pair of parcels we chose to compare are bilateral and overlap the anterior (i.e., head) and posterior (i.e., tail) hippocampus, respectively (Fig. 5A). We chose these parcels to serve as a proof of concept for using this analysis strategy to understand the functions of particular parcels because functional dissociations between the anterior and posterior hippocampi have been widely reported in prior studies (for review, see Fanselow and Dong, 2010; Ranganath and Ritchey, 2012; Nadel et al., 2013; Poppenk et al., 2013; Sekeres et al., 2018; Grady, 2020). Consistent with prior research, we found that the anterior hippocampus is more connected to regions involved in social and emotional processing (Fanselow and Dong, 2010; Gotts et al., 2012), such as the amygdala (Adolphs, 2010), the medial and ventromedial prefrontal cortices (Carmichael and Price, 1995; Frith, 2007), and the anterior aspects of the superior and middle temporal gyri (Olson et al., 2007; Saleem et al., 2008; Simmons and Martin, 2009; Simmons et al., 2010; Mellem et al., 2016; Fig. 5B, orange). By contrast, the posterior hippocampus is more connected to regions that represent specific episodic details, such as people, actions, places, and objects (Gilmore et al., 2021a,b; Grady, 2020). Such regions are often referred to as “high-level visual cortex” and are located in the ventral and lateral occipitotemporal cortex and the posterior parietal cortex (Culham and Valyear, 2006; Martin, 2007, 2016; Kanwisher and Dilks, 2013; Fig. 5B, pink). The pattern of differential connectivity between the anterior and posterior hippocampal parcels is also consistent with an anterior-to-posterior gradient from coarse (gist) to fine-grained representations of spatial details (Poppenk et al., 2013; Brunec et al., 2018; Sekeres et al., 2018). Therefore, the differential connectivity patterns between the anterior and posterior hippocampal parcels are consistent with the large body of existing research on the anterior-to-posterior functional gradient within the hippocampus, thus demonstrating the potential utility of our method for uncovering the functions of particular parcels in anterior temporal cortex.
Next, we used the same pairwise comparison method to test the following two competing theories about the function of the anterior fusiform gyrus: one theory claims that a functional region overlapping the anterior fusiform gyrus is a domain-specific face processor for representing individual identity (e.g., recognizing famous faces; Sergent et al., 1992; Moscovitch et al., 1997; Kuskowski and Pardo, 1999; Collins and Olson, 2014; Duchaine and Yovel, 2015); while the other theory claims that the bilateral anterior fusiform gyrus is a domain-general semantic hub (Mion et al., 2010; Lambon Ralph, 2013; Hoffman et al., 2014; Binney et al., 2016). Specifically, we compared the connectivity patterns between the parcel that overlaps the bilateral anterior fusiform gyrus and another that overlaps the bilateral posterior parahippocampal gyrus (Fig. 6). We chose to contrast the anterior fusiform gyrus with the parahippocampal parcel because parahippocampal cortex is known to be scene selective (Aguirre et al., 1998; Epstein and Kanwisher, 1998). If the anterior fusiform gyrus is a domain-general semantic hub, then this region should show massive connectivity throughout the cortex to support the claim of a convergence zone for all semantic information—especially to modality-specific regions (as predicted by the hub and spoke model; Patterson et al., 2007; Lambon Ralph et al., 2010; Pobric et al., 2010; Hoffman and Lambon Ralph, 2011). In contrast, if the anterior fusiform is a domain-specific face processor, then it should be preferentially connected to face-selective regions and likely to the social cognition network as well when compared with the parahippocampal parcel. By contrast, the parahippocampal parcel should be preferentially connected to the visual scene-processing system. Consistent with the anterior fusiform gyrus being a domain-specific face processor, we found that it is indeed preferentially connected to regions involved in face processing, such as the fusiform face area (FFA) and occipital face area (OFA; Kanwisher and Barton, 2011; Duchaine and Yovel, 2015; Ramot et al., 2019), and social cognition, such as the medial and ventromedial prefrontal cortex and the anterior aspects of the superior and middle temporal gyri (Frith and Frith, 2007; Olson et al., 2007; Adolphs, 2010; Simmons et al., 2010; Gotts et al., 2012; Fig. 6B,C, teal). Also as predicted, the parahippocampal parcel is preferentially connected to regions that overlap with the scene-selective cortical (Baldassano et al., 2013; Epstein and Baker, 2019), such as the parahippocampal place area& (PPA), retrosplenial complex (RSC), also known as the middle place area (Silson et al., 2016), and occipital place area (OPA; Fig. 6B,C, purple). These results suggest that the anterior fusiform gyrus is a domain-specific face processor rather than a domain-general semantic hub.
The hierarchical organization within the ATL
The initial parcellation of the ATL resulted in eight parcels that were then further fractionated into 34 functional parcels; thus, we asked whether functional areas in the ATL are hierarchically organized into at least two levels. We confirmed that the initial 8 parcels represent an upper level of a functional hierarchy in the ATL, while the 34 parcels are the bottom of the hierarchy, using k-means clustering and a split-half analysis approach similar to the one described above. Specifically, we split the data in half across 10 random assignments and created a 34 × 34 correlation matrix based on the connectivity profiles from the 34 parcels to the rest of the brain in each half of the data. We then compared the k-means solution in each half of the data and found a local maximum of agreement in the k-means curves at k = 8 clusters (Fig. 7A). Next, we examined the full dataset using k-means and found that the k = 8 cluster solution explained ∼90% of the variance and that it agreed well with the original eight parcels found in the first iteration of the parcellation algorithm (i.e., 85% of the parcels (29 of 34) from the k-means solution were clustered in accordance with the original eight parcels). Therefore, we concluded that the eight parcels from the first iteration of our parcellation routine correspond to an upper level of a functional hierarchy in the ATL.
Figure 7.

The hierarchical organization of the ATL. A, The k-means clustering on separate halves of the data over multiple random assignments revealed a local maximum of agreement in the k-means curves at approximately k = 8 clusters (left). The graph on the right displays the same data represented as the difference between the actual and shuffled data. The dotted line in each graph highlights the local maximum at k = 8. B, We then ran k-means and hierarchical clustering on the eight parcels and found that they could be further grouped into four clusters. The dendrogram shows the relationships of the clusters at the upper levels of the hierarchy. C, The k-means analysis revealed a three-level functional hierarchy in the ATL. At the top of the hierarchy, the ATL is separated into four functional networks. These four networks are divided into eight networks at the intermediate level, which then further divide into 34 parcels. The colors in the hierarchical tree correspond to the colors used in the brain maps for all figures.
Next, we asked whether the eight functional parcels can be further clustered into larger functional units. We used k-means to directly cluster the eight parcels of the upper level of the hierarchy in the full dataset. A trade-off of cluster number and variance explained by k-means clustering in the 8 × 8 correlation matrix of the eight parcels revealed a prominent “elbow” at the choice of k = 4 clusters, with ∼80% of the variance explained (Fig. 7B). Together, these results indicate that the ATL is organized hierarchically into at least three levels (Fig. 7C).
Finally, we examined how the upper levels of the hierarchy (four and eight clusters) are situated within functional networks across the whole brain (Fig. 8). To do so, we measured the unique variance explained by each cluster across the whole brain by calculating the partial correlation between average time series of each ATL cluster and the time series of each voxel in the whole brain, while removing the contribution of the remaining parcels. We then FDR corrected (p < 0.001, q < 0.001) the connectivity map for each cluster and combined the cluster maps using a winner-take-all approach in each voxel. A voxel was labeled as selectively connected to the cluster that explained significantly more variance than each of the other clusters in that voxel (FDR: q < 0.001, p < 0.001 for all comparisons). Reducing the dimensionality of the ATL to eight and four clusters, respectively, reveals a pattern of connectivity across the brain that approximates known large-scale functional systems (Power et al., 2011; Yeo et al., 2011), such as the default-mode network (Fig. 8, red; Raichle et al., 2001); frontoparietal attention networks (Fig. 8, green; Fox et al., 2006; Ptak, 2012); visuospatial, spatial memory, and navigation systems (Fig. 8, pink; Sheldon et al., 2016; Epstein et al., 2017); and sensory and motor areas (Fig. 8, blue). The functional connectivity profiles of parcels in the ATL at each level of the hierarchy are consistent with involvement in specialized brain systems. When viewed as a whole, the hierarchical organization of the ATL and the connectivity between functional parcels in the ATL and the rest of the brain reveal 34 distinct functional parcels (Fig. 3) that are arranged into bands that extend from the posterior temporal lobe to the most anterior portions of the temporal pole (Fig. 8).
Figure 8.

Connectivity between the upper levels of the ATL hierarchy and the rest of the brain. The whole-brain functional connectivity maps for the upper levels of the hierarchy (four and eight clusters) show how the ATL clusters (outlined in black) are situated within whole-brain functional networks. The brain maps were created using a partial correlation analysis and paired-sample t tests to compare the connectivity value of each cluster against zero in each voxel at the group level (FDR: q < 0.001, p < 0.001). The thresholded maps for each cluster were then directly compared with each other using paired t tests, and a voxel was labeled as selectively connected to the cluster that explained significantly more variance than each of the other clusters in that voxel (FDR: q < 0.001, p < 0.001 for all comparisons).
Relationships among ATL parcels
Our final analysis focused on how the 34 parcels are related to one another at different levels of the functional hierarchy. Specifically, we asked whether the parcellation of the ATL reflected a region composed of discrete functional regions or the presence of continuous functional gradients that peak and/or overlap at different point in the cortex. To test these competing possibilities, we investigated the full ATL voxel × voxel correlation matrix (Fig. 9A) and asked how well voxels from different parcels clustered with one another using a principal component analysis (PCA) to visualize their relative similarities in a more continuous fashion. We first used PCA to visualize the voxels from the four parcels that make up the blue cluster in the middle level of the hierarchy. We then ran PCA again on four parcels from different mid-level functional clusters. First, visual inspection of the correlation matrix in Figure 9A shows stronger correlations among voxels from the same parcel compared with correlations between voxels from different clusters (i.e., the correlations within parcels on the diagonal are stronger than correlations across parcels off of the diagonal midline), and this discontinuous structure of the correlation matrix reflects the parcellation at all three levels of the hierarchy (e.g., the 34 parcels are visible as warm-colored squares along the diagonal, which are contained in eight larger squares; Fig. 7, colored outlines match the color scheme of the hierarchical clustering results). Furthermore, the PCA resulted in sharp separations of voxels from different parcels, rather than “fuzzy” transitions across the parcels (Fig. 9B). While some degree of overlap across the parcels is expected because of the spatial blurring applied to the data and the group averaging, the central tendencies of the parcels are clearly distinct, with the highest densities of points covering distinct parts of the PCA space. As expected, the separation of the parcels is even more apparent in the across-cluster analysis compared with the within-cluster analysis, which seems to reflect the hierarchical organization uncovered in the parcellation. Together, these results suggest that the ATL comprises distinct functional regions rather than ones that differ continuously along functional gradients.
Figure 9.

Relationships between ATL parcels. A, The full ATL voxel × voxel correlation matrix shows stronger correlations between voxels from the same parcel compared with correlations between voxels from different clusters (i.e., the correlations on the diagonal are stronger than the off-diagonal). The colored square outlines around the eight mid-level clusters match the color scheme of the hierarchical parcellation result in Figure 7. B, PCA performed on the correlation matrix of voxels from parcels all from the same (left) or different (right) cluster s one level up in the hierarchy. On the left, the four “within-cluster” parcels make up the blue square in the top left corner of the correlation matrix in A. Parcels from the same functional cluster one level up in the hierarchy are separated by sharp boundaries rather than fuzzy transitions between the clusters. The sharp differentiation of parcels is even more apparent when using PCA to cluster parcels from different functional clusters (right). The color scheme for the parcels in B are arbitrary and do not relate to the colors in Figure 7. The points in the scatterplot are a randomly chosen group of 25% of the voxels from each parcel.
Discussion
We developed a data-driven parcellation scheme that used resting-state fMRI data and focused specifically on the ATL. Our scheme addressed methodological issues, such as poor tSNR in the most ventral and anterior aspects of the temporal lobes (Power et al., 2011; Yeo et al., 2011; Glasser et al., 2016), and thus provides the most precise functional connectivity profile of the temporal lobes to date, especially in the temporal poles. We found 34 distinct functional parcels that represent the bottom level of a functional hierarchy and are organized into eight and then four clusters at the upper levels. At these upper levels of the hierarchy, the parcels are organized into long bands that span the ATL from the posterior edge of our mask into the temporal pole. Together, our parcellation of the ATL is inconsistent with a brain region that subserves a singular cognitive function, such as a domain-general semantic hub, and highlights the importance of adopting more precise methods and language when studying functional divisions within the ATL.
Our parcellation of the ATL into many distinct functional regions is consistent with prior task-based studies that report a wide range of cognitive functions localized to the ATL (Grabowski et al., 2001; Olson et al., 2007; Patterson et al., 2007; Simmons et al., 2010; Peelen and Caramazza, 2012; Mesulam et al., 2013; Lambon Ralph, 2013; Malone et al., 2016; Mellem et al., 2016; Wang et al., 2017). However, while many of these studies report peak coordinates for a particular cognitive function, they all ultimately refer to the functional region as “the ATL.” Our parcellation is at odds with this way of using the moniker ATL to refer to a functional region of cortex. Instead, future studies should be more specific when referring to the localization of neural activation, so that we can better map function to structure within the ATL. Each of the parcels found here is effectively a candidate functional region of interest for future studies and, given arguments that long-range connectivity is responsible for functional selectivity (Mahon and Caramazza, 2011; Plaut and Behrmann, 2011; Stevens et al., 2015; Saygin et al., 2016; Murty et al., 2020), the pattern of connectivity between each parcel and the rest of the brain may provide important clues to its function.
The pairwise comparison of functional connectivity patterns between parcels that overlap the anterior fusiform and parahippocampal gyrus, respectively, is a specific example of how examining the connectivity patterns of ATL parcels can advance our understanding of their functions. Prior studies have identified the anterior fusiform gyrus as a candidate location of a domain-general semantic hub (Mion et al., 2010; Hoffman et al., 2014; Lambon Ralph, 2013; Binney et al., 2016). However, when we directly compared the connectivity patterns of a parcel that overlaps the anterior fusiform gyrus with another that overlaps the parahippocampal gyrus, we found that the anterior fusiform gyrus is connected to face-selective cortices, including the FFA and OFA in the ventral face stream (Duchaine and Yovel, 2015) and regions in the social cognitive network (Gotts et al., 2012), rather than to diverse functional and sensory systems across the brain (i.e., the spokes), while the parcel overlapping the parahippocampal gyrus is preferentially connected to regions that are involved in scene processing, including the PPA, OPA, and RSC (Epstein and Baker, 2019). Another recent study reported a lateral-to-medial organization in a region overlapping the left anterior fusiform gyrus, with successful decoding of animals in a lateral region and successful decoding of tools in a medial region (Malone et al., 2016). Thus, rather than the anterior fusiform gyrus being a domain-general semantic hub, patterns of connectivity between it and the rest of the brain suggest that it is more likely a continuation of the domain-specific ventral visual pathway that begins in early visual cortex and continues into occipitotemporal cortex, potentially terminating in the temporal poles (Anzellotti et al., 2011; Skipper et al., 2011; Kravitz et al., 2013).
Our results are also inconsistent with the broader claim that the ATL semantic hub is a convergence zone of functional gradients that represents multiple sensory modalities and categories of knowledge (Binney et al., 2012; Rice et al., 2015) for several reasons. First, as mentioned above, such a region should show widespread connectivity across the brain to diverse functional and sensory systems (i.e., the spokes). However, we do not find such a massively connected parcel in the ATL. Second, our finding that adjacent parcels in the anterior fusiform and parahippocampal gyri were connected to separate category-selective networks suggests a sharp boundary between functional regions rather than two points along a functional continuum. Furthermore, using PCA, the voxels from each parcel clustered into clearly separable groups rather than gradually transitioning from one parcel to the next. Together, these results suggest that the ATL comprises discrete regions with dissociable functions rather than being a graded semantic hub.
While the results of our parcellation are similar to previous resting-state parcellations that focused on the entire cortex (Power et al., 2011; Yeo et al., 2011; Glasser et al., 2016), our use of a scan sequence that was optimized to enhance tSNR in the temporal poles and our decision to focus specifically on the ATL resulted in important new information about the functional organization of the ATL. First, the most apparent difference between our parcellation and prior attempts is in the temporal poles, where signal dropout is usually a problem. For example, while the Yeo et al. (2011) 17-network solution partitions a large portion of the temporal pole (anterior to y = −10 and ventral to z = −20) into only two diffuse parcels, our approach found that the temporal pole fractionated into several parcels, even at the upper levels of the functional hierarchy. Second, our decision to treat the voxels in the ATL as a cohort separate from the rest of the cortex had the effect of enhancing the functional differences within the ATL (Rosvall and Bergstrom, 2008). The combination of these two analysis choices resulted in an improved parcellation of the ATL with the most apparent differences in the temporal poles, where the boundaries of our parcellation seem to better approximate those of cytoarchitectonic subregions (Ding et al., 2009; Pascual et al., 2015). Additionally, our data-driven approach allowed us to uncover functional regions within the ATL, instead of relying on predefined regions of interest to examine the functional connectivity of particular regions in the ATL (e.g., Jackson et al., 2016).
Another recent study that used rs-fMRI to parcellate the full temporal lobe came to a different solution than the one we report here (Jackson et al., 2018). In that study, the temporal lobe was parcellated into two functional clusters: a posterior parcel that included the superior temporal, inferior temporal, and posterior fusiform gyri, and an anterior parcel that included a large portion of the ventrolateral anterior temporal lobe and the medial temporal gyrus. The discrepancy between this parcellation and our results stems mainly from the authors' decision to force the temporal lobe to have a low-dimensional structure by using a spectral reordering technique (Johansen-Berg et al., 2004). The authors then probed these clusters and concluded that the primary axis of functional organization in the temporal lobe is from “modality-specific” processes supported by posterior regions to “modality-general” processes in anterior regions. By contrast, two findings from our analyses suggest that such a posterior-to-anterior distinction is not the primary axis of functional organization in the temporal lobe. First, the cluster organization is orthogonal to the anterior–posterior axis at the upper levels of the functional hierarchy. Specifically, both the four- and eight-cluster solutions, and the connectivity between each ATL cluster and the rest of the brain, show the temporal lobe functionally organized into bands that extend from the posterior temporal lobe into the temporal pole (Fig. 8). These bands are coarsely aligned with the sulci and gyri and are organized from dorsal to ventral along the lateral surface and from medial to lateral on the ventral surface of the temporal lobes. Second, the pairwise comparison between parcels that overlap the anterior fusiform gyrus and parahippocampal gyrus, respectively, resulted in connectivity profiles that extend back into the posterior temporal and occipital cortex and overlap category-selective functional regions (Fig. 6B,C), thus suggesting that modality-specific and category-specific processing influences the organization of both posterior and anterior regions in the temporal lobe. Understanding the functional properties that influence the organization of the temporal lobes will require further research.
In conclusion, our parcellation reveals a fine-grained map of functional parcels within the ATL and shows how these parcels are organized into a three-level functional hierarchy. Together, our results uncover a complex topology of functionally distinct regions within the ATL and provide a roadmap for better understanding the functional organization of the anterior portions of the temporal lobes (Martin et al., 2014). But, perhaps most importantly, the results presented here are compelling evidence that the term ATL does not actually refer to a functional region of cortex and thus should not be referred to as a locus of cognitive processing in our cognitive theories.
Footnotes
This work was supported by the National Institute of Mental Health Intramural Research Program (Grant ZIA-MH-002920-09; clinical trial number NCT01031407). We thank Adrian Gilmore for insightful discussions and technical assistance.
The authors declare no competing financial interests.
References
- Adolphs R (2010) What does the amygdala contribute to social cognition? Ann N Y Acad Sci 1191:42–61. 10.1111/j.1749-6632.2010.05445.x [DOI] [PMC free article] [PubMed] [Google Scholar]
- Aguirre GK, Zarahn E, D'Esposito M (1998) An area within human ventral cortex sensitive to “building” stimuli: evidence and implications. Neuron 21:373–383. 10.1016/S0896-6273(00)80546-2 [DOI] [PubMed] [Google Scholar]
- Anzellotti S, Mahon BZ, Schwarzbach J, Caramazza A (2011) Differential activity for animals and manipulable objects in the anterior temporal lobes. J Cogn Neurosci 23:2059–2067. 10.1162/jocn.2010.21567 [DOI] [PubMed] [Google Scholar]
- Axelrod V, Yovel G (2013) The challenge of localizing the anterior temporal face area: a possible solution. Neuroimage 81:371–380. 10.1016/j.neuroimage.2013.05.015 [DOI] [PubMed] [Google Scholar]
- Baldassano C, Beck DM, Fei-Fei L (2013) Differential connectivity within the parahippocampal place area. Neuroimage 75:228–237. 10.1016/j.neuroimage.2013.02.073 [DOI] [PMC free article] [PubMed] [Google Scholar]
- Binney RJ, Parker GJM, Lambon Ralph MA (2012) Convergent connectivity and graded specialization in the rostral human temporal lobe as revealed by diffusion-weighted imaging probabilistic tractography. J Cogn Neurosci 24:1998–2014. 10.1162/jocn_a_00263 [DOI] [PubMed] [Google Scholar]
- Binney RJ, Hoffman P, Lambon Ralph MA (2016) Mapping the multiple graded contributions of the anterior temporal lobe representational hub to abstract and social concepts: evidence from distortion-corrected fMRI. Cereb Cortex 26:4227–4241. 10.1093/cercor/bhw260 [DOI] [PMC free article] [PubMed] [Google Scholar]
- Birn RM, Smith MA, Jones TB, Bandettini PA (2008) The respiration response function: the temporal dynamics of fMRI signal fluctuations related to changes in respiration. Neuroimage 40:644–654. 10.1016/j.neuroimage.2007.11.059 [DOI] [PMC free article] [PubMed] [Google Scholar]
- Bonner MF, Price AR (2013) Where is the anterior temporal lobe and what does it do? J Neurosci 33:4213–4215. 10.1523/JNEUROSCI.0041-13.2013 [DOI] [PMC free article] [PubMed] [Google Scholar]
- Brodmann K (1909) Vergleichende Lokalisationslehre der Grosshirnrinde in ihren Prinzipien dargestellt auf Grund des Zellenbaues. Leipzig, Germany: Barth. [Google Scholar]
- Brunec IK, Bellana B, Ozubko JD, Man V, Robin J, Liu ZX, Grady C, Rosenbaum RS, Winocur G, Barense MD, Moscovitch M (2018) Multiple scales of representation along the hippocampal anteroposterior axis in humans. Curr Biol 28:2129–2135.e6. 10.1016/j.cub.2018.05.016 [DOI] [PubMed] [Google Scholar]
- Carmichael ST, Price JL (1995) Limbic connections of the orbital and medial prefrontal cortex in macaque monkeys. J Comp Neurol 363:615–641. 10.1002/cne.903630408 [DOI] [PubMed] [Google Scholar]
- Collins JA, Olson IR (2014) Beyond the FFA: the role of the ventral anterior temporal lobes in face processing. Neuropsychologia 61:65–79. 10.1016/j.neuropsychologia.2014.06.005 [DOI] [PMC free article] [PubMed] [Google Scholar]
- Cox RW (1996) AFNI: software for analysis and visualization of functional magnetic resonance neuroimages. Comput Biomed Res 29:162–173. 10.1006/cbmr.1996.0014 [DOI] [PubMed] [Google Scholar]
- Culham JC, Valyear KF (2006) Human parietal cortex in action. Curr Opin Neurobiol 16:205–212. 10.1016/j.conb.2006.03.005 [DOI] [PubMed] [Google Scholar]
- Damasio H, Tranel D, Grabowski T, Adolphs R, Damasio A (2004) Neural systems behind word and concept retrieval. Cognition 92:179–229. 10.1016/j.cognition.2002.07.001 [DOI] [PubMed] [Google Scholar]
- De Panfilis C, Schwarzbauer C (2005) Positive or negative blips? The effect of phase encoding scheme on susceptibility-induced signal losses in EPI. Neuroimage 25:112–121. 10.1016/j.neuroimage.2004.11.014 [DOI] [PubMed] [Google Scholar]
- Devlin JT, Russell RP, Davis MH, Price CJ, Wilson J, Moss HE, Matthews PM, Tyler LK (2000) Susceptibility-induced loss of signal: comparing PET and fMRI on a semantic task. Neuroimage 11:589–600. 10.1006/nimg.2000.0595 [DOI] [PubMed] [Google Scholar]
- Ding S-L, Van Hoesen GW, Cassell MD, Poremba A (2009) Parcellation of human temporal polar cortex: a combined analysis of multiple cytoarchitectonic, chemoarchitectonic, and pathological markers. J Comp Neurol 514:595–623. 10.1002/cne.22053 [DOI] [PMC free article] [PubMed] [Google Scholar]
- Duchaine B, Yovel G (2015) A revised neural framework for face processing. Annu Rev Vis Sci 1:393–416. 10.1146/annurev-vision-082114-035518 [DOI] [PubMed] [Google Scholar]
- Epstein R, Kanwisher N (1998) A cortical representation the local visual environment. Nature 392:598–601. 10.1038/33402 [DOI] [PubMed] [Google Scholar]
- Epstein RA, Baker CI (2019) Scene perception in the human brain. Annu Rev Vis Sci 5:373–397. 10.1146/annurev-vision-091718-014809 [DOI] [PMC free article] [PubMed] [Google Scholar]
- Epstein RA, Patai EZ, Julian JB, Spiers HJ (2017) The cognitive map in humans: spatial navigation and beyond. Nat Neurosci 20:1504–1513. 10.1038/nn.4656 [DOI] [PMC free article] [PubMed] [Google Scholar]
- Fanselow MS, Dong HW (2010) Are the dorsal and ventral hippocampus functionally distinct structures? Neuron 65:7–19. 10.1016/j.neuron.2009.11.031 [DOI] [PMC free article] [PubMed] [Google Scholar]
- Filipek PA, Richelme C, Kennedy DN, Caviness VS (1994) The young adult human brain: an mri-based morphometric analysis. Cereb Cortex 4:344–360. 10.1093/cercor/4.4.344 [DOI] [PubMed] [Google Scholar]
- Fischl B, Salat DH, Busa E, Albert M, Dieterich M, Haselgrove C, Van Der Kouwe A, Killiany R, Kennedy D, Klaveness S, Montillo A, Makris N, Rosen B, Dale AM (2002) Whole brain segmentation: automated labeling of neuroanatomical structures in the human brain. Neuron 33:341–355. 10.1016/s0896-6273(02)00569-x [DOI] [PubMed] [Google Scholar]
- Fischl B, Van Der Kouwe A, Destrieux C, Halgren E, Ségonne F, Salat DH, Busa E, Seidman LJ, Goldstein J, Kennedy D, Caviness V, Makris N, Rosen B, Dale AM (2004) Automatically parcellating the human cerebral cortex. Cereb Cortex 14:11–22. 10.1093/cercor/bhg087 [DOI] [PubMed] [Google Scholar]
- Fox MD, Corbetta M, Snyder AZ, Vincent JL, Raichle ME (2006) Spontaneous neuronal activity distinguishes human dorsal and ventral attention systems. Proc Natl Acad Sci U S A 103:10046–10051. 10.1073/pnas.0604187103 [DOI] [PMC free article] [PubMed] [Google Scholar]
- Frith CD (2007) The social brain? Philos Trans R Soc Lond B Biol Sci 362:671–678. 10.1098/rstb.2006.2003 [DOI] [PMC free article] [PubMed] [Google Scholar]
- Frith CD, Frith U (2007) Social cognition in humans. Curr Biol 17:R724–R732. 10.1016/j.cub.2007.05.068 [DOI] [PubMed] [Google Scholar]
- Gilmore AW, Quach A, Kalinowski SE, González-Araya EI, Gotts SJ, Schacter DL, Martin A (2021a) Evidence supporting a time-limited hippocampal role in retrieving autobiographical memories. Proc Natl Acad Sci U S A 118:e2023069118. 10.1101/2020.11.19.390526 [DOI] [PMC free article] [PubMed] [Google Scholar]
- Gilmore AW, Quach A, Kalinowski SE, Gotts SJ, Schacter DL, Martin A (2021b) Dynamic content reactivation supports naturalistic autobiographical recall in humans. J Neurosci 41:153–166. 10.1523/JNEUROSCI.1490-20.2020 [DOI] [PMC free article] [PubMed] [Google Scholar]
- Glasser MF, Coalson TS, Robinson EC, Hacker CD, Harwell J, Yacoub E, Ugurbil K, Andersson J, Beckmann CF, Jenkinson M, Smith SM, Van Essen DC (2016) A multi-modal parcellation of human cerebral cortex. Nature 536:171–178. 10.1038/nature18933 [DOI] [PMC free article] [PubMed] [Google Scholar]
- Glover GH, Li T-Q, Ress D (2000) Image-based method for retrospective correction of physiological motion effects in fMRI: RETROICOR. Magn Reson Med 44:162–167. [DOI] [PubMed] [Google Scholar]
- Gotts SJ, Simmons WK, Milbury LA, Wallace GL, Cox RW, Martin A (2012) Fractionation of social brain circuits in autism spectrum disorders. Brain 135:2711–2725. 10.1093/brain/aws160 [DOI] [PMC free article] [PubMed] [Google Scholar]
- Grabowski TJ, Damasio H, Tranel D, Boles Ponto LL, Hichwa RD, Damasio AR (2001) A role for left temporal pole in the retrieval of words for unique entities. Hum Brain Mapp 13:199–212. 10.1002/hbm.1033 [DOI] [PMC free article] [PubMed] [Google Scholar]
- Grady CL (2020) Meta-analytic and functional connectivity evidence from functional magnetic resonance imaging for an anterior to posterior gradient of function along the hippocampal axis. Hippocampus 30:456–471. 10.1002/hipo.23164 [DOI] [PubMed] [Google Scholar]
- Hoffman P, Lambon Ralph MA (2011) Reverse concreteness effects are not a typical feature of semantic dementia: evidence for the hub-and-spoke model of conceptual representation. Cereb Cortex 21:2103–2112. 10.1093/cercor/bhq288 [DOI] [PubMed] [Google Scholar]
- Hoffman P, Evans GAL, Lambon Ralph MA (2014) The anterior temporal lobes are critically involved in acquiring new conceptual knowledge: evidence for impaired feature integration in semantic dementia. Cortex 50:19–31. 10.1016/j.cortex.2013.10.006 [DOI] [PMC free article] [PubMed] [Google Scholar]
- Jackson RL, Hoffman P, Pobric G, Lambon Ralph MA (2016) The semantic network at work and rest: differential connectivity of anterior temporal lobe subregions. J Neurosci 36:1490–1501. 10.1523/JNEUROSCI.2999-15.2016 [DOI] [PMC free article] [PubMed] [Google Scholar]
- Jackson RL, Bajada CJ, Rice GE, Cloutman LL, Lambon Ralph MA (2018) An emergent functional parcellation of the temporal cortex. Neuroimage 170:385–399. 10.1016/j.neuroimage.2017.04.024 [DOI] [PubMed] [Google Scholar]
- Jasmin K, Gotts SJ, Xu Y, Liu S, Riddell CD, Ingeholm JE, Kenworthy L, Wallace GL, Braun AR, Martin A (2019) Overt social interaction and resting state in young adult males with autism: core and contextual neural features. Brain 142:808–822. 10.1093/brain/awz003 [DOI] [PMC free article] [PubMed] [Google Scholar]
- Jo HJ, Saad ZS, Simmons WK, Milbury LA, Cox RW (2010) Mapping sources of correlation in resting state FMRI, with artifact detection and removal. Neuroimage 52:571–582. 10.1016/j.neuroimage.2010.04.246 [DOI] [PMC free article] [PubMed] [Google Scholar]
- Johansen-Berg H, Behrens TEJ, Robson MD, Drobnjak I, Rushworth MFS, Brady JM, Smith SM, Higham DJ, Matthews PM (2004) Changes in connectivity profiles define functionally distinct regions in human medial frontal cortex. Proc Natl Acad Sci U S A 101:13335–13340. 10.1073/pnas.0403743101 [DOI] [PMC free article] [PubMed] [Google Scholar]
- Julian JB, Fedorenko E, Webster J, Kanwisher N (2012) An algorithmic method for functionally defining regions of interest in the ventral visual pathway. Neuroimage 60:2357–2364. 10.1016/j.neuroimage.2012.02.055 [DOI] [PubMed] [Google Scholar]
- Kalcher K, Boubela RN, Huf W, Našel C, Moser E (2015) Identification of voxels confounded by venous signals using resting-state fMRI functional connectivity graph community identification. Front Neurosci 9:472. 10.3389/fnins.2015.00472 [DOI] [PMC free article] [PubMed] [Google Scholar]
- Kanwisher N, Barton JJS (2011) The functional architecture of the face system: integrating evidence from fMRI and patient studies. In: Oxford Handbook of Face Perception (Calder A, Rhodes G, Johnson M, Haxby J, eds) pp 111–129. Oxford, UK: Oxford UP. [Google Scholar]
- Kanwisher N, Dilks DD (2013) The functional organization of the ventral visual pathway in humans. In: The new visual neurosciences (Chalupa LM, Werner JS, eds), pp 733–748. Cambridge, MA: MIT. [Google Scholar]
- Kravitz DJ, Saleem KS, Baker CI, Ungerleider LG, Mishkin M (2013) The ventral visual pathway: an expanded neural framework for the processing of object quality. Trends Cogn Sci 17:26–49. 10.1016/j.tics.2012.10.011 [DOI] [PMC free article] [PubMed] [Google Scholar]
- Kuskowski MA, Pardo JV (1999) The role of the fusiform gyrus in successful encoding of face stimuli. Neuroimage 9:599–610. 10.1006/nimg.1999.0442 [DOI] [PubMed] [Google Scholar]
- Lambon Ralph MA (2013) Neurocognitive insights on conceptual knowledge and its breakdown. Philos Trans R Soc Lond B Biol Sci 369:20120392. 10.1098/rstb.2012.0392 [DOI] [PMC free article] [PubMed] [Google Scholar]
- Lambon Ralph MA, Sage K, Jones RW, Mayberry EJ (2010) Coherent concepts are computed in the anterior temporal lobes. Proc Natl Acad Sci U S A 107:2717–2722. 10.1073/pnas.0907307107 [DOI] [PMC free article] [PubMed] [Google Scholar]
- Mahon BZ, Caramazza A (2011) What drives the organization of object knowledge in the brain? Trends Cogn Sci 15:97–103. 10.1016/j.tics.2011.01.004 [DOI] [PMC free article] [PubMed] [Google Scholar]
- Malone PS, Glezer LS, Kim J, Jiang X, Riesenhuber M (2016) Multivariate pattern analysis reveals category-related organization of semantic representations in anterior temporal cortex. J Neurosci 36:10089–10096. 10.1523/JNEUROSCI.1599-16.2016 [DOI] [PMC free article] [PubMed] [Google Scholar]
- Martin A (2007) The representation of object concepts in the brain. Annu Rev Psychol 58:25–45. 10.1146/annurev.psych.57.102904.190143 [DOI] [PubMed] [Google Scholar]
- Martin A, Simmons WK, Beauchamp MS, Gotts SJ (2014) Is a single 'hub', with lots of spokes, an accurate description of the neural architecture of action semantics? Phys Life Rev 11:261–262. [DOI] [PubMed] [Google Scholar]
- Martin A (2016) GRAPES—Grounding representations in action, perception, and emotion systems: how object properties and categories are represented in the human brain. Psychon Bull Rev 23:979–990. 10.3758/s13423-015-0842-3 [DOI] [PMC free article] [PubMed] [Google Scholar]
- Mellem MS, Jasmin KM, Peng C, Martin A (2016) Sentence processing in anterior superior temporal cortex shows a social-emotional bias. Neuropsychologia 89:217–224. 10.1016/j.neuropsychologia.2016.06.019 [DOI] [PMC free article] [PubMed] [Google Scholar]
- Mesulam M-M, Wieneke C, Hurley R, Rademaker A, Thompson CK, Weintraub S, Rogalski EJ (2013) Words and objects at the tip of the left temporal lobe in primary progressive aphasia. Brain 136:601–618. 10.1093/brain/aws336 [DOI] [PMC free article] [PubMed] [Google Scholar]
- Mion M, Patterson K, Acosta-Cabronero J, Pengas G, Izquierdo-Garcia D, Hong YT, Fryer TD, Williams GB, Hodges JR, Nestor PJ (2010) What the left and right anterior fusiform gyri tell us about semantic memory. Brain 133:3256–3268. 10.1093/brain/awq272 [DOI] [PubMed] [Google Scholar]
- Moscovitch M, Winocur G, Behrmann M (1997) What is special about face recognition? Nineteen experiments on a person with visual object agnosia and dyslexia but normal face recognition. J Cogn Neurosci 9:555–604. 10.1162/jocn.1997.9.5.555 [DOI] [PubMed] [Google Scholar]
- Murty NAR, Teng S, Beeler D, Mynick A, Oliva A, Kanwisher N (2020) Visual experience is not necessary for the development of face-selectivity in the lateral fusiform gyrus. Proc Natl Acad Sci U S A 117:23011–23020. 10.1073/pnas.2004607117 [DOI] [PMC free article] [PubMed] [Google Scholar]
- Nadel L, Hoscheidt S, Ryan LR (2013) Spatial cognition and the hippocampus: the anterior-posterior axis. J Cogn Neurosci 25:22–28. 10.1162/jocn_a_00313 [DOI] [PubMed] [Google Scholar]
- Olson IR, Plotzker A, Ezzyat Y (2007) The Enigmatic temporal pole: a review of findings on social and emotional processing. Brain 130:1718–1731. 10.1093/brain/awm052 [DOI] [PubMed] [Google Scholar]
- Pascual B, Masdeu JC, Hollenbeck M, Makris N, Insausti R, Ding SL, Dickerson BC (2015) Large-scale brain networks of the human left temporal pole: a functional connectivity MRI study. Cereb Cortex 25:680–702. 10.1093/cercor/bht260 [DOI] [PMC free article] [PubMed] [Google Scholar]
- Patterson K, Nestor PJ, Rogers TT (2007) Where do you know what you know? The representation of semantic knowledge in the human brain. Nat Rev Neurosci 8:976–987. 10.1038/nrn2277 [DOI] [PubMed] [Google Scholar]
- Peelen MV, Caramazza A (2012) Conceptual object representations in human anterior temporal cortex. J Neurosci 32:15728–15736. 10.1523/JNEUROSCI.1953-12.2012 [DOI] [PMC free article] [PubMed] [Google Scholar]
- Plaut DC, Behrmann M (2011) Complementary neural representations for faces and words: a computational exploration. Cogn Neuropsychol 28:251–275. 10.1080/02643294.2011.609812 [DOI] [PubMed] [Google Scholar]
- Pobric G, Jefferies E, Ralph MAL (2010) Induction of semantic impairments using rTMS: evidence for the hub-and-spoke semantic theory. Behav Neurol 23:217–219. 10.1155/2010/925161 [DOI] [PMC free article] [PubMed] [Google Scholar]
- Poppenk J, Evensmoen HR, Moscovitch M, Nadel L (2013) Long-axis specialization of the human hippocampus. Trends Cogn Sci 17:230–240. 10.1016/j.tics.2013.03.005 [DOI] [PubMed] [Google Scholar]
- Power JD, Cohen AL, Nelson SM, Wig GS, Barnes KA, Church JA, Vogel AC, Laumann TO, Miezin FM, Schlaggar BL, Petersen SE (2011) Functional network organization of the human brain. Neuron 72:665–678. 10.1016/j.neuron.2011.09.006 [DOI] [PMC free article] [PubMed] [Google Scholar]
- Power JD, Lynch CJ, Gilmore AW, Gotts SJ, Martin A (2019) Reply to Spreng et al.: multiecho fMRI denoising does not remove global motion-associated respiratory signals. Proc Natl Acad Sci U S A 116:19243–19244. 10.1073/pnas.1909852116 [DOI] [PMC free article] [PubMed] [Google Scholar]
- Ptak R (2012) The frontoparietal attention network of the human brain: action, saliency, and a priority map of the environment. Neuroscientist 18:502–515. 10.1177/1073858411409051 [DOI] [PubMed] [Google Scholar]
- Raichle ME, MacLeod AM, Snyder AZ, Powers WJ, Gusnard DA, Shulman GL (2001) A default mode of brain function. Proc Natl Acad Sci U S A 98:676–682. 10.1073/pnas.98.2.676 [DOI] [PMC free article] [PubMed] [Google Scholar]
- Ramot M, Kimmich S, Gonzalez-Castillo J, Roopchansingh V, Popal H, White E, Gotts SJ, Martin A (2017) Direct modulation of aberrant brain network connectivity through real-time NeuroFeedback. Elife 6:e28974. 10.7554/eLife.28974 [DOI] [PMC free article] [PubMed] [Google Scholar]
- Ramot M, Walsh C, Martin A (2019) Multifaceted integration: memory for faces is subserved by widespread connections between visual, memory, auditory, and social networks. J Neurosci 39:4976–4985. 10.1523/JNEUROSCI.0217-19.2019 [DOI] [PMC free article] [PubMed] [Google Scholar]
- Ranganath C, Ritchey M (2012) Two cortical systems for memory-guided behaviour. Nat Rev Neurosci 13:713–726. 10.1038/nrn3338 [DOI] [PubMed] [Google Scholar]
- Rice GE, Hoffman P, Lambon Ralph MA (2015) Graded specialization within and between the anterior temporal lobes. Ann N Y Acad Sci 1359:84–97. 10.1111/nyas.12951 [DOI] [PMC free article] [PubMed] [Google Scholar]
- Rosvall M, Bergstrom CT (2008) Maps of random walks on complex networks reveal community structure. Proc Natl Acad Sci U S A 105:1118–1123. 10.1073/pnas.0706851105 [DOI] [PMC free article] [PubMed] [Google Scholar]
- Rosvall M, Bergstrom CT (2011) Multilevel compression of random walks on networks reveals hierarchical organization in large integrated systems. PLoS One 6:e18209. 10.1371/journal.pone.0018209 [DOI] [PMC free article] [PubMed] [Google Scholar]
- Saleem KS, Kondo H, Price JL (2008) Complementary circuits connecting the orbital and medial prefrontal networks with the temporal, insular, and opercular cortex in the macaque monkey. J Comp Neurol 506:659–693. 10.1002/cne.21577 [DOI] [PubMed] [Google Scholar]
- Saygin ZM, Osher DE, Norton ES, Youssoufian DA, Beach SD, Feather J, Gaab N, Gabrieli JDE, Kanwisher N (2016) Connectivity precedes function in the development of the visual word form area. Nat Neurosci 19:1250–1255. 10.1038/nn.4354 [DOI] [PMC free article] [PubMed] [Google Scholar]
- Sekeres MJ, Winocur G, Moscovitch M (2018) The hippocampus and related neocortical structures in memory transformation. Neurosci Lett 680:39–53. 10.1016/j.neulet.2018.05.006 [DOI] [PubMed] [Google Scholar]
- Sergent J, Ohta S, Macdonald B (1992) Functional neuroanatomy of face and object processing: a positron emission tomography study. Brain 115:15–36. 10.1093/brain/115.1.15 [DOI] [PubMed] [Google Scholar]
- Sheldon S, Farb N, Palombo DJ, Levine B (2016) Intrinsic medial temporal lobe connectivity relates to individual differences in episodic autobiographical remembering. Cortex 74:206–216. 10.1016/j.cortex.2015.11.005 [DOI] [PubMed] [Google Scholar]
- Silson EH, Steel AD, Baker CI (2016) Scene-selectivity and retinotopy in medial parietal cortex. Front Hum Neurosci 10:17. [DOI] [PMC free article] [PubMed] [Google Scholar]
- Simmons WK, Martin A (2009) The anterior temporal lobes and the functional architecture of semantic memory. J Int Neuropsychol Soc 15:645–649. 10.1017/S1355617709990348 [DOI] [PMC free article] [PubMed] [Google Scholar]
- Simmons WK, Reddish M, Bellgowan PSF, Martin A (2010) The selectivity and functional connectivity of the anterior temporal lobes. Cereb Cortex 20:813–825. 10.1093/cercor/bhp149 [DOI] [PMC free article] [PubMed] [Google Scholar]
- Skipper LM, Ross LA, Olson IR (2011) Sensory and semantic category subdivisions within the anterior temporal lobes. Neuropsychologia 49:3419–3429. 10.1016/j.neuropsychologia.2011.07.033 [DOI] [PMC free article] [PubMed] [Google Scholar]
- Stevens WD, Tessler MH, Peng CS, Martin A (2015) Functional connectivity constrains the category-related organization of human ventral occipitotemporal cortex. Hum Brain Mapp 36:2187–2206. 10.1002/hbm.22764 [DOI] [PMC free article] [PubMed] [Google Scholar]
- Wang Y, Collins JA, Koski J, Nugiel T, Metoki A, Olson IR (2017) Dynamic neural architecture for social knowledge retrieval. Proc Natl Acad Sci U S A 114:E3305–E3314. 10.1073/pnas.1621234114 [DOI] [PMC free article] [PubMed] [Google Scholar]
- Yeo BTT, Krienen FM, Sepulcre J, Sabuncu MR, Lashkari D, Hollinshead M, Roffman JL, Smoller JW, Zöllei L, Polimeni JR, Fisch B, Liu H, Buckner RL (2011) The organization of the human cerebral cortex estimated by intrinsic functional connectivity. J Neurophysiol 106:1125–1165. 10.1152/jn.00338.2011 [DOI] [PMC free article] [PubMed] [Google Scholar]
- Zahn R, Moll J, Krueger F, Huey ED, Garrido G, Grafman J (2007) Social concepts are represented in the superior anterior temporal cortex. Proc Natl Acad Sci U S A 104:6430–6435. 10.1073/pnas.0607061104 [DOI] [PMC free article] [PubMed] [Google Scholar]
Associated Data
This section collects any data citations, data availability statements, or supplementary materials included in this article.
Data Availability Statement
Data and code used to parcellate the ATL are publicly available online at Figshare.