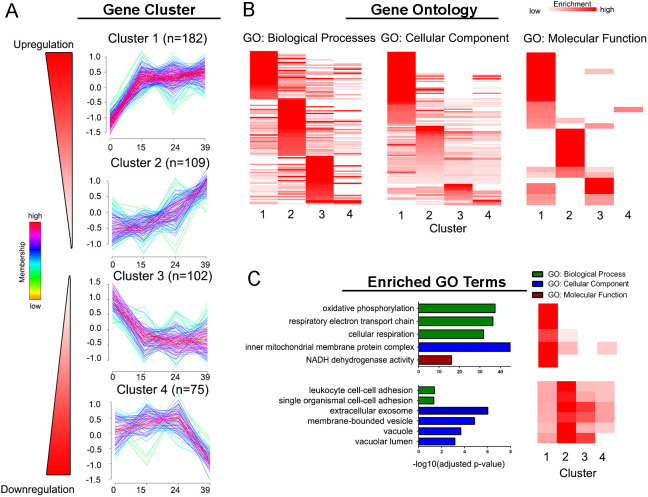
Fig. 3.
Dynamics of differentially expressed proteins during cytotrophoblast differentiation/invasion. (A) Unsupervised fuzzy clustering of 477 differentially expressed (DE) proteins identified four clusters with distinct expression profiles. n=number of proteins assigned to each cluster. (B) Heatmap of gene ontology (GO) enrichment analysis of each cluster. GO terms overrepresented in each cluster (Fisher's exact test; P<0.05, unadjusted) were visualized by fold enrichment as a qualitative comparison to functionalities in other clusters. (C) Representative GO terms enriched in clusters 1 and 2 (Fisher's exact test; P<0.05, Benjamini-Hochberg corrected) were visualized for biological processes, cellular component or molecular function (MF).

