

Abstract

Defect aggregates in doped ceria play a crucial role in blocking the movement of oxygen vacancies and hence in reducing ionic conductivity. Nevertheless, evaluation of their amount and the correlation between domain size and transport properties is still an open issue. Data derived from a high-pressure X-ray diffraction investigation performed on the Ce1–x(Nd0.74Tm0.26)xO2–x/2 system are employed to develop a novel approach aimed at evaluating the defect aggregate content; the results are critically discussed in comparison to the ones previously obtained from Sm- and Lu-doped ceria. Defect clusters are present even at the lowest considered x value, and their content increases with increasing x and decreasing rare earth ion (RE3+) size; their amount, distribution, and spatial correlation can be interpreted as a complex interplay between the defects’ binding energy, nucleation rate, and growth rate. The synoptic analysis of data derived from all of the considered systems also suggests that the detection limit of the defects by X-ray diffraction is correlated to the defect size rather than to their amount, and that the vacancies’ flow through the lattice is hindered by defects irrespective of their size and association degree.
Short abstract
A novel approach to the treatment of high-pressure X-ray diffraction data is applied to several rare earth-doped ceria systems with the aim of providing an evaluation of the amount of defect aggregates and of the composition of the CeO2-based solid solution. By this method, it is possible to effectively correlate the structural properties and ionic conductivity of the studied material.
1. Introduction
Trivalent rare earth (RE)-doped ceria systems Ce1–xRExO2–x/2 are currently widely studied as electrolytes in solid oxide fuel and electrolysis cells operating at intermediate temperatures (IT-SOFC and SOEC, respectively) due to their high values of ionic conductivity in the 773–973 K temperature range1 and their good chemical compatibility with LSCF, namely the (La,Sr,Co) ferrite diffusely considered as the most efficient material for SOC air electrodes.2 Their effectiveness is reported to be driven by numerous strictly interconnected issues, such as the RE3+ size and the compositional extent of the CeO2-based solid solution,3,4 as well as extrinsic factors like the synthetic procedure and the sintering process, both of which influence the microstructural features of the sample.5 Nevertheless, the first and foremost cause of hindrance to the movement of oxygen ions through the lattice has to be sought in the occurrence of defect aggregates, which strongly affect the entrance of randomly dispersed RE3+ ions into the CeO2-based solid solution and ultimately impair the oxide transport properties by blocking the movement of oxygen vacancies through the lattice.
The nature of defects arising in doped ceria is strictly connected to the crystallographic properties of the material. CeO2 is characterized by a fluorite-like cubic cell named F belonging to the Fm3̅m space group6 and having four formula units per cell; Ce and O occupy, respectively, the 4a (0, 0, 0) and 8c (1/4, 1/4, 1/4) atomic sites, and Ce is eight-coordinated to O. The Ce4+ partial substitution by a RE3+ ion primarily induces the formation of a CeO2-based solid solution with isolated RECe′ defects and oxygen vacancies acting as guests; at a sufficiently high temperature, the latter are free to move through the lattice, being thus responsible for ionic conduction. The stability of such a solid solution is guaranteed up to a certain RE3+ content, which depends on the RE element, being driven both by the Ce4+/RE3+ size closeness and by the binding energy of the RE3+-vacancy clusters.3,7 Beyond the threshold, superstructure peaks referable to the Ia3̅ space group appear in the diffraction patterns: they mark the presence of the aforementioned RE3+-vacancy clusters, crystallizing in the Ia3̅ cubic phase named C, typical of sesquioxides of the heaviest rare earths (Gd-Lu),8 where the RE doping ion is six-coordinated to O. If the Ce4+/RE3+ ionic size mismatch is not too large (namely from RE ≡ Sm to Tm,9 as well as in doubly doped systems, where, for instance, RE ≡ (Nd,Dy)10 or (Nd,Tm)11), a F/C hybrid phase named H occurs, where the F-based solid solution mainly hosts randomly dispersed C clusters.12 In the H phase, C microdomains are so intimately interlaced with the F matrix that diffraction peaks common to the F and C phases are perfectly superimposed, and the C cell size is exactly doubled with respect to that of F.13,14 If, on the contrary, the Ce4+/RE3+ size mismatch is too large, a (F + C) two-phase field appears, such as in Lu-doped ceria. For the sake of completeness, the F, C, and H structural models are reported in the Supporting Information. Nevertheless, in spite of the substantial accuracy of this description, the scenario is not simple, since it is well known that a certain number of C-based nano- or microdomains are stable within the F matrix even within the F stability region: local probes such as Raman spectroscopy, for instance, are able to reveal the presence of C clusters at doping amounts much lower than needed by X-ray diffraction.12
The building units constituting C defect clusters have been long investigated,15−18 resulting to be mainly 1VO••RECe positively charged dimers and 1VO••2RECe neutral trimers,15 with a significant predominance of the latter below a threshold temperature placeable at ∼750 K; at higher temperatures, the trimers tend to dissociate due to their lower configurational entropy with respect to the dimers.19 The stability of C defect associates is connected to the maximization of the cluster binding energy, which in turn is ruled by the RE3+ size and local position with respect to the oxygen vacancy:7 according to computational simulations, the binding energy of 1VO••2RECe trimers grows with decreasing RE3+ radius if the dopant is located in the nearest-neighbor (NN) position with respect to the vacancy, while it is slightly reduced if it is in the next-nearest-neighbour (NNN) one.7 The described evidence thus justifies the minimum in binding energy,7,15 as well as the maximum in ionic conductivity, found for RE ≡ Sm3+ and Gd3+.4,20
The crystallographic nature and the spatial extent of the C-based local ordering have been the subject of numerous studies performed by both experimental and theoretical approaches. To this purpose, techniques such as selected area electron diffraction (SAED),21 transmission electron microscopy (TEM),22 extended X-ray absorption fine structure (EXAFS),23−25 Raman spectroscopy,26,27 and X-ray total scattering treated by pair distribution function (PDF)28,29 were employed, as well as computational simulations.15,18 Nevertheless, the actual amount of C aggregates, and consequently the real RE3+ content within the F matrix, could hardly be revealed. While in fact it is relatively easy to recognize the position of the F/H or the F/(F + C) boundary through the occurrence of C superstructure peaks in diffraction patterns, and hence the nominal formulation of the oxide marking the F compositional boundary, it is nontrivial to determine how RE3+ ions are actually distributed over C and F, i.e., over 1VO••2RECe and 1VO••RECe C domains on one hand and randomly placed RECe′ on the other. Put differently, the actual RE3+ maximum content in F does not correspond to the one based on the overall oxide stoichiometry, since a certain amount of RE3+ ions are blocked within the C domains, even if this evidence cannot be revealed by X-ray diffraction in a straightforward way. This issue is of special interest, since the compositional extent of the F solid solution based on the nominal composition of the oxide is different for each lanthanide doping ion, with a minimum for RE ≡ Gd and Sm,3 and it is often taken as an indicator of the transport properties of the material.
Co-doping of ceria has been accomplished for many systems, such as Gd-Y,30 Gd/Sm-,31 La/Sm-,32 Sm/Nd-,33 Nd/Gd-,34 La/Dy-,35 Gd/Sm/La,36 and even others, due to the generally observed lowering of activation energy to ionic conduction11 and enhancement of ionic conductivity30,37,38 with respect to singly doped ceria. Within this framework, the present research group recently undertook an experimental study of the structural, Raman, and transport properties of two co-doped systems having the same average doping ion size as Sm-doped ceria, namely Ce1–x(Nd0.63Dy0.37)xO2–x/210 and Ce1–x(Nd0.74Tm0.26)xO2–x/2.1111 Sm-doped ceria was chosen as a reference material due to its remarkable ionic conductivity values among ceria-based systems. In comparison to Ce1–xSmxO2–x/2, crystallographic results derived from the studied co-doped systems point at a widening of the compositional extent of the F stability region, as well as at the occurrence of larger cell parameters. Both of these evidences are believed to be caused by the preferential entrance of the larger RE3+, i.e., Nd3+, into F, and the smaller RE3+, i.e., Dy3+ or Tm3+, into C defects, in accordance with the aforementioned higher binding energy of C clusters formed by smaller rare earth ions.7 Since 1VO••2RECe trimers are known to be responsible, together with 1VO••RECe dimers, for blocking the transport of oxygen vacancies through the lattice, the enlargement of the F region makes in principle co-doped systems very promising in terms of ionic conduction. Indeed, in (Nd,Tm)-doped ceria, two different activation energies to ionic conduction were revealed within different temperature ranges, namely below and above ∼750 K, and very interestingly, the high temperature activation energy resulted to be lower in (Nd,Tm)- than in Sm-doped ceria, as a direct consequence of the distribution of Nd3+ and Tm3+ ions between the F matrix and C defect aggregates.11 Nevertheless, the actual composition of the F solid solution and the amount of C domains are not known.
In this work, a novel approach based on in situ high-pressure synchrotron X-ray diffraction is proposed and applied to Ce1–x(Nd0.74Tm0.26)xO2–x/2 to provide a reliable evaluation of the amount of C defect aggregates, and hence of the composition of the F phase. In order to have useful terms of comparison, the technique is also applied to high-pressure data of Sm-39 and Lu-doped ceria.40 The methodological basis of the approach, as thoroughly described in the Discussion section, is founded on the exhaustive work by Anderson and Nafe,41 who analyzed a huge amount of oxides and found a linear trend of ln K0 vs ln(2Vat), with K0 and Vat being the zero applied pressure bulk modulus and the mean atomic volume, respectively. By comparing the experimental and expected trends, it is possible to recognize the effect of oxygen vacancies on Vat, to consequently deduce the occupancy factor of the O and RE crystallographic sites, and finally to calculate the amount of C defect aggregates and the RE3+ amount actually entering the F structure. The results point at the existence of a strict correlation between the binding energy, amount, and size of C defects. The obtained outcome can help in drawing relevant conclusions regarding the ionic conduction properties of the studied material.
2. Experimental Section
2.1. Synthesis
Six samples belonging to the Ce1–x(Nd0.74Tm0.26)xO2–x/2 system (nominal x = 0.1, 0.2, 0.3, 0.4, 0.5, and 0.6) were synthesized by oxalate coprecipitation, as described in ref (42); the Nd/Tm ratio was selected in order to reproduce the ionic size of Sm3+ with CN 8. Stoichiometric due amounts of Ce (Johnson Matthey ALPHA 99.99 wt %), Nd2O3 (Alfa Aesar, 99.99 wt %), and Tm2O3 (Mateck, 99.99 wt %) were separately dissolved in HCl (13 vol %), and the three solutions were mixed. Then, an oxalic acid solution in large excess was poured into the mixtures, causing the immediate precipitation of the mixed Ce/Nd/Tm oxalates, which were then filtered, washed, dried for 12 h, and treated in air at 1373 K for four days to obtain the corresponding mixed oxides with a high crystallinity degree.
2.2. Scanning Electron Microscopy–Energy-Dispersive System (SEM–EDS)
Scanning electron microscopy was used to determine the overall lanthanide content of the samples. An electron microscope with a field-emission gun and energy-dispersive system (FE-SEM-EDS, Zeiss SUPRA 40 VP-30–51 scanning electron microscope, equipped with a high-sensitivity “InLens” secondary electron detector and an EDS microanalysis INCA Suite Version 4.09, Oxford Instruments) was employed for this purpose. Samples were pressed, graphite-coated, and observed at a working distance of 15 mm, with an acceleration voltage of 20 kV. EDS analyses were carried out on at least 5 points for each formulation.
2.3. High-Pressure Synchrotron X-ray Powder Diffraction (HP-XRPD)
X-ray diffraction patterns were collected at ambient and high pressure at the XPRESS diffraction beamline of the Elettra Synchrotron radiation facility located in Trieste (Italy).43 Data were acquired by a monochromatic circular beam with a wavelength of 0.4957 Å and diameter around 50 μm at pressures ranging between 0 and ∼6 GPa by means of a gear-driven Boehler–Almax plate diamond anvil cell (plate DAC) with a large X-ray aperture containing diamonds of culet size 300 μm. Several 200 μm-thick rhenium gaskets were pre-indented using the plate DAC, which allowed to reduce their thickness below 110 μm and to drill a through hole of diameter 100 μm by spark erosion. Specimens were placed into the chamber, and the applied pressure was calibrated by adding Cu and considering the position of the (111) diffraction peak. Silicon oil was used as the pressure-transmitting medium (PTM), as it was able to provide hydrostatic pressure conditions up to the maximum applied pressure. The experimental setup is provided with a MAR345 image plate detector, and images of the diffraction rings were converted into intensity vs 2ϑ plots through the fit2D software.44 Data were collected in the 5–25° angular range at least three times after reaching every new value of applied pressure in order to check their reproducibility. The samples were named NdTm10_2.68, NdTm20_4.23, and so on, in accordance with the nominal (Nd,Tm) atomic percent with respect to the total rare earth content, with the applied pressure in GPa.
Structural models were refined through the Rietveld method by the FullProf software.45 With specific regard to the refinement procedure, the peak profile was described by a pseudo-Voigt function, the background was refined by interpolating a set of ∼60 points taken from the pattern, and an overall displacement parameter (Bov) was optimized too. The Ce/Nd/Tm ratio was set at the values provided by EDS and kept fixed, due to the closeness of the atomic scattering factors of the three cited elements. In the last refinement cycle, the lattice parameters, the refinable atomic coordinates, Bov, the scale factor, five peak parameters, two asymmetry parameters, and the background points were refined. The angular regions where Cu diffraction peaks occur were excluded from the refinements. In Figure 1, the Rietveld refinement plot of sample NdTm30_2.73 is reported as a representative example of the results of structural modeling.
Figure 1.
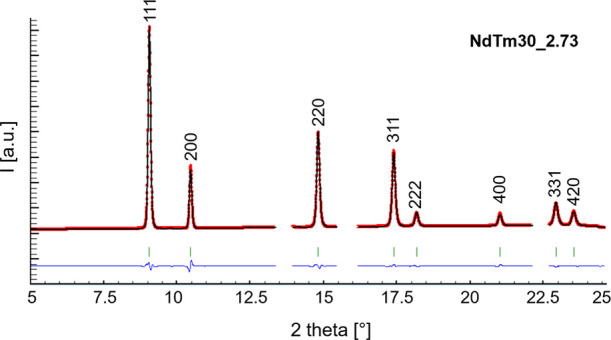
Rietveld refinement plot of sample NdTm30_2.73. The red dotted and the black continuous lines depict the experimental and calculated pattern, respectively; the blue lower line is the difference curve; vertical bars indicate the calculated positions of Bragg peaks. Miller indexes of the F structure (space group Fm3̅m) are reported. Excluded regions are placed corresponding to the Bragg peaks of Cu.
The trend of the lattice volume vs pressure was modeled through the EosFit7-Gui software46 by the third-order Vinet EoS,47 which is expressed by the following equation
| 1 |
with
| 2 |
| 3 |
with
| 4 |
being the bulk modulus at zero applied pressure, K0′ its first derivative with respect to pressure, and V0 the cell volume at ambient conditions. The third-order Vinet EoS fits the model to the data by refining V0, K0, and K0; hence, once they reach convergence by least-squares minimization of the difference between experimental and calculated data, the software provides the values of the refined parameters together with their standard deviations.
High-pressure structural results obtained from the present system are compared to the ones derived from Sm-39 and Lu-40 doped ceria, as well as to those obtained at ambient pressure from the same (Nd,Tm)-doped system.11
3. Results
EDS analyses performed on the (Nd,Tm)-doped system provided the results reported in Table 1, showing a good agreement between nominal and experimental x values. Similar results were found for Sm-39 and Lu-40 doped ceria.
Table 1. Experimental x Values of Ce1–x(Nd0.74Tm0.26)xO2–x/2 Samples.
| sample | experimental x |
|---|---|
| NdTm10 | 0.09(1) |
| NdTm20 | 0.18(4) |
| NdTm30 | 0.26(4) |
| NdTm40 | 0.37(5) |
| NdTm50 | 0.45(4) |
| NdTm60 | 0.57(9) |
In full agreement with the outcome of the ambient-pressure X-ray acquisitions,11 even at high pressure the F/H crossover is located at x slightly lower than 0.6, with the composition Ce0.4(Nd0.74Tm0.26)0.6O1.7 being the only one displaying C-related peaks. This behavior, also common to the Ce1–x(Nd0.63Dy0.37)xO2–x/2 system,10 marks a substantial difference between these doubly doped systems and Sm-doped ceria, where peaks of the superstructure become visible at x ∼ 0.3.26
Figure 2 reports the stacked diffraction patterns of sample NdTm10 at different applied pressures, and the inset shows an enlarged view of the main peak as a representative example of the behavior of all of the considered compositions. As already observed in Sm-39 and Lu-40 doped ceria, no structural changes occur with increasing pressure up to ∼7 GPa. The most important effects exerted on the Bragg peaks by the pressure application are the shift toward higher 2θ values, as well as the decrease of the broadening and intensity. The latter, in particular, can be inferred from the inset to Figure 2, but even more clearly from Figure 3, representing the full-width half-maximum (FWHM) trend of the most intense peak as a function of the applied pressure: a significant FWHM increase occurs starting from ∼1 GPa. The described evidences are related to two effects, namely the reduction of the mean lattice parameter due to compression, which causes the peak shift, and the local distribution of cell sizes, responsible for the peak broadening. Refined lattice parameters and Rietveld agreement factors for each composition at each pressure, as well as crystallographic data of both F and H phases, are reported in the Supporting Information.
Figure 2.

Stacked diffraction patterns of sample NdTm10; asterisks mark the presence of Cu used for pressure calibration. Inset: enlarged view of the main peak.
Figure 3.
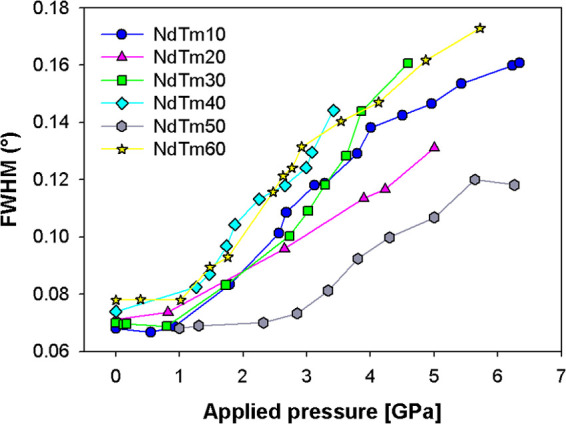
FWHM trend of the most intense reflection, namely (111) for the F model and (222) for the H model, vs applied pressure.
As aforementioned, the trend of the cell volume vs applied pressure was analyzed using the third-order Vinet EoS in order to estimate the bulk modulus at zero pressure (K0). Graphical results of the fit, appearing in Figure 4, suggest that the cell volume decrease is not linear within the pressure range considered, generally becoming progressively less steep, thus indicating a compressibility reduction with increase in the applied pressure.
Figure 4.

Refined cell volumes as a function of the applied pressure; the third-order Vinet EoS fits the model to the data. Cell volumes of samples crystallizing in the F phase are multiplied by 8 in order to make them comparable to the one assuming the C structure. Vertical error bars are hidden by data markers.
The calculated values of K0 for (Nd,Tm)- and Sm-39 doped ceria, as well of CeO2,48 are reported vs the doping content in Figure 5. A roughly linear decrease can be observed in both systems, together with a slight upturn at the highest x values. For the sake of completeness, the K0′ values obtained from the fit are reported in the Supporting Information in Table S3.
Figure 5.

Zero pressure bulk modulus (K0) vs the doping content for (Nd,Tm)- and Sm-39 doped ceria; the CeO2 data are taken from ref (48).
4. Discussion
Anderson and Nafe analyzed the K0 values and structural data of a huge variety of ionic crystals, covalent crystals, and oxides,41 brilliantly finding the following empirical correlations, valid for ionic crystals (eq 5) and for covalent crystals and oxides (eq 6)
| 5 |
| 6 |
where Z1 and Z2 are the cationic and anionic charge, respectively, in ionic crystals, and 2Vat the lattice volume divided by the halved number of atoms therein contained; for oxides, m occurring in eq 6 ranges between 3 and 4, while for covalent crystals it assumes the value 4/3. In all of the classes of materials, a decreasing linear trend is thus observed, accounting for the progressively increasing compressibility of a solid with increase in the mean atomic volume. Moreover, based on eqs 5 and 6, the oxides result to be characterized by a much stronger dependence of K0 on the atomic volume than both ionic and covalent crystals.
In order to fit the experimental data to the described expected trend, for each composition of (Nd,Tm)-doped ceria the atomic volume Vat calculated from the oxide stoichiometry was associated to the K0 value obtained from the EoS: the elaboration provided the results appearing in Figure 6, where also the data of Sm-doped ceria39 are reported. The black thick line represents the expected trend for oxides according to Anderson and Nafe,41 obtained by attributing to m the value 3.5, which is intermediate between the suggested end values,41 and constraining the line to pass through the point corresponding to ln K0 and ln(2Vat) of CeO2.48 The expected trend is described by the following equation
| 7 |
Figure 6.

Behavior of ln K0 vs ln(2Vat). K0 and Vat values are derived from EoS fits and Rietveld refinements, respectively. Data of CeO2 are taken from ref (48). Cell volumes of samples crystallizing in the F phase are multiplied by 8 in order to make them comparable to those assuming the C structure.
At this stage, it is worth mentioning that a possible inaccuracy of the slope value, caused by the absence of hints orienting a more precise choice of m, can be at the root of the corresponding slight inaccuracies in the absolute values of the F/C distribution of the RE3+ ions, but not in the recognition of the general trend. The data of both systems deviate from the predicted trend toward lower ln K0 values, showing a much more pronounced dependence of ln K0 on ln(2Vat), which results in a low doping content at m ∼ 6; in addition, while the data of Sm-doped ceria display a roughly linear trend along the whole compositional range, the ones of the doubly doped system present a substantial superposition with the former system up to x = 0.3, a significant drop at higher x, and a reconnection close to x = 0.6.
As aforementioned, the F phase can be defined as a CeO2-based solid solution hosting two different guests: the prevailing one consists of isolated RECe′ defects and randomly distributed oxygen vacancies, both of which are accommodated at the F crystallographic positions, namely at the Ce and the O site, respectively; the minor one is constituted of a certain amount of associated RE3+ ions and vacancies, mainly giving rise to either 1VORECe′ or 1VO2RECe′ C-based clusters. Below the x value corresponding to the F limit, the amount of isolated RECe defects largely prevails over that of the C defect aggregates; nonetheless, even in the absence of C diffraction peaks, the latter are present, as testified by the occurrence of the typical C band in Raman spectra,12,27 as well as by the drop in ionic conductivity in Gd- and Sm-doped ceria at x > 0.15–0.20,49 namely well below the F boundary as revealed by X-ray diffraction. Similarly, it is reasonable to suppose that even beyond the F limit, both isolated RECe′ defect and C defect aggregates are present, with the latter prevailing over the former.
Since the bulk modulus K0 derives from the Rietveld refinement of the F cell volumes, it refers to the F phase; thus, the substantial deviation of ln K0 from the trend typical of oxides suggests that the actual atomic volume does not correspond to the one deduced from the oxide stoichiometry, which is to say that the oxide overall stoichiometry and the actual composition of the F phase do not coincide. Starting from this discrepancy, the proper manipulation of K0 data provides a hint for the estimate of the C defect amount, and hence of the actual composition of the F phase, as described hereinafter. The observed evidence suggests that in both systems, for each ln K0 value the F mean atomic volume Vat is underestimated (i.e., the total number of atoms in F is overestimated) if compared to the expected value as derived from the theoretical trend represented in Figure 6. Therefore, the expected ln 2Vat value (and consequently the expected Vat) was determined for each composition by inserting the corresponding ln K0 value into eq 7, which describes the ideal behavior of the oxides. Afterward, the corrected number of atoms per F cell was calculated by dividing the refined zero pressure cell volume (V0) by the so-obtained Vat. The difference between the stoichiometric and corrected number of atoms per cell represents the amount of RE and O atoms not taking part in the F phase, thus forming the C defect clusters. According to the RE2O3 stoichiometry of C oxides, out of the total number of atoms forming the C defect clusters, 40% were attributed to RE and 60% to O. In doubly doped ceria, the preferential entrance into C defect clusters of Tm3+ with respect to Nd3+ was hypothesized as being due to the higher binding energy of C defect aggregates containing smaller RE ions, as discussed in ref (11). An example of this approach is reported in detail in the Supporting Information. Following from the described calculations, Table 2 shows how atoms belonging to a Ce1–x(Nd0.74Tm0.26)xO2–x/2 formula unit distribute over the F and C phases. For comparison, in Table 3, the distribution of doping ions over F and C in Sm- and Lu-doped ceria is reported too, as resulting from the identical calculations performed on the K0 data derived from a previous study.39 Data are reported up to x = 0.60 and 0.40 for Sm- and Lu-doped ceria, respectively; it has to be noticed that in terms of X-ray diffraction, the F region extends up to x = 0.30 for the former system and up to x = 0.40 for the latter.
Table 2. Distribution of Atoms of a Ce1–x(Nd0.74Tm0.26)xO2–x/2 Formula Unit between the F and the C Phase.
| sample name | overall nominal oxide composition | composition of the F phase | composition of the C phase |
|---|---|---|---|
| NdTm10 | Ce0.90(Nd0.74Tm0.26)0.10O1.95 | Ce0.90Nd0.06O1.89 | Nd0.014Tm0.026O0.06 |
| NdTm20 | Ce0.80(Nd0.74Tm0.26)0.20O1.90 | Ce0.80Nd0.15O1.825 | Tm0.05O0.075 |
| NdTm30 | Ce0.70(Nd0.74Tm0.26)0.30O1.85 | Ce0.70Nd0.22O1.73 | Tm0.08O0.12 |
| NdTm40 | Ce0.60(Nd0.74Tm0.26)0.40O1.80 | Ce0.60Nd0.17O1.45 | Nd0.13Tm0.10O0.35 |
| NdTm50 | Ce0.50(Nd0.74Tm0.26)0.50O1.75 | Ce0.50Nd0.37Tm0.02O1.58 | Tm0.11O0.17 |
| NdTm60 | Ce0.40(Nd0.74Tm0.26)0.60O1.70 | Ce0.40Tm0.09Nd0.26O1.32 | Nd0.18Tm0.07O0.375 |
Table 3. Distribution of Atoms of a Ce1–xSmxO2–x/2 and a Ce1–xLuxO2–x/2 Formula Unit between the F and the C Phase.
| sample name | overall nominal oxide composition | composition of the F phase | composition of the C phase |
|---|---|---|---|
| Sm20 | Ce0.80Sm0.20O1.90 | Ce0.80Sm0.15O1.825 | Sm0.05O0.075 |
| Sm30 | Ce0.70Sm0.30O1.85 | Ce0.70Sm0.26O1.79 | Sm0.04O0.06 |
| Sm40 | Ce0.60Sm0.40O1.80 | Ce0.60Sm0.34O1.71 | Sm0.06O0.09 |
| Sm50 | Ce0.50Sm0.50O1.75 | Ce0.50Sm0.38O1.57 | Sm0.12O0.18 |
| Sm60 | Ce0.40Sm0.60O1.70 | Ce0.40Sm0.52O1.58 | Sm0.08O0.12 |
| Lu10 | Ce0.90Lu0.10O1.95 | Ce0.90O1.80 | Lu0.10O0.15 |
| Lu20 | Ce0.80Lu0.20O1.90 | Ce0.80Lu0.06O1.69 | Lu0.14O0.21 |
| Lu30 | Ce0.70 Lu0.30O1.85 | Ce0.70Lu0.15O1.625 | Lu0.15O0.225 |
| Lu40 | Ce0.60 Lu0.40O1.80 | Ce0.60Lu0.23O1.545 | Lu0.17O0.255 |
Two general observations can be done at a first glance. First of all, it can be noticed that in each system, even at the minimum considered RE3+ amount (x = 0.10), a measurable fraction of the doping atoms do not enter the F phase. This fraction becomes larger with increasing x, and even beyond the F boundary the composition of the F phase keeps incorporating RE3+ ions, thus implying that doping ions spontaneously divide into the F and C phases at each composition. Secondly, in the doubly doped system, the RE3+ amount occurring in C is generally higher than in Sm-doped ceria, and the gap between the two systems becomes wider with increasing x. In order to get further insight into the latter issue, the data collected from the Lu-doped system40 were taken into account too and are reported in the last part of Table 3: at each x, an even larger portion of doping ions enters the C domains. This evidence, namely the Lu > (Nd,Tm) > Sm order ruling the tendency toward the formation of C domains, seems thus to follow from the above-mentioned higher binding energy of C defect aggregates made up of smaller rare earth ions, which favors their formation.
A confirmation of the existence of C-based nanodomains even at a very low RE3+ amount can be found in the smaller coordination number of RE3+ with respect to Ce4+ and in the progressive reduction of the RE–O distances with increase in the RE3+ amount as revealed by EXAFS24,50−53 and total scattering.28,54 Moreover, similar conclusions were also reached as a result of the computational simulations performed by the density-functional theory (DFT) method.55 Therefore, it is reasonable to hypothesize that even in the studied systems, RE3+ ions and oxygen vacancies not entering the F structure tend to aggregate in the C form even at the lowest RE3+ concentration considered. In the light of the previous considerations, there is thus reason to wonder why C defect aggregates become detectable by X-ray diffraction when they reach different concentrations, according to the system: in fact, while in Sm-doped ceria at the upper F limit, namely at x = 0.30, the composition of the C phase is Sm0.04O0.06, in (Nd,Tm)-doped ceria, again at the upper F limit, namely at x = 0.50, it is Tm0.11O0.17, and in Lu40 in correspondence of the same limit (x = 0.40), it is Lu0.17O0.255, as inferable from Table 1. In other words, the detectability of C domains is minimum in Lu-doped ceria, and it increases in the order Lu < (Nd,Tm) < Sm. This issue can be overcome by taking into account that the detectability of a diffraction domain is strictly related to the spatial correlation of its structural order: nanodomains of a certain phase occurring within a matrix can be undetectable by X-ray diffraction irrespective of their concentrations provided that they are sufficiently dispersed, namely that their structural order does not exceed the local scale. On this matter, the role of total scattering analyzed by the pair distribution function (PDF) techniqueis essential, since it is able to reveal local distortions invisible to X-ray diffraction. Diffraction domains can be detected when their size goes beyond a certain threshold, i.e., when the domains associate. In this respect, the detectability of C domains and the amount of C-based domains at the upper F limit, which follow opposite orders, suggest that Sm-based C domains are the most prone to associate but the most difficult to form, while the opposite happens for the Lu-based ones, with the (Nd,Tm)-based system showing an intermediate behavior. It can be thus inferred that the driving force for the formation of domains is the defects’ binding energy, while the association of domains favors their stabilization. Considering all these issues, the behavior of C defect aggregates as a function of the RE element seems to resemble that of crystallization nuclei within a liquid mass as a function of temperature. In that case, the critical size of the nuclei decreases and correspondingly the nucleation rate increases, with increasing undercooling; the growth rate, on the contrary, is higher when the undercooling is less pronounced, so that less nuclei form and only the sufficiently large ones are stable. Analogously, in our systems, the higher the binding energy (i.e., the smaller the RE3+ ion), the higher the nucleation rate and the smaller the critical size of domains, which explains the occurrence of large amounts of highly dispersed small C domains, not detectable by X-ray diffraction in spite of their numerousness; for lower binding energies (i.e., for larger RE3+ ions), the stability of C domains is ensured by their growth beyond a threshold size depending on the RE element, which makes C domains detectable by X-ray diffraction even when they are present in a relatively low amount.
This interpretation is in good agreement with data derived from measurements of the transport properties of the present and similar systems. It is well known that, if extrinsic parameters such as preparation and annealing conditions are neglected, ionic conductivity in doped ceria varies as a function of the chemical nature and concentration of the doping ion. Nonetheless, while the highest conductivity values are strictly correlated to the RE3+ nature, being provided by Nd-, Sm-, and Gd-doped ceria,4 and in general by proper doubly doped systems,56 the dependence on the RE3+ amount is roughly the same for each doping ion: ionic conductivity presents in fact a maximum at x ranging between 0.10 and 0.25 for Lu-,57 (Nd,Tm)-11 and Sm-58 doped ceria, not differently from Y-doped ceria,59 for example. This evidence corroborates the idea that ionic conductivity is negatively affected by the presence of C defect aggregates; their size and hence their detectability by X-ray diffraction, on the contrary, do not play any relevant role. Therefore, it can be concluded that a wide stability region of the F phase, being determined by the high dispersion degree and by the small size of C defect aggregates, is not expected to induce high and exploitable values of ionic conductivity over a correspondingly large compositional extent, as indeed experimentally observed in many doped ceria systems.
5. Conclusions
A high-pressure X-ray diffraction study was systematically performed up to ∼6 GPa on six compositions belonging to the Ce1–x(Nd0.74Tm0.26)xO2–x/2 system (x = 0.10–0.60) with the aim of developing a new approach for the evaluation of the defect aggregate content, due to their prominent role in reducing the ionic conductivity of the material. The treatment was extended to data previously collected from Sm- and Lu-doped ceria in order to comparatively discuss the three systems.
Three main conclusions can be drawn from the results of the study.
Even at the lowest considered x value, doping ions form defect aggregates; their amount increases with increasing RE3+ content and decreasing RE3+ size.
Small RE3+ ions give rise to numerous tiny defect domains, which cannot be revealed by X-ray diffraction due to their reduced spatial correlation until they associate and reach a sufficiently large size. This evidence can be correlated with the defects’ binding energy, which is higher for defects containing smaller doping ions, thus favoring a high nucleation rate in comparison to the growth rate.
The occurrence of C defect associates even at a very low doping content contributes to clarify the reasons behind the drop in ionic conductivity observed in many Ce1–xRExO2–x/2 systems starting from x = 0.10 to 0.15. The results of this study suggest that the movement of oxygen vacancies through the lattice is hindered by the presence of defects irrespective of their size.
Acknowledgments
This work was financially supported by Compagnia di San Paolo, in the frame of the project COLEUS—ID ROL: 32604.
Supporting Information Available
The Supporting Information is available free of charge at https://pubs.acs.org/doi/10.1021/acs.inorgchem.1c00433.
Structural models of the F, H and C phases; refined cell parameters and agreement factors of Rietveld refinements; K0′ values obtained from the fit of the model to data by the third order Vinet EoS; example of calculation of the distribution of RE3+ ions over the F and the C phase; crystallographic data of the F and the H phase (PDF)
The authors declare no competing financial interest.
Supplementary Material
References
- Mogensen M.; Sammes N. M.; Tompsett G. A. Physical, Chemical and electrochemical properties of pure and doped ceria. Solid State Ionics 2000, 129, 63–94. 10.1016/S0167-2738(99)00318-5. [DOI] [Google Scholar]
- Jiang S. P. Development of lanthanum strontium cobalt ferrite perovskite electrodes of solid oxide fuel cells—A review. Int. J. Hydrogen Energy 2019, 44, 7448–7493. 10.1016/j.ijhydene.2019.01.212. [DOI] [Google Scholar]
- Artini C. RE-doped ceria systems and their performance as solid electrolytes: a puzzling tangle of structural issues at the average and local scale. Inorg. Chem. 2018, 57, 13047–13062. 10.1021/acs.inorgchem.8b02131. [DOI] [PubMed] [Google Scholar]
- Omar S.; Wachsman E. D.; Jones J. L.; Nino J. C. Crystal structure-ionic conductivity relationships in doped ceria systems. J. Am. Ceram. Soc. 2009, 9, 2674–2681. 10.1111/j.1551-2916.2009.03273.x. [DOI] [Google Scholar]
- Anirban S. K.; Dutta A. Revisiting ionic conductivity of rare earth doped ceria: Dependency on different factors. Int. J. Hydrogen Energy 2020, 45, 25139–25166. 10.1016/j.ijhydene.2020.06.119. [DOI] [Google Scholar]
- Eyring L.Handbook on the Physics and Chemistry of Rare Earths; Gschneidner K. A. Jr; Eyring L., Eds.; Elsevier: North Holland, Amsterdam, 1979; pp 337–399. [Google Scholar]
- Li Z. P.; Mori T.; Zou J.; Drennan J. Defects clustering and ordering in di- and trivalently doped ceria. Mater. Res. Bull. 2013, 48, 807–812. 10.1016/j.materresbull.2012.11.073. [DOI] [Google Scholar]
- Costa G. A.; Artini C.; Ubaldini A.; Carnasciali M. M.; Mele P.; Masini R. Phase stability study of the pseudobinary system Gd2O3-Nd2O3 (T ≤ 1350 °C). J. Therm. Anal. Calorim. 2008, 92, 101–104. 10.1007/s10973-007-8744-x. [DOI] [Google Scholar]
- Artini C.; Carnasciali M. M.; Costa G. A.; Plaisier J. R.; Pani M. A novel method for the evaluation of the Rare Earth (RE) coordination number in RE-doped ceria through Raman spectroscopy. Solid State Ionics 2017, 311, 90–97. 10.1016/j.ssi.2017.09.016. [DOI] [Google Scholar]
- Artini C.; Gigli L.; Carnasciali M. M.; Pani M. Structural properties of the (Nd,Dy)-doped ceria system by synchrotron X-ray diffraction. Inorganics 2019, 7, 94 10.3390/inorganics7080094. [DOI] [Google Scholar]
- Artini C.; Presto S.; Viviani M.; Massardo S.; Carnasciali M. M.; Gigli L.; Pani M. The role of defects association in structural and transport properties of the Ce1-x(Nd0.74Tm0.26)xO2-x/2 system. J. Energy Chem. 2021, 60, 494–502. 10.1016/j.jechem.2020.11.030. [DOI] [Google Scholar]
- Artini C.; Pani M.; Carnasciali M. M.; Plaisier J. R.; Costa G. A. Lu-, Sm- and Gd-doped ceria: a comparative approach to their structural properties. Inorg. Chem. 2016, 55, 10567–10579. 10.1021/acs.inorgchem.6b01806. [DOI] [PubMed] [Google Scholar]
- Artini C.; Costa G. A.; Pani M.; Lausi A.; Plaisier J. Structural characterization of the CeO2/Gd2O3 mixed system by synchrotron x-ray diffraction. J. Solid State Chem. 2012, 190, 24–28. 10.1016/j.jssc.2012.01.056. [DOI] [Google Scholar]
- Artini C.; Pani M.; Lausi A.; Masini R.; Costa G. A. High temperature structural study of Gd-doped ceria by synchrotron X-ray diffraction (673 K ≤ T ≤ 1073 K). Inorg. Chem. 2014, 53, 10140–10149. 10.1021/ic5011242. [DOI] [PubMed] [Google Scholar]
- Minervini L.; Zacate M. O.; Grimes R. W. Defect cluster formation in M2O3-doped CeO2. Solid State Ionics 1999, 116, 339–349. 10.1016/S0167-2738(98)00359-2. [DOI] [Google Scholar]
- Wei X.; Pan W.; Cheng L.; Li B. Atomistic calculation of association energy in doped ceria. Solid State Ionics 2009, 180, 13–17. 10.1016/j.ssi.2008.10.019. [DOI] [Google Scholar]
- Ou D. R.; Ye F.; Mori T. Defect clustering and local ordering in rare earth co-doped ceria. Phys. Chem. Chem. Phys. 2011, 13, 9554–9560. 10.1039/c0cp02174a. [DOI] [PubMed] [Google Scholar]
- Ye F.; Mori T.; Ou D.; Cormack A. N. Dopant type dependency of domain development in rare-earth-doped ceria: An explanation by computer simulation of defect clusters. Solid State Ionics 2009, 180, 1127–1132. 10.1016/j.ssi.2009.06.002. [DOI] [Google Scholar]
- Rushton M. J. D.; Chroneos A.; Skinner S. J.; Kilner J. A.; Grimes R. W. Effect of strain on the oxygen diffusion in yttria and gadolinia co-doped ceria. Solid State Ionics 2013, 230, 37–42. 10.1016/j.ssi.2012.09.015. [DOI] [Google Scholar]
- Koettgen J.; Grieshammer S.; Hein P.; Grope B. O. H.; Nakayama M.; Martin M. Understanding the ionic conductivity maximum in doped ceria: trapping and blocking. Phys. Chem. Chem. Phys. 2018, 20, 14291–14321. 10.1039/C7CP08535D. [DOI] [PubMed] [Google Scholar]
- Ou D. R.; Mori T.; Ye F.; Zou J.; Auchterlonie G.; Drennan J. Oxygen-vacancy ordering in lanthanide-doped ceria: dopant-type dependence and structure model. Phys. Rev. B 2008, 77, 024108 10.1103/PhysRevB.77.024108. [DOI] [Google Scholar]
- Ye F.; Mori T.; Ou D. R.; Zou J.; Drennan J. A structure model of nano-sized domain in Gd-doped ceria. Solid State Ionics 2009, 180, 1414–1420. 10.1016/j.ssi.2009.08.013. [DOI] [Google Scholar]
- Deguchi H.; Yoshida H.; Inagaki T.; Horiuchi M. EXAFS study of doped ceria using multiple data set fit. Solid State Ionics 2005, 176, 1817–1825. 10.1016/j.ssi.2005.04.043. [DOI] [Google Scholar]
- Nitani H.; Nakagawa T.; Yamanouchi M.; Osuki T.; Yuya M.; Yamamoto T. A. XAFS and XRD study of ceria doped with Pr, Nd and Sm. Mater. Lett. 2004, 58, 2076–2081. 10.1016/j.matlet.2004.01.005. [DOI] [Google Scholar]
- Schmitt R.; Nenning A.; Kraynis O.; Korobko R.; Frenkel A. I.; Lubomirsky I.; Haile S. M.; Rupp J. L. M. A review of defect structure and chemistry in ceria and its solid solutions. Chem. Soc. Rev. 2020, 49, 554–592. 10.1039/C9CS00588A. [DOI] [PubMed] [Google Scholar]
- McBride J. R.; Hass K. C.; Pointdexter B. D.; Weber W. H. Raman and x-ray studies of Ce1-xRExO2-y, where RE=La, Pr, Nd, Eu, Gd, and Tb. J. Appl. Phys. 1994, 76, 2435–2441. 10.1063/1.357593. [DOI] [Google Scholar]
- Artini C.; Pani M.; Carnasciali M. M.; Buscaglia M. T.; Plaisier J.; Costa G. A. Structural features of Sm- and Gd-doped ceria studied by synchrotron X-ray diffraction and μ-Raman spectroscopy. Inorg. Chem. 2015, 54, 4126–4137. 10.1021/acs.inorgchem.5b00395. [DOI] [PubMed] [Google Scholar]
- Scavini M.; Coduri M.; Allieta M.; Brunelli M.; Ferrero C. Probing complex disorder in Ce1-xGdxO2-x/2 using the pair distribution function analysis. Chem. Mater. 2012, 24, 1338–1345. 10.1021/cm203819u. [DOI] [Google Scholar]
- Coduri M.; Scavini M.; Pani M.; Carnasciali M. M.; Klein H.; Artini C. From nano to microcrystals: effect of different synthetic pathways on defects architecture in heavily Gd-doped ceria. Phys. Chem. Chem. Phys. 2017, 19, 11612–11630. 10.1039/C6CP08173H. [DOI] [PubMed] [Google Scholar]
- Guan X.; Zhou H.; Liu Z.; Wang Y.; Zhang J. High performance Gd3+ and Y3+ co-doped ceria-based electrolytes for intermediate temperature solid oxide fuel cells. Mater. Res. Bull. 2008, 43, 1046–1054. 10.1016/j.materresbull.2007.04.027. [DOI] [Google Scholar]
- Coles-Aldridge A. V.; Baker R. T. Ionic conductivity in multiply substituted ceria-based electrolytes. Solid State Ionics 2018, 316, 9–19. 10.1016/j.ssi.2017.12.013. [DOI] [Google Scholar]
- Gupta M.; Shirbhate S.; Ojha P.; Acharya S. Processing and conductivity behavior of La, Sm, Fe singly and doubly doped ceria: As electrolytes for IT-SOFCs. Solid State Ionics 2018, 320, 199–209. 10.1016/j.ssi.2018.03.005. [DOI] [Google Scholar]
- Omar S.; Wachsman E.; Nino J. Higher conductivity Sm3+ and Nd3+ co-doped ceria-based electrolyte materials. Solid State Ionics 2008, 178, 1890–1897. 10.1016/j.ssi.2007.12.069. [DOI] [Google Scholar]
- Arabacı A.; Altınçekiç T. G.; Der M.; Öksüzömer M. A. F. Preparation and properties of ceramic electrolytes in the Nd and Gd Co-doped ceria systems prepared by polyol method. J. Alloys Compd. 2019, 792, 1141–1149. 10.1016/j.jallcom.2019.04.098. [DOI] [Google Scholar]
- Venkataramana K.; Madhuri C.; Madhusudan C.; Suresh Reddy Y.; Bhikshamaiah G.; Vishnuvardhan C. Reddy, Investigation on La3+ and Dy3+ co-doped ceria ceramics with an optimized average atomic number of dopants for electrolytes in IT-SOFCs. Ceram. Int. 2018, 44, 6300–6310. 10.1016/j.ceramint.2018.01.020. [DOI] [Google Scholar]
- Venkataramana K.; Madhuri C.; Madhusudan C.; Suresh Reddy Y.; Vishnuvardhan Reddy C. Investigation on micro-structural, structural, electrical and thermal properties of La3+, Sm3+ & Gd3+ triple-doped ceria as solid-electrolyte for intermediate temperature-solid oxide fuel cell applications. J. Appl. Phys. 2019, 126, 144901 10.1063/1.5113890. [DOI] [Google Scholar]
- Rai A.; Mehta P.; Omar S. Ionic conduction behavior in SmxNd0.15-xCe0.85O2-δ. Solid State Ionics 2014, 263, 190–196. 10.1016/j.ssi.2014.06.009. [DOI] [Google Scholar]
- Spiridigliozzi L.; Dell’Agli G.; Marocco A.; Accardo G.; Pansini M.; Yoon S. P.; Ham H. C.; Frattini D. Engineered coeprecipitation chemistry with ammonium carbonate for scalable synthesis and sintering of improved Sm0.2Ce0.8O1.90 and Gd0.16Pr0.04Ce0.8O1.90 electrolytes for IT-SOFCs. J. Ind. Eng. Chem. 2018, 59, 17–27. 10.1016/j.jiec.2017.10.001. [DOI] [Google Scholar]
- Artini C.; Massardo S.; Carnasciali M. M.; Joseph B.; Pani M. In-situ high pressure structural investigation of Sm-doped ceria. Energies 2020, 13, 1558 10.3390/en13071558. [DOI] [Google Scholar]
- Artini C.; Joseph B.; Costa G. A.; Pani M. Crystallographic properties of Lu-doped ceria, Ce1-xLuxO2-x/2, at pressures up to 7 GPa. Solid State Ionics 2018, 320, 152–158. 10.1016/j.ssi.2018.03.007. [DOI] [Google Scholar]
- Anderson O. L.; Nafe J. E. The bulk modulus-volume relationship for oxides compounds and related geophysical problems. J. Geophys. Res. 1965, 70, 3951–3963. 10.1029/JZ070i016p03951. [DOI] [Google Scholar]
- Artini C.; Costa G. A.; Carnasciali M. M.; Masini R. Stability fields and structural properties of intra rare earths perovskites. J. Alloys Compd. 2010, 494, 336–339. 10.1016/j.jallcom.2010.01.030. [DOI] [Google Scholar]
- Lotti P.; Milani S.; Merlini M.; Joseph B.; Alabarse F.; Lausi A. Single-crystal diffraction at the high-pressure Indo-Italian beamline Xpress at Elettra, Trieste. J. Synchrotron Radiat. 2020, 27, 222–229. 10.1107/S1600577519015170. [DOI] [PubMed] [Google Scholar]
- Hammersley A. P.FIT2D: An Introduction and Overview, European Synchrotron Radiation Facility Internal Report ESRF97HA02T, 1997.
- Rodríguez-Carvajal J. Recent advances in magnetic structure determination by neutron powder diffraction. Phys. B 1993, 192, 55–69. 10.1016/0921-4526(93)90108-I. [DOI] [Google Scholar]
- Gonzalez-Platas J.; Alvaro M.; Nestola F.; Angel R. EosFit7-GUI: a new graphical user interface for equation of state calculations, analyses and teaching. J. Appl. Crystallogr. 2016, 49, 1377–1382. 10.1107/S1600576716008050. [DOI] [Google Scholar]
- Vinet P.; Smith J. R.; Ferrante J.; Rose J. H. Temperature effects on the universal equation of state of solids. Phys. Rev. B 1987, 35, 1945–1953. 10.1103/PhysRevB.35.1945. [DOI] [PubMed] [Google Scholar]
- Hill S. E.; Catlow C. R. A. A Hartree-Fock periodic study of bulk ceria. J. Phys. Chem. Solids 1993, 54, 411–419. 10.1016/0022-3697(93)90322-I. [DOI] [Google Scholar]
- Steele B. C. H. Appraisal of Ce1-yGdyO2-y/2 electrolytes for IT-SOFC operation at 500 °C. Solid State Ionics 2000, 129, 95–110. 10.1016/S0167-2738(99)00319-7. [DOI] [Google Scholar]
- Ohashi T.; Yamazaki S.; Tokunaga T.; Arita Y.; Matsui T.; Harami T.; Kobayashi K. EXAFS study of Ce1-xGdxO2-x/2. Solid State Ionics 1998, 113–115, 559–564. 10.1016/S0167-2738(98)00322-1. [DOI] [Google Scholar]
- Deguchi H.; Yoshida H.; Inagaki T.; Horiuchi M. EXAFS study of doped ceria using multiple set data fit. Solid State Ionics 2005, 176, 1817–1825. 10.1016/j.ssi.2005.04.043. [DOI] [Google Scholar]
- Yamazaki S.; Matsui T.; Ohashi T.; Arita Y. Defect structures in doped CeO2 studied by using XAFS spectrometry. Solid State Ionics 2000, 136–137, 913–920. 10.1016/S0167-2738(00)00569-5. [DOI] [Google Scholar]
- Kossoy A.; Wang Q.; Korobko R.; Grover V.; Feldman Y.; Wachtel E.; Tyagi A. K.; Frenkel A. I.; Lubomirsky I. Evolution of the local structure at the phase transition in CeO2-Gd2O3 solid solutions. Phys. Rev. B 2013, 87, 054101 10.1103/PhysRevB.87.054101. [DOI] [Google Scholar]
- Coduri M.; Checchia S.; Longhi M.; Ceresoli D.; Scavini M. Rare earth doped ceria: The complex connection between structure and properties. Front. Chem. 2018, 6, 526 10.3389/fchem.2018.00526. [DOI] [PMC free article] [PubMed] [Google Scholar]
- Žguns P. A.; Ruban A. V.; Skorodumova N. V. Phase diagram and oxygen-vacancy ordering in the CeO2-Gd2O3 system: a theoretical study. Phys. Chem. Chem. Phys. 2018, 20, 11805–11818. 10.1039/C8CP01029C. [DOI] [PubMed] [Google Scholar]
- Van Herle J.; Seneviratne D.; Mc Evoy A. J. Lanthanide co-doping of solid electrolytes: AC conductivity behaviour. J. Eur. Ceram. Soc. 1999, 19, 837–841. 10.1016/S0955-2219(98)00327-6. [DOI] [Google Scholar]
- Koettgen J.; Dück G.; Martin M. The oxygen ion conductivity of Lu doped ceria. J. Phys.: Condens. Matter 2020, 32, 265402 10.1088/1361-648X/ab7d64. [DOI] [PubMed] [Google Scholar]
- Presto S.; Artini C.; Pani M.; Carnasciali M. M.; Massardo S.; Viviani M. Ionic conductivity and local structural features in Ce1-xSmxO2-x/2. Phys. Chem. Chem. Phys. 2018, 20, 28338–28345. 10.1039/C8CP04186E. [DOI] [PubMed] [Google Scholar]
- Tian C.; Chan S.-W. Ionic conductivities, sintering temperatures and microstructures of bulk ceramic CeO2 doped with Y2O3. Solid State Ionics 2000, 134, 89–102. 10.1016/S0167-2738(00)00717-7. [DOI] [Google Scholar]
Associated Data
This section collects any data citations, data availability statements, or supplementary materials included in this article.