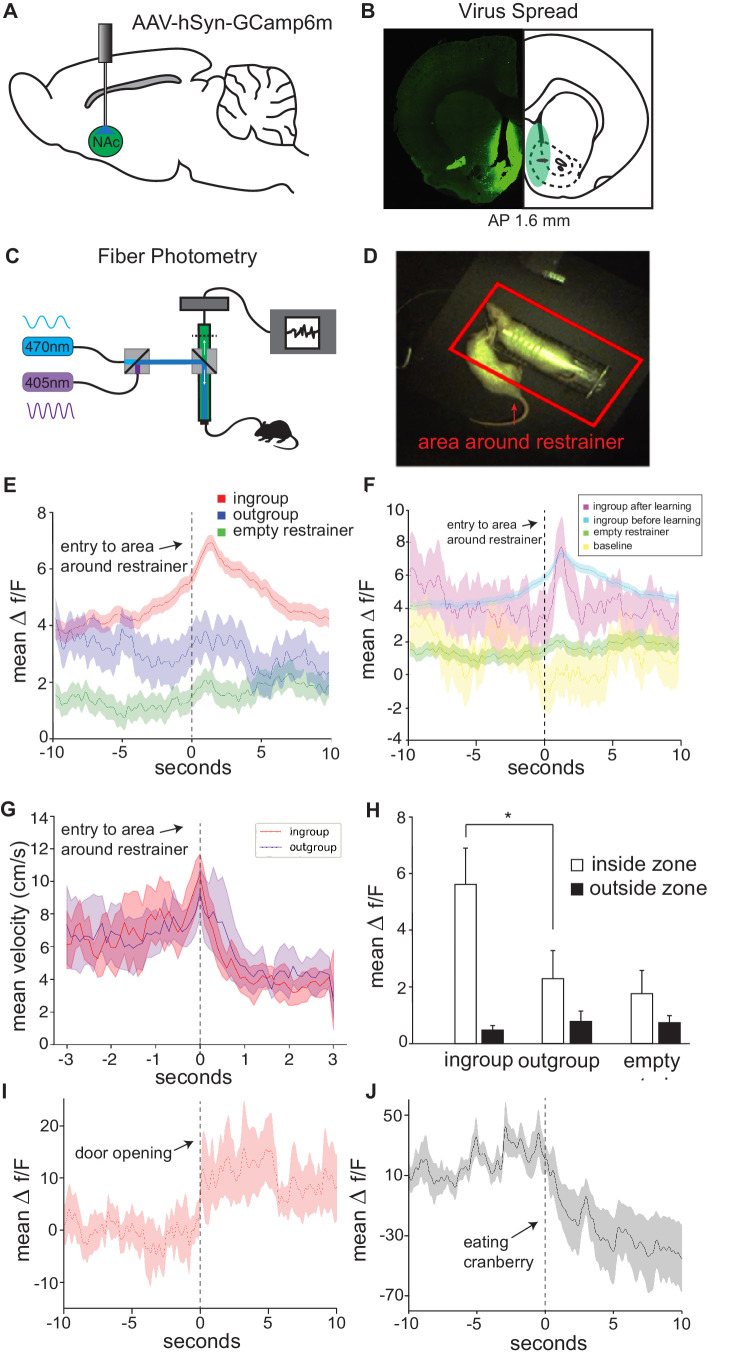
Figure 4. In vivo neural activity in the nucleus accumbens (Nac) corresponds with approach towards an ingroup member.
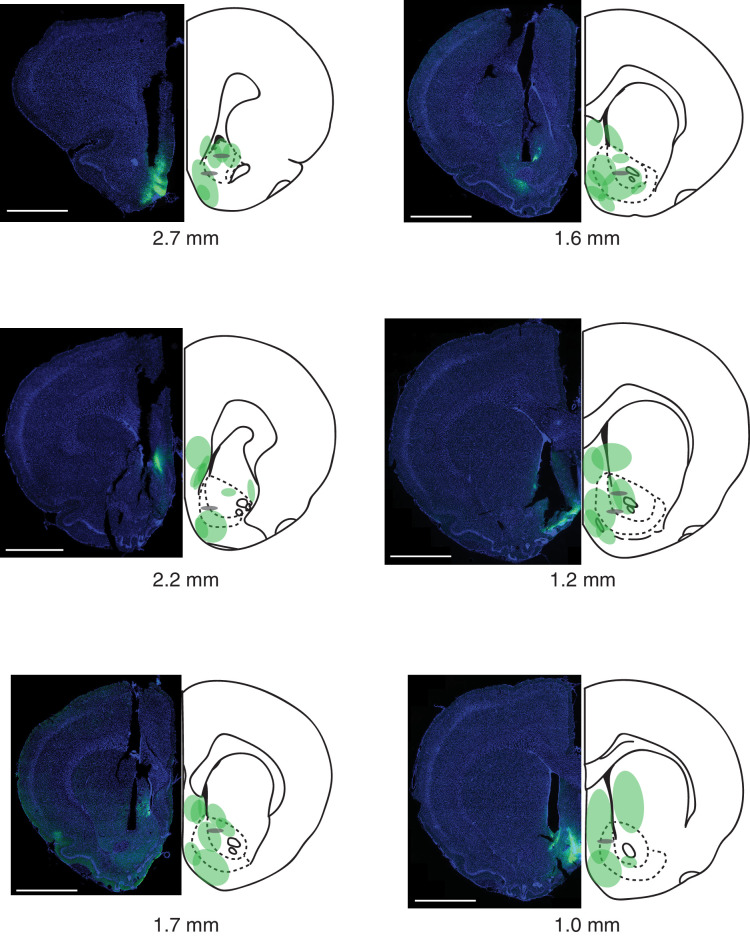
Approaching a trapped ingroup member was associated with increased calcium signal in the Nac. (A) A diagram depicting location of virus injection and optic-fiber implant used for fiber photometry recordings. (B) Example of virus spread in one animal (left) and overlay summary of all animals (right). (C) Diagram of setup used for photometry recordings. (D) Top view of testing arena. The area around the restrainer is depicted by the red rectangle. Entry into the area, defined as when the rat’s body was detected moving from outside this zone to inside this zone, was the point used in the analyses below. (E) Mean neural activity (Δf/F) across rats and testing sessions increased when rats approached a trapped ingroup member (red) but not a trapped outgroup member (blue) or empty restrainer (green). (F) Activity increased both during sessions before (cyan) and after (magenta) rats learned to open the restrainer. No increase was observed while rats were recorded in an empty arena (yellow). (G) Velocity during entry into the zone was not different across conditions (mean ± STDEV). Point of entry into the area around the restrainer is indicated by the dashed line. (H) Neural activity averaged across the whole session (mean ± SEM) was higher for the ingroup when the rat was in the area around the restrainer compared to outside this zone. Activity is also shown around the moment of door-opening (I) or when rats started eating a cranberry on the final session (J).


