Abstract
Background:
Noninvasive measurement of internal dynamic strain can be potentially useful to characterize spine intervertebral disc (IVD) in the setting of injury or degenerative disease.
Purpose:
To develop and demonstrate a noninvasive technique to quantify three-dimensional (3D) internal dynamic strains in the IVD using a combination of static mechanical loading of the IVD using a magnetic resonance imaging (MRI)-compatible ergometer.
Study Type:
Prospective.
Subjects:
Silicone gel phantom studies were conducted to assess strain variation with load and repeatability. Mechanical testing was done on the phantoms to confirm MR results. Eight healthy human volunteers (four men and four woman, age = 29 ± 5 years) underwent MRI using a rest, static loading, and recovery paradigm. Repeatability tests were conducted in three subjects.
Field Strength/Sequence:
MRI (3 T) with 3D continuous golden-angle radial sparse parallel (GRASP) and compressed sensing (CS) reconstruction.
Assessment:
CS reconstruction of the images, motion deformation, and Lagrangian strain maps were calculated for five IVD segments from L1/L2 to L5/S1.
Statistical Tests:
Ranges of displacement and strain in each subject and the resulting mean and standard deviation were calculated. Student t-tests were used to calculate changes in strain from loading to recovery. The correlation coefficient (CC) in the repeatability study was calculated.
Results:
The most compressive strain experienced by the IVD segments under loaded conditions was in the L4/L5 segment (−7.5 ± 2.9%). The change in minimum strain from load to recovery was the most for the L4/L5 segment (−7.5% to −5.0%, P = 0.026) and the least for the L1/L2 segment (−4.4% to −3.9%, P = 0.51). In vivo repeatability in three subjects shows strong correlation between scans in subjects done 6 months apart, with CCs equal to 0.86, 0.94, and 0.94 along principal directions.
Data Conclusion:
This study shows the feasibility of using static mechanical loading with continuous GRASP-MRI acquisition with CS reconstruction to measure 3D internal dynamic strains in the spine IVD.
Level of Evidence:
2
Technical Efficacy Stage:
1
Human intervertebral discs (IVDs) are pads of fibrocartilage that fill the space between the vertebrae of the spine and provide flexibility and cushioning to the spine.1,2 The mechanical properties of the discs are important because they are load bearing and are susceptible to a number of degenerative processes resulting from aging and acute injury.2–7 Accurate characterization of the spine IVDs in situ during loading conditions and monitoring their recovery from loading is important to gain insight about degenerative changes to the tissue.3
Numerous approaches have been utilized to characterize the IVD.8–11 The focus of many studies has been on high-strain-rate injuries using animal or human cadaver models.7,8 Measures such as external displacement, internal pressures, creep, and high loading rate properties have been characterized previously.9,12–15 While these studies provide important data, internal disc mechanics have different characteristics, and quantifying the behavior of internal disc mechanics is technically challenging for in vivo applications in humans.
Magnetic resonance imaging (MRI) offers the opportunity to characterize noninvasively the internal mechanical properties of the IVD. MRI has been used successfully to characterize internal strains in the myocardium16 and internal strain mapping in the human knee articular cartilage.17–19 Displacement-encoded MRI, a method that used tagging of MRI images and allowed for direct displacement measurements, has been shown to characterize internal strains in IVDs using cyclic loading in a two-dimensional plane.20 Three-dimensional (3D) strains have been characterized in ex vivo IVD samples under axial compression using high-resolution MR and image registration techniques.21
Measurement of 3D internal IVD strains using dynamic loading and recovery schemes is challenging due to simultaneous tissue loading and data acquisition requirements and the need for high spatial and temporal resolution. Data acquisition of MRI volume with fast spatial and temporal coverage has been a requirement for dynamic imaging applications.22 A number of advances have helped to increase the efficiency of coverage including parallel imaging techniques such SMASH, SENSE, and GRAPPA.23–25 Compressed sensing (CS) is another strategy that allows undersampling of data below Nyquist criteria to accelerate data acquisition.26 CS methods can be effectively used when the data sampling scheme produces incoherent noise-like artifacts and works well for high-dimensional applications with image sparsity. While a number of modified Cartesian sampling schemes may be used, the incoherence achieved with these techniques does not fully exploit the capabilities of CS reconstructions.
The golden-angle radial sparse parallel (GRASP) technique introduced earlier uses a combination of golden-angle radial trajectory with undersampling CS and parallel imaging. This technique allows for dynamic volumetric imaging with a flexible framework27,28 for MR acquisitions with high temporal and spatial resolution and is well suited for this application requiring synchronization with simultaneous mechanical loading and MRI data acquisition. The aim of this study was to apply the 3D-GRASP technique to quantify and assess 3D internal dynamic strains in the IVD with static mechanical loading of the IVD using an MRI-compatible ergometer.
Materials and Methods
Design of Experiments
In this study, strain was measured by loading the spine IVD with mechanical load. Loading of the spine was achieved using an MRI-compatible ergometer setup as shown in Fig. 1a.The MR-compatible ergometer (Orthospect; Ergospect, Innsbruck, Austria) was kept at the base of the MR scanner table and was able to deliver requisite static mechanical loads to the spine during the imaging using an external controller. The ergometer used pneumatic air resistance to deliver the load with air pressure hoses connecting from the ergometer to the controller and an air compressor located outside the MR scanner room.29 To prevent movement during the loading, the ergometer was placed on a vendor-provided vacuum platform with separate hoses to an external vacuum system outside the MR suite. The schematic in Fig. 1b shows the loading of the spine during the experiment. Compressive force is applied at the foot using the ergometer, and a vendor-provided harness with straps on the shoulder and waist was used to immobilize and minimize volunteer movements during the mechanical loading experiment. The harness was effective at dissipating the fixation pressure between the shoulder and the hips.
FIGURE 1:
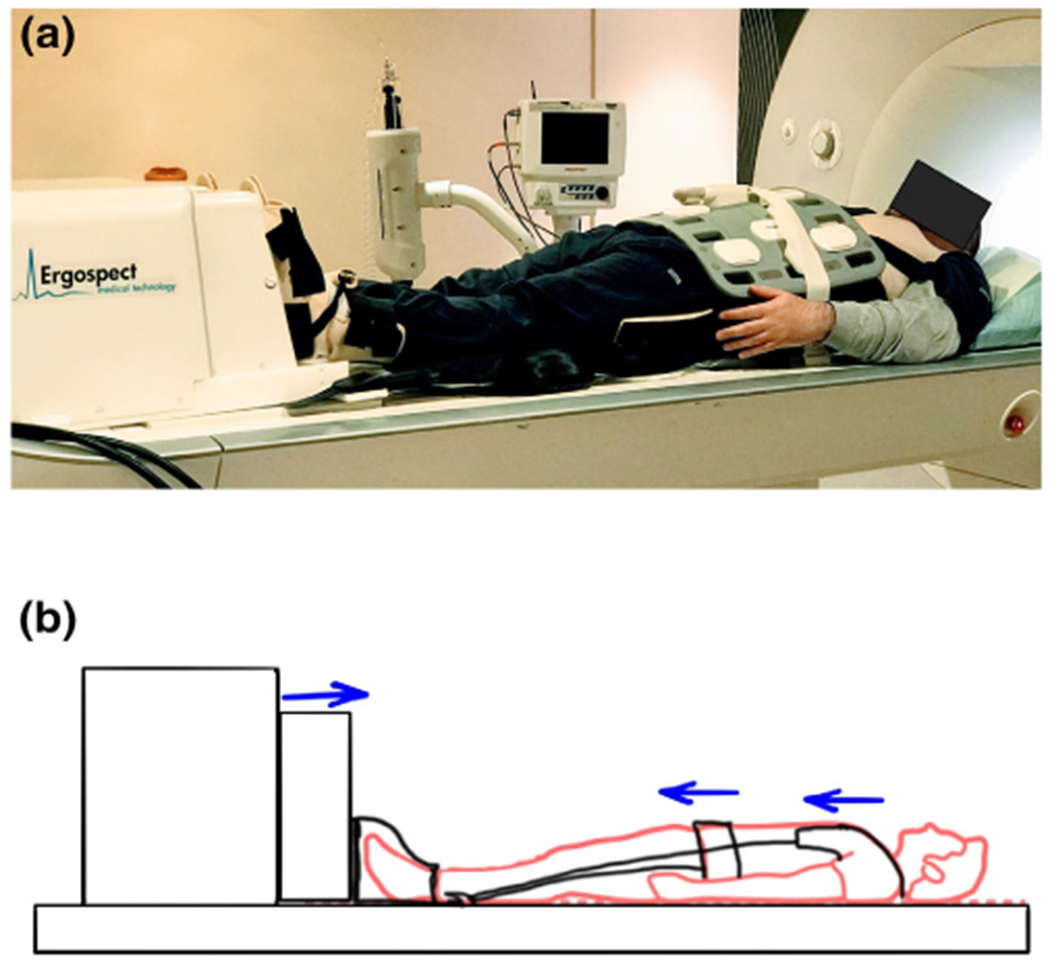
Experiment setup. (a) is the photograph of the experimental setup used for mechanical loading during the magnetic resonance imaging (MRI) scan, and (b) is the schematic of the experimental setup showing how the mechanical load is transferred to the spine. Standing mechanical load is applied at the foot using an ergometer, while the volunteer movement is restricted using a harness that distributes the fixation pressure to the waist and shoulders.
The experiment followed a rest-loading-recovery paradigm with continuous MR scanning done during IVD rest, loading, and recovery. The rest condition lasted for 2 minutes, loading condition for 5 minutes, and the recovery lasted for 5 minutes, respectively. The resting phase was used to establish baseline reference strain levels. During the loading condition, a user-controlled, static mechanical load was delivered to the subject. To determine the loading force to be used, a range of mechanical loading forces were tested. A loading force of 200 N/leg was determined to be comfortable for most subjects to bear during the 5-minute loading section of the imaging scan. With a total force of 400 N being delivered to the IVD, this represented 52.5% of the average body weight of the subject cohort in this study.
GRASP-MRI Protocol and Data Acquisition
All MRI scans were performed with a clinical 3-T MRI scanner (Prisma; Siemens Healthineers, Erlangen, Germany). A vendor-provided multiarray spine coil on the backside of the subject and a flexible 12-channel array coil on the front side of the subject were used. The imaging sequence consisted of a continuous MRI acquisition using a 3D golden-angle stack-of-stars trajectory that acquires in-plane radial spokes (Kx-Ky) and Cartesian sampling in the through-plane dimension. Radial spokes are acquired using a golden-angle ordering scheme, with consecutive spokes rotated by 111.246°.27 The MR imaging parameters were repetition time = 5 msec, echo time = 2.5 msec, flip angle = 12°, field of view = 250 × 250 mm2, slab thickness = 80 mm, matrix size = 256 × 256 × 40, voxel resolution = 0.98 × 0.98 × 2 mm3, inplane orientation = along the sagittal direction, receiver bandwidth = 590 Hz/pixel, and radial spokes = 3000 spokes. The total scan time for the rest, loading, and recovery was 12 minutes.
Strain Phantom Experiments
To simulate the effects of the loading on the spine IVD, a strain phantom was custom-prepared to test the repeatability of this technique and to characterize the variation of strain with applied load. A silicone gel phantom was constructed (Sylgard 184 dielectric gel; Dow Corning, Midland, MI),20 with the two parts of the gel combined in a 10:1 ratio and mixed thoroughly. Vitamin E tablets were embedded in the gel as contrasting markers. The resulting gel was cured for 24 hours at room temperature to remove air bubbles.
To perform the experiment, the gel phantom was placed on a hard substrate and immersed in water. For loading, a fixed calibrated load was applied on the gel phantom, which allows for unconfined compression along four sides of the gel phantom. For the repeatability experiments, the loading and recovery experiments were repeated five times with a fixed load of 20 N. To test the variability of strain with load, the experiment was repeated with loads of 0 N, 10 N, 15 N, 20 N, and 25 N.
The MR protocol used for the phantom experiments were identical to the in vivo human experiments. Figure 2a shows a picture of the constructed strain gel phantom, and Fig. 2b shows the phantom under rest and loading conditions, with the three locations marked 1, 2, and 3 (placed approximately 1 cm apart), used for analysis, with the positions progressively moving away for the load contact point. To characterize the mechanical properties of the silicone gel phantom, additional mechanical testing was conducted.30 A stress relaxation experiment on the gel phantom was performed with controlled displacement and unconfined compression using mechanical testing equipment (ElectroForce 3200 Series II; Bose Electronics, Framingham, MA) running on WinTest 7 software (version 7.01 2013). A displacement rate of 0.05 mm/second was used starting with a compressive load of 0 N. The test was conducted until a displacement range of 5.2 mm (compressive load = 100 N) was achieved, and a total of 26,100 measurements were taken.
FIGURE 2:
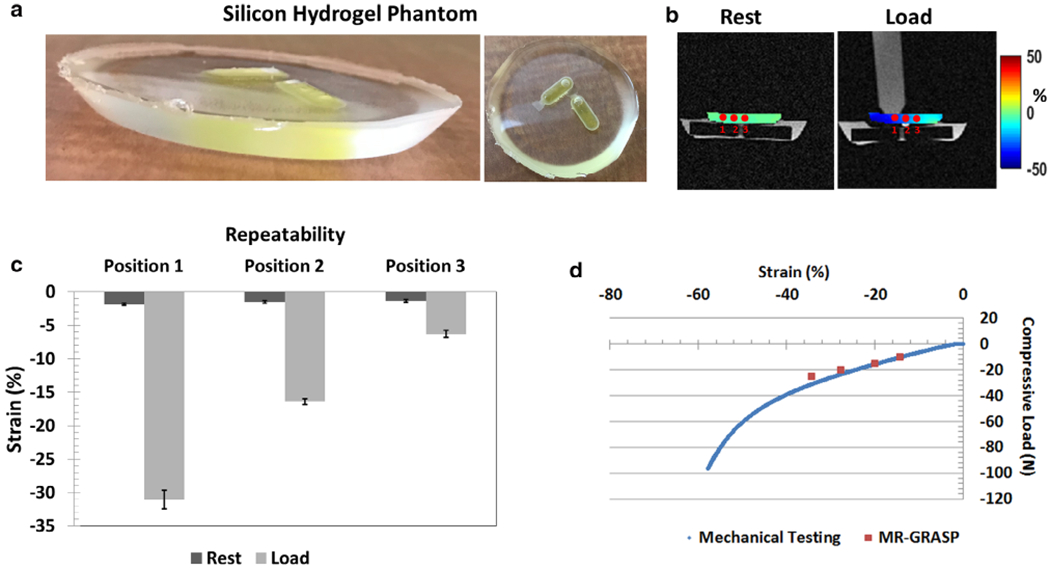
Silicone gel phantom results. (a) is the picture of the constructed silicone gel phantom; (b) shows the positions where the strain was measured during load and recovery; (c) shows the repeatability measures after five measurements using a fixed load; and (d) shows the comparison of mechanical testing and magnetic resonance-golden-angle radial sparse parallel (MR-GRASP) that tested the variation of compressive load with strain.
In Vivo Experiments
The in vivo human experiments were performed as a prospective study and was approved by the Institutional Review Board and Health Insurance Portability and Accountability Act compliant. Following written informed consent, eight healthy volunteers (four men and four women, mean age = 28 ± 5 years) were recruited for the study. Inclusion criteria for the study required that none of the subjects have a history of back pain, surgeries, or past spine injuries. Subjects were positioned supine with the legs strapped to the leg inserts of the ergometer. The volunteers wore the fixation harness, which was also strapped to the ergometer. Table 1 gives the details of loading and relevant demographic information in the cohort.
TABLE 1.
Summary of the Gender and Weight of Each Subject and the Load Used
| Subject | Gender | Weight (kg) | Load (N) | Repeated scan (Y/N) |
|---|---|---|---|---|
| 1 | M | 61 | 400 | N |
| 2 | M | 74 | 400 | Y |
| 3 | M | 92 | 400 | Y |
| 4 | M | 80 | 400 | Y |
| 5 | F | 74 | 400 | N |
| 6 | F | 70 | 400 | N |
| 7 | F | 57 | 400 | N |
| 8 | F | 64 | 400 | N |
Postprocessing and Data Analysis
Figure 3a shows the postprocessing pipeline that is used for reconstruction of images using CS. The raw data from the scanner were used for offline reconstruction using custom software scripts using MATLAB (v 9.2.0; MathWorks, Natick, MA). Fast Fourier transform was applied to the raw data along the z-dimension to allow parallel reconstruction of the data. Coil sensitivity maps were calculated using the central k-space data using eigen-value-based iterative self-consistent parallel image reconstruction.31 The continuously acquired radial spokes were regrouped to form a sparse data set consisting of 250 spokes per time frame, giving a temporal resolution of one 3D data set per minute. For the 12-minute scan, this would give two volume data sets for rest, and five each for loading and recovery conditions. The iterative GRASP reconstruction was formulated as shown in Eq. 1:
| (1) |
FIGURE 3:
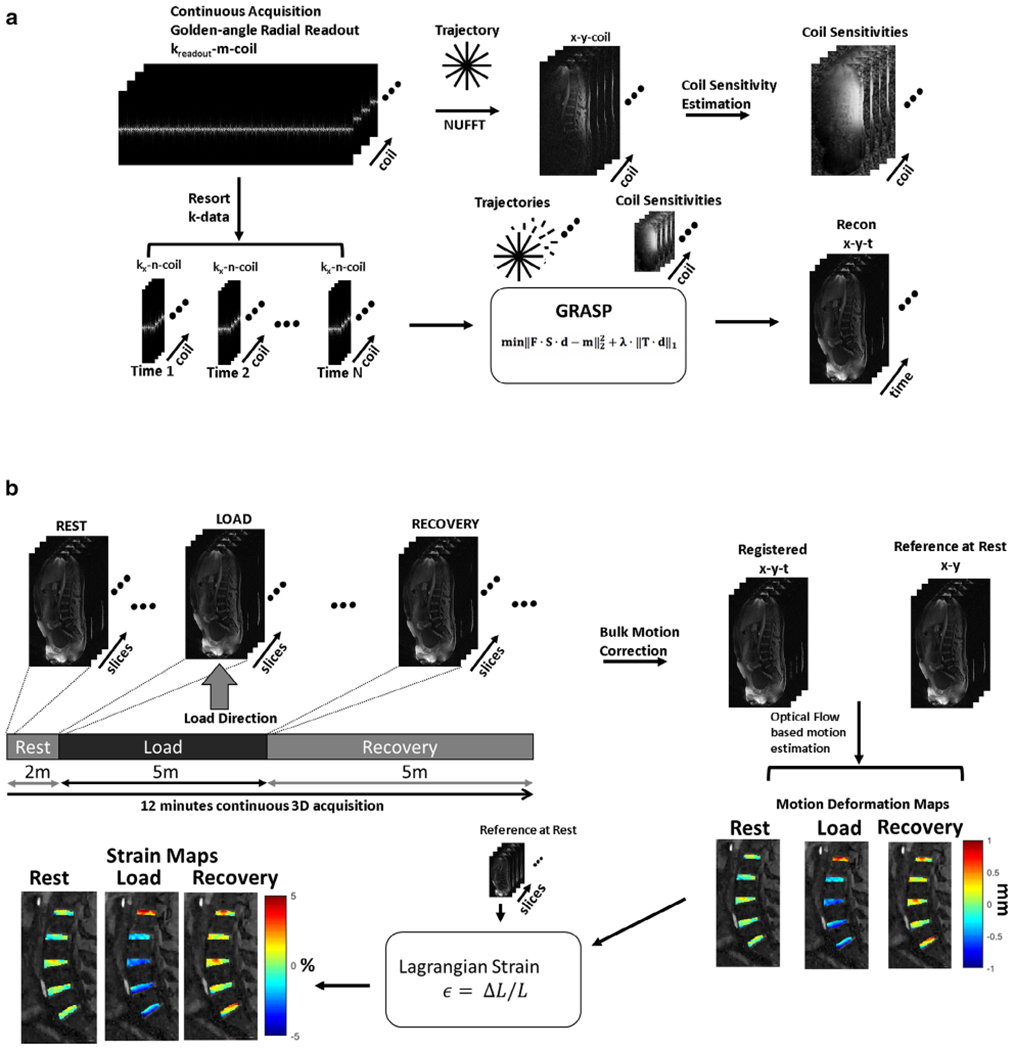
Postprocessing pipeline. (a) Compressed sensing (CS) reconstruction pipeline. Continuous golden-angle radial acquisition is for the magnetic resonance imaging (MRI) scan. The raw data are used to estimate coil sensitivity maps. The continuously acquired data are retrospectively windowed with a desired number of spokes to form an undersampled image time series. The undersampled k-data and coil sensitivity maps are used as input to the iterative CS algorithm to form the reconstructed images. (b) Continuous golden-angle radial sparse parallel (GRASP) data acquisition is performed during the rest, simulated static standing load phase, and the recovery phase. Following CS reconstruction, the image time series are corrected for bulk motion and coregistered. An optical flow algorithm is then used to calculate motion deformation maps. From these, the Lagrangian strain is calculated for each phase (rest through recovery).
where represents the reconstruction image, the vector y represents the captured k-data, S is the sampling pattern of the data, F is the Fourier transform, and C represents the coil sensitivity. The regularization penalty consists of the sparsifying transform T.
In this implementation, the sparsifying transform used was spatiotemporal finite differences32,33 with the temporal order and the spatial order set to 1. λ is the regularization parameter and is determined by running a series of test values on a log scale for one data set. This value of λ was used for all subsequent reconstructions of the data set. In this version of CS reconstruction, the monotone fast iterative shrinkage-thresholding algorithm with variable acceleration 34 was used for cost-function minimization.
Figure 3b shows the data analysis for strain calculations. The images from the CS reconstruction were used for further analysis. Of the 15 imaging time points, the two images at the transition (rest and loading, loading and recovery) were motion-corrupted and were discarded. The remaining 13 imaging time points were used for further analysis. There was bulk motion resulting from the application of load and beginning of the recovery period. The affected images were corrected for bulk motion using inbuilt MATLAB functions for image intensity-based registration. A translation-based rigid body motion correction was used that applies a global transformation to the moving image with the first image as the reference position.35
Deformation under loading condition results in subvoxel shifts.18 To determine these subvoxel shifts in the IVD segments as a result of the loading and recovery, an optical flow algorithm was used that estimates voxel image intensity-based velocity fields under the assumption that gray-level intensities are preserved during displacement, and any variation is attributable to motion.36,37 Five regions of interest (ROIs) were manually segmented (RGM) for the IVD segments between L1/L2, L2/L3, L3/L4, L4/L5, and L5/S1. Figure 4a shows the locations of the ROIs used in the study. The blue arrow shows the direction of static mechanical loading. Figure 4b shows the images that were used as an anatomical reference.
FIGURE 4:
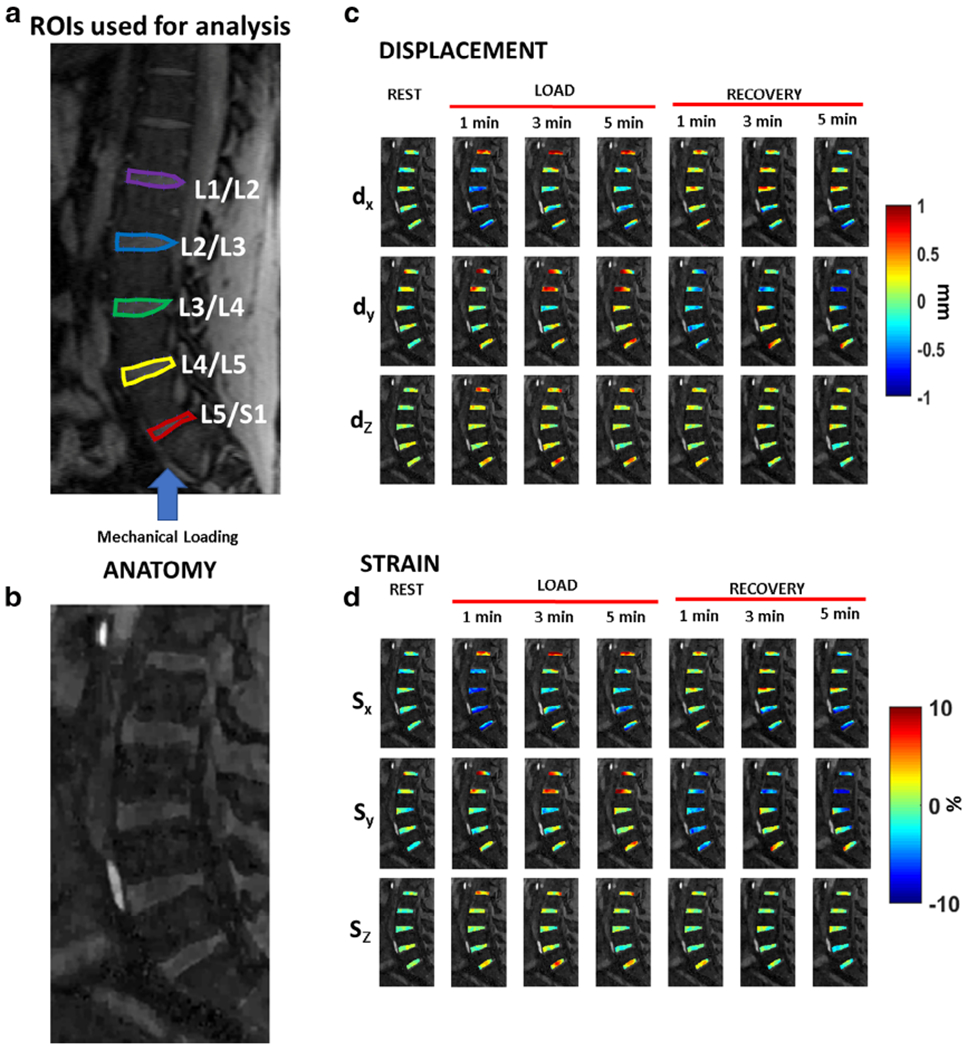
Motion deformation maps. (a) shows the location of the five regions of interest (ROIs) to be used for analysis. The blue arrow shows the direction of static loading targeted at the intervertebral disc (IVD). (b) The figure serves as the anatomical reference for (c) and (d). (c) shows example deformation maps in the IVD showing displacement (dX, dY, and dZ) for the rest, loading, and recovery phases. (d) shows the corresponding strain maps for the three principal directions.
The optical flow tracking algorithm estimates 3D motion deformation maps between each time point and the reference frame (first frame).36,37 The Lagrangian strain (SL) was calculated from the deformation fields and the reference as shown in Eq. 2:
| (2) |
where dL is the change in length from deformation, and L0 is the reference length, in this case the voxel length in the particular direction. Displacement and strain fields were calculated in the rest, loading, and recovery conditions. To assess the repeatability of the strain measurements in vivo, three subjects underwent repeat scans under identical loading conditions as their previous scans. Three subjects underwent repeat scans under identical loading conditions as their previous scans, following a 6-month time gap.
Statistical Analysis
For each IVD segment, the change in strain from loading to recovery was compared across all subjects. Two tailed t-tests were used to compare the change in strain from load to recovery conditions, with the significance threshold set to 0.05. For the repeatability study, the mean and standard deviation (SD) across the two sessions for each ROI and each subject were calculated. Bland-Altman plots38 were calculated to quantify the agreement between the strain calculation in repeat measurements. Confidence intervals (95%) were estimated as 1.96 times the SD of the differences between scan 1 and scan 2.39 In addition, the mean correlation coefficient (CC) was calculated for between the scans for each direction. For the repeatability studies in phantoms, the Pearson CC of displacement with load used in mechanical testing and MR phantom testing was calculated.
Results
Figure 3c,d shows the results from the silicone gel phantom. Figure 3c shows the results for repeatability under a fixed load of 20 N, at conditions for rest and loading. For repeatability after five consecutive measurements, the strain at position 1 during rest was −1.8 ± 0.1% and increased to −31.0 ± 1.4% during load. For position 2, the strain at rest was −1.4 ± 0.2% and increased to −16.4 ± 0.4% under load; and for position 3, the strain at rest was −1.3 ± 0.2% and increased to −6.2 ± 0.5%. Figure 3d shows the comparison of mechanical testing and MR-GRASP testing, demonstrating the variation of compressive strain with compressive load. For the loads tested in MR-GRASP, the strain values were closely correlated to mechanical testing, with a Pearson CC = 0.997.
Figure 4c shows the motion deformation maps along the three directions (dX, dY, and dZ) during rest, mechanical loading condition, and recovery. Figure 4d shows the calculated strain maps along the three directions (Sx, Sy, and Sz) during rest, loading, and recovery. During loading, along the Sx direction, the L3/L4, L4/L5, and the L5/S1 segments show maximum compressive strain in response to the loading condition.
Figure 5a,b shows the strain calculation results in two representative subjects. The figures show the strain maps along three directions for the duration of the experiment from rest, load, through recovery. The results show the variation of strain among different subjects. Compressive strain is clearly observed during loading in the Sx direction in both subjects, which returns to baseline condition during recovery. The loading and recovery along Sy and Sz directions are more heterogeneous.
FIGURE 5:
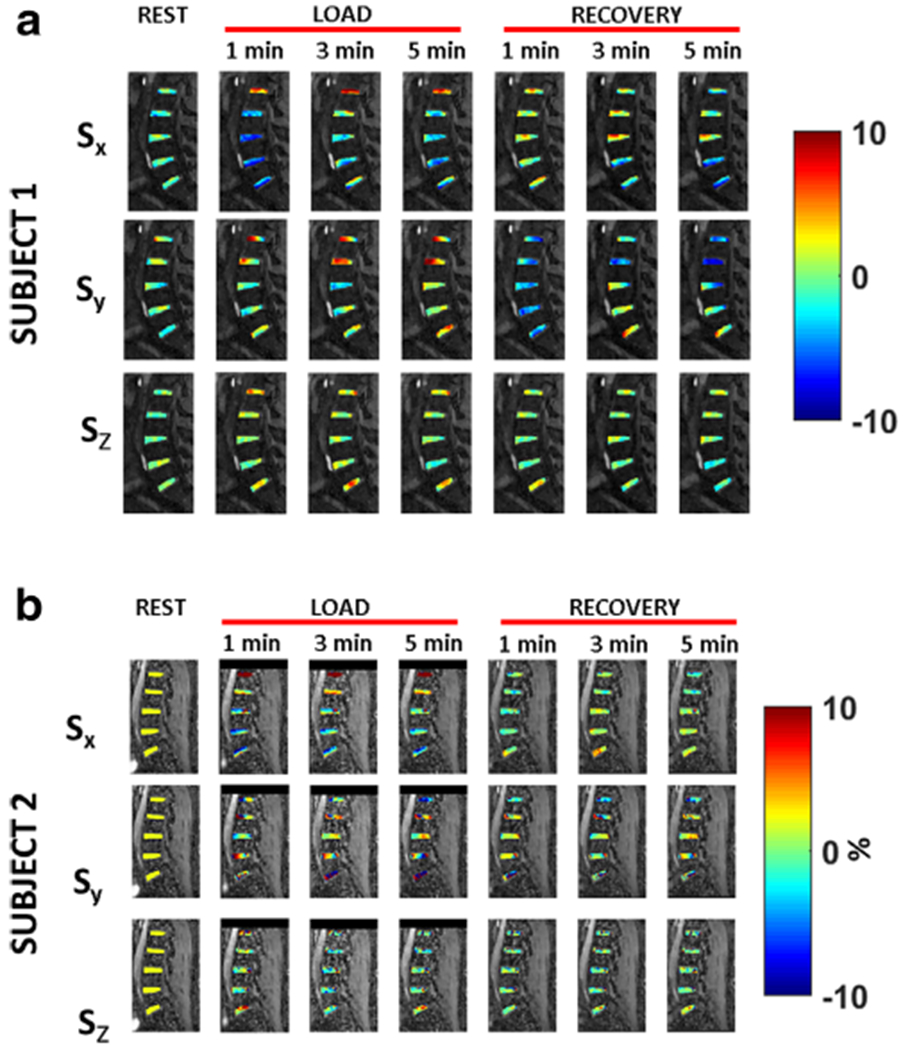
Strain maps. (a) shows the strain maps for subject 1, along three directions (Sx, Sy, and Sz) for the duration of the experiment from rest, load, through recovery. (b) shows the resulting strain maps for subject 2.
Figure 6a shows scatter plots for the mean strain in the five ROIs in scan 1 and scan 2, along with 95% confidence intervals. Figure 6b shows the Bland-Altman plots from the repeatability between scan 1 and scan 2 in three subjects in the ROIs for strain along Sx, Sy, and Sz directions. The mean correlation coefficients were 0.86, 0.94, and 0.94, along the Sx, Sy, and Sz, respectively.
FIGURE 6:
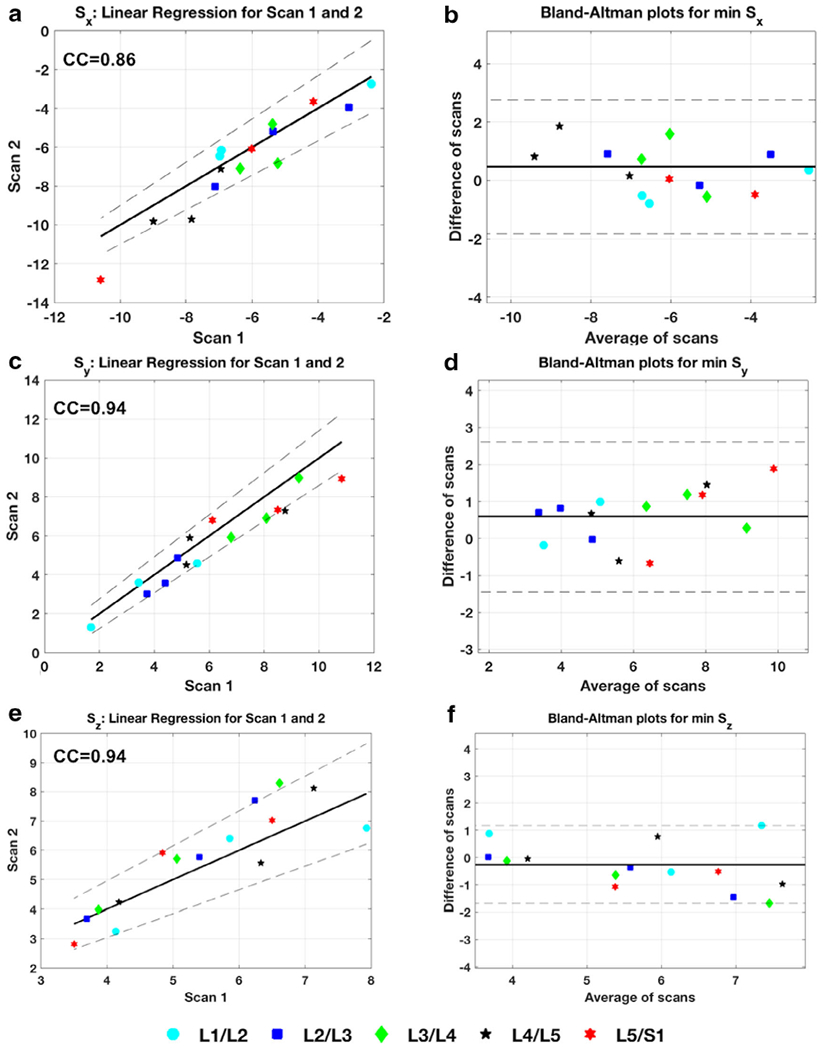
Repeatability of strain in vivo. (a), (c), and (e) show the scatter plot of the strain measurements from scan 1 and scan 2 in the regions of interest (ROIs) tested for Sx, Sy, and Sz directions. Strong correlation coefficient measurements demonstrate the repeatability of the technique between scans. (d), (e), and (f) are the Bland-Altman plots showing data from the average of the scans plotted against the differences.
Table 2 shows the calculated strain ranges during loading and recovery across all eight subjects in the three directions. Along the Sx direction, the minimum strain shown is the maximum compressive strain experienced by the respective IVD segment. During loading, the highest compressive strain is experienced by the L4/L5 segment (−7.5%). The change in strain from loading to recovery along the loading direction (Sx) is plotted in Fig. 7. The strain change between load and recovery was significant for L3/L4 (P = 0.017) and L4/L5 (P = 0.026) segments. The L4/L5 segment showed the greatest change in strain from the loading condition to recovery (2.2%), while the least change in strain was in the L1/L2 segment (0.6%).
TABLE 2.
Summary of the Mean Minimum Strain and the Mean Maximum Strain (Along Sx, Sy, and Sz) Across the Five Subjects During Load and Recovery in the Individual IVD ROIs
| ROI | L1/L2 | L2/L3 | L3/L4 | L4/L5 | L5/S1 | |
|---|---|---|---|---|---|---|
| Strain during load (%) | ||||||
| Sx | Min | −4.4 ± 1.7 | −5.4 ± 2.4 | −6.0 ± 1.8 | −7.5 ± 2.9 | −6.7 ± 3.7 |
| Max | 9.3 ± 5.5 | 8.5 ± 3.5 | 5.6 ± 1.9 | 6.2 ± 2.6 | 6.4 ± 2.3 | |
| Sy | Min | −3.2 ± 1.5 | −3.9 ± 2.5 | −3.9 ± 1.9 | −4.3 ± 2.4 | −3.3 ± 1.4 |
| Max | 6.0 ± 5.6 | 5.1 ± 3.9 | 4.5 ± 2.7 | 4.1 ± 1.8 | 5.4 ± 3.4 | |
| Sz | Min | −5.4 ± 3.3 | −4.9 ± 2.4 | −4.8 ± 2.6 | −5.5 ± 3.0 | −5.8 ± 3.5 |
| Max | 6.8 ± 4.1 | 5.1 ± 2.1 | 5.4 ± 2.3 | 5.5 ± 2.2 | 6.5 ± 3.8 | |
| Strain during recovery (%) | ||||||
| Sx | Min | −3.9 ± 2.5 | −4.5 ± 2.8 | −4.4 ± 1.9 | −5.0 ± 3.0 | −4.4 ± 3.0 |
| Max | 3.0 ± 2.1 | 3.7 ± 2.7 | 4.5 ± 3.3 | 3.4 ± 1.8 | 4.1 ± 3.5 | |
| Sy | Min | −2.9 ± 1.9 | −3.2 ± 2.9 | −2.9 ± 1.6 | −2.7 ± 1.6 | −2.7 ± 1.7 |
| Max | 2.3 ± 1.1 | 2.9 ± 2.8 | 3.0 ± 2.2 | 3.0 ± 1.8 | 4.2 ± 3.9 | |
| Sz | Min | −4.7 ± 2.8 | −5.3 ± 2.3 | −5.5 ± 3.9 | −8.0 ± 7.8 | −8.6 ± 8.6 |
| Max | 4.5 ± 3.0 | 4.6 ± 2.4 | 4.5 ± 2.5 | 5.2 ± 3.6 | 4.8 ± 2.6 | |
IVD = intervertebral disc; ROIs = regions of interest.
FIGURE 7:
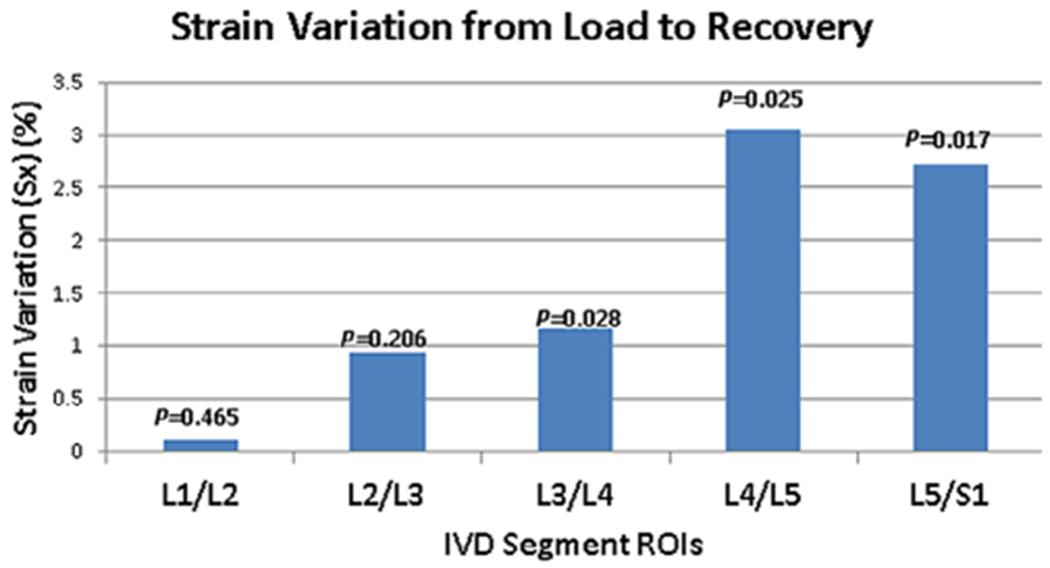
Variation of strain with condition. This figure shows the graph of the change in strain from load to recovery along the Sx direction. The greatest change in strain is seen in the L4/L5 segment. The strain change between load and recovery was significant for the L3/L4 (P = 0.017) and L4/L5 (P = 0.026) segments.
Discussion
In this study, we demonstrated the use of static mechanical loading with simultaneous and continuous MRI acquisition through rest, loading, and recovery conditions to measure 3D internal dynamic strains in the human IVD. These results suggest that it may be possible to investigate changes in internal dynamic strains in injury and degenerative conditions.
The in vivo strain data from human volunteers along the X, Y, and Z directions under load and recovery conditions show complex heterogeneous patterns. The data from this study suggest that the nature of the internal dynamic strains varies depending on the location of IVD segment, with the largest compressive strains seen in the L4/L5 segments. A high SD of minimum and maximum strains was observed among the subjects. This may be attributed to the fact that subject-dependent biomechanics, disc contact areas, body mass index, gender, and system creep may play a role in altering the values observed and were not controlled in this study. Additionally, the displacements calculated between rest and loading conditions are in the order of hundreds of micrometers. These values are unlikely to be visually perceptible in MRI. They necessitate the use of optical flow algorithms to calculate submillimeter variations in cartilage thickness. Without variation of contrast between the two conditions, the optical flow algorithm will fail to produce accurate displacements.
In this study, the peak strain was achieved shortly after the administration of static loading, but the recovery to baseline was gradual. In the healthy control subjects that were scanned, the recovery was achieved in the time frame of the experiment. These preliminary results suggest the potential to perform scans to assess dynamic strains using mechanical loading. Further studies are required to establish normative values under control conditions and with patient studies.
While no gold standard exists for measurement of internal strains, in vivo and ex vivo studies report compressive strains in the range of 3% to 6%.20,40 The results of this study are in agreement with previous studies, despite methodological differences of experimentation.20,40–42 In ex vivo studies, compressive loads up to 20% of failure loads are reported and compressive strains on the order 6% are noted.8 There are limited studies available that report internal strains using MR techniques.20,42 In the study by Chan and Neu,20 using the dual-MRI technique they calculated displacement and internal strains to be in the range of −4.5% to 0.2%. The technique used a cyclic loading paradigm that used load synchronization with data acquisition and used a displacement-encoding gradient. Similar to our study, they note the spatial variation and increased compressive strain in the loading direction, but the study limited their analysis to only the L4/L5 segment. In another study, O’Connell et al42 measured strain in ex vivo human IVD samples using texture correlation axial compression performed outside the MRI scanner, with the mean compressive strain was reported as 4.4%. In contrast to other ex vivo studies that measure overall change in disc height or volume, the results in our study provide displacement and strain calculated from every pixel in the selected ROI.41,42
In this study, we used a continuous GRASP-based acquisition, which offers some benefits in the context of dynamic strain mapping. The GRASP technique allows continuous MR scanning without the need to synchronize the data to loading and recovery conditions. Because the radial spokes used have an arbitrary order, the acquisition schemes allows to retrospectively window the data stream at arbitrary points and use it for data reconstruction. If a part of the experiment is corrupted due to bulk motion or subject movement, the radial spokes acquired during that time can be discarded. Additionally, the use of radial spokes has inherent motion robustness, as the center of k-space is regularly sampled. This scheme ensures uniform k-coverage between arbitrary numbers of consecutive spokes. Based on the desired temporal resolution, fewer spokes may be used as input to CS reconstruction. In this technique, sparse data combined with CS reconstruction offer the flexibility of high temporal resolution; this feature may potentially have diagnostic implications.
Limitations
The study uses a small cohort of subjects to show preliminary results. A larger cohort of control subjects and a bigger range of ages would serve better to establish a normative range of strain under mechanical loads and subsequent recovery. Inclusion of patients would provide more insight into variation of strain in pathological conditions. The ergometer is 18 inches long and takes up a part of the patient table, thus reducing the available space for the patient. In this study, we were able to scan volunteers up to 72 inches in height, but it may be difficult to scan persons taller than that without experimental modifications. There was significant bulk motion between transitions of rest to loading conditions and loading to recovery conditions. Additionally, the technique also assumes accurate correction of bulk motion between rest and loading/recovery conditions and sufficient image resolution to prevent errors related to these factors. The errors produced by the optical flow algorithm may propagate into the calculated results. The use of the GRASP technique for strain imaging utilizes offline retrospective reconstruction requiring high computational power to reconstruct images, and corrupted data have to be manually discarded.
Conclusion
We demonstrated the feasibility of using static mechanical loading of the IVD using a continuous GRASP-based MRI acquisition and retrospective flexible time windowing to quantify internal strains in the individual IVD segments. This study shows that by measuring the temporal evolution of strain during rest, loading, and recovery phases, dynamic strain information in the human spine IVD may be investigated.
Acknowledgments
This study is supported by NIH grants 1S10OD021702-01, R21-AR075259-01A1, R01-AR067156, and R01-AR068966, and was performed under the rubric of the Center of Advanced Imaging Innovation and Research (CAI2R), a NIBIB Biomedical Technology Resource Center (NIH P41-EB017183).
REFERENCES
- 1.Bogduk N Clinical anatomy of the lumbar spine and sacrum. 4th ed. London: Elsevier Health Sciences; 2005. p 12–26. [Google Scholar]
- 2.Newell N, Little JP, Christou A, Adams MA, Adam CJ, Masouros SD. Biomechanics of the human intervertebral disc: A review of testing techniques and results. J Mech Behav Biomed Mater 2017;69: 420–434. [DOI] [PubMed] [Google Scholar]
- 3.Adams MA, Roughley PJ. What is intervertebral disc degeneration, and what causes it? Spine (Phila Pa 1976) 2006;31(18):2151–2161. [DOI] [PubMed] [Google Scholar]
- 4.Ferguson SJ, Steffen T. Biomechanics of the aging spine. Eur Spine J 2003;12(Suppl 2):S97–S103. [DOI] [PMC free article] [PubMed] [Google Scholar]
- 5.Adams MA, Freeman BJ, Morrison HP, Nelson IW, Dolan P. Mechanical initiation of intervertebral disc degeneration. Spine (Phila Pa 1976) 2000;25(13):1625–1636. [DOI] [PubMed] [Google Scholar]
- 6.Burr DB, Radin EL. Microfractures and microcracks in subchondral bone: Are they relevant to osteoarthrosis? Rheum Dis Clin North Am 2003;29(4):675–685. [DOI] [PubMed] [Google Scholar]
- 7.Smith RL, Thomas KD, Schurman DJ, Carter DR, Wong M, van der Meulen MC. Rabbit knee immobilization: Bone remodeling precedes cartilage degradation. J Orthop Res 1992;10(1):88–95. [DOI] [PubMed] [Google Scholar]
- 8.Stokes IA. Surface strain on human intervertebral discs. J Orthop Res 1987;5(3):348–355. [DOI] [PubMed] [Google Scholar]
- 9.Holmes AD, Hukins DW, Freemont AJ. End-plate displacement during compression of lumbar vertebra-disc-vertebra segments and the mechanism of failure. Spine (Phila Pa 1976) 1993;18(1):128–135. [DOI] [PubMed] [Google Scholar]
- 10.Adams MA, McNally DS, Dolan P. ‘Stress’ distributions inside intervertebral discs. The effects of age and degeneration. J Bone Joint Surg Br 1996;78(6):965–972. [DOI] [PubMed] [Google Scholar]
- 11.Costi JJ, Stokes IA, Gardner-Morse M, Laible JP, Scoffone HM, Iatridis JC. Direct measurement of intervertebral disc maximum shear strain in six degrees of freedom: Motions that place disc tissue at risk of injury. J Biomech 2007;40(11):2457–2466. [DOI] [PMC free article] [PubMed] [Google Scholar]
- 12.Brinckmann P, Grootenboer H. Change of disc height, radial disc bulge, and intradiscal pressure from discectomy. An in vitro investigation on human lumbar discs. Spine (Phila Pa 1976) 1991;16(6): 641–646. [DOI] [PubMed] [Google Scholar]
- 13.Markolf KL, Morris JM. The structural components of the intervertebral disc. A study of their contributions to the ability of the disc to withstand compressive forces. J Bone Joint Surg Am 1974;56(4): 675–687. [PubMed] [Google Scholar]
- 14.Yoganandan N, Ray G, Pintar FA, Myklebust JB, Sances A Jr. Stiffness and strain energy criteria to evaluate the threshold of injury to an intervertebral joint. J Biomech 1989;22(2):135–142. [DOI] [PubMed] [Google Scholar]
- 15.Panzer MB, Fice JB, Cronin DS. Cervical spine response in frontal crash. Med Eng Phys 2011;33(9):1147–1159. [DOI] [PubMed] [Google Scholar]
- 16.Attili AK, Schuster A, Nagel E, Reiber JH, van der Geest RJ. Quantification in cardiac MRI: Advances in image acquisition and processing. Int J Cardiovasc Imaging 2010;26(Suppl 1):27–40. [DOI] [PMC free article] [PubMed] [Google Scholar]
- 17.Chan DD, Neu CP, Hull ML. Articular cartilage deformation determined in an intact tibiofemoral joint by displacement-encoded imaging. Magn Reson Med 2009;61(4):989–993. [DOI] [PMC free article] [PubMed] [Google Scholar]
- 18.Chan DD, Cai L, Butz KD, Trippel SB, Nauman EA, Neu CP. In vivo articular cartilage deformation: Noninvasive quantification of intratissue strain during joint contact in the human knee. Sci Rep 2016;6:19220. [DOI] [PMC free article] [PubMed] [Google Scholar]
- 19.Menon RG, Zibetti MVW, Regatte RR. In vivo tibiofemoral cartilage strain mapping under static mechanical loading using continuous GRASP-MRI. J Magn Reson Imaging 2020;51(2):426–434. [DOI] [PMC free article] [PubMed] [Google Scholar]
- 20.Chan DD, Neu CP. Intervertebral disc internal deformation measured by displacements under applied loading with MRI at 3T. Magn Reson Med 2014;71(3):1231–1237. [DOI] [PubMed] [Google Scholar]
- 21.Yoder JH, Peloquin JM, Song G, et al. Internal three-dimensional strains in human intervertebral discs under axial compression quantified noninvasively by magnetic resonance imaging and image registration. J Biomech Eng 2014;136(11):1110081–1110089. [DOI] [PMC free article] [PubMed] [Google Scholar]
- 22.Khalifa F, Soliman A, El-Baz A, et al. Models and methods for analyzing DCE-MRI: A review. Med Phys 2014;41(12):124301. [DOI] [PubMed] [Google Scholar]
- 23.Sodickson DK, Manning WJ. Simultaneous acquisition of spatial harmonics (SMASH): Fast imaging with radiofrequency coil arrays. Magn Reson Med 1997;38(4):591–603. [DOI] [PubMed] [Google Scholar]
- 24.Pruessmann KP, Weiger M, Scheidegger MB, Boesiger P. SENSE: Sensitivity encoding for fast MRI. Magn Reson Med 1999;42(5):952–962. [PubMed] [Google Scholar]
- 25.Griswold MA, Jakob PM, Heidemann RM, et al. Generalized autocalibrating partially parallel acquisitions (GRAPPA). Magn Reson Med 2002;47(6):1202–1210. [DOI] [PubMed] [Google Scholar]
- 26.Lustig M, Donoho D, Pauly JM. Sparse MRI: The application of compressed sensing for rapid MR imaging. Magn Reson Med 2007;58(6): 1182–1195. [DOI] [PubMed] [Google Scholar]
- 27.Feng L, Grimm R, Block KT, et al. Golden-angle radial sparse parallel MRI: Combination of compressed sensing, parallel imaging, and golden-angle radial sampling for fast and flexible dynamic volumetric MRI. Magn Reson Med 2014;72(3):707–717. [DOI] [PMC free article] [PubMed] [Google Scholar]
- 28.Menon RG, Zibetti MVW, Regatte RR. In vivo tibiofemoral cartilage strain mapping under static mechanical loading using continuous GRASP-MRI. J Magn Reson Imaging 2019;512:426–434. [DOI] [PMC free article] [PubMed] [Google Scholar]
- 29.Sigmund EE, Baete SH, Patel K, et al. Spatially resolved kinetics of skeletal muscle exercise response and recovery with multiple echo diffusion tensor imaging (MEDITI): A feasibility study. MAGMA 2018; 31(5):599–608. [DOI] [PMC free article] [PubMed] [Google Scholar]
- 30.Patel JM, Wise BC, Bonnevie ED, Mauck RL. A systematic review and guide to mechanical testing for articular cartilage tissue engineering. Tissue Eng Part C Methods 2019;25(10):593–608. [DOI] [PMC free article] [PubMed] [Google Scholar]
- 31.Uecker M, Lai P, Murphy MJ, et al. ESPIRiT—an eigenvalue approach to autocalibrating parallel MRI: Where SENSE meets GRAPPA. Magn Reson Med 2014;71(3):990–1001. [DOI] [PMC free article] [PubMed] [Google Scholar]
- 32.Zibetti MVW, Baboli R, Chang G, Otazo R, Regatte RR. Rapid compositional mapping of knee cartilage with compressed sensing MRI. J Magn Reson Imaging 2018;48(5):1185–1198. [DOI] [PMC free article] [PubMed] [Google Scholar]
- 33.Zibetti MVW, Sharafi A, Otazo R, Regatte RR. Accelerating 3D-T1rho mapping of cartilage using compressed sensing with different sparse and low rank models. Magn Reson Med 2018;80(4):1475–1491. [DOI] [PMC free article] [PubMed] [Google Scholar]
- 34.Zibetti MVW, Helou ES, Regatte RR, Herman GT. Monotone FISTA with variable acceleration for compressed sensing magnetic resonance imaging. IEEE Trans Comput Imaging 2019;5(1):109–119. [DOI] [PMC free article] [PubMed] [Google Scholar]
- 35.Reddy BS, Chatterji BN. An FFT-based technique for translation, rotation, and scale-invariant image registration. IEEE Trans Image Process 1996;5(8):1266–1271. [DOI] [PubMed] [Google Scholar]
- 36.Horn BKP, Schunk BG. Determining optical flow. Artif Intell 1981;17: 185–203. [Google Scholar]
- 37.Zachiu C, Denis de Senneville B, Dmitriev ID, Moonen CTW, Ries M. A framework for continuous target tracking during MR-guided high intensity focused ultrasound thermal ablations in the abdomen. J Ther Ultrasound 2017;5:27. [DOI] [PMC free article] [PubMed] [Google Scholar]
- 38.Bland JM, Altman DG. Statistical methods for assessing agreement between two methods of clinical measurement. Lancet 1986;1(8476): 307–310. [PubMed] [Google Scholar]
- 39.Bland JM, Altman DG. Measuring agreement in method comparison studies. Stat Methods Med Res 1999;8(2):135–160. [DOI] [PubMed] [Google Scholar]
- 40.Bey MJ, Song HK, Wehrli FW, Soslowsky LJ. A noncontact, nondestructive method for quantifying intratissue deformations and strains. J Biomech Eng 2002;124(2):253–258. [DOI] [PubMed] [Google Scholar]
- 41.Race A, Broom ND, Robertson P. Effect of loading rate and hydration on the mechanical properties of the disc. Spine (Phila Pa 1976) 2000;25 (6):662–669. [DOI] [PubMed] [Google Scholar]
- 42.O’Connell GD, Johannessen W, Vresilovic EJ, Elliott DM. Human internal disc strains in axial compression measured noninvasively using magnetic resonance imaging. Spine (Phila Pa 1976) 2007;32(25):2860–2868. [DOI] [PubMed] [Google Scholar]


