

Abstract
Transient receptor potential vanilloid subfamily 1 (TRPV1) is a non-selective cation channel protein expressed in neuronal and non-neuronal cells. Although TRPV1 is implicated in thermogenesis and diet-induced obesity (DIO), its precise role remains controversial. TRPV1−/− mice are protected from DIO, while TRPV1 activation enhances thermogenesis to prevent obesity. To reconcile this, we fed wild-type and TRPV1−/− mice for 32 weeks with normal chow or a high-fat diet and analyzed the weight gain, metabolic activities, and thermogenic protein expression in white and brown fats. TRPV1−/− mice became obese, exhibited reduced locomotor activity, reduced energy expenditure, enhanced hepatic steatosis, and decreased thermogenic protein expression in adipose tissues. Our data reveal that lack of TRPV1 does not prevent obesity, but rather enhances metabolic dysfunction.
Keywords: TRPV1−/−, Obesity, Adiposity, Adipose Tissue, Metabolism, fatty liver
Introduction
Transient Receptor Potential Vanilloid 1 (TRPV1) is a member of the vanilloid subfamily of the TRP superfamily of proteins. TRPV1 is predominately expressed in the sensory nerve terminals, where it mediates thermal pain sensitization mechanisms. Recently, its expression and functions are recognized in non-neuronal tissues like skeletal muscles, liver, and adipose tissues [1,2].
Published works suggest that TRPV1, also known as capsaicin receptor, is implicated in high-fat diet (HFD)-induced obesity [3–5]. TRPV1 prevents bodyweight gain in HFD-fed mice [4]. TRPV1 is recognized as a promising target for countering diet-induced obesity [3,4,6–12]. This suggests that TRPV1 expression and activation are important for the anti-obesity effect of capsaicin. However, the precise mechanism by which TRPV1 regulates metabolic activity remains unclear. Also, controversy exists in the role of TRPV1 in HFD-induced obesity. That is, published studies suggest that the lack of TRPV1 is protective against HFD-induced obesity and metabolic pathologies [9,13,14]. TRPV1 activation by capsaicin prevents obesity and associated comorbidities [3,4,6,8]. But, so far previous research has not evaluated the differences between the thermogenic machinery (expression of proteins that regulate thermogenesis in adipose tissues) between WT and TRPV1−/− mice. This research reconciles this controversy by evaluating the effect of feeding a normal chow diet (NCD) or an HFD for 32 weeks in the wild type and TRPV1−/− mice and by analyzing the expression of metabolically important genes/proteins in the white and brown fats.
Previous work suggests that HFD feeding suppresses the expression of TRPV1 and metabolically important adipogenic and thermogenic proteins in adipocytes [3,15] and dietary capsaicin reverses the inhibitory effect of HFD [3]. Further, capsaicin stimulates the browning of white adipose tissue by activating TRPV1 [3,6].
Although these observations indicate a central role of TRPV1 in regulating adipogenic and thermogenic mechanisms, it also raises an important question – whether the lack of endogenous TRPV1 expression modulates the expression profiles of adipogenic genes and thermogenic proteins? The results presented in this manuscript unequivocally demonstrates that the lack of TRPV1 endogenously does not protect mice from HFD-induced obesity, but rather promotes weight gain and metabolic dysfunction. These results will contribute towards broadening our knowledge on the role of TRPV1 in metabolic functions. Also, this article makes it clear that variations in the types of HFD used in published studies influence the outcome of the research. Collectively, the results presented here clarify that TRPV1 expression does play a role in the regulation of expression of adipogenic and thermogenic proteins in the white and brown fat isolated from NCD or HFD-fed mice. This knowledge will contribute to a broader understanding of the role of TRPV1 in the regulation of adipogenic and thermogenic mechanisms.
Materials and Methods
Mouse model of high fat diet-induced obesity
Adult male TRPV1−/− (B6.129X1-Trpv1tm1Jul/J) mice and their genetically unaltered control (wild type, WT) mice were purchased from Jackson Laboratory, Maine, USA. Mice were housed in the research animal facility at the School of Pharmacy, University of Wyoming, and used for experiments as per approved IACUC protocols. TRPV1−/− mice were genotyped using primers specified by Jackson Laboratories three weeks after birth. We performed genotyping to characterize the absence of TRPV1 Genotyping primers for trpv1−/− mice [cctgctcaacatgctcattg (forward), tcctcatgcacttcaggaaa (reverse), and tggatgtggaatgtgtgcgag (common)]. The agarose image showing the genotyping data is given in Supplemental Figure 2. We have thoroughly characterized the lack of TRPV1 in these mice through western blotting, and also routinely perform capsaicin-induced pain responses (intraplantar injections) to analyze nocifensive behaviors. Our westerns and quantitative RT-PCR experiments that characterized the lack of TRPV1 in these KO mice and the presence of TRPV1 in the wild-type mice were published earlier [3,12].
For experiments, groups of WT and TRPV1−/− mice were fed a normal chow diet (NCD) until six weeks of age and then fed ad libitum either NCD (Labdiet Rodent 5001; gross energy kcal/g is 4.07) or switched to a high-fat diet (HFD; 60% calories from fat; D 12492; Research Diet Inc., NJ; 5.21 kcal/g) until 38 weeks of age. Mice were randomly assigned into feeding groups and were housed in groups of four in separate cages. Mice were maintained in twelve hr. dark-light cycle and their weekly weight gain and food and water intake were recorded in a blinded fashion. For energy/water intake, the average quantity consumed per mouse per day was calculated and the mean values of data pooled from week 6 through week 38 of feeding. At the end of 32 weeks of feeding (mice were 38 weeks of age), a metabolic study was performed with a group of mice. Two days after the completion of the metabolic study, epididymal and brown adipose fat pad tissues (EF and BF, respectively) were isolated and used for quantitative RT PCR experiments.
Metabolic activity measurement
Metabolic activity and respiratory quotient were determined for NCD or HFD-fed WT and TRPV1−/− mice at the end of 32 weeks of feeding by using the Comprehensive Laboratory Animal Monitoring System [CLAMS™, Columbus Instruments, Columbus, OH, USA [16,17]. Mice were individually placed in the CLAMS metabolic cages with ad libitum access to food and water. After acclimatization for 48 hr., metabolic parameters including the volume of carbon dioxide produced (VCO2), the volume of oxygen consumed (VO2), the respiratory exchange ratio (RER=VCO2/VO2), and ambulatory/locomotor activity were determined as described previously.
Fat tissue isolation [18]
Following euthanization, NCD or HFD-fed WT and TRPV1−/− mice were placed on a surgical pad with dorsal surface up and cut opened along the back to the neck. The intrascapular BF found right under the skin between the shoulders, seen as two lobes, was dissected.
For the SCF isolation, a 1 cm cut through the skin was made using a scalpel just below the rib cage across the dorsal surface joining the two lateral incisions. The skin was peeled and the fat underlying the muscle and fascia were dissected carefully using a pair of scissors.
Retroperitoneal fat is located in a paravertebral position, along the border between the posterior abdominal wall and the spinal cord. Forceps were used to lift the kidney up and towards the midline to locate the retroperitoneal depots and the fat was detected.
Gonadal fat is the WAT that surrounds the epididymis and testis in the males and the uterus and ovaries in females. The fat was carefully cut and isolated from the NCD or HFD-fed male and female WT and TRPV1−/− mice.
Following the isolation of fat pads, organs were carefully isolated and weighed. The weights of the fat pads and organs were determined given in Supplemental Figure 1.
Adipose histology
After euthanization, the adipose fats (epididymal and brown) were isolated and quickly fixed in 10% formalin solution. Fixed tissues were processed through graded ethanol solutions, transferred to xylene, and then were embedded in paraffin. The paraffinized tissues were then sectioned at 8 μm thickness and mounted on glass slides. The sections were then deparaffinized through xylene followed by ethanol. Finally, the hydrated sections were stained with hematoxylin and eosin and then coverslipped using permount. Sections were examined microscopically.
Quantitative RT-PCR measurements
Total RNA was isolated using Tri-reagent (Sigma) as per the manufacturer’s instructions. cDNA was synthesized using QuantiTect reverse transcription kit (Qiagen, Valencia, CA) using Q5plex PCR system (Qiagen Valencia, CA). Real-time PCR was performed using QuantiTect SYBR Green PCR kit on the Q5plex system. 18s mRNA was used as the internal control. The scientist who performed these experiments was blinded by the type of tissues processed for these experiments. Amplifications were performed in a 25-μl-reaction volume. Primers used for quantitative RT-PCR experiments are given in Table 1.
Table 1.
Quantitative RT-PCR Primers used in the study
| Gene | Forward (5’ – 3’) | Reverse (5’ – 3’) |
|---|---|---|
| 18s | accgcagctaggaataatgga | gcctcagttccgaaaacca |
| mtrpv1 | caacaagaaggggcttacacc | tctggagaatgtaggccaagac |
| pparα | gtaccactacggagttcacgcat | cgccgaaagaagcccttac |
| pparγ | aagaataccaaagtgcgatcaa | gagcagggtcttttcagaataataag |
| sirt1 | tcgtggagacatttttaatcagg | gcttcatgatggcaagtgg |
| Prdm16 | cagcacggtgaagccattc | gcgtgcatccgcttgtg |
| bmp8b | tccaccaaccacgccactat | cagtaggcacacagcacacct |
| Ucp1 | cgactcagtccaagagtacttctcttc | gccggctgagatcttgtttc |
| pgc1α | agagaggcagaagcagaaagcaat | attctgtccgcgttgtgtcagg |
Immunoblotting
Isolated fat pads were washed with chilled PBS, lysed in lysis buffer (50mM Tris pH 7.5, 250 mM sodium chloride, 0.5% NP40, 0.5% sodium deoxycholate, 2 mM EDTA, 0.5 mM dithiothreitol, 1mM sodium orthovanadate and protease inhibitor cocktail), and centrifuged at 14000 rpm for 20 min. to remove tissue debris. The concentration of protein was determined by the Bradford method and equal amounts of protein were separated by SDS-PAGE, transferred to a nitrocellulose membrane, and immunoblotted with antibodies given in Table 2.
Table 2.
Antibodies used in the study
| Protein | Catalog number | Source |
|---|---|---|
| GAPDH | 2118 | Cell Signaling Technologies, Inc., USA |
| PPARα | NB600-636 | Novus Biologicals, USA |
| PPARγ | SC-7273 | Santa Cruz Biotechnology, Inc., USA |
| SiRT-1 | SC-28766 | Santa Cruz Biotechnology, Inc., USA |
| PRDM-16 | NBP1-77096 | Novus Biologicals, USA |
| UCP-1 | 14670 | Cell Signaling Technologies, Inc., USA |
| PGC-1α | ab54481 | Abcam, USA |
Blood glucose and cholesterol measurement
Mice were fasted for 6 hours before measuring blood glucose and cholesterol measurement. Blood glucose was measured by using a glucometer (Counter Next monitoring system and strips, Bayer, USA). Fasting serum cholesterol level was measured using a commercially available kit (Biovision, USA).
Intraperitoneal Glucose Tolerance Test [12]
IPGTT was performed after fasting mice for 8 hours. Mice were injected with glucose (2g/kg) intraperitoneally. Blood glucose was measured, via tail vein bleeding, with a glucometer at 0, 15, 30, 60, and 120 minutes. Briefly, the mouse was made comfortable in a restrainer while maintaining the temperature around 27 to 28°C on a thermal blanket. A 25 G needle was inserted into the blood vessel and blood is collected using a capillary tube. After blood collection, bleeding was stopped by applying pressure using a sterile gauze pad.
Determination of plasma glucagon-like peptide-1 (GLP-1) level
Following fasting for 8 hours, mice were fed food ad libitum for 2 hours and blood was drawn into EDTA tubes (BD Biosciences, NJ) containing 10 ml of DPP-IV inhibitor (Millipore, MA) at 10 PM. The tubes were inverted, mixed well, and centrifuged at 1000g for 10 min. in a refrigerated centrifuge. GLP-1 in plasma samples was determined as per the manufacturer’s instruction (Alpco, NH, USA) using a TECAN plate reader.
Oil red O staining of liver sections
Six to ten mm OCT liver sections from NCD or HFD-fed WT and TRPV1−/− mice were fixed in formalin, washed three times with PBS, and then were rinsed in 60% isopropyl alcohol for 2 min followed by Oil Red O (ORO) in polyethylene glycol for 15 minutes. The sections were then rinsed with water and the nucleus was stained with hematoxylin for 10min. The nuclear staining was intensified with sodium phosphate solution for 5 minutes, washed with water several times, and mounted using an aqueous mounting medium. The sections were then visualized under a Zeiss 700 confocal microscope.
Liver histology sections
At the end of feeding NCD or HFD, WT and TRPV1−/− mice were euthanized as per approved IACUC protocols. Liver tissue was isolated and fixed in 10% formalin solution. Fixed liver tissues were processed, using routine procedures, through graded ethanol solutions, into xylene then were embedded in paraffin. The paraffinized liver tissues were then sectioned at 8 microns, mounted onto glass slides, then deparaffinized through xylene then ethanol solutions. The hydrated sections were finally stained with hematoxylin and eosin before a final step of dehydration then coverslipped using permount®.
Drugs and chemicals
All special diets were obtained from Research Diets Inc., NJ, USA. All chemicals are obtained from Sigma, USA. Quantitative RT PCR kits were obtained from Qiagen, USA.
Statistical analyses
Data for all figures were expressed as mean ± S.E.M. Student t-test and ANOVA evaluated the statistical significance of population means. Samples sizes were set to determine whether the mean value of an outcome variable in one group differed significantly from that in another group. A P value < 0.05 was considered statistically significant. Figures from analyzed data were plotted using Microcal Origin 2020 software.
Results
To determine whether lack of TRPV1 protects against HFD-induced obesity, we fed TRPV1−/− mice either NCD or HFD. WT mice fed with these diets were used as controls. As shown in Figure 1A, HFD feeding caused significant weight gain in both WT and TRPV1−/− mice. HFD-feeding caused an increase in the bodyweight of TRPV1−/− mice in the weeks of 10 to 15 and 25 to 30. However, at 32 weeks of feeding HFD, we did not observe any significant difference in the body weight of WT and TRPV1−/− mice. Further, NCD-fed TRPV1−/− mice also gained slightly but significantly higher weight compared to WT. But the quantity of food (energy intake) or water consumed by these groups of mice (Figure 1B and C) did not differ from the WT. Also, consistent with the gain in body weight due to HFD feeding, organ weights, and fat mass were higher for the HFD-fed groups compared to NCD-fed mice (Supplemental Figure 1). Next, we performed a histology section of white and brown fat to evaluate the size of eWAT and BAT of NCD or HFD-fed WT and TRPV1−/− mice. As illustrated in Figure 1D and E, adipose hypertrophy was observed in HFD-fed groups.
Figure 1. Effects of NCD and HFD-feeding on weight gain, food/water intake, metabolic, and locomotor activities in NCD or HFD-fed WT and TRPV1−/− mice.

A. Time courses of body weight gain (g) ± S.E.M. in NCD or HFD-fed WT and TRPV1−/− mice. B and C. Mean energy/water intake ± S.E.M. intake per day in these mice. D. and E. Hematoxylin and Eosin staining for epididymal white (D) and brown (E) fats of WT and TRPV1−/− mice. Time courses of VCO2, VO2, and RER in the dark and light cycle (black and white boxes, respectively) for WT (F, G, and H) and TRPV1−/− (I, J, and K) mice at the end of 32 weeks of feeding NCD or HFD. L. Mean RER ± S.E.M. for these mice. Time courses of energy expenditure in the dark and light cycle for WT (M) and TRPV1−/− (N) mice. O. Mean energy expenditure ± S.E.M. for these mice. Time courses of locomotor activity in the dark and light cycle for WT (P) and TRPV1−/− (Q) mice. R. Mean locomotor activity ± S.E.M. for these mice. ** statistical significance at P < 0.05 for n = 12 per condition.
We evaluated the effect of HFD feeding on the VCO2, VO2, respiratory exchange ratio (RER = VCO2/VO2), and energy utilization by indirect calorimetry. We also measured the locomotor activity in these mice. These data are given in Figure 1F through R. We did not observe any difference in the RER as HFD suppressed RER to a similar extent in both groups. But the energy utilization and locomotor activity (in the dark cycle) were significantly less in NCD-fed TRPV1−/− mice compared to WT.
Since HFD significantly caused obesity in both WT and TRPV1−/− mice, we analyzed whether the expression of adipogenic and thermogenic genes are similarly downregulated by HFD in both groups. For this, we isolated epididymal fat (white fat) and intrascapular brown fat and quantified the expression of adipogenic and thermogenic genes by quantitative RT-PCR technique. We first evaluated the expression of TRPV1 in NCD and HFD-fed WT and TRPV1−/− mice. As shown in Figure 2A and B, TRPV1 was expressed in both EF and BF of WT but not in TRPV1−/− mice. However, HFD significantly suppressed TRPV1 mRNA in both EF and BF.
Figure 2. mRNA levels of adipogenic and thermogenic genes in NCD or HFD-fed WT and TRPV1−/− mice.

Mean mRNA level ± S.E.M. normalized to 18s in the EF and BF for TRPV1 (A and B), PPARs (C and D), UCP-1 and BMP8b (E and F), PGC-1α, PRDM-16 and SiRT-1 (G and H). Adipose tissue isolated from six mice per condition was pooled and used for the quantification of genes. Five independent experiments were performed for each condition. ** statistical significance at P < 0.05 for n = 6 independent experiments.
Next, we analyzed the mRNA levels of peroxisome proliferator activator receptor (PPAR) alpha (PPARα) and PPARγ in the EF and BF of these mice. As shown in Figure 2C, both PPARα and PPARγ mRNAs levels were lower in EF of NCD-fed TRPV1−/− mice compared to WT. However, PPARγ mRNA was elevated in the BF of HFD-fed WT and TRPV1/−mice. Also, HFD did not reduce PPARα in the BF of WT but suppressed in the BF of TRPV1−/− mice.
Next, we evaluated the mRNA levels of thermogenic mitochondrial UCP-1 and BMP8b, which take part in thermogenesis. In the EF of NCD-fed TRPV1−/− mice, the UCP-1 level was significantly less compared to WT. Consistently, NCD-fed TRPV1−/− mice expressed significantly lower levels of UCP-1 and BMP8b in the BF. Neither NCD nor HFD-fed WT and TRPV1−/− mice had BMP8b mRNA in the EF. HFD feeding inhibited the mRNA level of UCP-1 and BMP8b in the BF in both WT and TRPV1−/− mice.
We measured the mRNA levels of genes that regulate the browning of WAT and BAT thermogenesis. We analyzed the mRNA level of SiRT-1, an NAD+-dependent deacetylase. SiRT-1 triggers browning of WAT by deacetylating PPARγ and PRDM-16 and facilitating their interaction. PRDM-16 is a transcription factor that promotes browning of WAT and PPARγ coactivator 1α (PGC-1α) regulates mitochondrial biogenesis, UCP-1 transcription, and brown fat activation [21]. The mRNA levels of these genes are given in Figures 2G and H. Although we did not observe any difference in the levels of SiRT-1, PRDM-16, and PGC-1α in the EF of WT and TRPV1−/−mice (Figure 2G), they were significantly reduced in the BF of NCD-fed TRPV1−/− mice (Figure 2H). The mRNA of SiRT-1, PRDM-16, and PGC-1α in both EF and BF of WT and TRPV1−/− mice were decreased under HFD-fed conditions. Further, it is interesting to note that SiRT-1 mRNA was enhanced in the NCD-fed TRPV1−/− mice compared to WT.
Next, we evaluated the expression of thermogenic proteins in the BF and SCF isolated from these mice. Immunoblotting experiments demonstrated that the endogenous expression of PPARα, PPARγ, PGC-1α, PRDM-16, SiRT-1, UCP-1, and were higher in the WT compared to TRPV1−/− mice in the BAT (Figure 3). Also, the expression of all these proteins was suppressed in HFD-fed WT and TRPV1−/− mice. The enhancement of PPARγ mRNA in the BF of TRPV1−/− mice (Figure 2D) did not correlate with the protein expression in the BAT of these mice (Figure 3B). Similar to BF, HFD feeding for 32 weeks suppressed the expression of thermogenic proteins in the inguinal WAT of WT and TRPV1−/− mice (Figure 4).
Figure 3. Adipogenic and thermogenic proteins expression in the intrascapular BAT of NCD or HFD-fed WT and TRPV1−/− mice.
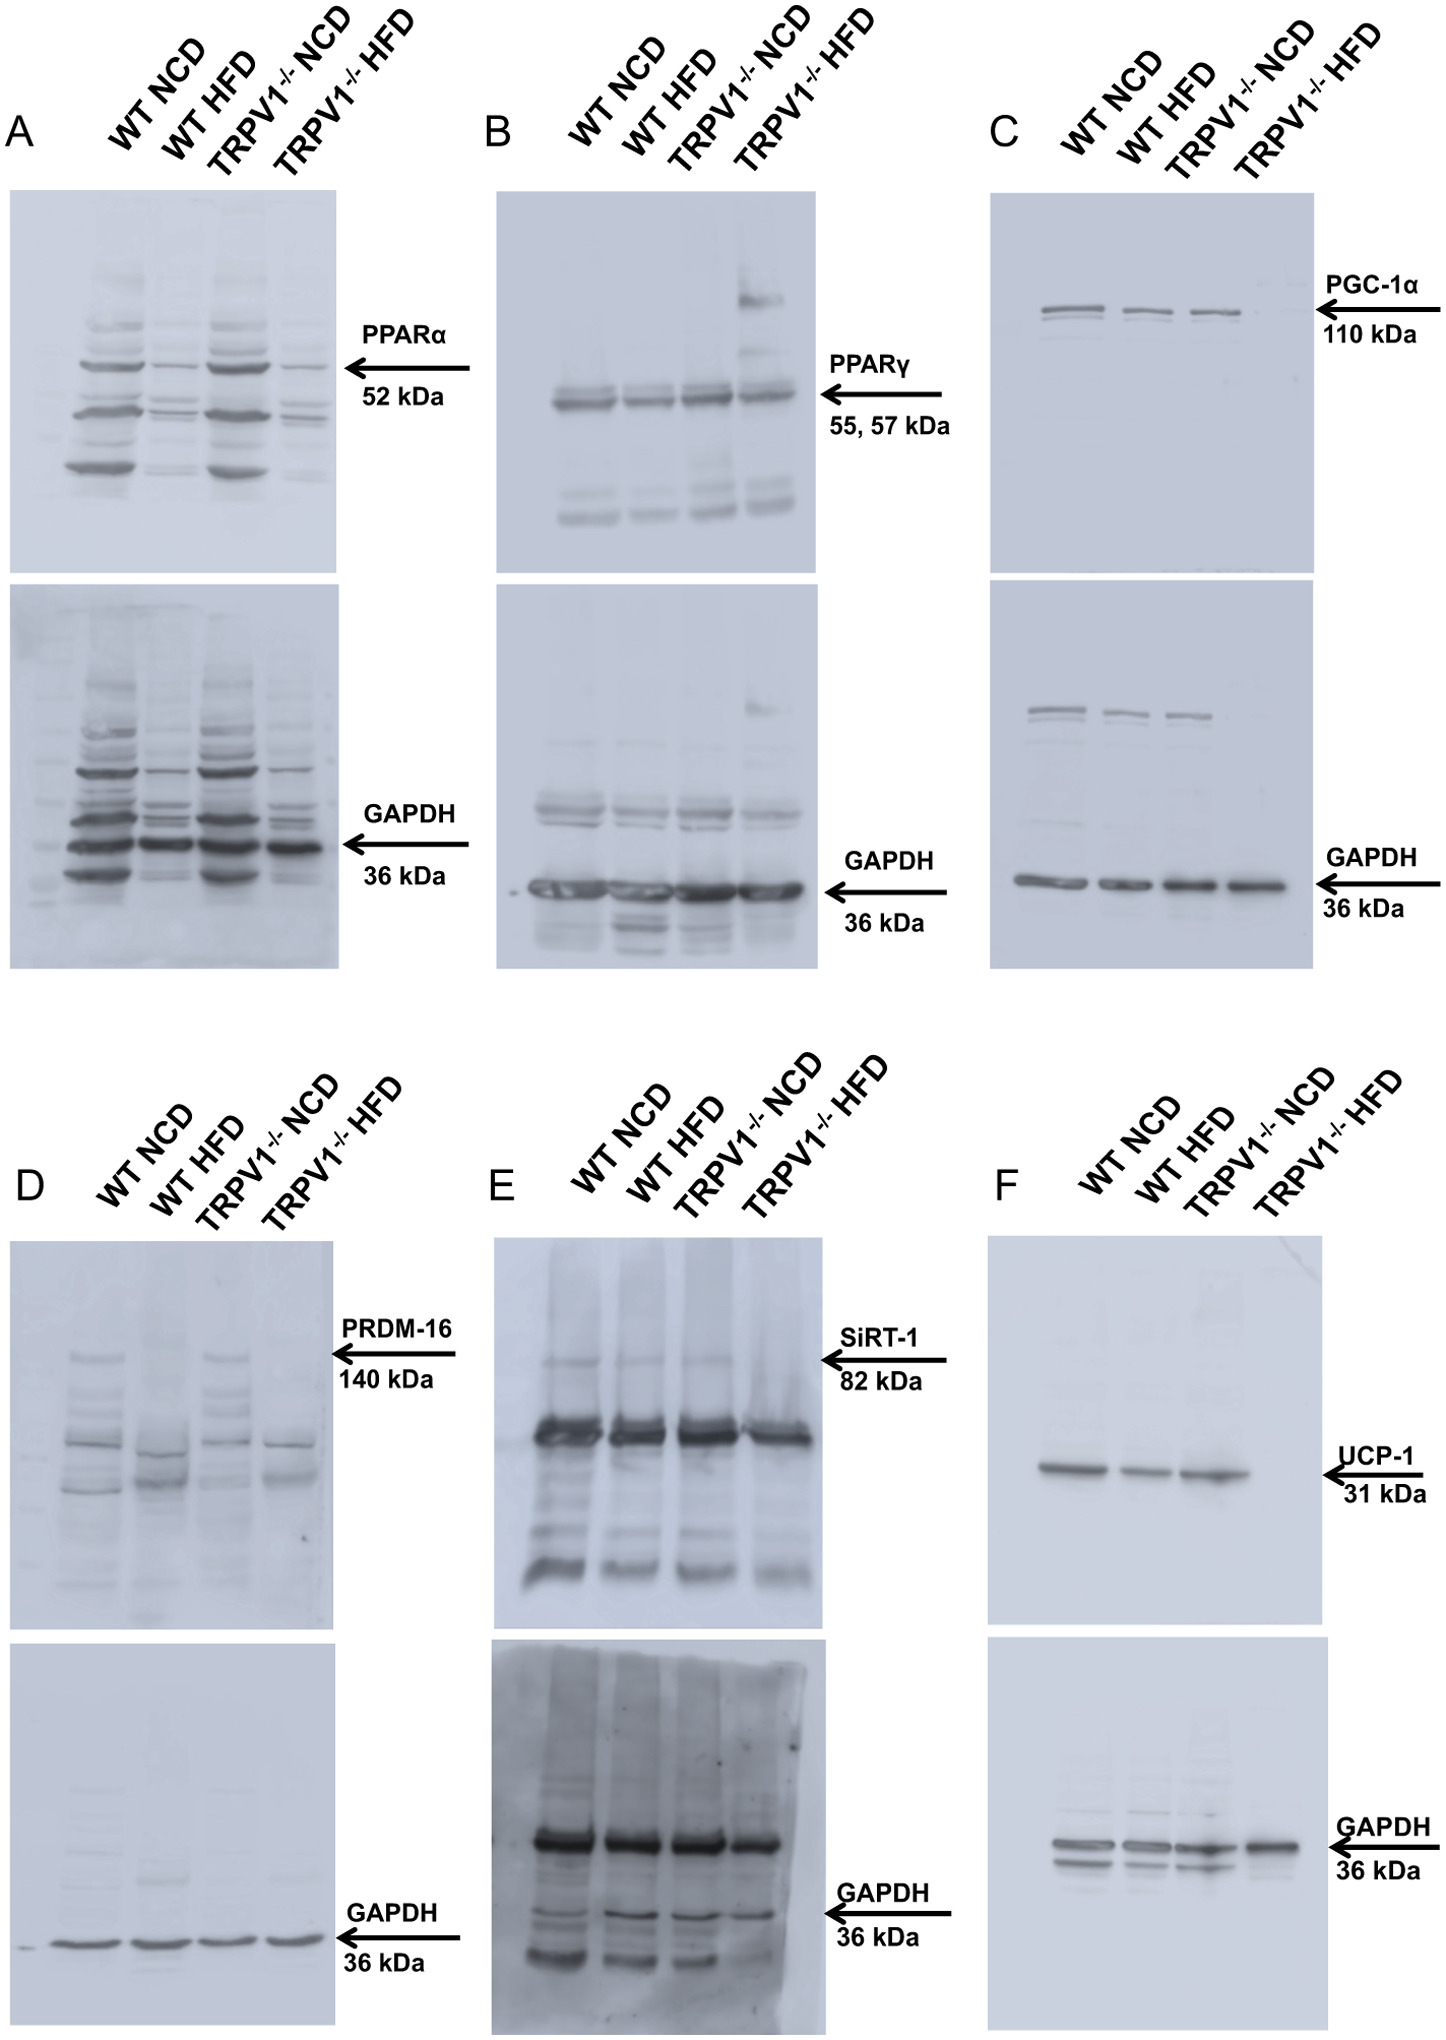
Representative western blot showing the expression of PPARα (A) and PPARγ (B), PGC-1α (C), PRDM-16 (D), SiRT-1 (E), and UCP-1 (F) in the intrascapular BAT of NCD or HFD fed WT and TRPV1−/− mice.
Figure 4. Adipogenic and thermogenic protein expression in the subcutaneous (inguinal) WAT of NCD or HFD-fed WT and TRPV1−/− mice.
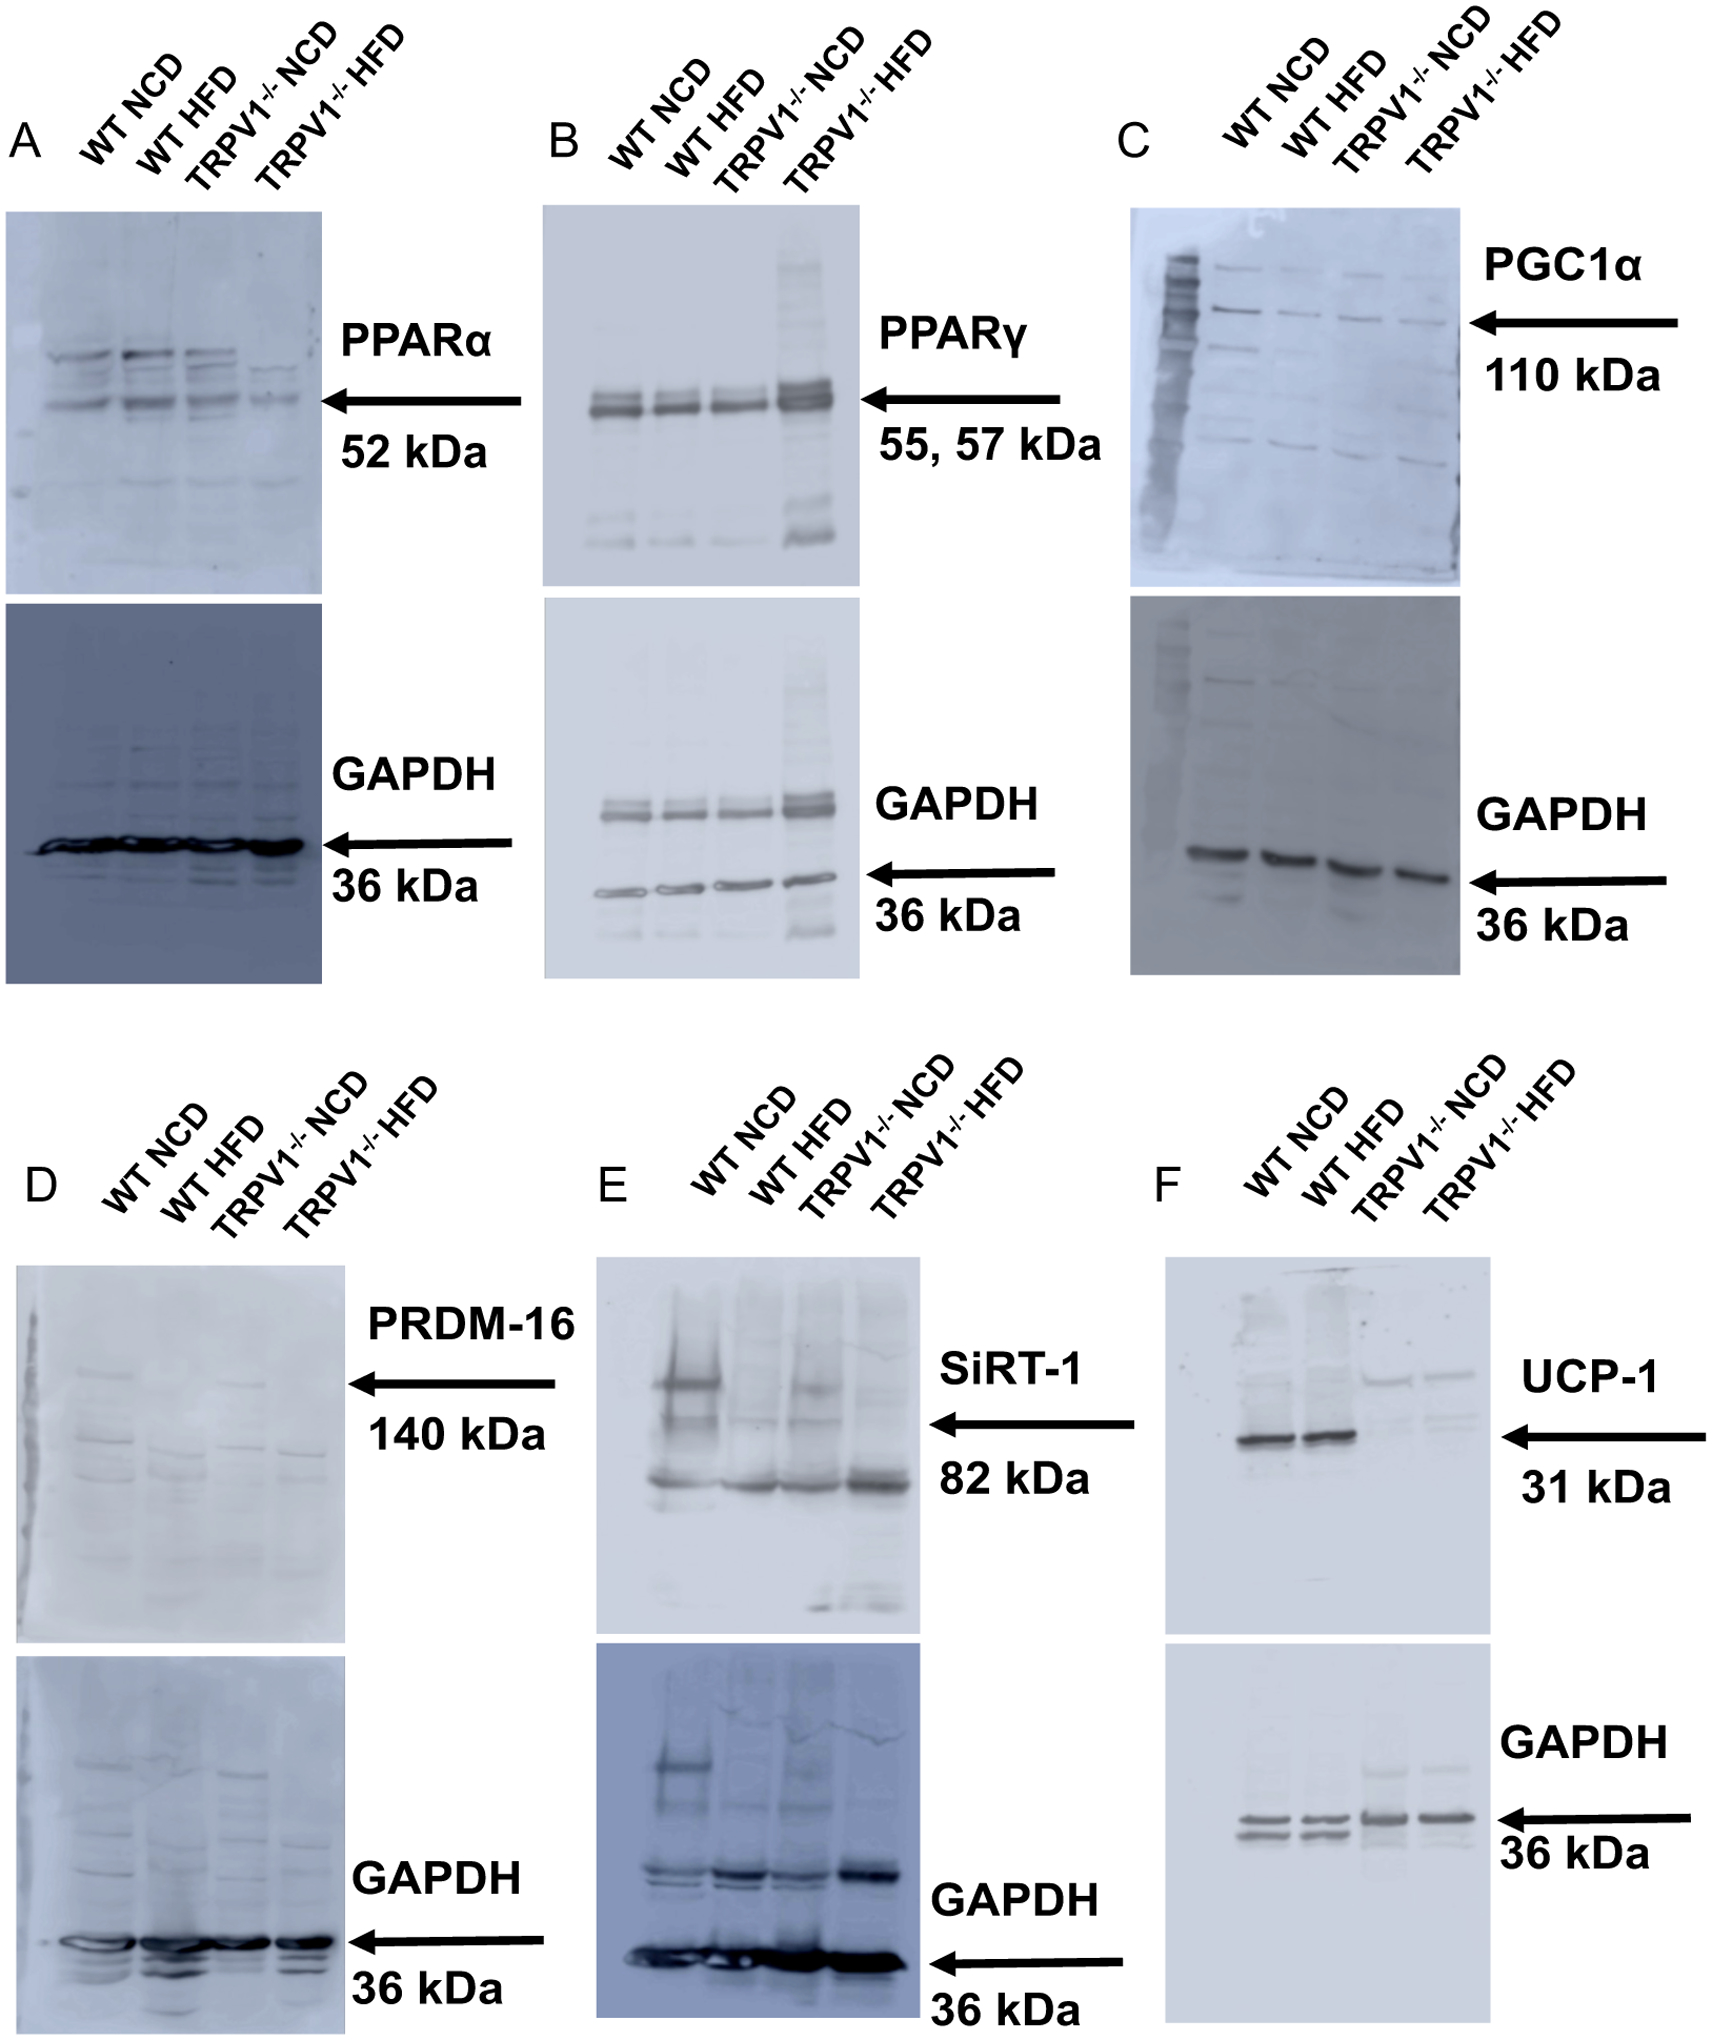
Representative western blot showing the expression of PPARα (A) and PPARγ (B), PGC-1α (C), PRDM-16 (D), SiRT-1 (E), and UCP-1 (F) in the inguinal WAT of NCD or HFD fed WT and TRPV1−/− mice.
HFD-induced obesity is often associated with fatty liver. Since TRPV1 is implicated in fatty liver disease, we analyzed whether TRPV1−/− are protected from a fatty liver caused by feeding HFD. As shown in Figure 5A through C, HFD-feeding resulted in hepatic steatosis and fat accumulation in the liver of both WT and TRPV1−/− mice. Also, the steatosis score and ballooning calculated by the method explained by Kleiner et al., [22] were higher in the liver sections of TRPV1−/− mice compared to WT mice. However, hepatic steatosis is more pronounced in the liver of TRPV1−/− mice.
Figure 5. HFD-induced fatty liver is enhanced in TRPV1−/− mice.
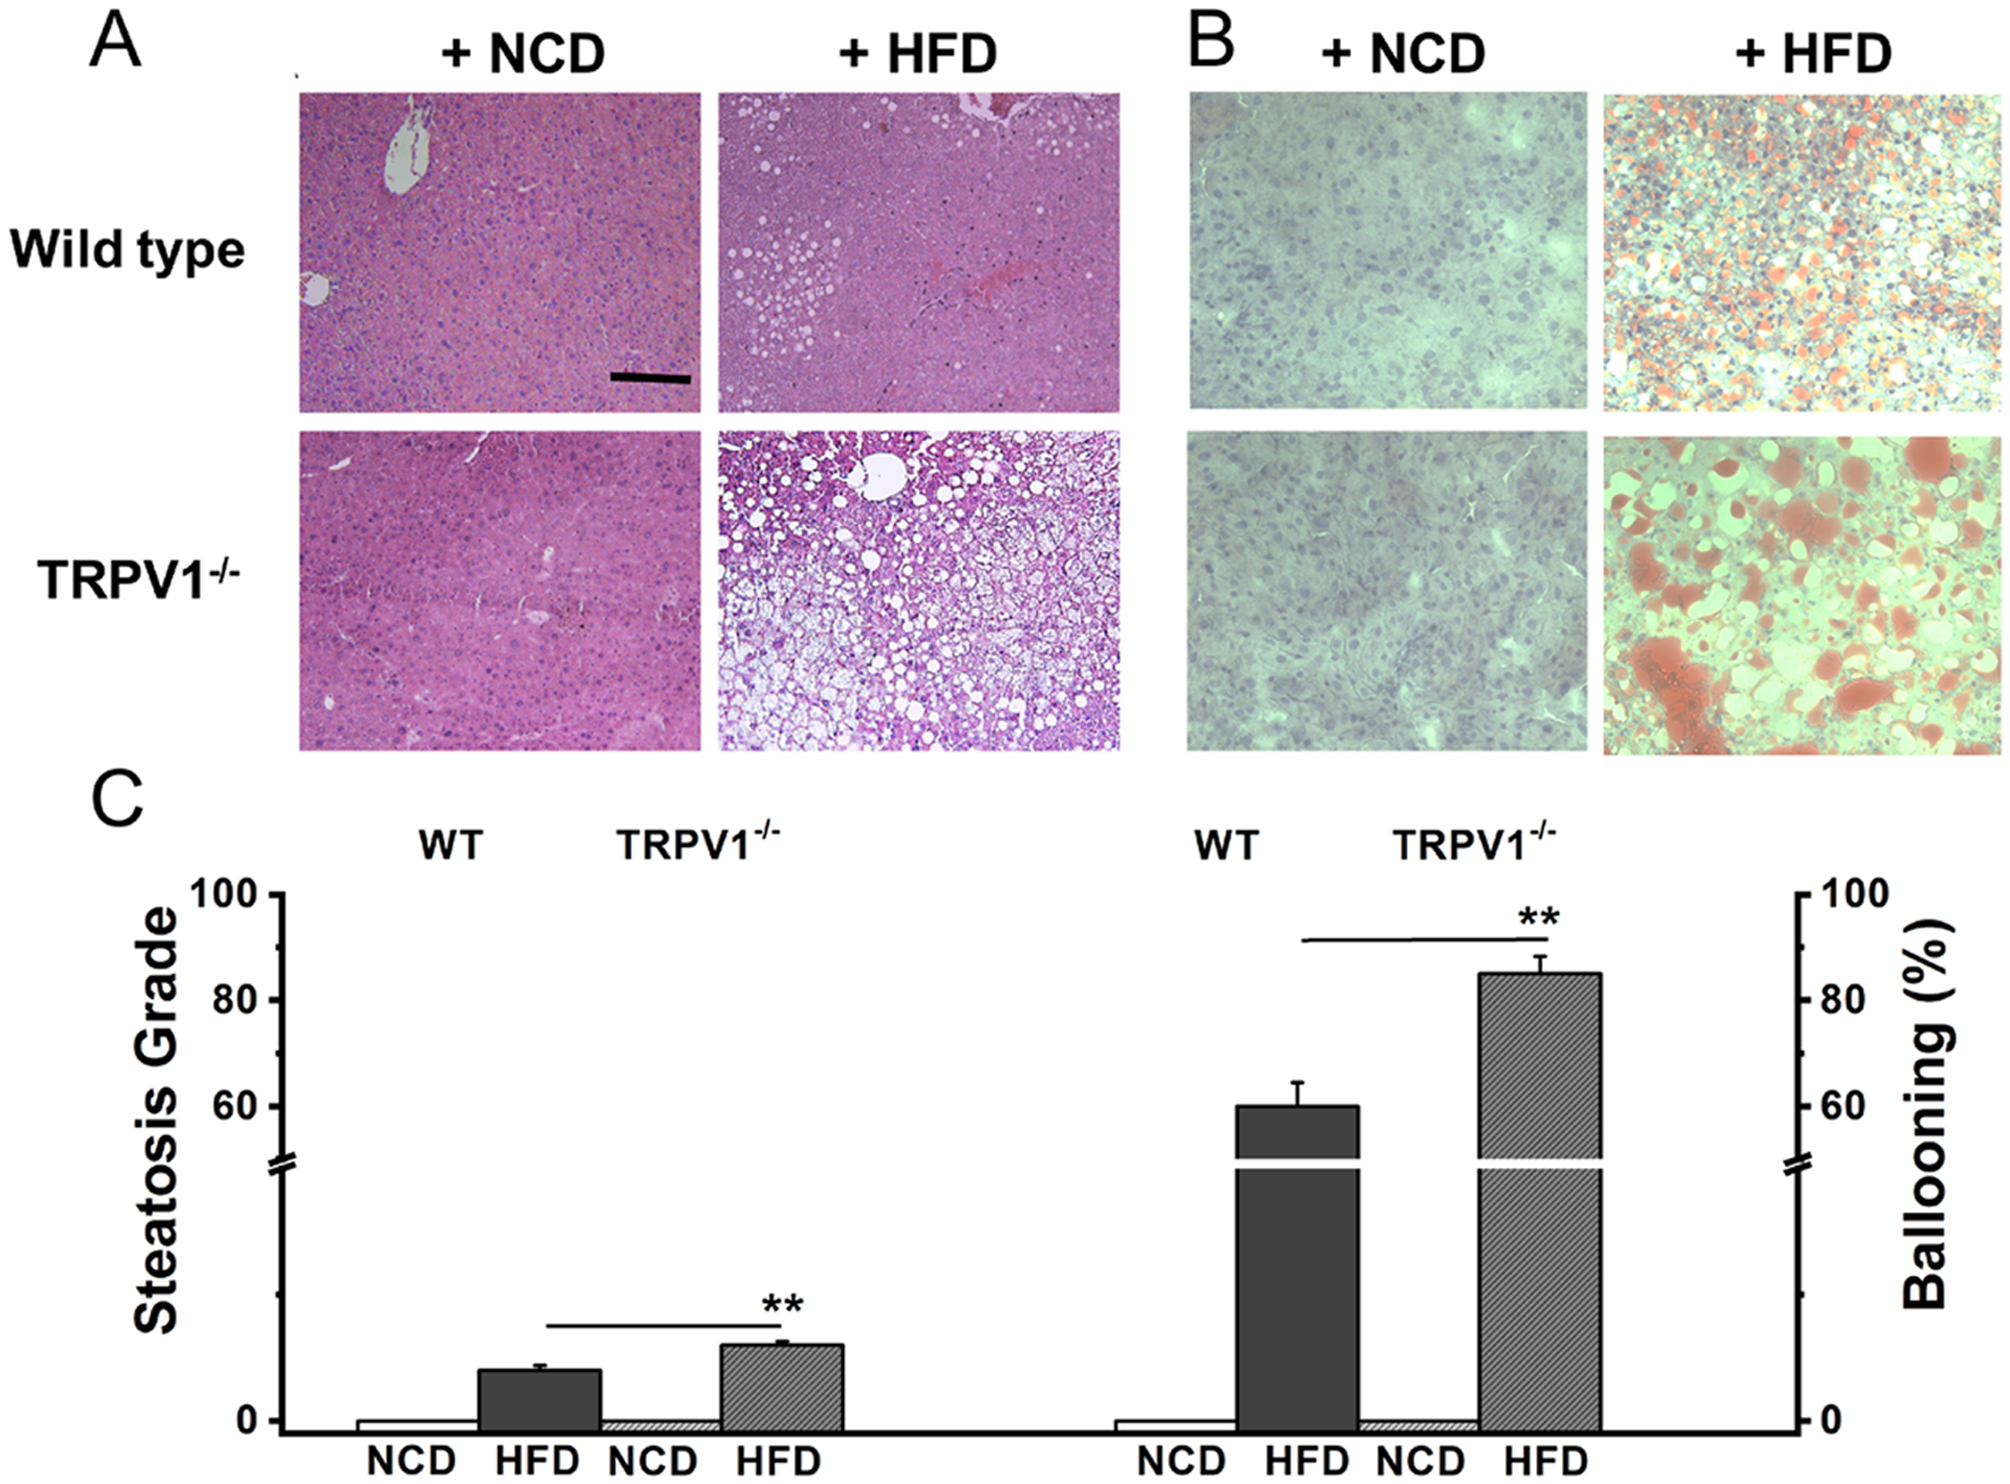
A. Hematoxylin and Eosin staining showing hepatic steatosis in NCD or HFD fed WT (top panel) and TRPV1−/− (bottom panel) mice (n = 6 per condition). B. Oil red O staining in the liver sections of WT (top panel) and TRPV1−/− mice (bottom panel) (n = 6 per condition). C. Steatosis and ballooning scores for the liver sections of WT and TRPV1−/− mice. Scale bar represents 50 μm. ** statistical significance at P < 0.05 for n = 5 per condition.
Next, we measured IPGTT and post-feeding plasma GLP-1 levels in NCD or HFD-fed WT and TRPV1−/− mice. HFD feeding resulted in hyperglycemia (Figure 6A), hypercholesterolemia (Figure 6B), and inhibited plasma GLP-1 levels (Figure 6C). Also, HFD-feeding caused glucose intolerance (Figures 6D and E) in both WT and TRPV1−/− mice.
Figure 6. HFD feeding impairs glucose handling and causes glucose intolerance and hypercholesterolemia in WT and TRPV1−/− mice.
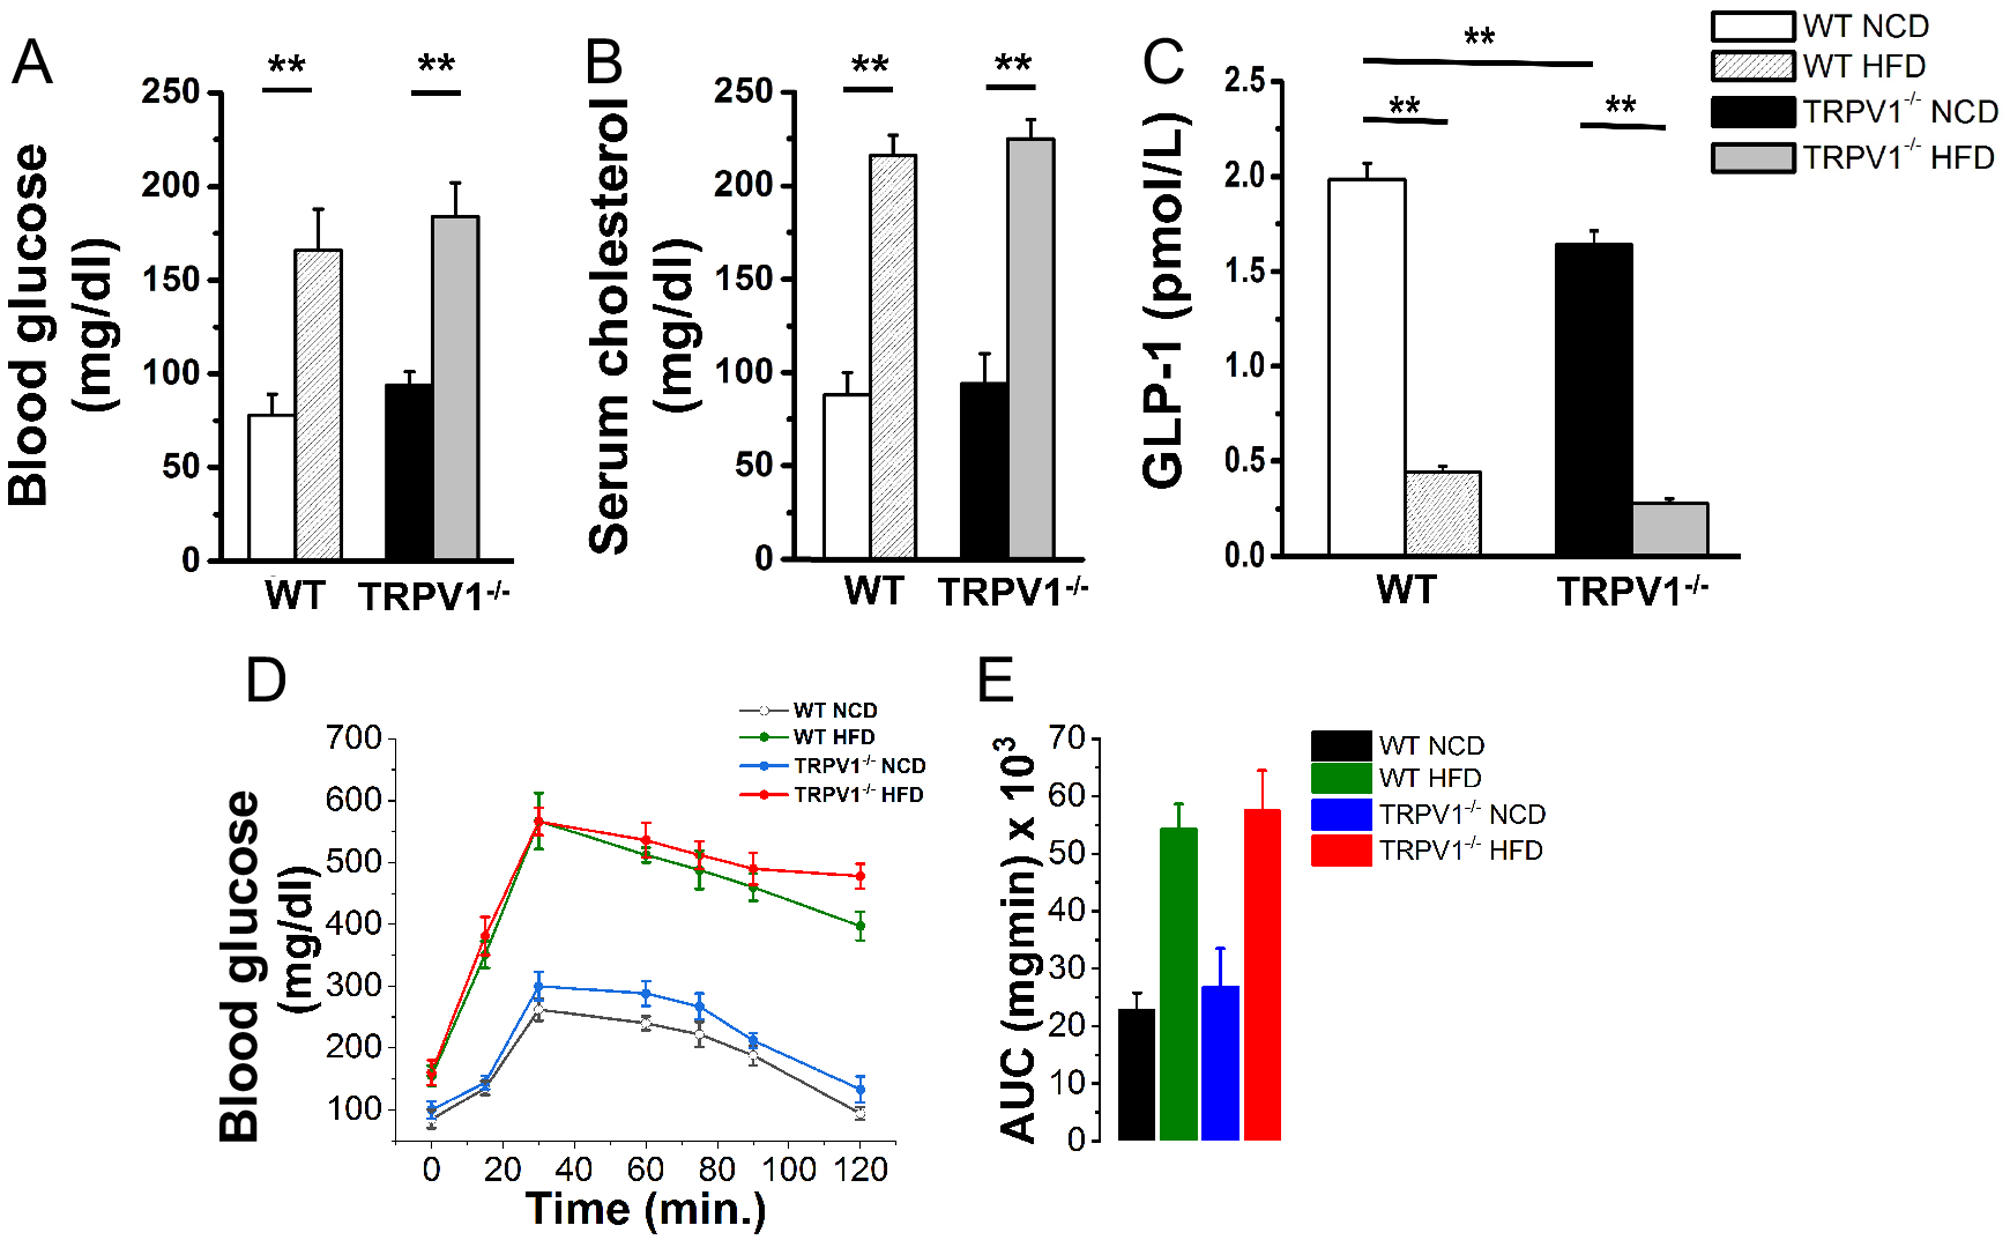
Mean fasting blood glucose ± S.E.M (A; n = 6) mean fasting serum cholesterol ± S.E.M (B; n = 6) and mean plasma GLP-1 ± S.E.M (C; n = 6) in the WT and TRPV1 at the end of 32 weeks of feeding NCD or HFD. D. IPGTT in WT and TRPV1−/− mice (n = 6). E. The area under the curve ± S.E.M for these mice. ** statistical significance at P < 0.05 for n = 6 per condition.
Discussion
Obesity leads to metabolic dysfunction. Currently, two billion people in the world are overweight and one third are obese [23]. Recent research suggests that TRPV1 is an emerging target for obesity management [4,6,8–10,13]. However, studies also indicate that lack of TRPV1 protects against obesity and metabolic complications [9,13,14]. The primary focus of this study is to resolve this controversy by evaluating whether TRPV1−/− mice were resistant to HFD-induced obesity.
Our data demonstrate that HFD feeding caused an increase in body weight in both WT and TRPV1−/− mice. Interestingly, TRPV1−/− mice gained significantly more weight during the weeks 10 to 15 and 25 to 30, compared to wild-type mice, without a concomitant change in energy intake (Figures 1 A, B, and C). Thus, TRPV1−/− mice were not resistant to HFD-induced obesity. This observation is in contrast with a previous work suggesting that lack of TRPV1 protected mice from diet-induced obesity [9]. One reason for this discrepancy is the type of HFD and the amount of fat from calories in these studies. The number of calories from fat was observed to be 25.8% in the Purina Diet 5015 used by Motter and Ahern, 2008 [9] while 60% in this and previous studies [3,24].
Also, the weights of inguinal, retroperitoneal, and gonadal fats were significantly increased in the HFD-fed mice in both groups, the draw weights of both inguinal and retroperitoneal WAT higher in HFD-fed TRPV1−/− mice compared to WT. Adipose hypertrophy was observed in both groups of mice-fed HFD compared to NCD-fed conditions.
Analysis of metabolic activity studies revealed that NCD-fed TRPV1−/− mice exhibited less energy expenditure (Figure 1 M, N, and O) and reduced locomotor activity (Figures 1P, Q, and R). Energy expenditure was more significantly decreased in the active dark cycle of NCD-fed TRPV1−/− mice, while locomotor activity was reduced in both dark and light cycles compared to WT. These may contribute to the slight but significant weight gain observed in the TRPV1−/− mice. In contrast to this observation, previous research showed that TRPV1−/− mice exhibited higher locomotor and basal hypometabolic (lower oxygen consumption) activities at 27 °C [25]. This can be due to the differences in the experimental conditions as our studies were performed at 22–24 °C and not at 27 °C. Another possible reason could be the age of the mice used in the experiments. That is, previous research showed that older TRPV1−/− mice showed reduced locomotor activity compared to younger ones [26]. Our experiments were performed with 38 weeks old mice, and under these conditions, TRPV1−/− mice showed reduced locomotor activity in both light and dark cycles. But, in HFD-fed obese mice locomotor activity was reduced in both groups.
One limitation of the current study is that it compared the locomotor activities of 38 weeks old WT and TRPV1−/− mice-fed NCD or HFD. The contribution of the age of the mice has to be weighed in and future studies are required to analyze the effect of aging on metabolic and locomotor activities in the WT and TRPV1−/− mice. Nonetheless, these data clarify that TRPV1 is implicated in locomotor activity regulation but how TRPV1 regulates locomotor activity remains to be resolved.
The reduced locomotor activity observed in NCD-fed TRPV1−/− mice can be due to neurological changes. For example, the reduction in SiRT-1 in TRPV1−/− mice may cause these changes presumably due to an overall reduction in metabolism. But, it is difficult to correlate the reduction in SiRT-1 in adipose tissues to affect locomotor behaviors. Nonetheless, an overall reduction in the locomotor activity associated with reduced energy expenditure in the dark and light cycles may lead to an increase in body weight of NCD-fed TRPV1−/− mice.
Interestingly, TRPV1 inhibitors are shown to increase energy metabolism [27–29]. However, in the physiological context, the lack of expression of TRPV1 does not mimic the inhibition of TRPV1. Moreover, TRPV1 inhibitors are known for causing hyperthermia in WT mice, which is an undesired side effect of such compounds [30,31]. Further studies using thermoneutral TRPV1 inhibitors [32] are required to clarify the role of TRPV1 in the regulation of metabolic activity. Also, several of these studies have evaluated metabolic activity only acutely in TRPV1−/− mice, while the results presented in this study were conducted for 48 hours post 32 weeks of feeding NCD or HFD.
Previous research demonstrates the involvement of TRPV1 in the transcription regulatory process in thermal regulation and inflammation [33,34]. In this study, we observed a significant difference between the expression levels of adipogenic and thermogenic transcription factors in the white and brown fat of NCD or HFD-fed WT and TRPV1−/− mice (Figure 2). These transcription factors regulate adipogenesis, adipocyte maturation [35] and fatty acid metabolism [36,37]. Also, we observed that TRPV1−/− mice expressed reduced thermogenic proteins compared to WT endogenously (Figures 3 and 4). This is a striking observation but the mechanism by which TRPV1 regulates the expression of transcription factors, which govern adipogenic and thermogenic mechanisms remains to be resolved. The reduced expression of UCP-1 in the TRPV1−/− correlates with the decrease in PPARα since PPARα regulates the transcription of UCP-1 [38]. Also, HFD feeding suppressed both PPARα and UCP-1 in EF.
In contrast to EF, we did not see a significant difference in the mRNA of either PPARs in the BF of WT and TRPV1−/− NCD-fed mice. However, the levels of UCP-1 and BMP8b were both decreased in the TRPV1−/− mice. Similarly, the levels of PRDM16 and PGC-1α, which regulate BF differentiation and activation respectively, are decreased in BF. Taken together, this indicates that a deficit in the thermogenic machinery in the BF of TRPV1−/− mice which could make them more susceptible to metabolic dysfunctions when challenged with HFD. Surprisingly, we found an increase in the expression level of sirtuin 1 mRNA in NCD-fed TRPV1−/− mice compared to WT mice. However, the SiRT-1 protein expression was reduced in these mice, even under NCD-fed conditions.
It is important to note that the mRNA and protein levels of adipogenic and thermogenic markers in the NCD or HFD-fed WT and TRPV1−/− mice lack a stoichiometric correlation. Therefore, a careful interpretation is necessary for determining the specific effect of a decrease or increase in mRNA and protein levels in research studies. However, based on the analysis of protein expression, NCD-fed TRPV1−/− mice expressed lower levels of adipogenic and thermogenic proteins in the SCF and BF, except PRDM-16 in the SCF. This could be a reason for the higher weight gain observed in the TRPV1−/− mice.
Further, this research presents another important observation that TRPV1 was downregulated by HFD feeding in the WT mice. Lipid accumulation in 3T3-L1 adipocytes has previously been shown to inhibit TRPV1 [11]. But the mechanism behind this remains to be determined. A possible mechanism may include the suppression of transcriptional factors that regulate TRPV1 expression by HFD [39]. This has to be further evaluated to clarify the mechanism by which HFD suppresses TRPV1. Moreover, it is important to note that chronic HFD feeding downregulated the expression of several thermogenic proteins.
Fatty liver is a common comorbidity associated with obesity [40,41]. Fatty liver also occurs independently of obesity [42]. Our data indicate that fatty liver occurred in both WT and TRPV1−/− mice that received HFD-diet. Further, the intensity of hepatic steatosis was seen more pronounced in the TRPV1−/− mice, as evidenced by higher steatosis scores and hepatic ballooning (Figure 5A and B). This observation raises an important question – what is the physiological role of TRPV1 in the regulation of lipid metabolism in the liver? PPARα is important for lipid metabolism and there was a reduction in endogenous PPARα protein expression in TRPV1−/− mice. Therefore, it is reasonable to speculate that the reduced expression of PPARα in HFD-fed WT and TRPV1−/− mice decreases fatty acid oxidation in the liver of these mice. This could cause impairment of glucose handling in these mice. These effects associated with a reduction in GLP-1 levels in these mice may underlie the cause of metabolic dysfunctions in these mice.
Overall, our data indicate that the lack of TRPV1 does not protect mice from diet-induced obesity. Further, endogenous TRPV1 regulates the expression of adipogenic transcriptional factors (PPARs) and thermogenic genes and proteins in EF, SCF, and BF of TRPV1−/− mice. Given its role in adipocyte differentiation, browning of WAT and BAT thermogenesis, the implication of TRPV1 in metabolic regulation cannot be ignored. Our data also suggest that TRPV1−/− mice could be more susceptible to metabolic dysfunction due to decreased expression of thermogenic genes in the white and brown fat. The increased steatosis was seen in TRPV1−/− mice, following HFD-mediated metabolic insult (Figure 5), which also suggests that a lack of TRPV1 may play a role in basal lipid metabolism. But, the mechanism behind this remains unclear. Consistent with this, a previous report suggests that NCD-fed TRPV1−/− mice had a higher random blood glucose level compared to WT mice [14]. However, the precise effects of lack of TRPV1 in neurological and adipose tissue-dependent functions remain to be determined. Nonetheless, our work clarifies that lack of TRPV1 does not protect mice from obesity but rather exacerbates HFD-induced metabolic dysfunction. TRPV1−/− mice exhibit decreased expression of thermogenic proteins in white and brown fats, which is suggestive of a significant genotypic difference between them and WT mice.
Supplementary Material
Supplemental Figure 1. Organ/tissue weights of NCD or HFD-fed WT and TRPV1−/− mice. The mean (± S.E.M. n = 6/condition) weight of heart (A), liver (B), spleen (C), kidneys (D), gonadal fat (E), inguinal fat (F), brown fat (G), and retroperitoneal fat (H) of 32 weeks old NCD or HFD-fed WT and TRPV1−/− mice. ** represents statistical significance P < 0.05 between NCD or HFD-fed WT or TRPV1−/− mice. $$ represents statistical significance P < 0.05 between HFD-fed WT or TRPV1−/− mice.
Supplemental Figure 2. Agarose gel picture for genotyping TRPV1−/− mice. Representative image of 1% agarose gel. Ear clippings were digested in 0.075 mL of 25 mM NaOH/0.2 mM EDTA, digested at 98 °C for an hour, and neutralized with 40mM Tris EDTA pH 5.5. An aliquot of 2 μL was used for PCR reaction. The PCR product was then resolved in an ethidium bromide containing 1% agarose gel using 1 kb plus DNA ladder as a marker.
Funding and acknowledgment
This work was supported by funding from a pilot project of the National Institute of General Medical Sciences of the NIH under award number 8P20 GM103432-12 and WY NASA Faculty Research Initiation Grant for BT.
Abbreviation:
- BAT
brown adipose tissue
- BF
brown fat
- BMP8b
bone morphogenetic protein 8b
- EF
epididymal fat
- GLP-1
glucagon like peptide 1
- HFD
high fat diet
- IPGTT
intraperitoneal glucose tolerance test
- NAD+
nicotinamide adenine dinucleotide
- NCD
normal chow diet
- PPAR
peroxisome proliferator activated receptor
- PGC-1α
PPAR gamma 1 coactivator
- PRDM-16
PR domain containing 16
- SiRT-1
sirtuin 1
- TRPV1
transient receptor potential cation channel, subfamily V number 1
- TRPV1−/−
TRPV1 knockout
- mtrpv1
mouse TRPV1
- UCP-1
uncoupling protein 1
- WAT
white adipose tissue
- iWAT
inguinal WAT
- sWAT
subcutaneous WAT
- WT
wild type
Footnotes
Statement of Competing Interest
The authors have no competing interests.
Data Availability
Data supporting the findings are available in the figures, tables, and supplementary material of this article.
References
- [1].Luo Z et al. (2012). TRPV1 activation improves exercise endurance and energy metabolism through PGC-1α upregulation in mice. Cell Res 22, 551–64. [DOI] [PMC free article] [PubMed] [Google Scholar]
- [2].Li L et al. (2012). TRPV1 activation prevents nonalcoholic fatty liver through UCP2 upregulation in mice. Pflugers Arch 463, 727–32. [DOI] [PubMed] [Google Scholar]
- [3].Baskaran P, Krishnan V, Ren J and Thyagarajan B (2016). Capsaicin induces browning of white adipose tissue and counters obesity by activating TRPV1 channel-dependent mechanisms. Br J Pharmacol 173, 2369–89. [DOI] [PMC free article] [PubMed] [Google Scholar]
- [4].Zhang LL et al. (2007). Activation of transient receptor potential vanilloid type-1 channel prevents adipogenesis and obesity. Circ Res 100, 1063–70. [DOI] [PubMed] [Google Scholar]
- [5].Yoneshiro T, Aita S, Kawai Y, Iwanaga T and Saito M (2012). Nonpungent capsaicin analogs (capsinoids) increase energy expenditure through the activation of brown adipose tissue in humans. Am J Clin Nutr 95, 845–50. [DOI] [PubMed] [Google Scholar]
- [6].Chen J et al. (2015). Activation of the TRPV1 channel by dietary capsaicin improves visceral fat remodeling through connexin43-mediated Ca2+ influx. Cardiovasc Diabetol 14, 22. [DOI] [PMC free article] [PubMed] [Google Scholar]
- [7].Choowanthanapakorn M, Lu KW, Yang J, Hsieh CL and Lin YW (2015). Targeting TRPV1 for Body Weight Control using TRPV1(−/−) Mice and Electroacupuncture. Sci Rep 5, 17366. [DOI] [PMC free article] [PubMed] [Google Scholar]
- [8].Lee E et al. (2015). Transient receptor potential vanilloid type-1 channel regulates diet-induced obesity, insulin resistance, and leptin resistance. FASEB J 29, 3182–92. [DOI] [PMC free article] [PubMed] [Google Scholar]
- [9].Motter AL and Ahern GP (2008). TRPV1-null mice are protected from diet-induced obesity. FEBS Lett 582, 2257–62. [DOI] [PMC free article] [PubMed] [Google Scholar]
- [10].Yu Q et al. (2012). Expression of TRPV1 in rabbits and consuming hot pepper affects its body weight. Mol Biol Rep 39, 7583–9. [DOI] [PubMed] [Google Scholar]
- [11].Krishnan V, Baskaran P and Thyagarajan B (2019). Troglitazone activates TRPV1 and causes deacetylation of PPARgamma in 3T3-L1 cells. Biochim Biophys Acta Mol Basis Dis 1865, 445–453. [DOI] [PMC free article] [PubMed] [Google Scholar]
- [12].Baskaran P, Krishnan V, Fettel K, Gao P, Zhu Z, Ren J and Thyagarajan B (2017). TRPV1 activation counters diet-induced obesity through sirtuin-1 activation and PRDM-16 deacetylation in brown adipose tissue. Int J Obes (Lond) 41, 739–749. [DOI] [PMC free article] [PubMed] [Google Scholar]
- [13].Marshall NJ et al. (2013). A role for TRPV1 in influencing the onset of cardiovascular disease in obesity. Hypertension 61, 246–52. [DOI] [PubMed] [Google Scholar]
- [14].Motter A (2011) Doctoral Thesis - Novel Roles for TRPA1 and TRPV1 in nutrient sensing and obesityed.êds). Georgetown University, Washington, DC. [Google Scholar]
- [15].Baboota RK et al. (2014). Capsaicin-induced transcriptional changes in hypothalamus and alterations in gut microbial count in the high-fat diet fed mice. J Nutr Biochem 25, 893–902. [DOI] [PubMed] [Google Scholar]
- [16].Turdi S, Kandadi MR, Zhao J, Huff AF, Du M and Ren J (2011). Deficiency in AMP-activated protein kinase exaggerates high fat diet-induced cardiac hypertrophy and contractile dysfunction. Journal of molecular and cellular cardiology 50, 712–22. [DOI] [PMC free article] [PubMed] [Google Scholar]
- [17].Ren J (2004). Leptin and hyperleptinemia - from friend to foe for cardiovascular function. The Journal of endocrinology 181, 1–10. [DOI] [PubMed] [Google Scholar]
- [18].Bagchi DP and MacDougald OA (2019). Identification and Dissection of Diverse Mouse Adipose Depots. J Vis Exp [DOI] [PMC free article] [PubMed] [Google Scholar]
- [19].Yan Z (2019). https://faculty.virginia.edu/yanlab/Protocols/Western blot quantification by Image J.pdf.
- [20].Davarinejad H Quantifications of Western Blots with ImageJ. [Google Scholar]
- [21].Bargut TCL, Souza-Mello V, Aguila MB and Mandarim-de-Lacerda CA (2017). Browning of white adipose tissue: lessons from experimental models. Horm Mol Biol Clin Investig 31 [DOI] [PubMed] [Google Scholar]
- [22].Kleiner DE et al. (2005). Design and validation of a histological scoring system for nonalcoholic fatty liver disease. Hepatology 41, 1313–21. [DOI] [PubMed] [Google Scholar]
- [23].Seidell JC and Halberstadt J (2015). The global burden of obesity and the challenges of prevention. Ann Nutr Metab 66 Suppl 2, 7–12. [DOI] [PubMed] [Google Scholar]
- [24].Baskaran P, Markert L, Bennis J, Zimmerman L, Fox J and Thyagarajan B (2019). Assessment of Pharmacology, Safety, and Metabolic activity of Capsaicin Feeding in Mice. Sci Rep 9, 8588. [DOI] [PMC free article] [PubMed] [Google Scholar]
- [25].Garami A et al. (2011). Thermoregulatory phenotype of the Trpv1 knockout mouse: thermoeffector dysbalance with hyperkinesis. J Neurosci 31, 1721–33. [DOI] [PMC free article] [PubMed] [Google Scholar]
- [26].Wanner SP, Garami A and Romanovsky AA (2011). Hyperactive when young, hypoactive and overweight when aged: connecting the dots in the story about locomotor activity, body mass, and aging in Trpv1 knockout mice. Aging (Albany NY) 3, 450–4. [DOI] [PMC free article] [PubMed] [Google Scholar]
- [27].Hai J, Kawabata F, Uchida K, Nishimura S and Tabata S (2020). Intragastric administration of AMG517, a TRPV1 antagonist, enhanced activity-dependent energy metabolism via capsaicin-sensitive sensory nerves in mice. Biosci Biotechnol Biochem 84, 2121–2127. [DOI] [PubMed] [Google Scholar]
- [28].Garami A, Shimansky YP, Pakai E, Oliveira DL, Gavva NR and Romanovsky AA (2010). Contributions of different modes of TRPV1 activation to TRPV1 antagonist-induced hyperthermia. J Neurosci 30, 1435–40. [DOI] [PMC free article] [PubMed] [Google Scholar]
- [29].Garami A et al. (2018). TRPV1 antagonists that cause hypothermia, instead of hyperthermia, in rodents: Compounds’ pharmacological profiles, in vivo targets, thermoeffectors recruited, and implications for drug development. Acta Physiol (Oxf) 223, e13038. [DOI] [PMC free article] [PubMed] [Google Scholar]
- [30].Nash MS et al. (2012). 7-tert-Butyl-6-(4-chloro-phenyl)-2-thioxo-2,3-dihydro-1H-pyrido[2,3-d]pyrimidin-4 -one, a classic polymodal inhibitor of transient receptor potential vanilloid type 1 with a reduced liability for hyperthermia, is analgesic and ameliorates visceral hypersensitivity. J Pharmacol Exp Ther 342, 389–98. [DOI] [PubMed] [Google Scholar]
- [31].Brown W, Leff RL, Griffin A, Hossack S, Aubray R, Walker P, and Chiche DA (2017). Safety, Pharmacokinetics, and Pharmacodynamics Study in Healthy Subjects of Oral NEO6860, a Modality Selective Transient Receptor Potential Vanilloid Subtype 1 Antagonist. J Pain 18, 726–738. [DOI] [PubMed] [Google Scholar]
- [32].Damann N et al. (2020). In vitro characterization of the thermoneutral transient receptor potential vanilloid-1 (TRPV1) inhibitor GRTE16523. Eur J Pharmacol 871, 172934. [DOI] [PubMed] [Google Scholar]
- [33].Yoshida A, Furube E, Mannari T, Takayama Y, Kittaka H, Tominaga M and Miyata S (2016). TRPV1 is crucial for proinflammatory STAT3 signaling and thermoregulation-associated pathways in the brain during inflammation. Sci Rep 6, 26088. [DOI] [PMC free article] [PubMed] [Google Scholar]
- [34].Obi S et al. (2016). Heat induces interleukin-6 in skeletal muscle cells via TRPV1/PKC/CREB pathways. J Appl Physiol (1985), jap.00139.2016. [DOI] [PubMed] [Google Scholar]
- [35].Farmer SR (2005). Regulation of PPAR|[gamma]| activity during adipogenesis. International Journal of Obesity 29 [DOI] [PubMed] [Google Scholar]
- [36].Contreras AV, Torres N and Tovar AR (2013). PPAR-α as a Key Nutritional and Environmental Sensor for Metabolic Adaptation. [DOI] [PMC free article] [PubMed]
- [37].Smith SA (2002). Peroxisome proliferator-activated receptors and the regulation of mammalian lipid metabolism. Biochem Soc Trans 30, 1086–90. [DOI] [PubMed] [Google Scholar]
- [38].Rachid TL, Penna-de-Carvalho A, Bringhenti I, Aguila MB, Mandarim-de-Lacerda CA and Souza-Mello V (2015). PPAR-alpha agonist elicits metabolically active brown adipocytes and weight loss in diet-induced obese mice. Cell Biochem Funct 33, 249–56. [DOI] [PubMed] [Google Scholar]
- [39].Brenner R, Baskaran P and Thyagarajan B (2018). Regulation of TRPV1 Expression in Non-Neuronal Tissues by BDNF, Sp1, and Sp4. 2389-Pos Board B405 at the 62nd Annual Meeting of Biophysical Society held at San Francisco, CA, Feb 17–21, 2018. [Google Scholar]
- [40].Ornellas F, Souza-Mello V, Mandarim-de-Lacerda CA and Aguila MB (2015). Programming of obesity and comorbidities in the progeny: lessons from a model of diet-induced obese parents. PLoS One 10, e0124737. [DOI] [PMC free article] [PubMed] [Google Scholar]
- [41].Guijarro de Armas MG, Monereo Megias S, Navea Aguilera C, Merino Viveros M and Vega Pinero MB (2015). [Non-alcoholic fatty liver in children and adolescents with excess weight and obesity]. Med Clin (Barc) 144, 55–8. [DOI] [PubMed] [Google Scholar]
- [42].Kim D and Kim WR (2017). Nonobese Fatty Liver Disease. Clin Gastroenterol Hepatol 15, 474–485. [DOI] [PubMed] [Google Scholar]
Associated Data
This section collects any data citations, data availability statements, or supplementary materials included in this article.
Supplementary Materials
Supplemental Figure 1. Organ/tissue weights of NCD or HFD-fed WT and TRPV1−/− mice. The mean (± S.E.M. n = 6/condition) weight of heart (A), liver (B), spleen (C), kidneys (D), gonadal fat (E), inguinal fat (F), brown fat (G), and retroperitoneal fat (H) of 32 weeks old NCD or HFD-fed WT and TRPV1−/− mice. ** represents statistical significance P < 0.05 between NCD or HFD-fed WT or TRPV1−/− mice. $$ represents statistical significance P < 0.05 between HFD-fed WT or TRPV1−/− mice.
Supplemental Figure 2. Agarose gel picture for genotyping TRPV1−/− mice. Representative image of 1% agarose gel. Ear clippings were digested in 0.075 mL of 25 mM NaOH/0.2 mM EDTA, digested at 98 °C for an hour, and neutralized with 40mM Tris EDTA pH 5.5. An aliquot of 2 μL was used for PCR reaction. The PCR product was then resolved in an ethidium bromide containing 1% agarose gel using 1 kb plus DNA ladder as a marker.