Abstract
Despite the benefits of mechanical ventilators, prolonged or misuse of ventilators may lead to ventilation-associated/ventilation-induced lung injury (VILI). Lung insults, such as respiratory infections and lung injuries, can damage the pulmonary epithelium, with the most severe cases needing mechanical ventilation for effective breathing and survival. Damaged epithelial cells within the alveoli trigger a local immune response. A key immune cell is the macrophage, which can differentiate into a spectrum of phenotypes ranging from pro- to anti-inflammatory. To gain a greater understanding of the mechanisms of the immune response to VILI and post-ventilation outcomes, we developed a mathematical model of interactions between the immune system and site of damage while accounting for macrophage phenotype. Through Latin hypercube sampling we generated a collection of parameter sets that are associated with a numerical steady state. We then simulated ventilation-induced damage using these steady state values as the initial conditions in order to evaluate how baseline immune state and lung health affect outcomes. We used a variety of methods to analyze the resulting parameter sets, transients, and outcomes, including a random forest decision tree algorithm and parameter sensitivity with eFAST. Analysis shows that parameters and properties of transients related to epithelial repair and M1 activation are important factors. Using the results of this analysis, we hypothesized interventions and used these treatment strategies to modulate the response to ventilation for particular parameters sets.
Keywords: mathematical modeling, mechanical ventilation, immune response, macrophages
1. Introduction
Inflammation occurs in the lungs when an immune response is initiated to eliminate an insult. Types of insults include inhaled pathogens, such as influenza, Mycobacterium tuberculosis, SARS-CoV-2, and other harmful particles. In the most severe cases this leads to acute respiratory distress syndrome (ARDS). Due to respiratory failure associated with ARDS, the clinical intervention is the use of mechanical ventilation (MV) [1].
Despite the benefits of MV, prolonged or misuse of these ventilators may lead to ventilation-induced lung injury (VILI). In this work we will focus on the tissue damage associated with MV and resulting immune cell recruitment. The damage caused to alveolar sacs (clusters of alveolar cells) during MV can lead to volutrauma (extreme stress/strain), barotrauma (air leaks), atelectrauma (repeated opening and closing of alveoli), and biotrauma (general severe inflammatory response). If the trauma increases, it can lead to multi-system organ failure [2, 3].
It has also been shown that the inflammatory response of the elderly is altered in the lungs and other areas [4, 5]. As compared to younger mice, increased levels of circulating inflammatory cytokines and altered macrophage function have been reported in old mice [6]. A 2003–2008 study conducted at Bridgeport Hospital reported that 4,238 out of 9,912 (42.8%) patients received MV for a median of two days. Mortality or discharge to extended-care facilities increased for each decade of age greater than 65 years [7]. Most recently, severe forms of COVID-19, a highly infectious respiratory disease caused by the novel coronavirus SARS-CoV-2, can lead to respiratory failure and death [8]. Studies report varying but overall relatively high rates of mechanical ventilation in response to COVID-19 [9–11]. The case fatality rate for COVID-19 patients over 70 years old and over 80 years old was around 50.8% and 14.8% of the total number of deaths, respectively [12]. This is in agreement with other studies reporting higher rates of severe outcomes in patients with COVID-19 aged 65 or older [13].
The change in the inflammatory response with patient age combined with the increased need for ventilation and increased mortality rate among the elderly stress the need to investigate the influence of aging in VILI. We used mathematical modeling to investigate the role of the pulmonary innate immune response and interventions to alleviate ventilator-induced damage. At this stage of exploration of VILI, we focus on epithelial damage and immune system interactions. VILI is complex and the final injury pathways may involve pre-existing or evolving co-morbidities. However, we developed this model to explore the contribution of epithelial damage to the development of VILI in isolation.
It is difficult to clinically isolate the local epithelial and inflammatory response in the lung during VILI, and in silico modeling of experimental data from animal experiments or human cell lines may help us to understand this complex condition. In silico approaches provide the ability to explore immune responses by including various nonlinear dynamics and feedback loops in order to shed light on the specific mechanisms and interactions that drive diseases and generate hypotheses [14]. The framework we have built here addresses VILI with various parameters and initial conditions that can be narrowed in future studies with data from different age groups and/or insults to explore dynamics and driving factors in various diseases related to age and/or outcome.
We adapted a model developed by Torres et al. for the innate immune response to bacteria, which accounts for macrophage polarization along the pro- to anti- inflammatory spectrum, by including epithelial dynamics and damage-induced recruitment of immune cells [15]. We used this model to understand the mechanisms by which the immune system responds to damaged epithelial cells and the sensitivity of lung health to components of this complex process. We began by analyzing the epithelial subsystem mathematically, since this component of the model was not in Torres et al.. We performed a fixed point analysis and bifurcation diagrams for this subsystem, which is included in the supplementary material. We combined the epithelial subsystem with the Torres et al. model by adapting the immune cell dynamics such that they are triggered by epithelial cell damage rather than an infection.
The resulting model is a system of nonlinear ordinary differential equations with a substantial number of parameters. We allowed the parameters in the model to vary over specified ranges using Latin hypercube sampling to simulate the variety of immune system dynamics that may be observed. We organized parameter sets into three categories, healthy, moderate damage, and severe damage, based on the percentage of healthy epithelial cells. The breakdown of the sets into these categories is shown in Figure 4, which we describe in greater detail in the following sections. To determine what is driving differences in lung health immediately after ventilation as well as after a recovery phase, we used a variety of methods to analyze the resulting dynamics: 1) comparison of parameters associated with different outcomes, 2) random forest decision tree algorithm, which parses through the variety of predictors that may be particularly important in the immune response to VILI and 3) parameter sensitivity with eFAST, a variance-based method.
Figure 4: Results of 100,000 LHS runs grouped by classification.
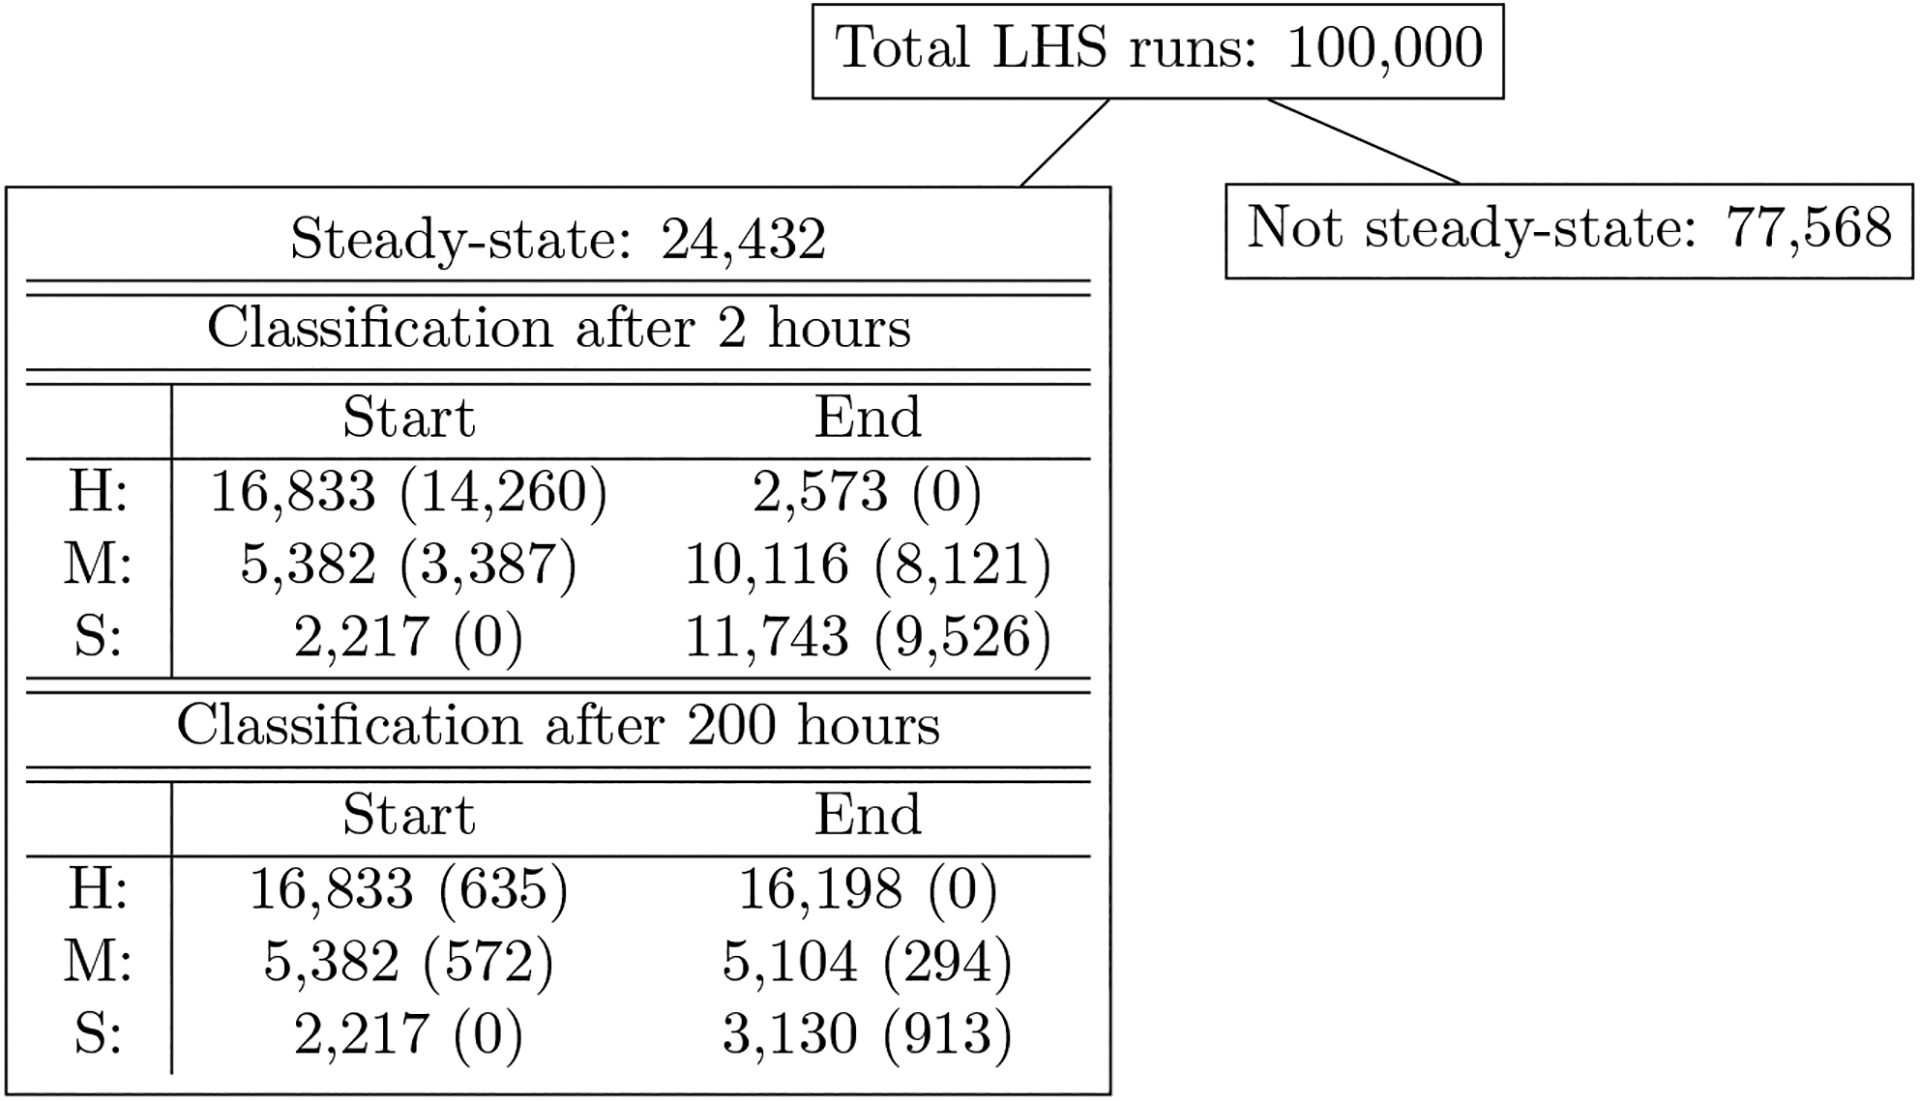
Parameter sets are broken down by their initial conditions (Start) and ending states (End) and by category healthy (H), moderate damage (M), or severe damage (S). Numbers in parentheses in the IC columns are the number of simulations that started in the category associated with that row and change their state after ventilation. Numbers in parentheses in the ES columns are the number of simulations that ended in the category associated with that row, but were not in that category before ventilation. The first three rows in the table show classification immediately after a 2-hour period of ventilation. The last three rows show classification after a 2-hour vent and period of recovery. All parameter sets are associated with a steady-state solution with Ee < 50%.
1.1. Biological background
The alveolar epithelium consists of alveolar type I and type II cells. Alveolar type I cells make up about 95% of the alveolar surface and are primarily responsible for facilitating gas exchange. Type II cells cover the other 5% of the surface and are important in the innate immune response. In the presence of damage, these cells proliferate to repair the epithelium and can also differentiate to type I cells [16, 17].
The immune response is divided into innate (non-specific) and adaptive (acquired) responses. The adaptive immune response involves cells that are effective at fighting specific pathogens, whereas the innate immune response lacks specificity and allows the host to respond to a variety of insults. Two of the most important innate immune cells are neutrophils and macrophages, which can be tissue-specific or recruited to the site upon insult. Some of the important features of the immune response to lung damage are illustrated in Figure 1.
Figure 1:
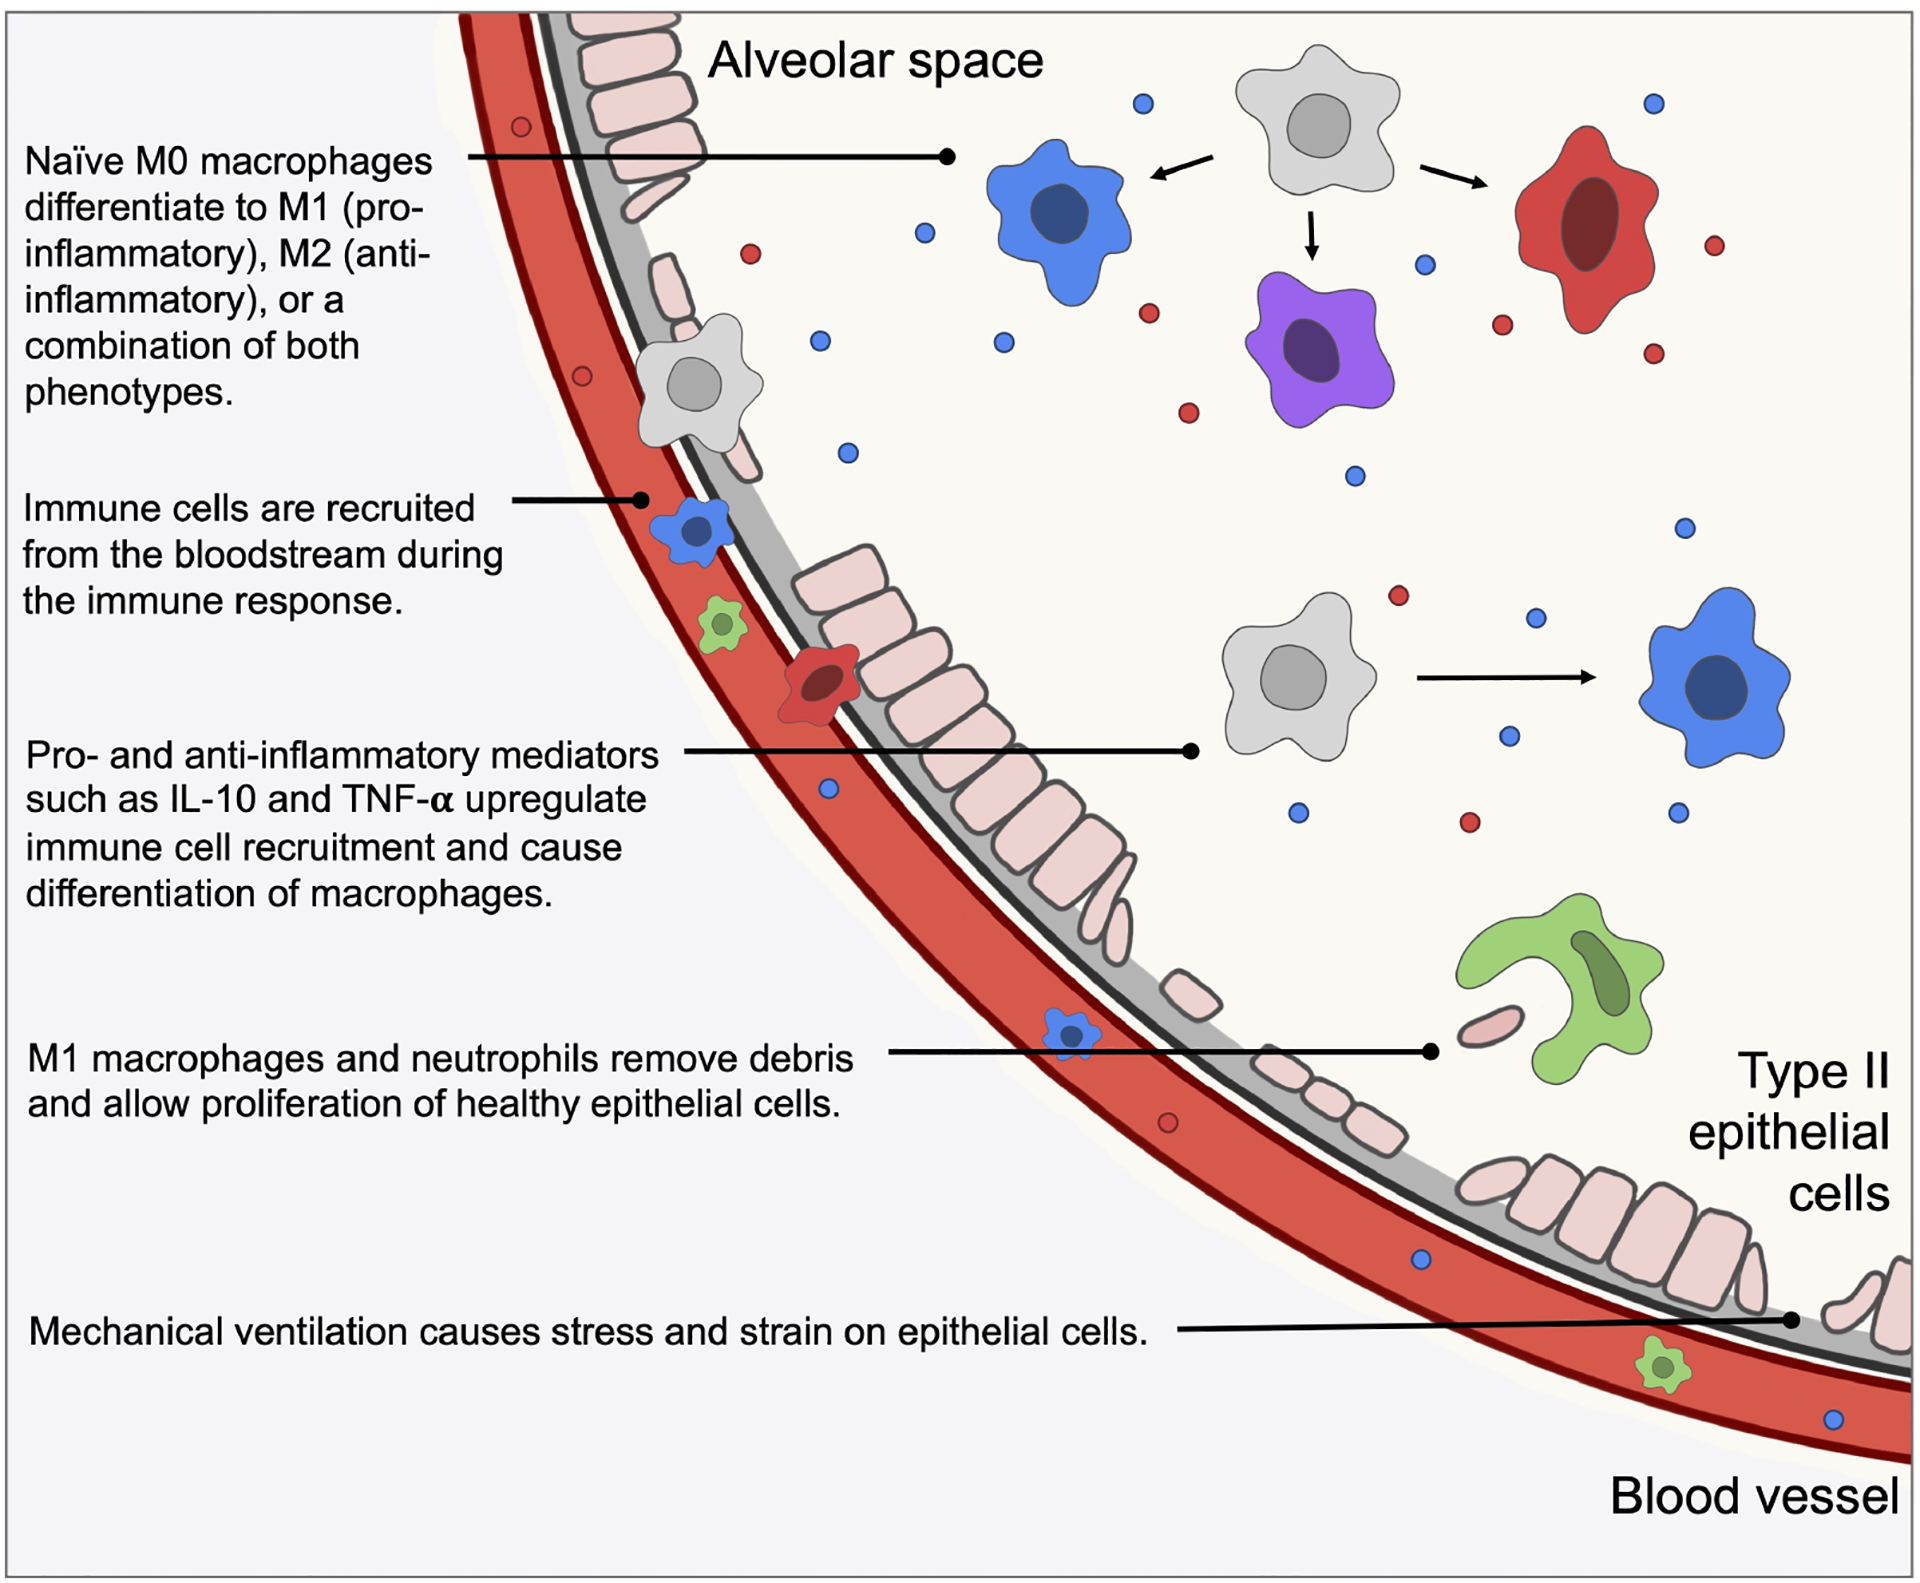
An illustration of some of the important biological mechanisms and interactions included in our model, which is described in the following sections.
Neutrophils respond quickly to pro-inflammatory signals sent from damaged epithelial cells and other resident cells. A small amount of neutrophils are found in the lungs in homeostasis [18]. Neutrophils have phagocytic capabilities in the presence of invading pathogens, but in the case of VILI without infection neutrophils recruit other immune cells such as macrophages through the production of pro-inflammatory agents such as proteinases and cytokines and contribute to the removal of damaged or dead tissue. An overabundance of neutrophils and their byproducts can cause further unnecessary damage [19]. Neutrophils are relatively short-lived; they become apoptotic and are removed by macrophages [18] or become necrotic in an uncontrolled death resulting in the release of cytotoxic material [20].
Phenotypes of macrophages can range from “pro-inflammatory” (M1) to “anti-inflammatory” (M2) based on their activators and byproducts [21, 22]. Their pro-inflammatory behavior includes destroying pathogens, consuming damaged cells, and amplification of signaling. Their anti-inflammatory response, which counteracts pro-inflammatory behavior, promotes repair by producing anti-inflammatory cytokines and removing apoptotic neutrophils. A single macrophage may produce both pro-inflammatory and anti-inflammatory signals concurrently [23].
An imbalance in the pro- and anti-inflammatory responses can cause complications for the individual during various injuries and insults. Also, macrophages play a significant role in the impact of aging on the immune response [6, 24, 25]. Therefore, to develop interventions to mitigate the effects of VILI, it is important to study the immune response to lung injury and the interplay between various types of cells.
1.2. Mathematical background
Mathematical modeling is used to capture the complexities of the immune response to epithelial cell damage, including important feedback loops and nonlinearities. Analyzing the resulting model gives insight into the driving mechanisms of this system. An in silico approach allows for simulation of scenarios and hypotheses for new interventions, especially when in vivo and in vitro experiments to explore possible interventions to improve patient outcomes are di cult to perform.
Many models have examined the within-host immune response to bacterial and viral infections, such as influenza, tuberculosis, pneumonia [26–31] and, most recently, COVID-19 [32–34]. Additionally, models related to non-infectious injury such as smoking and asthma [35–38] and general inflammatory stress [4, 39] have been developed. We have published a review of mathematical models that focus generally on the immune response in the lungs [40].
Models of MV and VILI generally deal with the mechanics of the airways, including airflow, pressure, and gas exchange to inform and optimize machine settings and assess stress [41–49]. Fluid-structure interactions (FSI) can be incorporated into such models [47, 50, 51]. Aghasafari et al. [50] and Ibrahim et al. [52] incorporate the epithelium and immune cells into cellular automata models linked to tissue-scale mechanics. Previous models that include epithelial damage have been developed for wound healing [53], infection [54, 55], and other applications using a variety of methods [56, 57]. Several infection models identify parameters related to bacterial growth that delineate between healthy and infected states, or high and low pathogenicity [40].
Models have also been developed to understand and analyze the subcellular pathways that govern the phenotype switch that macrophages undergo from pro-inflammatory to anti-inflammatory, as well as other important subcellular pathways [58–63]. Other mathematical models have described macrophage polarization in the context of infection [64], cancer [65], and other injuries [66, 67]. However, to our knowledge, no mathematical models have described M1/M2 interactions specifically in the context of VILI. We modeled the inflammatory response to VILI, specifically the resulting damage to epithelial cells, using a set of coupled ordinary differential equations (ODEs), which we describe further in the following section. Systems of ODEs are often used to model complex biological systems because of their ability to reproduce a variety of dynamics with reasonable computation times.
To perform a global assessment of a large parameter space such as that described in this work, other methods are needed aside from traditional parameter estimation techniques. Latin hypercube sampling (LHS), a Monte Carlo-based method, evenly samples the parameter space and can quantify uncertainty in model output. Sensitivity analysis methods identify how changes in parameters affect model output. Partial rank correlation measures the linear relationship between input and output and is useful in cases where the relationship is monotonic; when monotonicity is not the case, variance-based techniques such as the Sobol method and eFAST are advantageous [68]. These and similar methods have been applied to various models of inflammation, infection, and others to explore parameter space and identify sensitive parameters that contribute to damage, disease, and recovery [69–72].
2. Methods & Model Development
The primary focus of this model is to examine the effects of damage on the alveolar epithelium, in particular alveolar type II cells, since they are responsible for restoration of the epithelium. The physical forces of ventilation such as overdistention and tears in the epithelial membrane cause epithelial cells to release various mediators that elicit an immune response [3]. Epithelial barrier damage is one of the main features of VILI [73], and the extent to which the alveolar epithelium is damaged is a useful indicator of the overall effects of a lung insult [17, 74]. We began with a small three-dimensional system of differential equations of epithelial cell dynamics and analyzed this model using stability analysis and bifurcations. This became the basis for our lung compartment dynamics in our multi-compartmental model for ventilator-induced lung injury.
The full model is a system of coupled ordinary differential equations based on the interactions between immune cells, epithelial cells, and other mediators, shown in Fig 2. This model captures dynamics in two compartments, the local lung and the blood. Damaged lung epithelial cells release mediators that activate local cells and recruit nonresident immune cells from the bloodstream. These activated cells interact with the lung epithelial cells.
Figure 2: Schematic describes interactions between immune system components.
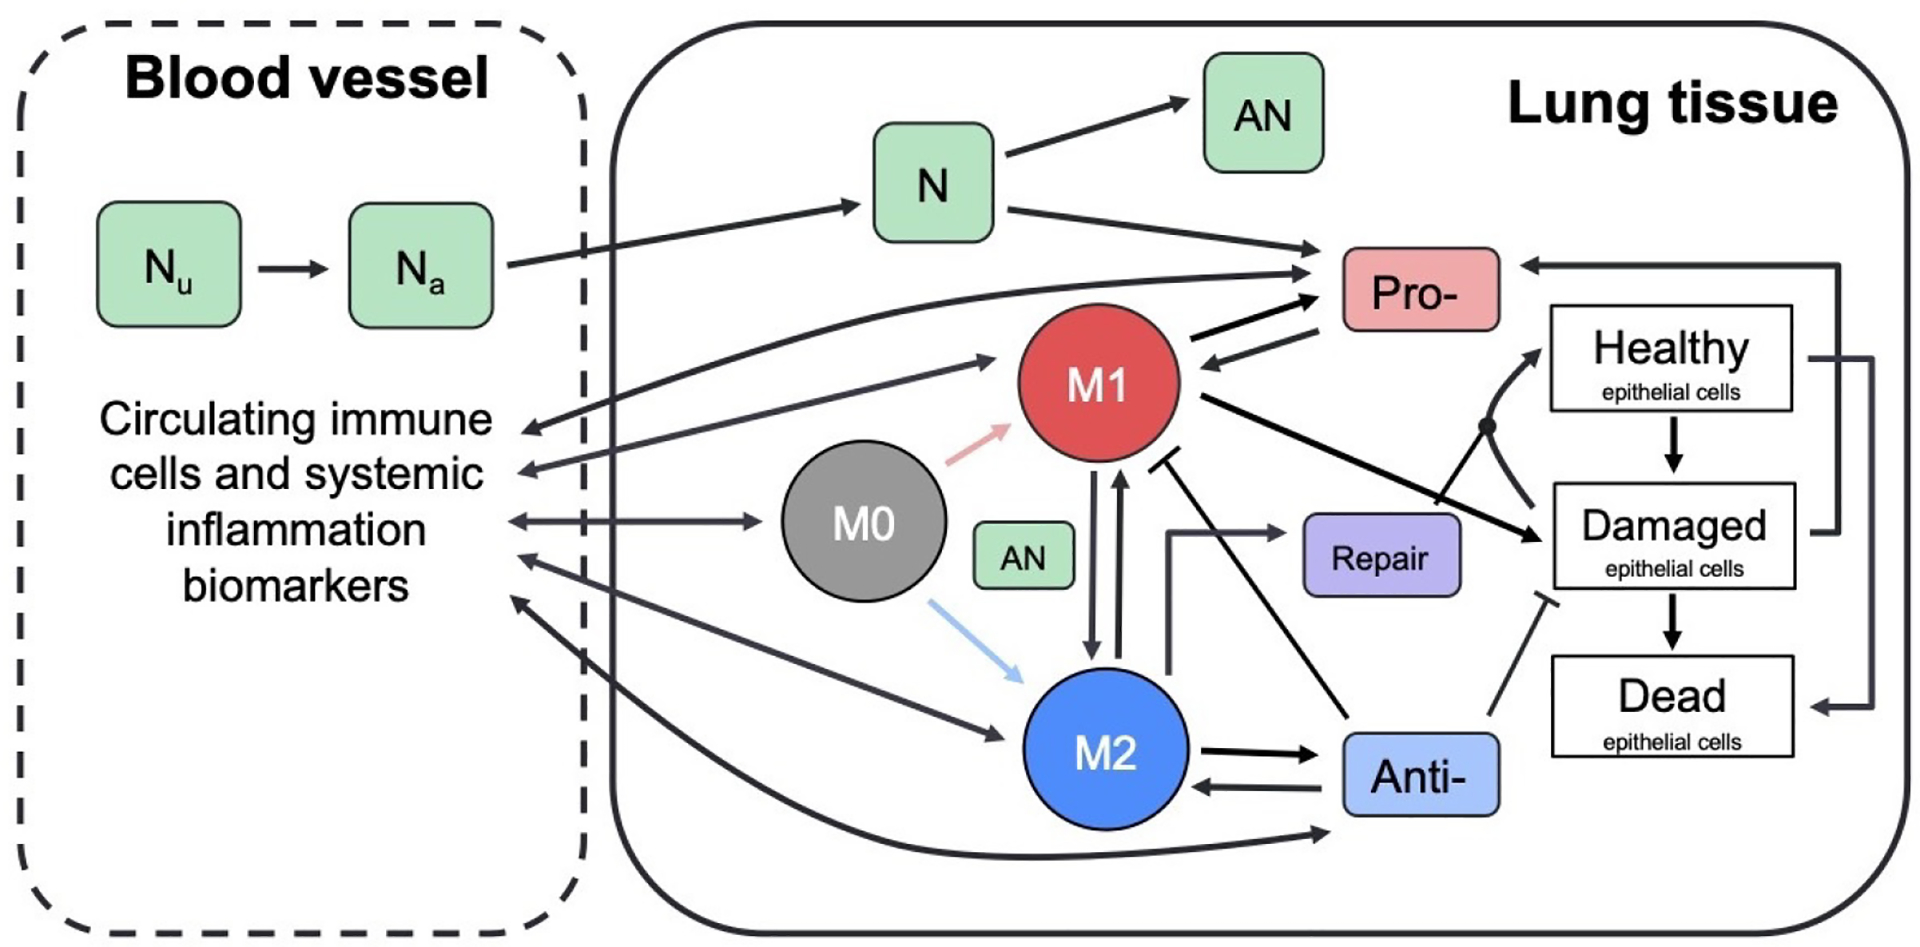
Green boxes represent neutrophils: unactivated and activated neutrophils in the bloodstream (N0b and N0, respectively), activated and apoptotic neutrophils at the site of inflammation (N and AN, respectively). Circles represent M0, M1, and M2 macrophages, which perform a number of roles including removing debris and producing pro- and anti-inflammatory mediators. White boxes represent healthy, damaged, and dead epithelial cells/empty space. Pro- and anti-inflammatory mediators (red and blue boxes) recruit and activate immune cells (red and blue arrows indicate activation by pro- and anti-inflammatory mediators, respectively). Repair mediators (purple box) promote repair of damaged epithelial cells. Dynamics between cells and mediators in the blood (not shown) are similar to the detailed dynamics shown for local inflammation in lung tissue.
2.1. Model equations
A system of ODEs was used to model these interactions because of its ability to capture distinct nonlinearities and feedback loops with relatively few computational requirements. However, one of the drawbacks of an ODE model is that it assumes a well-mixed environment, in which all elements of the model are evenly distributed throughout the given space. One way to include aspects of the spatial heterogeneity without explicitly modeling space is to use a compartmental model. Each compartment represents a well-mixed environment and, when biologically appropriate, cells and mediators can move between compartments. The model includes a variable for each cell or mediator for each compartment in which it can be located.
Here we chose to model two compartments. The first is the site of inflammation in the lungs, specifically the epithelial cells which provide a barrier lining in the alveolar region of the lung. The second compartment is the adjacent blood vessel that provides additional immune support to the site of damage. Differentiating between these two compartments allows us to determine the concentrations of various immune cells and other mediators in each separate area. This is necessary so that in future work this model can be calibrated with blood and local data, which are often measured by different means and with different frequencies.
Fig 2 gives a detailed breakdown of the dynamics in the lung. The dynamics are similar for the same cells and mediators in the blood. Cell types tracked in each compartment are stated in Table 1. In the following subsections, we develop the equations for these variables. The parameters used in the equations are given in Table 2 with their description and range used during parameter sampling. Since data is not yet available to estimate these model parameters, we use Latin hypercube sampling and exploratory simulations to determine initial acceptable ranges. This process is described in further detail in Section 2.2.
Table 1:
State variables for the model. Variables in both columns represent cells or mediators that diffuse between the two compartments.
| Bloodstream | Lung | Description |
|---|---|---|
| Eh | Healthy epithelial cells | |
| Ed | Damaged epithelial cells | |
| Ee | Dead epithelial cells/empty space | |
| pb | p | Pro-inflammatory mediators |
| ab | a | Anti-inflammatory mediators |
| M0b | M0 | Naive macrophages |
| M1b | M1 | M1 pro-inflammatory macrophages |
| M2b | M2 | M2 anti-inflammatory macrophages |
| N0b | Unactivated neutrophils | |
| Nb | Activated neutrophils | |
| N | Neutrophils | |
| AN | Apoptotic neutrophils | |
| R | Repair mediators |
Table 2:
Model parameters with short descriptions and ranges used in LHS.
| Name | Description | Range used |
|---|---|---|
| ab∞ | Relative effectiveness of ab at inhibiting M0b differentiation to M1b | [0.29, 67.35] |
| a∞ | Relative effectiveness of a at inhibiting M0 differentiation to M1 | [0.13, 72.08] |
| bd | Baseline decay of damaged cells | [1.06 × 10⁻⁵, 0.07] |
| bp | Baseline self-resolving repair of epithelial cells | [0, 6.20] |
| br | Baseline repair of damaged cells | [9.79 × 10⁻³, 4.47] |
| da | Rate of diffusion for a | [0.19, 177.98] |
| dp | Rate of diffusion for p | [0.34, 2.3 × 10³] |
| dm0 | Rate of diffusion for M0 | [0.24, 275.55] |
| dm1 | Rate of diffusion for M1 | [2.75 × 10⁻³, 19.8] |
| dm2 | Rate of diffusion for M2 | [0.14, 143.36] |
| kam1 | Production rate of a by M1b & M1 | [0.01, 18.01] |
| kam2 | Production rate of a by M2b & M2 | [2.43 × 10⁻³, 1.67] |
| kan | Rate at which neutrophils become apoptotic | [0.01, 50.04] |
| kanm1 | Rate of M1 phagocytosis of AN | [1.32 × 10⁻³, 0.69] |
| kanm2 | Rate of M2 phagocytosis of AN | [2.71 × 10⁻³, 7.36] |
| kem1 | Rate of phagocytosis of damaged cells by M1 | [0.01, 16.03] |
| ken | Rate of phagocytosis of damaged cells by N | [0.01, 16.03] |
| kep | Rate of self-resolving repair mediated by p | [0, 4.30] |
| ker | Rate of repair of damaged cells by R | [1.47 × 10⁻³, 1.08] |
| xer | Regulates effectiveness of repair of damaged cells by R (Hill-type constant) | [7.23 × 10⁻³, 4.13] |
| km0a | Rate of differentiation of M0 by a | [0.01, 89.07] |
| xm0a | Regulates effectiveness of differentiation of M0 by a (Hill-type constant) | [0.16, 136.83] |
| km0ab | Rate of differentiation of M0b by ab | [1.15, 436.59] |
| xm0ab | Regulates effectiveness of ab differentiation of M0b (Hill-type constant) | [0.16, 83.97] |
| km0ad | Rate of recruitment of M0b by ab | [0.34, 181.89] |
| xm0ad | Regulates effectiveness of recruitment of M0b by ab (Hill-type constant) | [0.01, 27.6] |
| km0p | Rate of differentiation of M0 by p | [8.99 × 10⁻³, 37.2] |
| xm0p | Regulates effectiveness of differentiation of M0 by p (Hill-type constant) | [1.17, 1.14 × 10⁴] |
| km0pb | Rate of differentiation of M0b by pb | [0.05, 89.96] |
| xm0pb | Regulates effectiveness of differentiation of M0b by pb (Hill-type constant) | [41.51, 2.92 × 10⁴] |
| km0pd | Rate of recruitment of M0b by pb | [4.57 × 10⁻³, 53.97] |
| xm0pd | Regulates effectiveness of recruitment of M0b by pb (Hill-type constant) | [0.24, 180.74] |
| km1p | Rate of recruitment of M1b by pb | [0.2, 92.81] |
| xm1p | Regulates effectiveness of recruitment of M1b by pb (Hill-type constant) | [9.8 × 10⁻³, 1.69] |
| km2a | Upregulation of M2b recruitment by a | [0.1, 219.93] |
| xm2a | Regulates effectiveness of M2b recruitment by a (Hill-type constant) | [0.08, 94.84] |
| km2r | Upregulation of M2b recruitment by R | [3.61 × 10⁻³, 20.11] |
| xm2r | Regulates effectiveness of M2b recruitment by R (Hill-type constant) | [0.01, 18.70] |
| kman | Rate of M1 switch to M2 by AN | [0.01, 27.08] |
| kmne | Rate of collateral damage to epithelial cells by macrophages and neutrophils | [1.12 × 10⁻³, 5.17] |
| xmne | Regulates effectiveness of macrophages and neutrophils to damage epithelial cells (Hill-type constant) | [0.03, 41.06] |
| kn | Rate of migration of Nb to lung | [2.39 × 10⁻³, 3.54] |
| kn0p | Rate of activation of Nb by p | [0.01, 5.58] |
| xn0p | Regulates effectiveness of activation of Nb by p (Hill-type constant) | [0.03, 142.56] |
| kpe | Production rate of p by Ed | [44.02, 1.12 × 10⁴] |
| kpm1 | Production rate of p by M1 & M1b | [0.24, 412.22] |
| kpn | Production rate of p and pb by neutrophils | [1.67 × 10⁻³, 2.95] |
| krm2 | Production rate of R by M2 | [0.02, 40.97] |
| μa | Decay rate of a | [5.16 × 10⁻⁴, 5.08] |
| μab | Decay rate of ab | [0.04, 12.86] |
| μp | Decay rate of p | [2.76 × 10⁻³, 41.04] |
| μpb | Decay rate of pb | [4.79 × 10⁻⁴, 3.71] |
| μm0 | Decay rate of M0 | [0.01, 42.67] |
| μm0b | Decay rate of M0b | [7.66 × 10⁻³, 329.59] |
| μm1 | Decay rate of M1 | [8.2 × 10⁻³, 10.16] |
| μm1b | Decay rate of M1b | [0.03, 60.32] |
| μm2 | Decay rate of M2 | [0.27, 135.37] |
| μm2b | Decay rate of M2b | [0.02, 16.51] |
| μnb | Decay rate of Nb | [2.49 × 10⁻³, 6.03] |
| μn0b | Decay rate of N0b | [3.94 × 10⁻⁶, 2.1 × 10⁻³] |
| μn | Decay rate of N | [8 × 10⁻³, 4.32] |
| μR | Decay rate of R | [0.72, 761.75] |
| sa | Source rate of background ab | [5.75 × 10⁻³, 1.11] |
| sd | Rate of damage from ventilator | 0.75 |
| sm | Source rate of M0b | [1.28, 1.14 × 10³] |
| sn | Source rate of N0b | [0.22, 225.45] |
2.1.1. Epithelial cells
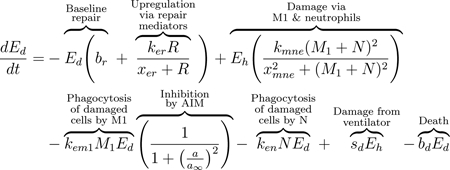
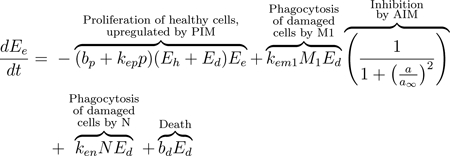
We modeled the local lung epithelial cells as the percentage of cells in three subpopulations, healthy (Eh), damaged (Ed), and dead epithelial cells/empty space needing be replaced by healthy cells (Ee). We define this “local space” to be a simplified approximation of the entire alveolar space. Since we track the percentages in each subpopulation, we have that Ee + Eh + Ed = 1. Thus, Eh, Ed, and Ee are dimensionless and we determine time to be in hours. We depict these populations using Eqs (1), (2), and (3). These equations track proliferation and interactions between the epithelial and immune cells that are recruited in response to VILI. The first term in Eq (1) is a logistic growth, representing epithelial cells that spread and replicate to fill Ee. The factors Eh +Ed and Ee delineate the areas taken up by cells and the empty space that can be filled by new cells. This term appears negated in Eq (3), modeling the removal of empty space. The proliferation rate is assumed to be bp at baseline and it is modulated at a rate proportional to the pro-inflammatory mediator level, kepp. Nearby epithelial cells and progenitor cells, stem cells that can differentiate into specific types of epithelial cells only, perform this task. These cells spread and replicate to fill the empty space left by dead epithelial cells [75–77]. In this model we do not account for the progenitor cells. Therefore, we attribute all proliferation to the local epithelial cells.
The next term in Eq (1) and the first term of Eq (2) represents repair of damaged cells back to a healthy state. Epithelial cells are prone to self-repair [75], represented by a baseline rate br, and repair at a faster rate in the presence of repair mediators variable R, which tracks the level of mediators that promote epithelial repair such as fibronectin and other epithelial growth factors [77–79]. The third term in Eq (1) and second in Eq (2) represents collateral damage to epithelial cells by the influx and activity of the immune system. This mechanism is modeled via a nonlinear term, which is dependent on macrophage and neutrophil levels [80–82]. We also model damage due to ventilator-induced injury as sdEh, the fourth term in Eq (1) and fifth term in Eq (2), in which injury occurs at a rate proportional to the amount of healthy epithelial cells at a given time. This general term covers over-distention for any mode of ventilation.
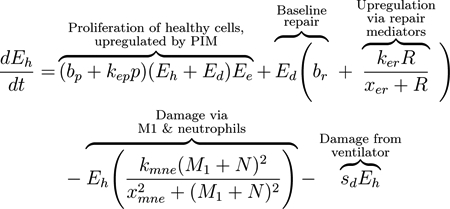 |
(1) |
 |
(2) |
 |
(3) |
M1 macrophages and neutrophils clear debris from the inflammation site to make room for healthy epithelial cells to divide and fill the empty space [18, 75, 76]. The third and fourth terms in Eq (2) represent this phagocytosis of damaged cells by M1 macrophages and activated neutrophils, respectively. Regulation of M1 is modeled by the last multiplier in the term, representing inhibition by anti-inflammatory mediators (AIM), such as IL-10 [77, 80, 83]. The negative feedback loop of AIM inhibiting further pro-inflammatory functions occurs multiple times in our model. We will heretofore refer to this multiplier as inhibition by AIM. Depending on the compartment, the term may utilize the variable ab (bloodstream) or a (local). The anti-inflammatory and regulatory role of M2 macrophages and the balance between M1 and M2 phenotypes is critical for a successful and rapid recovery [22, 77]. The last term of Eqs (2) and (3), bdEd, represents the death of Ed (negative in Eq 2) and the associated gain in the Ee population (positive in Eq 3)).
2.1.2. Pro- and anti-inflammatory mediators
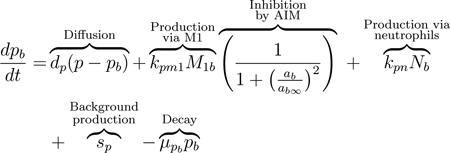
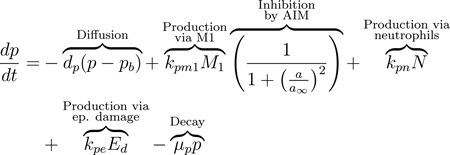
As a signal to the immune cells, damaged epithelial cells release pro-inflammatory cytokines and other mediators, including TNF-α and matrix metalloproteinases (MMPs) [21, 75, 76]. In our equations, we track these pro-inflammatory mediators (PIM) in both compartments: p in the lungs and pb in the blood. The release of PIM by damaged epithelial cells leads to diffusion of PIM into the bloodstream to recruit additional immune cells [76]. Movement from one compartment to another is assumed to be due to passive diffusion driven by the difference of the PIM concentrations between both compartments, first term in Eqs (4) and (5). This type of diffusion term will be used for all variables in our model that move bidirectionally from one compartment to the other.
M1 macrophages produce PIM, which upregulate the activation and migration of macrophages to the site of injury; see the second term in Eqs (4) and (5) [21, 77]. The macrophage population self-regulates by releasing AIM such as IL-10, thus inhibiting further production of PIM [59]. Therefore the production terms for PIM by M1 macrophages in both the blood and lung compartments include an inhibition multiplier. Therefore, the rate of PIM production by M1 macrophages decreases with increased concentrations of ab or a.
Neutrophils are also important producers of pro-inflammatory mediators such as TNF-α, IL-1, IL-6, LTB4, and chemokines, which stimulate the activation of macrophages toward an M1 phenotype [18, 19, 79, 81, 84]. Low levels of PIM exist in the absence of damage, accounted for by the source term sp in the second to last term of Eq (4) [85, 86]. The final terms of this equation and Eq (5) model the natural decay of these mediators.
 |
(4) |
 |
(5) |
Anti-inflammatory mediators, such as the anti-inflammatory signaling caused by IL-4 and IL-10 [87], are represented by Eq (6) in the bloodstream and Eq (7) at the site of damage. The first term in each equation models diffusion. AIM are released by both M1 and M2 macrophages [21, 77, 83]. Similarly to pb, background levels of ab are present in the absence of an immune response, represented by term four in Eq (6) [85]. Natural decay of AIM is accounted for by the last term in each equation.
| (6) |
| (7) |
2.1.3. Macrophages
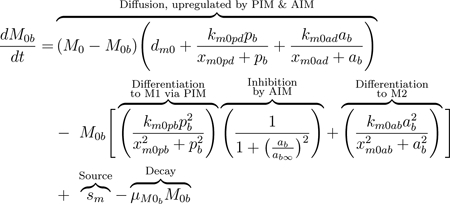
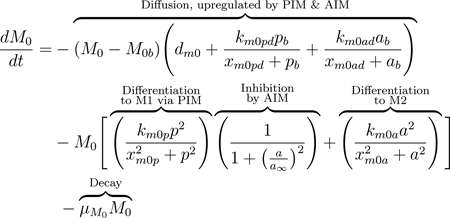
M0 macrophages, also called naive or undifferentiated, are present both locally and in the blood. The diffusion term, seen in Eqs (8) and (9), represents movement between compartments. The baseline diffusion between compartments is modeled in the same manner as with other variables, but the rate at which this diffusion occurs is modulated by mediators. Increased PIM and AIM levels cause undifferentiated macrophages in the bloodstream to be recruited at a higher rate to the damaged site, where they differentiate and perform phagocytic, pro-inflammatory, and pro-resolving roles [21]. This increased flux between compartments due to the presence of pb and ab is modeled by adding to the baseline diffusion rate (dm0). The added term is a Michaelis-Menten-type term to capture the increasing rate as mediators rise, with a maximum rate at which these cells can diffuse, (dm0 + km0pd + km0ad).
The equations also account for activation in the bloodstream by PIM and AIM given a high enough concentration of these mediators [80]. Although there is still debate on the types of macrophages that exist in the bloodstream after being released from the bone marrow, there is evidence that populations of both M1 and M2 exist in the bloodstream before being recruited to the site of injury [21, 83]. Thus, we include this process in our equations in the second term of Eqs (8) and (9). Undifferentiated macrophages in the bloodstream can change phenotype to M1 or M2 after interacting with PIM or AIM, respectively, modeled by a Hill-type term. This nonlinearity accounts for the sufficient amount of PIM or AIM needed to activate M0 and that this process saturates to a maximum rate of km0pb and km0ab for activation by pro- and anti-inflammatory mediators, respectively.
MV induces epithelial cells to produce pro-inflammatory mediators such as TNF-α, chemokines, and interleukins (ILs) [2]. Undifferentiated macrophages receive these signals and differentiate into the M1 phenotype [88]. The second term in Eqs 8 and 9 represent activation of undifferentiated macrophages to the pro-inflammatory phenotype, downregulated by the anti-inflammatory response through an inhibition multiplier. In this term, M2 macrophages can also be activated directly from the naive phenotype by various repair and anti-inflammatory mediators involved in the repair of epithelial cells [76, 77].
Using the same inhibition multiplier as previously, AIM inhibit differentiation to M1 as part of their regulatory role in the inflammatory process, although a complete understanding of these mechanisms is yet to be uncovered [21, 59, 76]. In the absence of injury, lungs contain a low number of undifferentiated macrophages which patrol the surrounding area [75]. “Patrolling” macrophages are also prevalent in the bloodstream. The third term in Eq (8) represents a constant source of undifferentiated macrophages into circulation [77]. We also account for natural decay of all macrophage phenotypes in the last term of Eqs (8) through (13).
 |
(8) |
 |
(9) |
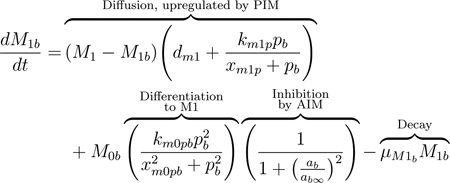
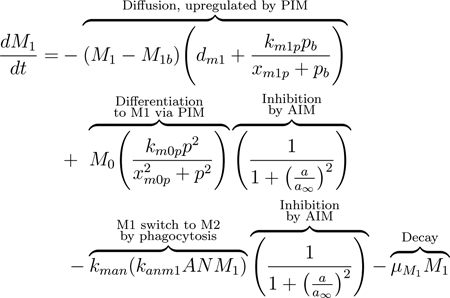
Similarly to naive macrophages, M1 macrophages move between compartments. The presence of pro-inflammatory mediators, which act as recruiters, increases the rate of diffusion, shown in the first term of Eq (10) [21]. The second term represents differentiation from the naive state, as described for the associated term in M0.
Macrophages exhibit high plasticity, and based on the mediators and other immune cells they encounter, they can switch phenotype and perform different or enhanced functions; this plasticity is not yet fully understood [77, 80]. M1 macrophages are primarily responsible for producing PIM, thereby recruiting other immune cells to the damaged area [83]. M2 macrophages are considered pro-resolving and downregulate PIM. Both M1 and M2 macrophages phagocytize apoptotic cells such as neutrophils [79]. The shift from an overall pro-inflammatory phase to an anti-inflammatory phase in the course of the immune response is highly dependent upon a shift in macrophage behavior, specifically the shift from a mainly M1 response to a mainly M2 response [21, 76, 83].
One of the primary ways this shift is achieved is through the inhibition of M0 to M1 differentiation by anti-inflammatory mediators, as described previously. Additionally, when pro-inflammatory macrophages phagocytize apoptotic neutrophils, they shift towards a more anti-inflammatory phenotype. This results in suppression of the release of pro-inflammatory mediators and production of pro-resolving mediators [81, 82]. We account for this shift by including the third term in Eq (11) to account for M1 macrophages shifting to the M2 phenotype when they phagocytize apoptotic neutrophils. This term is proportional to the term in the apoptotic neutrophil equation, Eq(17), modeling the phagocytosis of apoptotic neutrophils by M1. This term also includes inhibition of M1 function by AIM. It has been shown in some studies that M2 macrophages can switch to an M1 phenotype [89], although this idea is not currently widely accepted. Thus, we choose to include only the shift from M1 to M2.
 |
(10) |
 |
(11) |
M2 macrophages, associated with an anti-inflammatory response, can be activated directly from undifferentiated macrophages by specific anti-inflammatory signals in addition to switching phenotype from M1. They diffuse between compartments modeled in the first terms of Eqs (12) and (13). M2 macrophages produce anti-inflammatory mediators which recruit and promote differentiation to more M2 macrophages, described in the second term of both equations. They release cytokines that trigger the repair phase of the immune response [21, 77]. This repair phase includes repair mediators (discussed in Eq (18)), which play a direct role in the reconstruction of healthy epithelial cells and resolution of damage [77].
| (12) |
| (13) |
2.1.4. Neutrophils
Neutrophils are considered the first responders to injury [19, 76]. Generated in the bone marrow, free-flowing neutrophils, described as N0b, circulate in the lung vasculature at baseline levels [18] and are represented by the first term in Eq (14). In the presence of injury, neutrophils are activated and recruited to the damaged site through pro-inflammatory mediators such as TNF-α, IL-1β, and other chemokines and cytokines [19, 84]. This recruitment is represented by the first term in Eqs (14) and (15). On the other hand, anti-inflammatory mediators, including macrophage-produced resolvins and protectins, inhibit further recruitment of neutrophils [82]. Similarly to the differentiation of macrophages, it is assumed that a neutrophils activation is nonlinear and that it saturates. Therefore, a Hill-type term with a maximum rate of kn0p and a constant of xn0p is used to model activation of neutrophils by PIM. To model the inhibition of neutrophil activation by AIM, we include the same inhibition multiplier as previously described. The effectiveness of AIM to inhibit this process is controlled by ab∞. We also account for intrinsic decay of neutrophils in the last term of Eqs (14) through (17).
 |
(14) |
 |
(15) |
Neutrophils go through a multi-step process of rolling along and subsequently adhering to the surface of the endothelium. Then neutrophils transmigrate to the injury site either through or between endothelial cells [18, 19]. This process is assumed to be driven not by a concentration difference in neutrophils between the compartments but rather is a direct consequence of activation. Therefore, neutrophil transmigration, the first term in Eq (16), is modeled from the bloodstream to the site of injury by a linear term with rate kn.
Activated neutrophils that have transmigrated through the endothelium and reached the site of injury release pro-inflammatory mediators, as discussed previously in Eq (5). During infection, neutrophils play an important role by phagocytizing pathogens [81], but during VILI a main role of neutrophils is the recruitment of macrophages, particularly to promote a more pro-inflammatory environment for the clearance of damaged and dead cells [19].
Neutrophils become apoptotic, modeled by the second term of Eq (16) [76]. In this state, they are phagocytized by M1 and M2 macrophages (second and third terms of Eq (17), respectively) and no longer contribute to the production of PIM [18, 79, 90]. Phagocytosis by M1 macrophages is inhibited by AIM using our standard functional form for the inhibition multiplier. AIM do not inhibit phagocytosis by M2 macrophages since AIM support the function of anti-inflammatory cells. Intrinsic decay is modeled in the last term of Eq (16).
| (16) |
 |
(17) |
2.1.5. Repair mediators
The direct contribution of alveolar macrophages to the repair of epithelial cells is not completely understood, although macrophage involvement in the repair process has been widely demonstrated [77]. M2 macrophages produce various mediators such as prostaglandin E2, chemokines such as CCL2, TGF-β, fibronectin 1 and other epithelial growth factors [77–79] that promote repair of epithelial cells and recruit fibroblasts, key cells involved in tissue repair [91]. We do not model each of these components, instead grouping them together in one variable called R, which can be thought of as the downstream effects of fibroblasts and other mediators. If the recovery phase is the focus of a future study this model could be adapted to include these dynamics explicitly. The production of R by M2 macrophages is modeled by the first term in Eq (18). The second term models intrinsic decay of these mediators.
| (18) |
These equations form a system of ODEs that captures the most important aspects of the immune response to VILI. In the following sections we describe various computational approaches used to explore parameter space, determine the parameters the model is most sensitive to and establish influential predictors of model outcomes. We end with case studies in which we modulated particular parameters and then evaluated long-term epithelial damage.
2.2. Sampling method for parameters: Latin hypercube sampling
Because of the large number of variables and parameters, mathematical and statistical techniques needed to be used to analyze the system and find parameter sets that generate a variety of dynamics and outcomes of immune cell populations included in this model. At this stage we analyzed the model with various parameters without utilizing data; in future work this model can be coupled with ventilation experiments to narrow parameter ranges. As an initial step we determined initial conditions and parameters for this model through Latin hypercube sampling (LHS), which generates random, unique parameter sets according to user-defined distributions [92]. As suggested by Marino et al. [68], we initially chose uniform distributions since we had no prior knowledge of the parameter values, and sampled on a logarithmic scale to cover a span of several magnitudes. For LHS with uniform distributions assumed for each parameter, to generate n desired parameter sets, the algorithm splits the determined range into n evenly-spaced subintervals and each interval is sampled exactly once [68]. We also sampled using log-normal distributions for each parameter with the same means and variances as the uniform distributions to see whether restriction of the parameter space by bounded intervals, as enforced by the uniform distributions, affected our results. We sampled using log-normal, rather than normal, distributions to ensure the parameters were positive.
Using MATLAB functions adapted from Kirschner et al. [93], all parameters were sampled except the rate of damage sd due to ventilation to ensure the same insult during all simulations. We began to explore parameter space by sampling near transients associated with different outcomes. Ranges were set such that that the resulting sampling gave rise to a variety of behaviors and outcomes. Table 2 shows the final ranges used for the LHS sweep that constructed the collection of parameter sets used in this work. Using LHS in these ranges we generated 100,000 parameter sets. Future work could calibrate parameter sets to data from different experimental or clinical groups and then use the analysis methods in this manuscript to compare dynamics and parameters that drive differences between experimental or clinical groups.
2.3. Parameter Set Collections: Healthy, Moderate Damage, & Severe Damage
Our goal was to understand the effects of baseline lung health, represented by initial conditions and unique parameter sets, on the response to ventilation and post-ventilation recovery. Therefore we needed to start our simulation from initial conditions associated with a steady state, so that when ventilation was simulated we were seeing changes in the dynamics only due to the ventilator. For all 100,000 parameter sets we simulated the model for 800 hours, without any ventilation (sd = 0), to determine if a numerical steady-state condition was reached in the absence of ventilation. Our numerical steady state condition was that the l2-norm of the difference between each meshpoint in the last 100 hours of the simulation and the last point (hour 800) was less than 0.1. By examining simulation results, we confirmed that this ensured minimal change in all variables at the tail end of the simulation.
Three different initial conditions were used with the sampled parameter sets for the 800-hour, non-vent simulation, in order to find sets that have steady states. The first set of initial conditions was associated with initial simulations used to develop the sampling ranges, but was not associated with a particular set in our final round of sampling. The second initial condition we chose was associated with an insult to the epithelial cells with no initial immune response, all variables set to zero except for Eh(0) = 0.75 and Ed(0) = 0.25. The third and final initial condition had all variables set to zero except for M1(0) = 50, which is starting with an activated immune response and healthy tissue. If our numerical steady-state condition was satisfied with any of these initial conditions, the parameter set was accepted and the associated initial conditions were set to the variable values at 800 hours. A total of 27,836 sets satisfied our numerical steady state condition. Any parameter set that did not result in an equilibrium state by 800 hours from these three initial conditions was not simulated with ventilation. Since we did not perform a complete analysis on all 100,000 sets, we do not mathematically conclude that the remaining parameters cannot reach a steady state. However, given the robustness of the resulting dynamics and the number of parameter sets that reached our condition for numerical steady state, we assumed that actual biological dynamics were well represented by simulating these 27,836 unique parameter sets. The same process was applied to the log-normally-distributed collection of parameter sets, generating a total of 33,812 sets that reached a steady state. Results throughout this manuscript were similar for the sets generated using log-normal distributions, see supplementary materials.
Some parameter sets gave rise to initial conditions where the percent of empty space in the epithelium was significantly high. Therefore, we eliminated some sets based on their initial condition for Ee (empty/dead cells). In this paper we focus on the 24,432 parameters sets that had a steady state for Ee < 50% and show a summary of all results for steady states with Ee < 25% and Ee < 75% in the supplementary materials. We did not find any major differences when varying this inclusion threshold.
These 24,432 sets were then simulated for 200 hours with ventilation for the first two hours (a nonzero damage rate), a duration comparable with murine experiments [94, 95]. Given that all mice do not survive ventilation, we adjusted our model to account for extensive lung damage due to ventilation, leading to severe inflammation. Without this adjustment, the model assumes survival in all scenarios and allows for a recovery phase. Instead, we assumed that a high percentage of empty space Ee is not survivable; therefore, we set a threshold for Ee. Ideally this threshold’s value would be derived from data. However, in the absence of data related to epithelial integrity, we used a threshold of 75% given that we had set a threshold of 50% for Ee(0). These two thresholds combined map the arbitrary 0 to 100% epithelial population to metrics of overall lung health. Ee more than 50% without ventilation is not survivable and more than 75%, even with MV, is not survivable. Therefore, if Ee rises above 75% at any time, variables are set to 0 at that time.
Simulations were separated into three different categories based on percentage of healthy epithelial cells at time of classification T:
Eh(T) ≥ 90%: Healthy epithelial cells sufficiently cover the alveoli to function normally
50% ≤ Eh(T) < 90%: Moderate tissue damage
0% ≤ Eh(T) < 50%: Severe tissue damage and non-survivable ventilation
Sets were classified into the three categories based on their initial conditions and again at two other time points: immediately after ventilation (2 hours) and after ventilation with a recovery period (200 hours). Classification at these two time points allowed us to understand the immediate effects of VILI as well as the long-term effects after a period of recovery. These parameter sets, their corresponding transients, and the outcomes they generate were used to develop a collection of parameter sets representing a variety of immune system dynamics. The collection was then used to analyze outcomes in terms of their associated transient variables and underlying parameters.
2.4. eFAST
We used several tools to perform a sensitivity analysis of model parameters. A common method is calculating partial rank correlation coefficients (PRCCs), but results are only reliable for monotonic relationships between parameters and variables. Our model output does not fit this criteria. Marino et al. suggest the extended Fourier amplitude sensitivity test (eFAST), a variance-based method for non-linear, non-monotonic relationships [68]. The greatest drawback of eFAST compared to PRCC is the computation time.
eFAST varies parameters and the resulting variation in model output is calculated using statistical variance. The algorithm varies each parameter at different frequencies by creating a sinusoidal function, called a search curve, and then sampling parameter values along the function. Fourier analysis measures the influence of the parameter’s frequency on model output. First-order sensitivity Si for a parameter i is calculated by varying only i and leaving the rest constant. Total-order sensitivity STi is calculated by varying i using a unique, higher frequency and varying the other parameters using lower non-unique frequencies. This total-order sensitivity captures non-linear interactions between parameters in addition to changes in model output. We implemented the method by Marino et al. [68] to calculate Si and STi and determined the statistical significance of each parameter. A “dummy parameter” was included in the parameter set and its eFAST index was compared to the other parameters found in the model.
MATLAB functions by Kirschner et al. [93] to perform eFAST are available online. We obtained 257 values of each parameter on a search curve and repeated this process for five unique search curves since different ones can generate slightly different samples. Sensitivity can be calculated at specific time points for the desired variable.
2.5. Random forest decision tree
Aside from more conventional sensitivity analysis measures, we chose a few alternative methods that require less computation time and can include other features of the model besides parameters. One of these alternatives is a random forest decision tree [96, 97]. Each parameter set in the collection has a number of predictors and outputs: parameters and any other characteristics from the transients that can be quantified. The decision tree algorithm determines the parameter/predictor values that best partition the collection into categories of healthy, moderate damage, and severe damage. Each member of the collection answers a series of questions, i.e. nodes on the tree, based on the predictor values of that parameter set, eventually being classified into a particular outcome. This process is repeated to obtain a “forest” of decision trees.
Since a decision tree simply takes value for each predictor and is not dependent on the model itself, measures besides parameters can be used. We included supplementary predictors calculated from the transients. These predictors are: maximum and minimum M1 and M2 (percent of total macrophages and raw values), time at which M1 and M2 maximums occur (M1/M2 peak time), ratio of M1 peak to M1 initial condition, percent M2 macrophages at 10 hours, ratio of Eh initial condition to Eh at 30 minutes, 2 hours, and 6 hours, and the difference between Eh initial condition and Eh at 200 hours. Adding these predictors allowed for the possibility that the best classifiers of outcome could be not only parameters but also properties of the transients. This knowledge could provide additional information about metrics for experimentalists and clinicians to track in order to identify early warning signs for undesirable results.
One metric generated by the random forest is the importance value of each parameter or characteristic, calculated from the Gini Index [98]. The importance value is a measure of how important any given parameter was in determining the outcome of each set in the collection. Because of the large number of parameters in the model, this can provide intuition about which parameters and other characteristics of the transients are most influential in determining outcomes. The R and MATLAB code used for this method are provided in the supplementary materials.
3. Results
Our aim is to understand how recruitment of the immune response and its interactions with epithelial cells translate to specific outcomes and what dynamics are driving this process. Using the techniques described in the previous section, we determined predictors of outcome and/or processes that could be targeted to modulate outcome.
3.1. Sample Transients and Collection Breakdown
This model can generate a variety of dynamics, similar to the mixed responses of patients on a ventilator [99]. Our model generates a variety of dynamics which reflects this spectrum of responses. There is significant variability between outcomes as well as within them. Fig 3 shows examples of these different dynamics for healthy epithelial cells and M0, M1, and M2 macrophages using a case of each of the three outcomes as determined at 200 hours: healthy, moderate damage, and severe damage. All three can be classified as “severe damage” at 2 hours. Each case has a unique set of initial conditions and parameters, giving rise to three very different immune responses and epithelial cell health. Simulations were run in MATLAB using the code provided in the supplementary materials.
Figure 3: Sample simulations show the variety of model-generated dynamics.
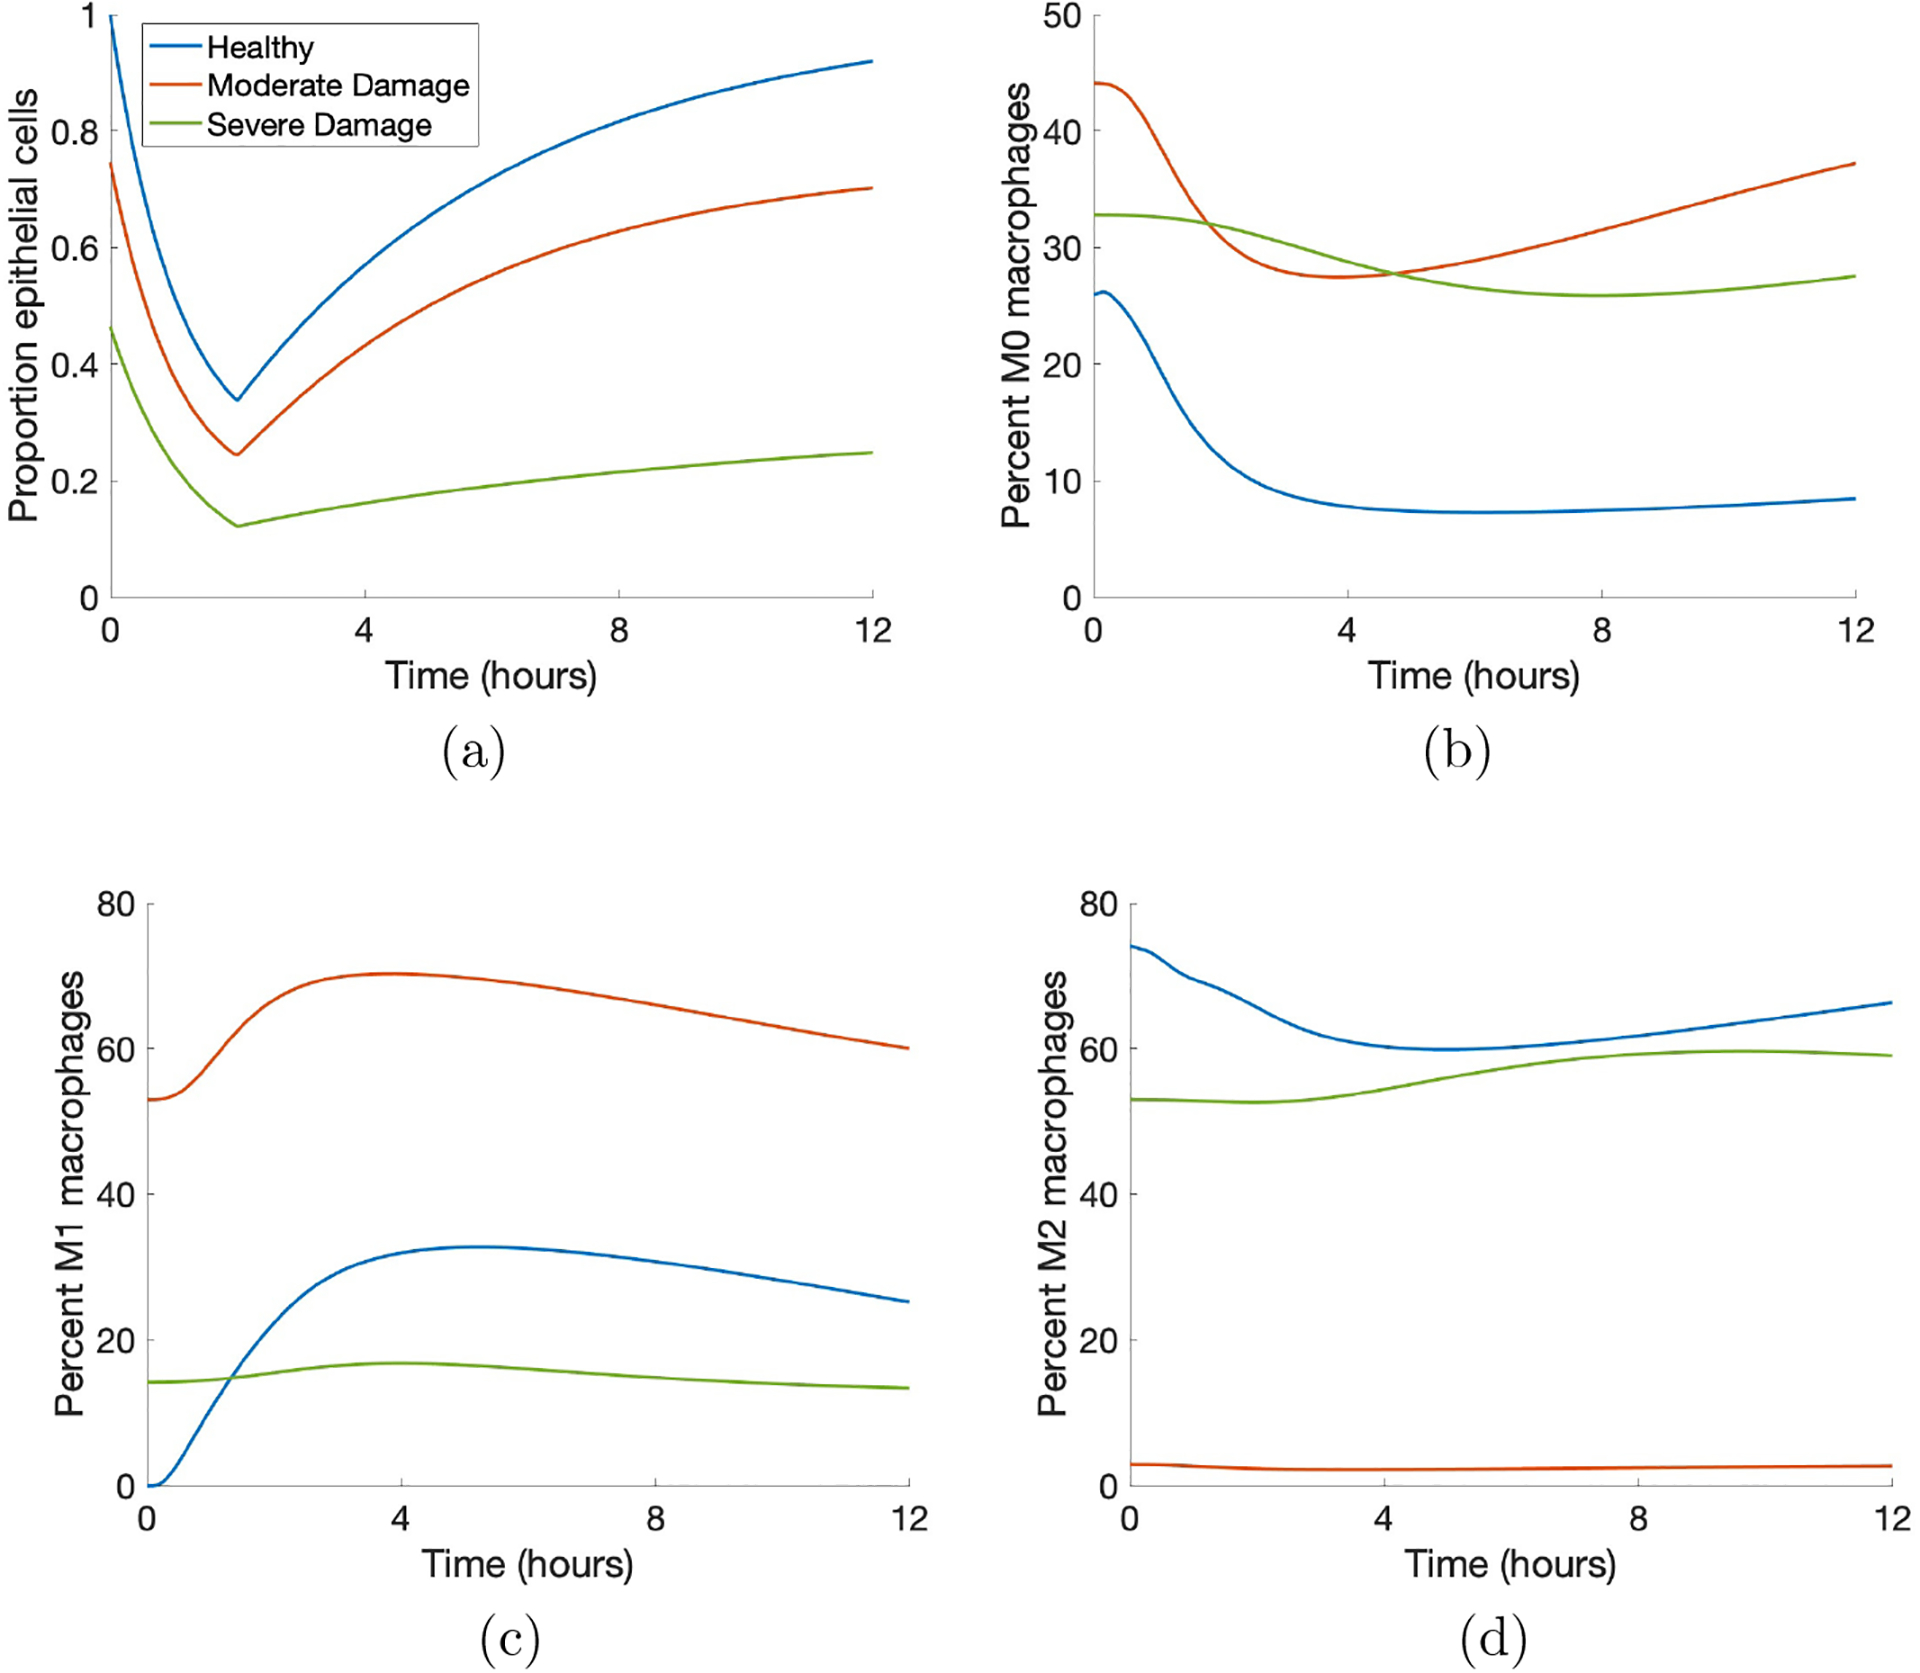
Blue, orange, and green curves indicate healthy, moderate damage and severe damage outcomes, respectively. (a) Proportion healthy epithelial cells. (b) Percent M0 macrophages. (c) Percent M1 macrophages. (d) Percent M2 macrophages.
We generated 100,000 parameter sets using LHS with parameter ranges given in Table 2. Fig 4 shows the breakdown of these parameter sets based on whether or not the dynamics led to a steady-state system and whether the steady state value had Ee ≤ 50% in the absence of ventilation. Their classification before ventilation and the resulting classification immediately after a 2-hour ventilation and after a 2-hour ventilation plus a recovery period (200 hours total) are also shown. The top number in each box is the total number of parameter sets in that category, and that number is further broken down by the category in which they started (column 1) and ended (column 2). The number in parentheses in the first column is the number of sets that started in that category but ended in a different one. Conversely, the number in parentheses in the second column shows the sets that ended in a certain outcome but did not start there. These numbers serve as a summary of how damage may affect outcome directly after ventilation as well as after a recovery period for the variety of behaviors in the collection of parameter sets. We will analyze all 24,432 sets that reach steady state (with steady state Ee < 50%) to understand the full array of responses that could occur.
3.2. Determining Predictors and Driving Dynamics
In this section we examine and compare the results of multiple methods that determine the parameters and other predictors that help differentiate or predict model dynamics and outcomes.
3.2.1. Correlations and Significance Testing Highlight Specific Parameters
As an initial step towards understanding relationships between parameters and model output, we calculated the correlations of parameters and predictors with one another for each outcome. There were some correlations between predictors that were very high, but were measuring similar things; for example, maximum M1 and minimum M1. We excluded these since they did not provide new or useful information. Aside from these, there were only a few correlations between parameters or between parameters and predictors that were higher than R = 0.3. The pair with the highest correlation, for outcome determined at both 2 and 200 hours, is shown in Fig 5 using a random sample from each classification group for better visibility of the points. For kmne, the rate of collateral damage to epithelial cells by macrophages and neutrophils, parameter sets that resulted in moderate and severe damage outcomes had a significant correlation with the Eh ratio at 0.5 hours. The Eh ratio and kmne had the following correlations for each group with classification at 2 hours: healthy R = 0.24 (not shown), moderate damage R = 0.43, and severe damage R = 0.73. For classification at 200 hours, the correlations were: healthy R = 0.1 (not shown), moderate damage R = 0.66, and severe damage R = 0.87. These high correlations suggest that the parameter kmne may play a key role in determining outcome, which we explored further in the following sections.
Figure 5: Scatter plot of predictors with notable correlations.
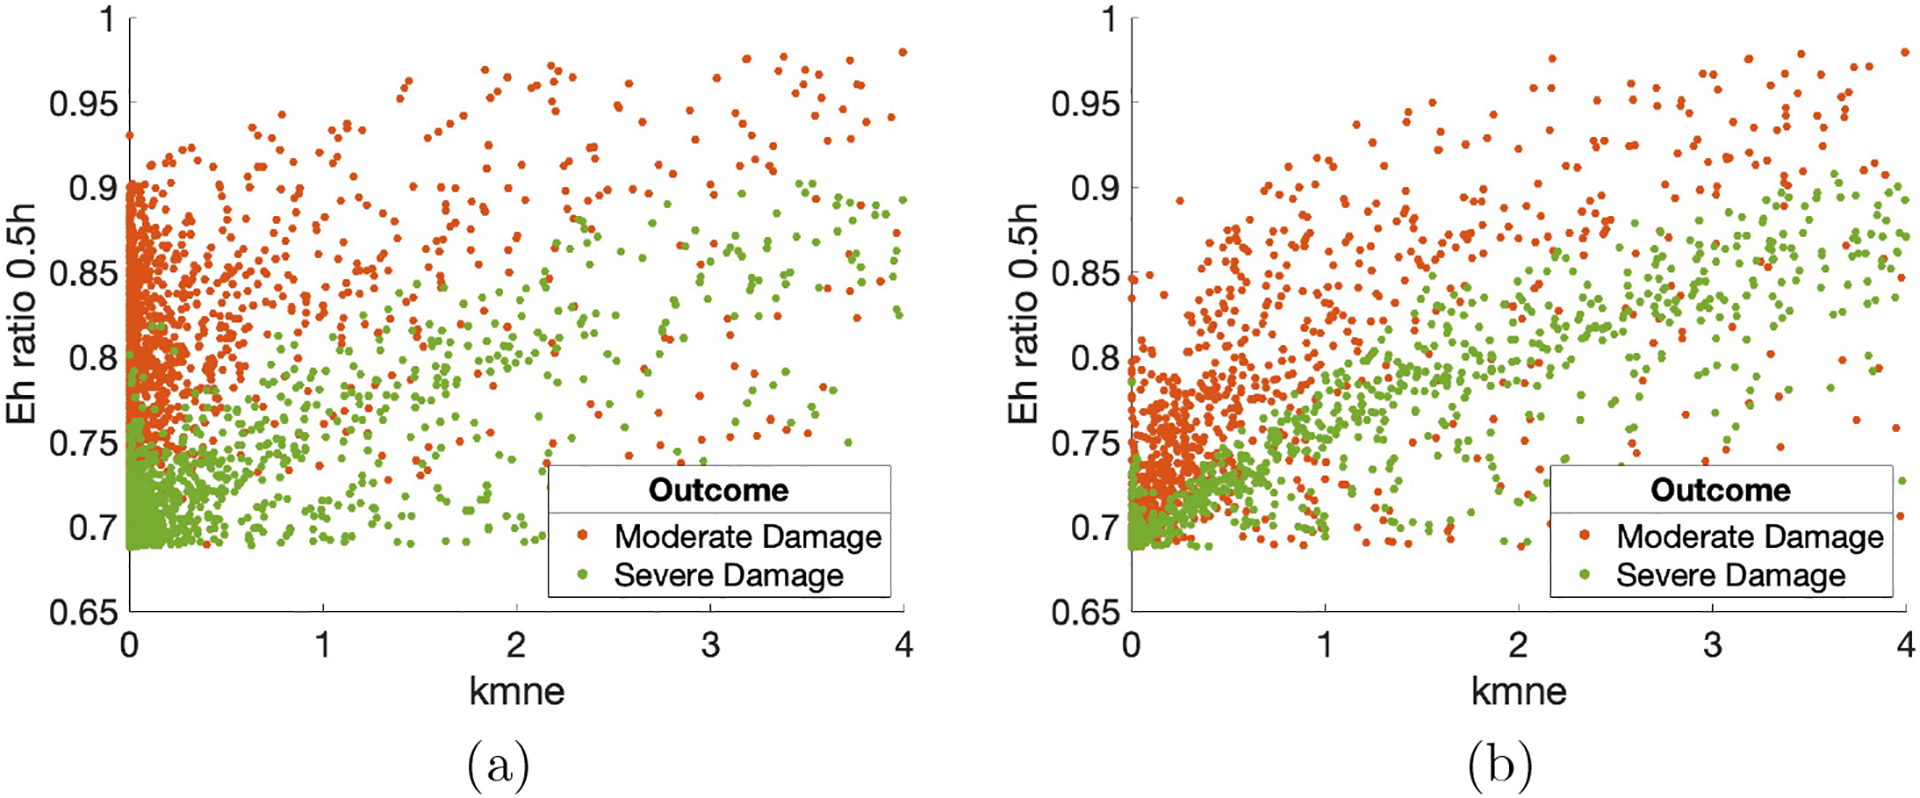
Parameter kmne (rate of collateral damage to epithelial cells by macrophages and neutrophils) versus ratio of Eh at 0.5 hours to initial Eh values. (a) Outcome was determined at 2 hours. Correlations: resolved to healthy R = 0.24 (not shown); moderate damage R = 0.43; severe damage R = 0.73. (b) Outcome was determined at 200 hours. Correlations: resolved to healthy R = 0.1 (not shown); moderate damage R = 0.66; severe damage R = 0.87. Points are a random sample of the total points.
We also performed hypothesis testing for predictors. We were not able to use ANOVA, a common statistical model used to examine the difference between group means, because the resulting distributions for the accepted parameter sets were not necessarily normal. The Kruskal-Wallis test is an alternative to ANOVA when the variable distributions are not normal [100]. We categorized all parameter sets by their outcome (healthy, moderate damage, severe damage) and compared them. If any of the three groups had a statistically significant difference (p-value less than 0.05), a Wilcoxon test was performed on each pair (healthy and moderate damage, healthy and severe damage, moderate and severe damage) to determine which groups were different from one another. P-values for the Kruskal-Wallis and Wilcoxon tests were adjusted using the Benjamini–Hochberg procedure to control for the false discovery rate [101]. Knowledge of which parameters and other predictors were different between groups based on outcome provides insight into predicting outcomes and which predictors might best influence the immune response to damage.
When classification occurred at 2 hours, 52 out of 81 parameters and other predictors returned results for a statistically significant difference between at least two groups and 30 gave statistically significant differences between all three groups. For classification at 200 hours, statistically significant differences occurred for at least two groups and all three groups for 40 and 13 predictors, respectively. Table 3 shows a summary of the results from the various methods used to examine predictors’ significance in determining model output. Columns 1 and 3 of Table 3 show the predictors in which all three groups were different from one another for both classification times, as determined by the Kruskal-Wallis and Wilcoxon tests. Results in other columns are described in the following sections. Box plots of a subset of predictors in which all three groups were different are shown in Fig 6 to help visualize these differences.
Table 3:
Summary of three different methods used to determine the most influential predictors, including parameters and other factors. Columns 1–4 show results for all 24,432 parameter sets. Columns 1–2 show results for analysis methods with classification into three categories (healthy, moderate damage, severe damage) after 2 hours, and columns 3–4 show results for classification after 200 hours. Columns 1 & 3: significance testing results for predictors in which all three groups are statistically different (p-value < 0.05). For ease of comparison between columns, the predictor is listed next to its counterpart in the ordered random forest list, if listed in that column. Column 2 & 4: average importance values determined by random forest decision trees. The top ten are ordered from highest to lowest importance. Columns 5–8: first-order eFAST results (ordered by p-value, with p-value < 0.05) for four time points.
| Classification after 2 hours | Classification after 200 hours | eFAST (Ordered) | |||||
|---|---|---|---|---|---|---|---|
| Sig. Testing | Random Forest | Sig. Testing | Random Forest | ||||
| (Not ordered) | (Ordered output) | (Not ordered) | (Ordered output) | 0.5h | 2h | 6h | 200h |
| Eh ratio 2h | Eh ratio 2h | kmne | kmne | ken | ken | xmne | xmne |
| Eh ratio 0.5h | Eh ratio 0.5h | Eh ratio 6h | kpe | br | |||
| Eh ratio 6h | Eh ratio 6h | xmne | xmne | μp | μp | ||
| kmne | kmne | Eh ratio 2h | Eh ratio 2h | xmne | kpe | ||
| br | br | Min M1 | Min M1 | kn | kn | ||
| kep | kep | Eh ratio 0.5h | Eh ratio 0.5h | kep | xmne | ||
| xmne | Min M2 | Min M2 | br | kep | |||
| Min M1 | Min M1 | M2% at 10h | M2% at 10h | kan | |||
| ken | ken | br | br | ||||
| sn | sn | ken | |||||
| Max M1 | M1 peak time | ||||||
| Min M1% | kep | ||||||
| kan | M1 peak ratio | ||||||
| Max M1% | μp | ||||||
| kem1 | kem1 | ||||||
| M1 peak time | |||||||
| kam1 | |||||||
| μna | |||||||
| Max M2% | |||||||
| kn | |||||||
| μp | |||||||
| Min M2% | |||||||
| a∞ | |||||||
| sm | |||||||
| M2% at 10h | |||||||
| μab | |||||||
| kpm1 | |||||||
| bp | |||||||
| knn | |||||||
| xm0ab | |||||||
| μm1b | |||||||
Figure 6: Predictors selected by significance testing show visible differences between injury groups.

Subset of parameters and predictors that showed a statistically significant difference between all three outcomes determined at 200 hours: healthy, moderate damage, and severe damage, as determined by the Kruskal-Wallis and Wilcoxon tests. These five predictors were also statistically significant when classification occurred at 2 hours. All are shown on a log scale for better visibility. Parameters/predictors: br, baseline repair rate of damaged cells; Eh ratio at 2h, ratio of Eh at 2 hours to Eh initial condition; kmne, rate of collateral damage to epithelial cells by macrophages and neutrophils; M1 peak ratio, ratio of M1 maximum to initial condition; xmne, regulates effectiveness of macrophages and neutrophils to damage epithelial cells (Hill-type constant).
3.2.2. Parameter Sensitivity with eFAST
We calculated eFAST indexes for Eh at 30 minutes, 2 hours (end of ventilation), 6 hours, and 200 hours (time at which outcome is determined). We included a few early time points since we are looking for parameters that could suggest early interventions to mitigate possible negative outcomes. We calculated first-order and total-order sensitivities Si and STi, respectively. Fig 7 shows results for the parameters with p-value < 0.05. Parameters xmne (Hill-type constant for effectiveness of macrophages and neutrophils in damaging epithelial cells), br (baseline repair of damaged cells), and ken (phagocytosis of damaged cells by N) were sensitive for several time points. There were no parameters with total-order sensitivity p-value < 0.05 for 6 hours. Parameters with a significant Si may be better candidates for treatment than those with a significant STi because first-order sensitivity measures sensitivity of Eh based only on fluctuations in a single parameter. For this reason and since many of the same parameters are significant for first-order and total-order sensitivity, we show results for first-order sensitivity in Columns 5–8 of Table 3, ordered from lowest p-value to highest and for the four time points specified.
Figure 7: Parameter sensitivity analysis shows which parameters most influence model output.
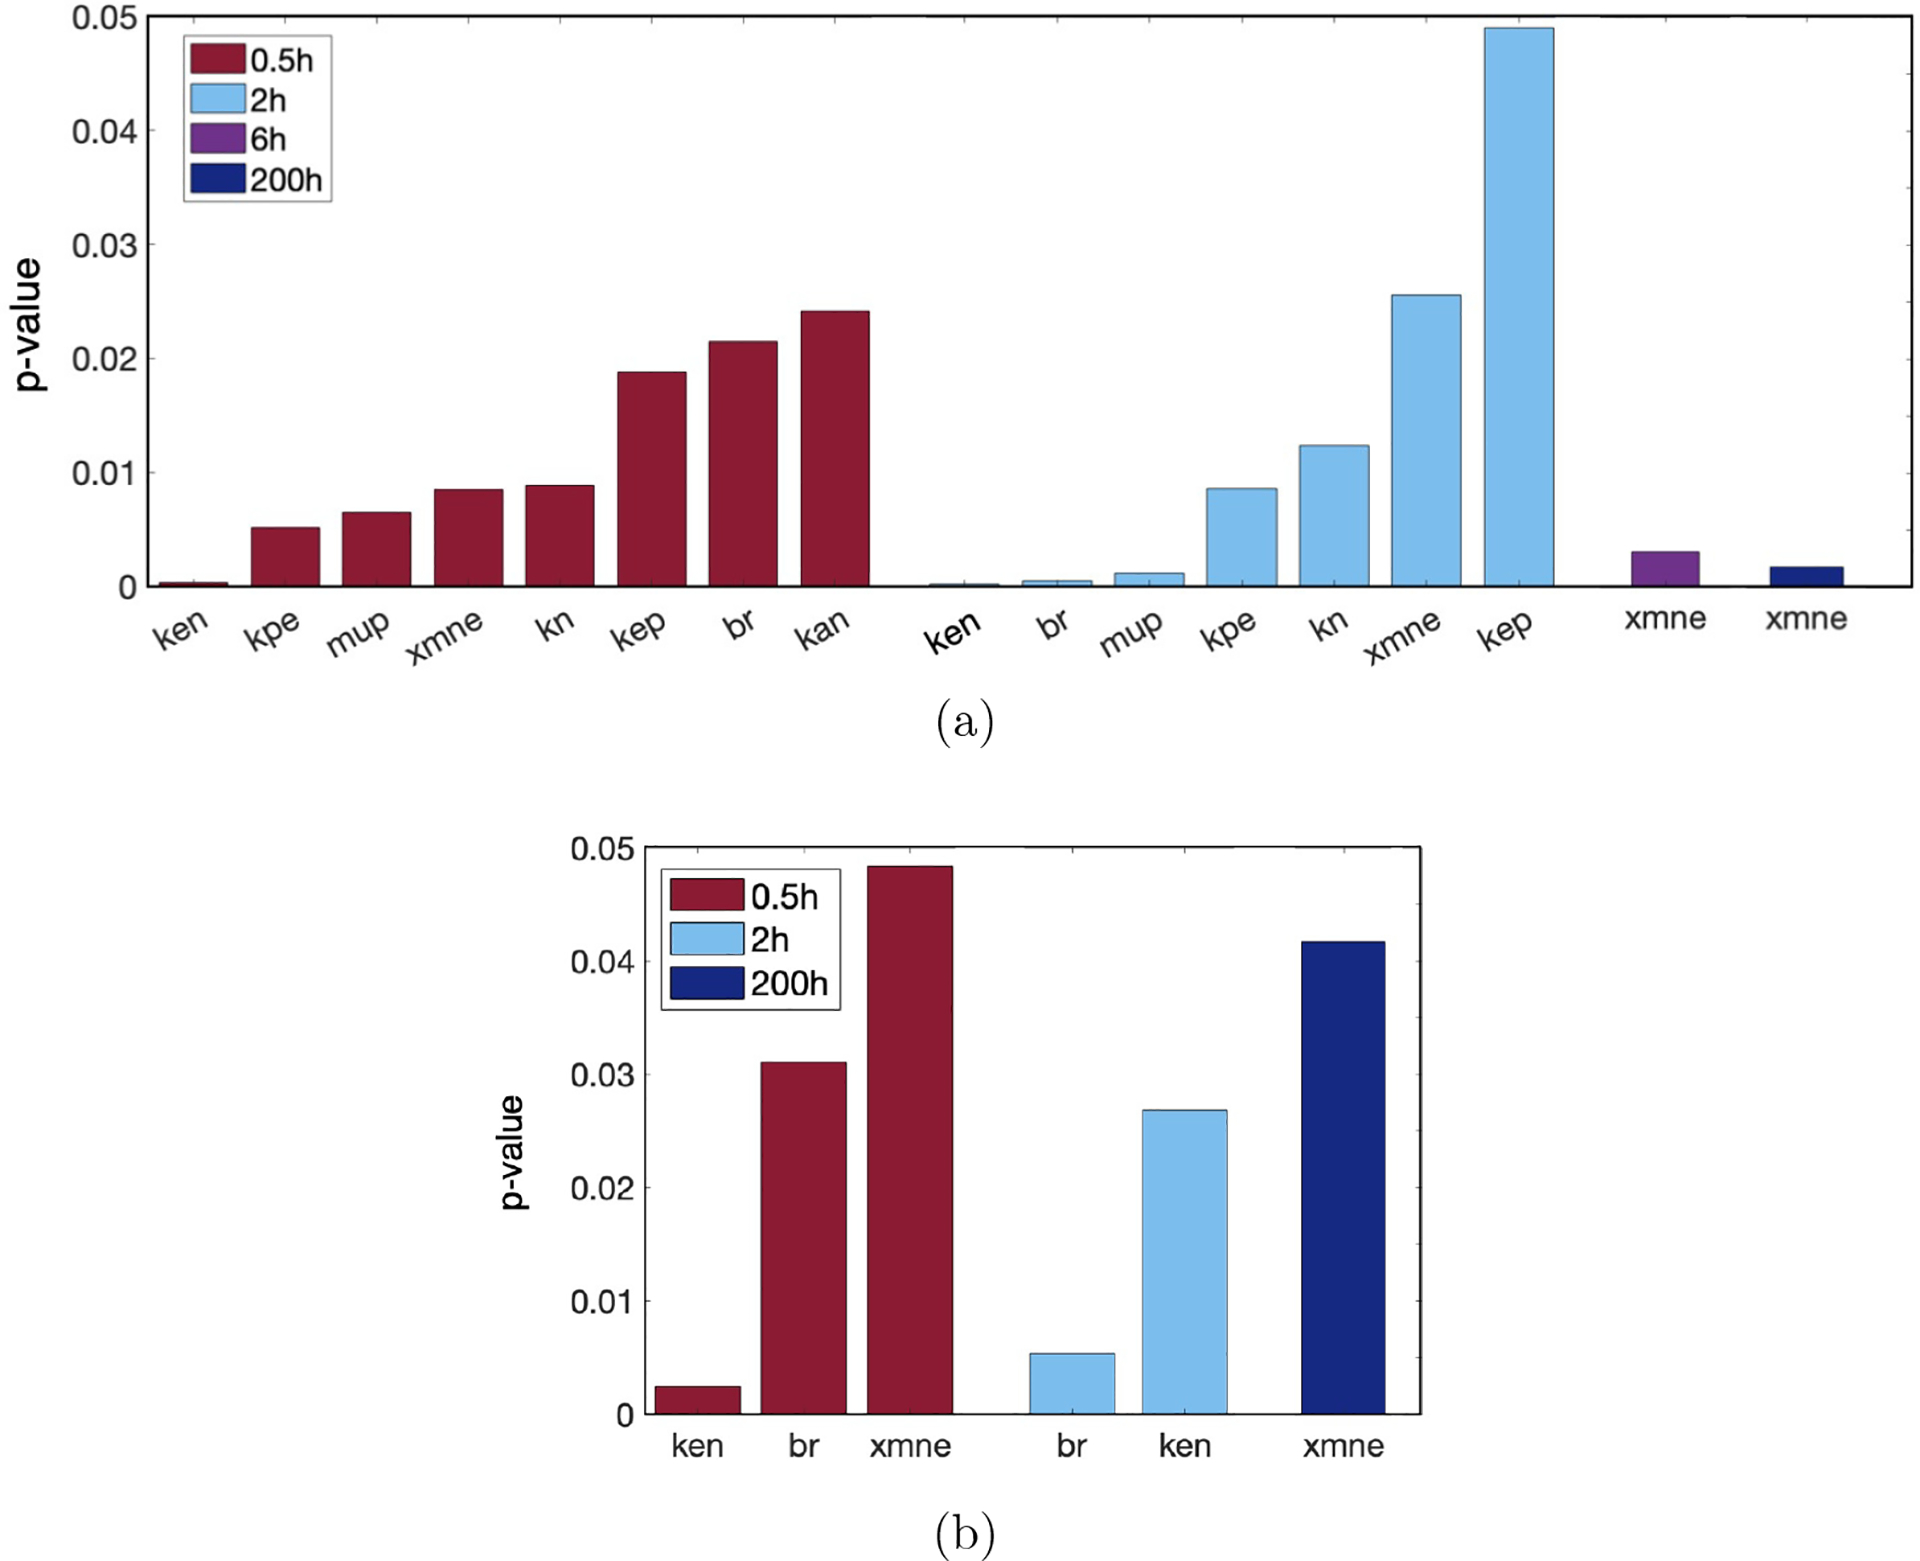
Parameters determined by eFAST to be most sensitive, with p-values calculated by comparing eFAST sensitivity indexes to a dummy variable. Results are given for each of the time points tested: 0.5 (red), 2 (blue), 6 hours (purple), 200 hours (navy). (a) First-order sensitivity, also shown in Table 3. (b) Total-order sensitivity. Results at 6 hours are not shown as there were no statistically significant parameters at that time point. Parameters: ken, rate of phagocytosis of damaged cells by N; kpe, production rate of p by Ed; μp, decay rate of p; xmne, regulates effectiveness of macrophages and neutrophils to damage epithelial cells (Hill-type constant); kn, rate of migration of Nb to lung; kep, rate of self-resolving repair mediated by p; br, baseline repair rate of damaged cells; kan, rate at which neutrophils become apoptotic.
3.2.3. Random forest algorithm to determine predictors
To offset any unusual results generated by the randomness of the decision tree algorithm, we replicated the process of randomly selecting a training set and generating importance values from the random forest 1000 times. Fig 8 shows the average and standard deviations of the top ten importance values generated for both 2-hour and 200-hour classifications.
Figure 8: Random forest decision tree selects top indicators of outcome.
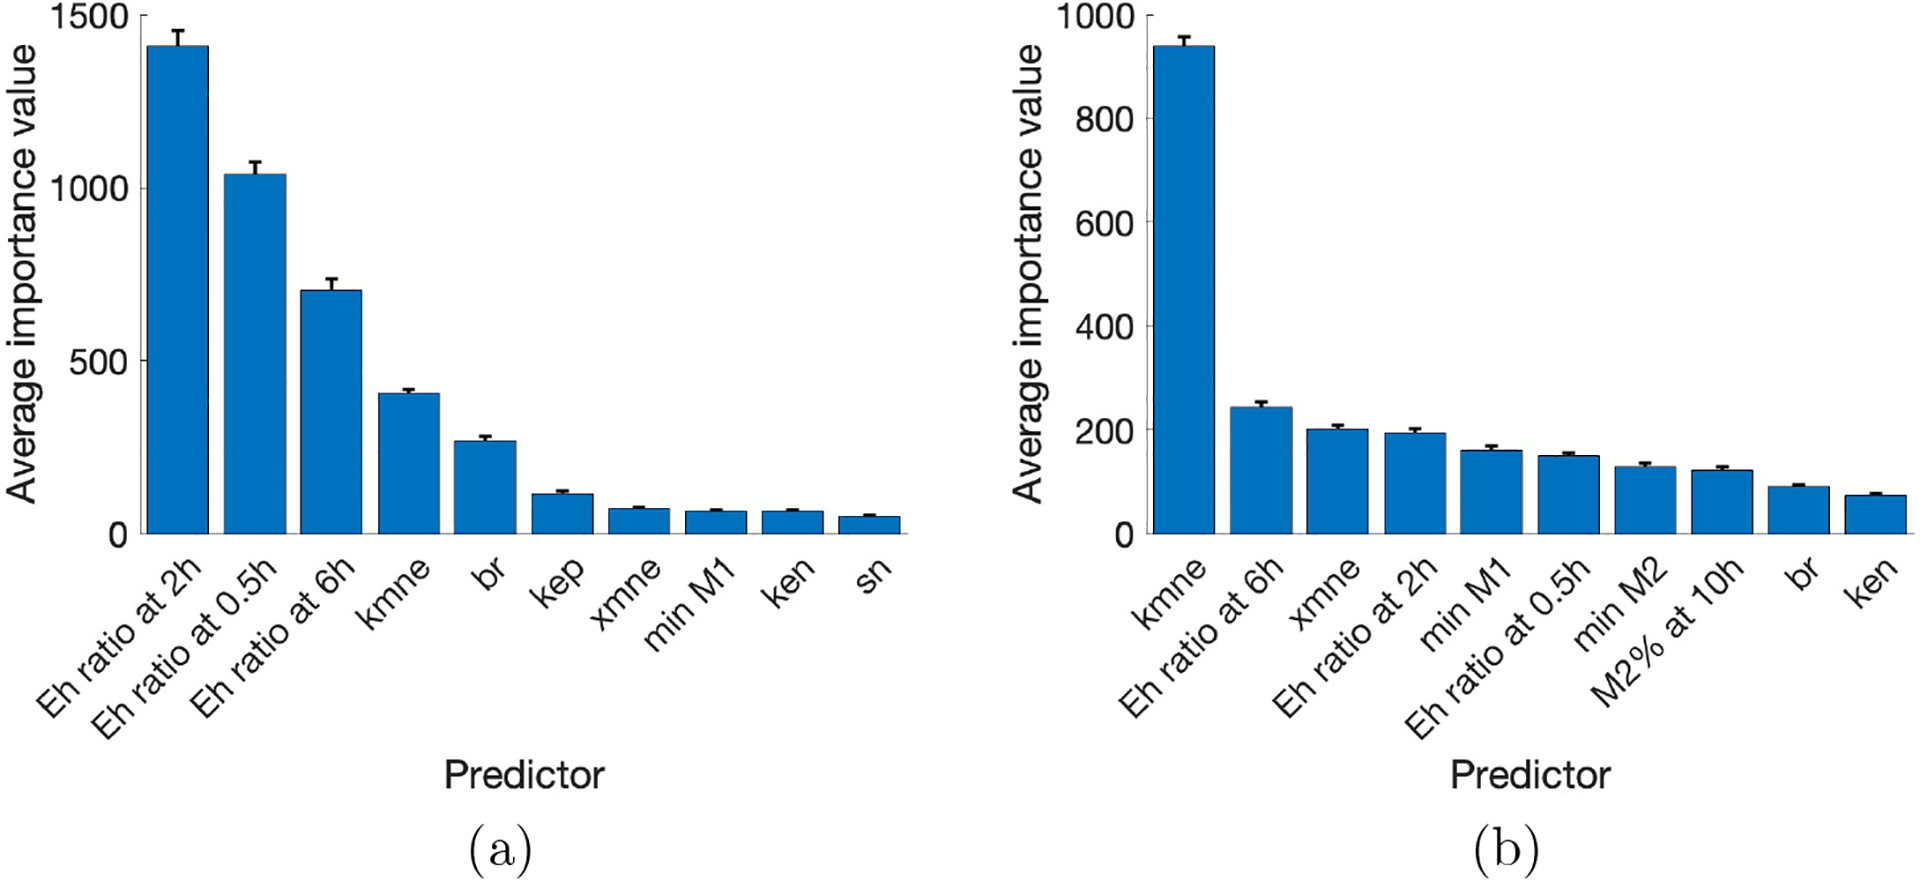
Mean and standard deviation of importance values for the top ten highest predictors from 1000 random forest decision trees. Results with classification at (a) 2 hours and (b) 200 hours. Parameters: kmne, rate of collateral damage to epithelial cells by macrophages and neutrophils; br, baseline repair rate of damaged cells; kep, rate of self-resolving repair mediated by p.; xmne, regulates effectiveness of macrophages and neutrophils to damage epithelial cells (Hill-type constant); ken, rate of phagocytosis of damaged cells by N; sn, source rate of N0b. Eh ratio at 0.5, 2, and 6h represents the ratio of Eh at those time points to its initial condition.
Many of the same predictors are seen in both 2 and 200-hour outcomes, though in a different order. Notice that the small standard deviations in both figures are small and support that the predictors remain the same across multiple random forest simulations. Furthermore, several of the top ten predictors were found to be significant by the Kruskal-Wallis test, and br, xmne, and ken are shared by random forest and eFAST. (see Table 3). The consistency of the importance of these parameters and predictors using different methods supports the idea that they play a significant role in the sensitivity of model output and determining or differentiating outcomes, both immediately after ventilation and after a period of recovery, though they may be more important at specific times
3.3. Modulating recovery: a case study of select transients
Fig 9 shows four examples of transients that started in one category and ended in another after ventilation plus a recovery period. We used the information gained in the parameter analysis to identify key targets for interventions that could modulate damage, especially in the case of a patient starting in one state and ending in a different, negative outcome even after a recovery period. The goal was to return the percentage of healthy epithelial cells to its original steady-state earlier, since the inability to recover from a 2-hour vent after 200 hours or more could be detrimental to long-term health.
Figure 9: Some parameter sets generate transients that end in a worse outcome.
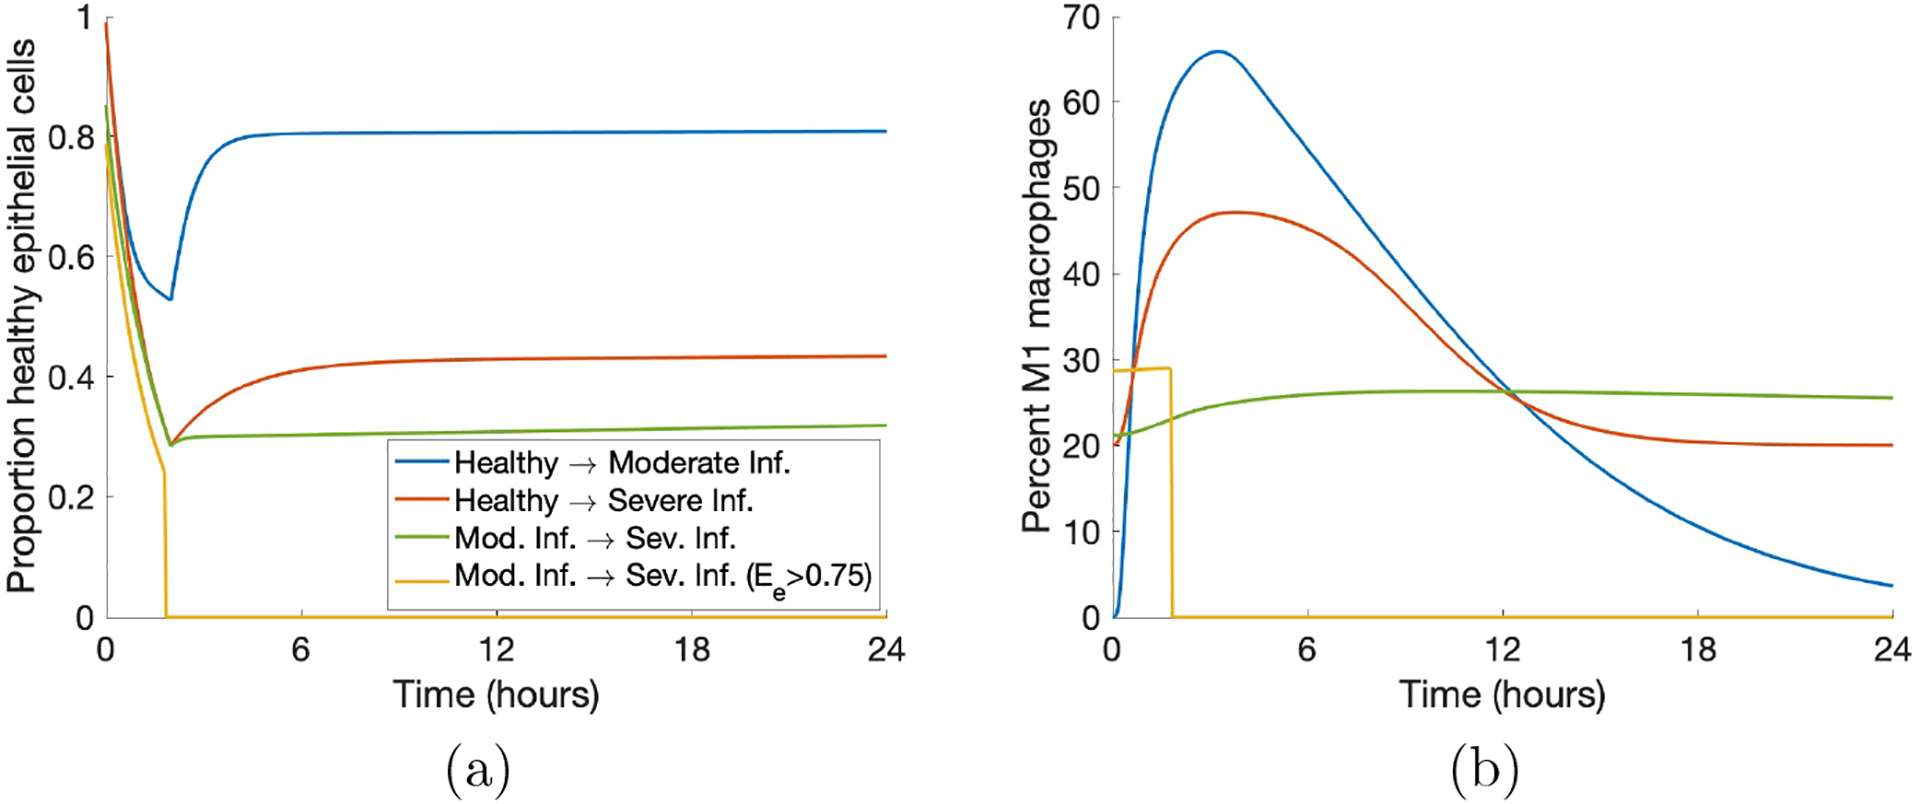
(a) Transients of Eh that started in one category and ended in a different one. (b) Corresponding transients of M1. We included examples of all possible worsening changes in classification as well as a case in which all variables were set to zero due to Ee > 0.75 at some time.
Our analysis showed that the parameters kmne, the rate of collateral damage by macrophages and neutrophils to epithelial cells, xmne, the Hill-type constant which regulates the effectiveness of macrophages and neutrophils in damaging epithelial cells, br, the rate of self-repair of healthy epithelial cells, and ken, the rate of phagocytosis of damaged cells by neutrophils, were some of the most influential parameters and thus could inform targets for intervention. Furthermore, in the previous section, we obtained results for classification at 2 hours and 200 hours, showing how parameter sensitivity differs between time points. Thus, we examined interventions beginning at several time points (see Fig 10).
Figure 10: Modulating parameters based on parameter analysis improved outcome in case study.
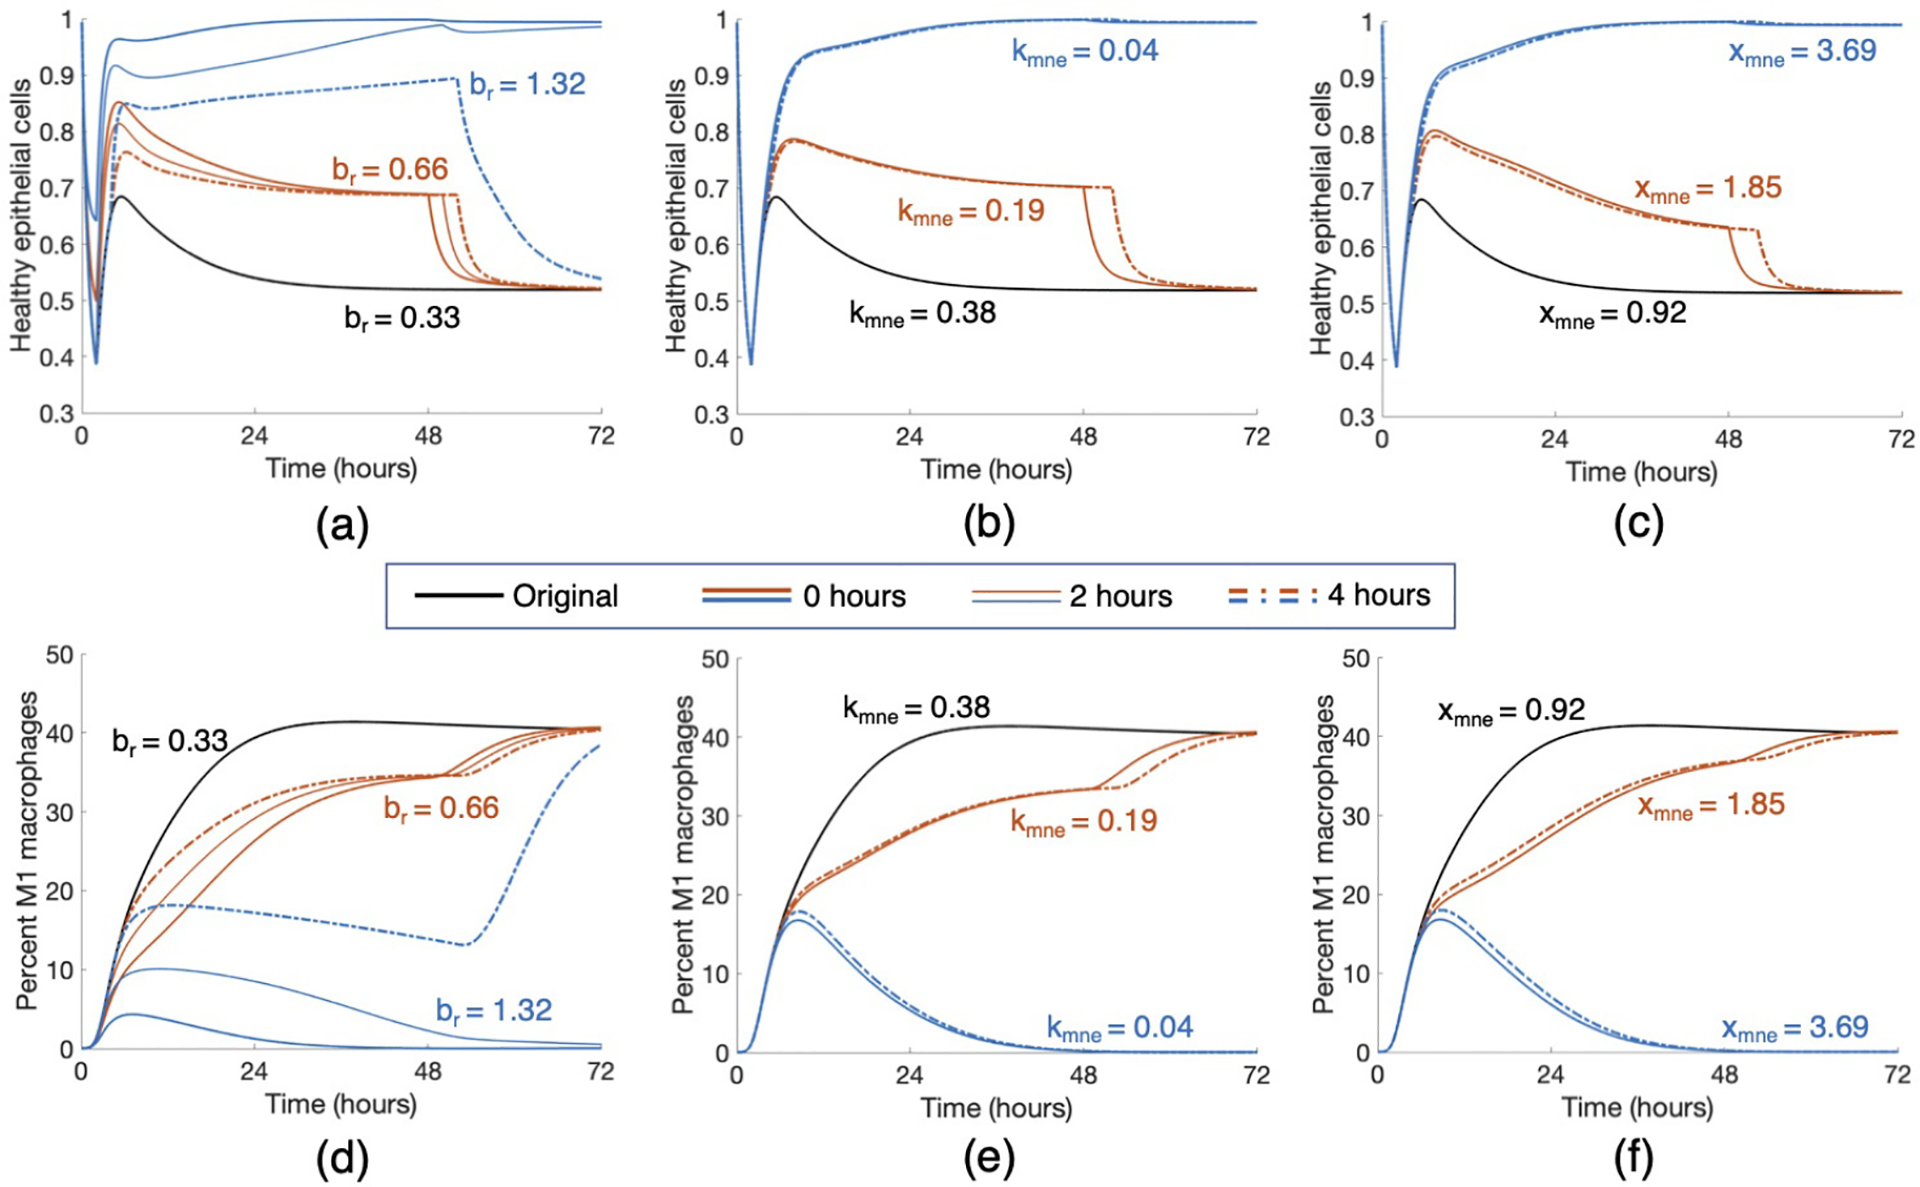
Starting with a parameter set that gave rise to an Eh transient that started healthy and ended in a moderate damage state, we applied various treatment strategies by changing three key parameters, br (rate at which healthy epithelial cells self-repair), kmne (rate of collateral damage to epithelial cells by macrophages and neutrophils), and xmne (Hill-type constant which regulates the effectiveness of macrophages and neutrophils in damaging epithelial cells). Results for various changes are shown for healthy epithelial cells (a, b, c) and percent of M1 macrophages (d, e, f). Treatment began at 0, 2, or 4 hours after the start of ventilation, denoted by solid, dotted, and dot-dashed lines, respectively, and lasted for 48 hours. The original parameter values are br = 0.33, kmne = 0.38, and xmne = 0.92. Black transients show the original dynamics without intervention. Orange transients show moderate treatment for each parameter, which was found to be insufficient in mediate the injury. Blue transients show stronger treatments, which were sufficient to bring about resolution for some intervention times.
We intervened in a case that started healthy and ended in moderate damage. Note in Fig 10, the original Eh transient began recovery to healthy after the two-hour ventilation period, but by the end of the 200-hour period, was at a lower Eh value than it was initially. This was coupled with a transient for M1 in which the pro-inflammatory phenotype increases significantly and then stays in the 40–45% range.
Increasing br by various amounts had increasingly positive effects on long-term epithelial health. Lower values of br increased Eh slightly and an earlier intervention generated a higher peak of Eh around five hours, but did not continue increasing at this rate regardless of intervention time. If br was increased substantially for a significant duration of treatment time, healthy epithelial cells reached the healthy steady-state after ventilation and did not decrease again. Shown in Figures 10a and 10d, doubling br to 0.66 was not enough to generate recovery, but increasing br by a factor of four to 1.32 did result in a healthy outcome. For an insufficient treatment duration and value of br, levels of Eh were higher until treatment ended and then decreased back to the same level as the original simulation. For a long enough treatment duration, the proportion of healthy epithelial cells remained high even after treatment ended. For br = 0.66, the intervention time did not improve health in the long run, whereas for br = 1.32, intervention at either 0 or 2 hours was sufficient to bring about recovery while intervention at 4 hours was not.
The parameter kmne has an inverse relationship with epithelial health; thus, decreasing the parameter provided better results. Decreasing kmne slightly increased the rate of recovery but not enough to change the outcome to resolved. However, with a significant enough decrease of kmne, M1 activation peaked around hour 10 and decreased back to its original level. The original simulation shows M1 activation leveling off at a high percentage of activation (Fig 10e). The modulated return to baseline levels was paired with a healthy outcome for epithelial cells (Fig 10b). For higher values of kmne, results were about the same for any intervention time 4 hours or less after the beginning of ventilation. Note in Fig 10 that the time at which intervention begins mattered somewhat for changes in br but not for kmne. Figures 10b and 10e show that half of the original value of kmne (0.38 to 0.19) was not low enough to change the outcome; multiplying by a factor of 0.1 to kmne = 0.04, on the other hand, was sufficient to change the outcome to healthy.
We also increased the parameter xmne. Increasing this value caused the presence of macrophages and neutrophils to be less effective in damaging epithelial cells. Similarly to the other treatments, sufficient changes to xmne brought about long-term recovery and the time at which intervention began was not as important. Figures 10c and 10f show doubling xmne to 1.85 was insufficient to change the outcome, and increasing xmne by a factor of four to 3.69 was sufficient.
Finally, we increased ken. This increased the rate at which neutrophils phagocytize damaged cells, making room for new, healthy cells. Interestingly, although ken was shown to be an important parameter in our analysis, even increasing the parameter by a factor of ten to 1.52 was insufficient to make any real changes in the epithelial and macrophage populations. Since there was no significant change, we do not show this treatment in Fig 10.
We also examined the results of combination therapy that could include regulation of two or three parameters. Together, changes in parameter values that would be insufficient on their own were able to regulate macrophage activation and bring epithelial cells back to a healthy state. Additionally, higher values of br and xmne and lower values of kmne precipitated a quicker recovery from damage. Intervention time was important for parameter values near the threshold, but not for parameter values sufficiently above or below the threshold. Intervention time may make a difference in the ending values of Eh or M1, depending on the parameters. Many combinations could be formulated; Fig 11 shows two cases in which two parameter changes were insufficient to bring about recovery individually but were sufficient when combined. The orange curves show br = 0.99 and kmne = 0.19 and the blue curves show xmne = 2.31 and ken = 1.52, which brought about long-term recovery for all three intervention times.
Figure 11: Treatment by combining parameter changes can result in a positive outcome.
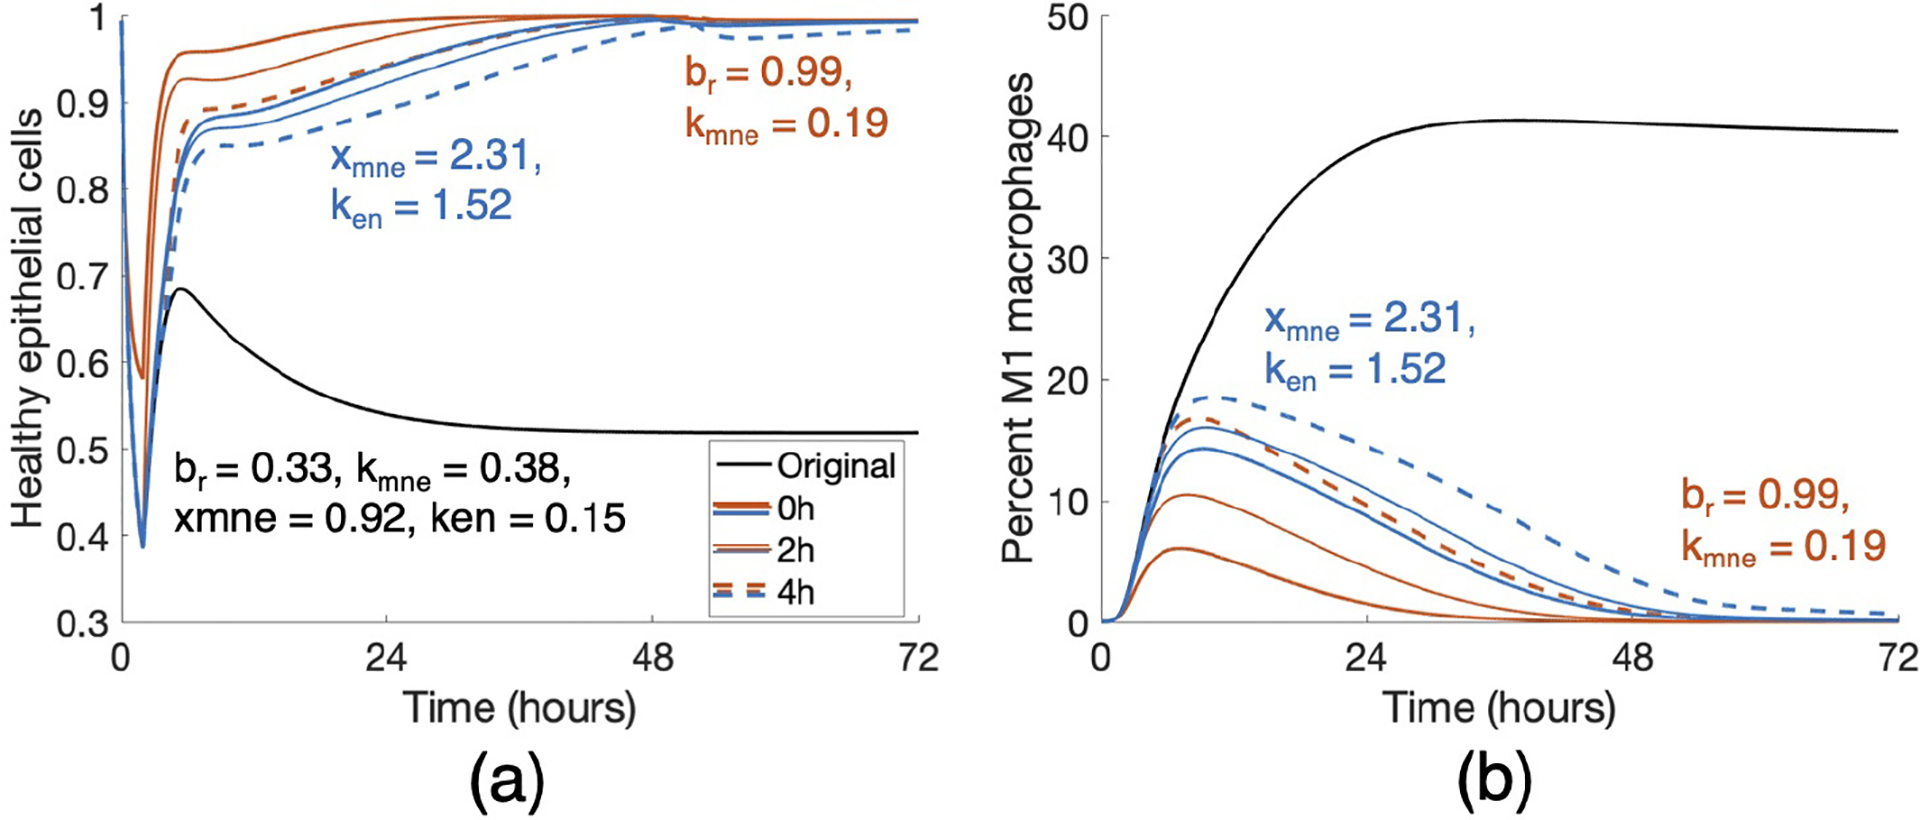
Changes in br, kmne, xmne and ken that were insufficient on their own (Fig 10) resulted in a change in outcome when combined. Orange curves show a combination treatment of br = 0.99 and kmne = 0.19 and blue curves show that of xmne = 2.31 and ken = 1.52. Duration of treatment in each case was 48 hours, and all intervention times (0, 2, and 4 hours) were successful in a long-term recovery.
For other cases starting in a healthy state and ending in moderate or severe damage, a high enough br can bring about resolution in some cases. In general, earlier intervention times resulted in a faster rate of recovery, but there were varied responses to changes in kmne, xmne, and ken. Even for transients with similar Eh and M1 dynamics, reactions to interventions may be different, reinforcing the uniqueness of each parameter set, mirroring the variety of patient responses to MV.
4. Discussion
MV is a widely-used short-term life support technique. However, despite its life-saving uses, it often comes with serious complications. Decades of work have contributed to our understanding of the physiology and management of MV, though additional research is needed to best care for patients during and after the period of ventilation, including interventions that target inflammation triggered by ventilator-induced lung injury [99]. Within the immune response, the spectrum of macrophage activation has been a recently growing field of research [15, 23] and with recent findings regarding differences in macrophage polarization linked to age [6, 102], a better understanding of and treatment for VILI is of great concern. Additionally, mortality rates for MV patients increase with age [103, 104]. Mathematical models have studied a host of causes of lung inflammation, including bacterial and viral infections and allergic reactions [40]. Our model includes macrophage polarization with a more detailed epithelial subsystem to model ventilator-induced lung injury. These features provide a better understanding of how the components of the immune response, including those associated with the different macrophage phenotypes and baseline lung health (steady state values), play a role in post-ventilation outcomes both immediately after ventilation as well as after a period of recovery.
Our approach of developing a collection of parameter sets and identifying the important parameters is a first step in uncovering the driving mechanisms behind VILI and how they contribute to outcomes. Analysis of the model showed that properties and parameters related to epithelial repair and M1 activation and de-activation were especially predictive of outcome. We used br, the rate of self-repair of epithelial cells, kmne, the rate at which macrophages and neutrophils cause collateral damage to epithelial cells, xmne, the Hill-type coefficient that regulates the effectiveness of that collateral damage, and ken, the rate of phagocytosis of damaged epithelial cells by neutrophils, to simulate treatments for a parameter set in the collection that started healthy and ended in a moderate damage outcome. We found that modulating br is effective in most cases, and the other four can be helpful in some. The chosen case responded differently to treatments and these were paired with varied M1 activation dynamics, indicating that macrophage activation is tied to epithelial health in VILI.
The epithelial subsystem in this model is a simplified version of epithelial cell dynamics that reduces complexity by not accounting for each individual cell and all possible damage levels. We used three categories to model epithelial cell states where a damaged epithelial cell corresponds to increased production of pro-inflammatory mediators. Using this model with data will require alignment of these variables with experimental measurements of lung health. Future iterations of this model would ideally be calibrated with M1/M2 activation and lung epithelial data in the context of VILI derived from clinical samples. However this would likely need measurements of macrophage phenotypes and epithelial health at multiple time points from various age groups. Until these types of clinical and experimental measures are available, biologically relevant dynamics could be determined using inflammatory biomarkers and macrophage recruitment from cell and tissue experimental models of VILI [105–107]. For example, Valentine et al. recorded inflammatory gene expression and monocyte recruitment in response to in vitro mechanical stretch [108].
Another area of study is determining if and when the model is bistable, identifying mechanisms that can transition trajectories from one steady state to another, and establishing when this is biologically relevant with regard to treatment. This would help address why some virtual cases can recover with a short intervention time while others need indefinite treatment. Additionally, this model can be expanded to include other types of injury and/or the comorbidities that lead to needing MV, such as a bacterial or viral infection or ARDS, or coupled with other previously published models, to study the interactions between the different types of injury and how they contribute to patient outcome.
In conclusion, our model contributes to the current understanding of the immune response in the lungs, and is an important first step for VILI. Our parameter analysis using a variety of methods provides new insight into potential interventions during and after ventilation to mediate VILI. Experimental data will greatly improve our ability to suggest treatments. Furthermore, the model can be extended to address specific diseases.
Supplementary Material
5. Acknowledgments
This work was supported by the National Science Foundation via award CMMI-1351162 and by the National Institutes of Health via award R21HL146250 (R.H.).
Footnotes
Publisher's Disclaimer: This is a PDF file of an unedited manuscript that has been accepted for publication. As a service to our customers we are providing this early version of the manuscript. The manuscript will undergo copyediting, typesetting, and review of the resulting proof before it is published in its final form. Please note that during the production process errors may be discovered which could affect the content, and all legal disclaimers that apply to the journal pertain.
References
- [1].Williams GW, Berg NK, Reskallah A, Yuan X, Eltzschig HK, Acute Respiratory Distress Syndrome: Contemporary Management and Novel Approaches during COVID-19, Anesthesiology 134 (2021) 270–282. URL: 10.1097/ALN.0000000000003571. doi: 10.1097/ALN.0000000000003571. [DOI] [PMC free article] [PubMed] [Google Scholar]
- [2].Halbertsma FJJ, Vaneker M, Scheffer GJ, van der Hoeven JG, Cytokines and biotrauma in ventilator-induced lung injury: a critical review of the literature, The Netherlands Journal of Medicine 63 (2005) 382–392. [PubMed] [Google Scholar]
- [3].Slutsky AS, Ranieri VM, Ventilator-Induced Lung Injury, New England Journal of Medicine 369 (2013) 2126–2136. URL: 10.1056/NEJMra1208707. doi: 10.1056/NEJMra1208707. [DOI] [PubMed] [Google Scholar]
- [4].Provinciali M, Cardelli M, Marchegiani F, Inflammation, chronic obstructive pulmonary disease and aging, Current Opinion in Pulmonary Medicine 17 (2011) S3. doi: 10.1097/01.mcp.0000410742.90463.1f. [DOI] [PubMed] [Google Scholar]
- [5].Rekeneire N. d., Peila R, Ding J, Colbert LH, Visser M, Shorr RI, Kritchevsky SB, Kuller, Strotmeyer ES, Schwartz AV, Vellas B, Harris TB, Diabetes, Hyperglycemia, and Inflammation in Older Individuals: The Health, Aging and Body Composition study, Diabetes Care 29 (2006) 1902–1908. URL: https://care.diabetesjournals.org/content/29/8/1902. doi: 10.2337/dc05-2327. [DOI] [PubMed] [Google Scholar]
- [6].Canan CH, Gokhale NS, Carruthers B, Lafuse WP, Schlesinger LS, Torrelles JB, Turner J, Characterization of Lung Inflammation and its Impact on Macrophage Function in Aging, Journal of Leukocyte Biology 96 (2014) 473–480. URL: http://www.jleukbio.org.proxy.library.vcu.edu/content/96/3/473. doi: 10.1189/jlb.4A0214-093RR. [DOI] [PMC free article] [PubMed] [Google Scholar]
- [7].Feng Y, Amoateng-Adjepong Y, Kaufman D, Gheorghe C, Manthous CA, Age, duration of mechanical ventilation, and outcomes of patients who are critically ill, Chest 136 (2009) 759–764. [DOI] [PubMed] [Google Scholar]
- [8].Lai C-C, Shih T-P, Ko W-C, Tang H-J, Hsueh P-R, Severe acute respiratory syndrome coronavirus 2 (SARS-CoV-2) and coronavirus disease-2019 (COVID-19): The epidemic and the challenges, International Journal of Antimicrobial Agents 55 (2020) 105924. URL: https://www.sciencedirect.com/science/article/pii/S0924857920300674. doi: 10.1016/j.ijantimicag.2020.105924. [DOI] [PMC free article] [PubMed] [Google Scholar]
- [9].Carter C, Notter J, COVID-19 disease: a critical care perspective, Clinics in Integrated Care 1 (2020) 100003. URL: http://www.sciencedirect.com/science/article/pii/S2666869620300038. doi: 10.1016/j.intcar.2020.100003. [DOI] [Google Scholar]
- [10].Mahase E, Covid-19: most patients require mechanical ventilation in first 24 hours of critical care, BMJ 368 (2020). URL: https://www.bmj.com/content/368/bmj.m1201. doi: 10.1136/bmj.m1201, publisher: British Medical Journal Publishing Group Section: News. [DOI] [PubMed] [Google Scholar]
- [11].Wunsch H, Mechanical Ventilation in COVID-19: Interpreting the Current Epidemiology, American Journal of Respiratory and Critical Care Medicine 202 (2020) 1–4. URL: https://www.atsjournals.org/doi/10.1164/rccm.202004-1385ED. doi: 10.1164/rccm.202004-1385ED. [DOI] [PMC free article] [PubMed] [Google Scholar]
- [12].Wu Z, McGoogan JM, Characteristics of and Important Lessons From the Coronavirus Disease 2019 (COVID-19) Outbreak in China: Summary of a Report of 72 314 Cases From the Chinese Center for Disease Control and Prevention, JAMA 323 (2020) 1239–1242. URL: https://jamanetwork.com/journals/jama/fullarticle/2762130. doi: 10.1001/jama.2020.2648, publisher: American Medical Association. [DOI] [PubMed] [Google Scholar]
- [13].Bruno G, Perelli S, Fabrizio C, Buccoliero GB, Short-term outcomes in individuals aged 75 or older with severe coronavirus disease (COVID-19): First observations from an Infectious Diseases Unit in Southern Italy, The Journal of Infection (2020). URL: https://www.ncbi.nlm.nih.gov/pmc/articles/PMC7224683/. doi: 10.1016/j.jinf.2020.05.024. [DOI] [PMC free article] [PubMed] [Google Scholar]
- [14].Eberhardt M, Lai X, Tomar N, Gupta S, Schmeck B, Steinkasserer A, Schuler G, Vera J, Third-Kind Encounters in Biomedicine: Immunology Meets Mathematics and Informatics to Become Quantitative and Predictive, Methods in Molecular Biology (Clifton, N.J.) 1386 (2016) 135–179. doi: 10.1007/978-1-4939-3283-29. [DOI] [PubMed] [Google Scholar]
- [15].Torres M, Wang J, Yannie PJ, Ghosh S, Segal RA, Reynolds AM, Identifying important parameters in the inflammatory process with a mathematical model of immune cell influx and macrophage polarization, PLOS Computational Biology 15 (2019) e1007172. URL: https://journals.plos.org/ploscompbiol/article?id=10.1371/journal.pcbi.1007172 doi: 10.1371/journal.pcbi.1007172. [DOI] [PMC free article] [PubMed] [Google Scholar]
- [16].Matthay MA, Robriquet L, Fang X, Alveolar Epithelium, Proceedings of the American Thoracic Society 2 (2005) 206–213. URL: https://www.atsjournals.org/doi/full/10.1513/pats.200501-009AC. doi: 10.1513/pats.200501-009AC. [DOI] [PubMed] [Google Scholar]
- [17].Mason RJ, Biology of alveolar type II cells, Respirology 11 (2006) S12–S15. URL: https://onlinelibrary.wiley.com/doi/abs/10.1111/j.1440-1843.2006.00800.x. doi: 10.1111/j.1440-1843.2006.00800.x. [DOI] [PubMed] [Google Scholar]
- [18].Kolaczkowska E, Kubes P, Neutrophil Recruitment and Function in Health and Inflammation, Nature Reviews Immunology 13 (2013) 159–175. URL: https://www.nature.com/articles/nri3399. doi: 10.1038/nri3399. [DOI] [PubMed] [Google Scholar]
- [19].Grommes J, Soehnlein O, Contribution of Neutrophils to Acute Lung Injury, Molecular Medicine 17 (2011) 293–307. URL: https://www.ncbi.nlm.nih.gov/pmc/articles/PMC3060975/. doi: 10.2119/molmed.2010.00138. [DOI] [PMC free article] [PubMed] [Google Scholar]
- [20].Naylor EJ, Bakstad D, Biffen M, Thong B, Calverley P, Scott S, Hart CA, Moots RJ, Edwards SW, Haemophilus Influenzae Induces Neutrophil Necrosis, American Journal of Respiratory Cell and Molecular Biology 37 (2007) 135–143. URL: https://www.atsjournals.org/doi/full/10.1165/rcmb.2006-0375OC. doi: 10.1165/rcmb.2006-0375OC. [DOI] [PubMed] [Google Scholar]
- [21].Mosser DM, Edwards JP, Exploring the Full Spectrum of Macrophage Activation, Nature Reviews Immunology 8 (2008) 958–969. URL: http://www.nature.com.proxy.library.vcu.edu/nri/journal/v8/n12/full/nri2448.html doi: 10.1038/nri2448. [DOI] [PMC free article] [PubMed] [Google Scholar]
- [22].Wang N, Liang H, Zen K, Molecular Mechanisms That Influence the Macrophage M1–M2 Polarization Balance, Frontiers in Immunology 5 (2014). URL: http://www.ncbi.nlm.nih.gov/pmc/articles/PMC4246889/. doi: 10.3389/fimmu.2014.00614. [DOI] [PMC free article] [PubMed] [Google Scholar]
- [23].Bosco MC, Macrophage polarization: Reaching across the aisle?, Journal of Allergy and Clinical Immunology 143 (2019) 1348–1350. URL: https://www.jacionline.org/article/S0091-6749(19)30005-3/abstract. doi: 10.1016/j.jaci.2018.12.995, publisher: Elsevier. [DOI] [PubMed] [Google Scholar]
- [24].Linehan E, Fitzgerald D, Ageing and the Immune System: Focus on Macrophages, European Journal of Microbiology and Immunology 5 (2015) 14–24. URL: http://akademiai.com/doi/abs/10.1556/EuJMI-D-14-00035. doi: 10.1556/EuJMI-D-14-00035. [DOI] [PMC free article] [PubMed] [Google Scholar]
- [25].Mahbub S, Deburghgraeve CR, Kovacs EJ, Advanced Age Impairs Macrophage Polarization, Journal of Interferon & Cytokine Research 32 (2011) 18–26. URL: http://online.liebertpub.com/doi/abs/10.1089/jir.2011.0058. doi: 10.1089/jir.2011.0058. [DOI] [PMC free article] [PubMed] [Google Scholar]
- [26].Smith AM, Host-pathogen kinetics during influenza infection and coinfection: insights from predictive modeling, Immunological Reviews 285 (2018) 97–112. URL: https://onlinelibrary.wiley.com/doi/abs/10.1111/imr.12692. doi: 10.1111/imr.12692. [DOI] [PMC free article] [PubMed] [Google Scholar]
- [27].Murillo LN, Murillo MS, Perelson AS, Towards multiscale modeling of influenza infection, Journal of Theoretical Biology 332 (2013) 267–290. URL: http://www.sciencedirect.com/science/article/pii/S0022519313001501. doi: 10.1016/j.jtbi.2013.03.024. [DOI] [PMC free article] [PubMed] [Google Scholar]
- [28].Boianelli A, Nguyen V, Ebensen T, Schulze K, Wilk E, Sharma N, Stegemann-Koniszewski S, Bruder D, Toapanta F, Guzmán C, Meyer-Hermann M, Hernandez-Vargas E, Boianelli A, Nguyen VK, Ebensen T, Schulze K, Wilk E, Sharma N, Stegemann-Koniszewski S, Bruder D, Toapanta FR, Guzmán CA, Meyer-Hermann M, Hernandez-Vargas EA, Modeling Influenza Virus Infection: A Roadmap for Influenza Research, Viruses 7 (2015) 5274–5304. URL: https://www.mdpi.com/1999-4915/7/10/2875. doi: 10.3390/v7102875. [DOI] [PMC free article] [PubMed] [Google Scholar]
- [29].Cardona P-J, Català M, Arch M, Arias L, Alonso S, Cardona P, López D, Vilaplana C, Prats C, Can systems immunology lead tuberculosis eradication?, Current Opinion in Systems Biology 12 (2018) 53–60. URL: http://www.sciencedirect.com/science/article/pii/S2452310018300763. doi: 10.1016/j.coisb.2018.10.004. [DOI] [Google Scholar]
- [30].Kirschner D, Pienaar E, Marino S, Linderman JJ, A review of computational and mathematical modeling contributions to our understanding of Mycobacterium tuberculosis within-host infection and treatment, Current Opinion in Systems Biology 3 (2017) 170–185. URL: http://www.sciencedirect.com/science/article/pii/S2452310016300117. doi: 10.1016/j.coisb.2017.05.014. [DOI] [PMC free article] [PubMed] [Google Scholar]
- [31].Cantone M, Santos G, Wentker P, Lai X, Vera J, Multiplicity of Mathematical Modeling Strategies to Search for Molecular and Cellular Insights into Bacteria Lung Infection, Frontiers in Physiology 8 (2017). URL: http://journal.frontiersin.org/article/10.3389/fphys.2017.00645/full. doi: 10.3389/fphys.2017.00645. [DOI] [PMC free article] [PubMed] [Google Scholar]
- [32].Du SQ, Yuan W, Mathematical modeling of interaction between innate and adaptive immune responses in COVID-19 and implications for viral pathogenesis, Journal of Medical Virology 92 (2020) 1615–1628. URL: https://onlinelibrary.wiley.com/doi/abs/10.1002/jmv.25866. doi: 10.1002/jmv.25866, [DOI] [PMC free article] [PubMed] [Google Scholar]
- [33].Hernandez-Vargas EA, Velasco-Hernandez JX, In-host Mathematical Modelling of COVID-19 in Humans, Annual Reviews in Control 50 (2020) 448–456. URL: http://www.sciencedirect.com/science/article/pii/S1367578820300638. doi: 10.1016/j.arcontrol.2020.09.006. [DOI] [PMC free article] [PubMed] [Google Scholar]
- [34].Peter S, Dittrich P, Ibrahim B, Structure and Hierarchy of SARS-CoV-2 Infection Dynamics Models Revealed by Reaction Network Analysis, Viruses 13 (2021)14. URL: https://www.mdpi.com/1999-4915/13/1/14. doi: 10.3390/v13010014, number: 1 Publisher: Multidisciplinary Digital Publishing Institute. [DOI] [PMC free article] [PubMed] [Google Scholar]
- [35].Brown BN, Price IM, Toapanta FR, DeAlmeida DR, Wiley CA, Ross TM, Oury TD, Vodovotz Y, An Agent-Based Model of Inflammation and Fibrosis Following Particulate Exposure in the Lung, Mathematical Biosciences 231 (2011) 186–196. URL: http://www.sciencedirect.com/science/article/pii/S0025556411000356. doi: 10.1016/j.mbs.2011.03.005. [DOI] [PMC free article] [PubMed] [Google Scholar]
- [36].Chernyavsky IL, Croisier H, Chapman LAC, Kimpton LS, Hiorns JE, Brook BS, Jensen OE, Billington CK, Hall IP, Johnson SR, The Role of Inflammation Resolution Speed in Airway Smooth Muscle Mass Accumulation in Asthma: Insight from a Theoretical Model, PLOS ONE 9 (2014) e90162. URL: http://journals.plos.org/plosone/article?id=10.1371/journal.pone.0090162. doi: 10.1371/journal.pone.0090162. [DOI] [PMC free article] [PubMed] [Google Scholar]
- [37].Golov A, Simakov S, Soe YN, Pryamonosov R, Mynbaev O, Kholodov A, Multiscale CT-Based Computational Modeling of Alveolar Gas Exchange during Artificial Lung Ventilation, Cluster (Biot) and Periodic (Cheyne-Stokes) Breathings and Bronchial Asthma Attack, Computation 5 (2017) 11. URL: http://www.mdpi.com/2079-3197/5/1/11. doi: 10.3390/computation5010011. [DOI] [Google Scholar]
- [38].Pothen JJ, Poynter ME, Bates JHT, A Computational Model of Unresolved Allergic Inflammation in Chronic Asthma, American Journal of Physiology - Lung Cellular and Molecular Physiology 308 (2015) L384–L390. URL: http://ajplung.physiology.org.proxy.library.vcu.edu/content/308/4/L384. doi: 10.1152/ajplung.00268.2014. [DOI] [PMC free article] [PubMed] [Google Scholar]
- [39].Reynolds A, Bard Ermentrout G, Clermont G, A Mathematical Model of Pulmonary Gas Exchange Under Inflammatory Stress, Journal of Theoretical Biology 264 (2010) 161–173. URL: http://www.sciencedirect.com/science/article/pii/S0022519310000159. doi: 10.1016/j.jtbi.2010.01.011. [DOI] [PMC free article] [PubMed] [Google Scholar]
- [40].Minucci SB, Heise RL, Reynolds AM, Review of Mathematical Modeling of the Inflammatory Response in Lung Infections and Injuries, Frontiers in Applied Mathematics and Statistics 6 (2020). URL: https://www.frontiersin.org/articles/10.3389/fams.2020.00036/full. doi: 10.3389/fams.2020.00036, publisher: Frontiers. [DOI] [Google Scholar]
- [41].Bates JHT, Irvin CG, Time dependence of recruitment and derecruitment in the lung: a theoretical model, Journal of Applied Physiology 93 (2002) 705–713. URL: https://journals.physiology.org/doi/full/10.1152/japplphysiol.01274.2001. doi: 10.1152/japplphysiol.01274.2001, publisher: American Physiological Society. [DOI] [PubMed] [Google Scholar]
- [42].Crooke PS, Marini JJ, Hotchkiss JR, A new look at the stress index for lung injury, Journal of Biological Systems 13 (2005) 261–272. URL: https://www.worldscientific.com/doi/abs/10.1142/S0218339005001549. doi: 10.1142/S0218339005001549, publisher: World Scientific Publishing Co. [DOI] [Google Scholar]
- [43].Hamlington KL, Smith BJ, Allen GB, Bates JHT, Predicting ventilator-induced lung injury using a lung injury cost function, Journal of Applied Physiology 121 (2016) 106–114. URL: https://journals.physiology.org/doi/full/10.1152/japplphysiol.00096.2016. doi: 10.1152/japplphysiol.00096.2016, publisher: American Physiological Society. [DOI] [PMC free article] [PubMed] [Google Scholar]
- [44].Kim J, Heise RL, Reynolds AM, Pidaparti RM, Quantification of Age-Related Lung Tissue Mechanics under Mechanical Ventilation, Medical Sciences 5 (2017) 21. URL: https://www.mdpi.com/2076-3271/5/4/21. doi: 10.3390/medsci5040021, number: 4 Publisher: Multidisciplinary Digital Publishing Institute. [DOI] [PMC free article] [PubMed] [Google Scholar]
- [45].Kretschmer J, Schranz C, Knöbel C, Wingender J, Koch E, Möller K, Efficient computation of interacting model systems, Journal of Biomedical Informatics 46 (2013) 401–409. URL: http://www.sciencedirect.com/science/article/pii/S1532046413000178. doi: 10.1016/j.jbi.2013.01.004. [DOI] [PubMed] [Google Scholar]
- [46].Marini JJ, Crooke PS, Truwit JD, Determinants and Limits of Pressure-Preset Ventilation: a Mathematical Model of Pressure Control, Journal of Applied Physiology 67 (1989) 1081–1092. URL: http://jap.physiology.org.proxy.library.vcu.edu/content/67/3/1081. [DOI] [PubMed] [Google Scholar]
- [47].Pidaparti RM, Burnette M, Heise RL, Reynolds A, Analysis for Stress Environment in the Alveolar Sac Model, Journal of biomedical science and engineering 6 (2013) 901–907. URL: http://www.ncbi.nlm.nih.gov/pmc/articles/PMC4057278/. doi: 10.4236/jbise.2013.69110. [DOI] [PMC free article] [PubMed] [Google Scholar]
- [48].Rahaman U, Mathematics of Ventilator-induced Lung Injury, Indian Journal of Critical Care Medicine 21 (2017) 521–524. URL: https://europepmc.org/article/pmc/pmc5588487. doi: 10.4103/ijccm.ijccm_411_16. [DOI] [PMC free article] [PubMed] [Google Scholar]
- [49].Stewart PS, Jensen OE, Patterns of recruitment and injury in a heterogeneous airway network model, Journal of The Royal Society Interface 12 (2015) 20150523. URL: https://royalsocietypublishing.org/doi/full/10.1098/rsif.2015.0523. doi: 10.1098/rsif.2015.0523, publisher: Royal Society. [DOI] [PMC free article] [PubMed] [Google Scholar]
- [50].Aghasafari P, Bin I Ibrahim M, Pidaparti R, Strain-induced inflammation in pulmonary alveolar tissue due to mechanical ventilation, Biomechanics and Modeling in Mechanobiology 16 (2017) 1103–1118. URL: 10.1007/s10237-017-0879-5. doi: 10.1007/s10237-017-0879-5. [DOI] [PubMed] [Google Scholar]
- [51].Kim J, Heise RL, Reynolds AM, Pidaparti RM, Aging effects on airflow dynamics and lung function in human bronchioles, PloS One 12 (2017) e0183654. doi: 10.1371/journal.pone.0183654. [DOI] [PMC free article] [PubMed] [Google Scholar]
- [52].Ibrahim IBM, Pidaparti RM, Ward KR, Evaluation of Ventilation-Induced Lung Inflammation Through Multi-Scale Simulations, IEEE Journal of Translational Engineering in Health and Medicine 6 (2018) 1–7. doi: 10.1109/JTEHM.2018.2795031, conference Name: IEEE Journal of Translational Engineering in Health and Medicine. [DOI] [PMC free article] [PubMed] [Google Scholar]
- [53].Posta F, Chou T, A mathematical model of intercellular signaling during epithelial wound healing, Journal of Theoretical Biology 266 (2010) 70–78. URL: http://www.sciencedirect.com/science/article/pii/S0022519310002729. doi: 10.1016/j.jtbi.2010.05.029. [DOI] [PMC free article] [PubMed] [Google Scholar]
- [54].Domínguez-Hüttinger E, Boon NJ, Clarke TB, Tanaka RJ, Mathematical Modeling of Streptococcus pneumoniae Colonization, Invasive Infection and Treatment, Frontiers in Physiology 8 (2017). URL: https://www.ncbi.nlm.nih.gov/pmc/articles/PMC5332394/. doi: 10.3389/fphys.2017.00115. [DOI] [PMC free article] [PubMed] [Google Scholar]
- [55].Mitchell H, Levin D, Forrest S, Beauchemin CAA, Tipper J, Knight J, Donart N, Layton RC, Pyles J, Gao P, Harrod KS, Perelson AS, Koster F, Higher Level of Replication Efficiency of 2009 (H1N1) Pandemic Influenza Virus than Those of Seasonal and Avian Strains: Kinetics from Epithelial Cell Culture and Computational Modeling, Journal of Virology 85 (2011) 1125–1135. URL: https://www.ncbi.nlm.nih.gov/pmc/articles/PMC3019989/. doi: 10.1128/JVI.01722-10. [DOI] [PMC free article] [PubMed] [Google Scholar]
- [56].Smallwood R, Computational modeling of epithelial tissues, WIREs Systems Biology and Medicine 1 (2009) 191–201. URL: https://onlinelibrary.wiley.com/doi/abs/10.1002/wsbm.18. doi: 10.1002/wsbm.18. [DOI] [PubMed] [Google Scholar]
- [57].Van Liedekerke P, Palm MM, Jagiella N, Drasdo D, Simulating tissue mechanics with agent-based models: concepts, perspectives and some novel results, Computational Particle Mechanics 2 (2015) 401–444. URL: http://adsabs.harvard.edu/abs/2015CPM…..2..401V.doi: 10.1007/s40571-015-0082-3. [DOI] [Google Scholar]
- [58].Frank AS, Larripa K, Ryu H, Snodgrass RG, Röblitz S, Bifurcation and sensitivity analysis reveal key drivers of multistability in a model of macrophage polarization, Journal of Theoretical Biology 509 (2021) 110511. URL: http://www.sciencedirect.com/science/article/pii/S0022519320303660. doi: 10.1016/j.jtbi.2020.110511. [DOI] [PubMed] [Google Scholar]
- [59].Maiti S, Dai W, Alaniz RC, Hahn J, Jayaraman A, Mathematical Modeling of Pro- and Anti-Inflammatory Signaling in Macrophages, Processes 3 (2014) 1–18. URL: http://www.mdpi.com/2227-9717/3/1/1. doi: 10.3390/pr3010001. [DOI] [Google Scholar]
- [60].Nickaeen N, Ghaisari J, Heiner M, Moein S, Gheisari Y, Agent-based modeling and bifurcation analysis reveal mechanisms of macrophage polarization and phenotype pattern distribution, Scientific Reports 9 (2019) 12764. URL: https://www.nature.com/articles/s41598-019-48865-z. doi: 10.1038/s41598-019-48865-z, number: 1 Publisher: Nature Publishing Group. [DOI] [PMC free article] [PubMed] [Google Scholar]
- [61].Smith TD, Tse MJ, Read EL, Liu WF, Regulation of macrophage polarization and plasticity by complex activation signals, Integrative Biology 8 (2016) 946–955. URL: 10.1039/c6ib00105j. doi: 10.1039/c6ib00105j. [DOI] [PMC free article] [PubMed] [Google Scholar]
- [62].Zhao C, Mirando AC, Sové RJ, Medeiros TX, Annex BH, Popel AS, A mechanistic integrative computational model of macrophage polarization: Implications in human pathophysiology, PLOS Computational Biology 15 (2019) e1007468. URL: https://journals.plos.org/ploscompbiol/article?id=10.1371/journal.pcbi.1007468 doi: 10.1371/journal.pcbi.1007468, publisher: Public Library of Science. [DOI] [PMC free article] [PubMed] [Google Scholar]
- [63].Wang Y, Yang T, Ma Y, Halade GV, Zhang J, Lindsey ML, Jin Y-F, Mathematical modeling and stability analysis of macrophage activation in left ventricular remodeling post-myocardial infarction, BMC Genomics 13 (2012) S21. URL: 10.1186/1471-2164-13-S6-S21. doi: 10.1186/1471-2164-13-S6-S21. [DOI] [PMC free article] [PubMed] [Google Scholar]
- [64].Day J, Friedman A, Schlesinger LS, Modeling the Immune Rheostat of Macrophages in the Lung in Response to Infection, Proceedings of the National Academy of Sciences 106 (2009) 11246–11251. URL: http://www.pnas.org.proxy.library.vcu.edu/content/106/27/11246. doi: 10.1073/pnas.0904846106. [DOI] [PMC free article] [PubMed] [Google Scholar]
- [65].Louzoun Y, Xue C, Lesinski GB, Friedman A, A mathematical model for pancreatic cancer growth and treatments, Journal of Theoretical Biology 351 (2014) 74–82. URL: http://www.sciencedirect.com/science/article/pii/S0022519314001039. doi: 10.1016/j.jtbi.2014.02.028. [DOI] [PMC free article] [PubMed] [Google Scholar]
- [66].Dunster JL, The macrophage and its role in inflammation and tissue repair: mathematical and systems biology approaches, WIREs Systems Biology and Medicine 8 (2016) 87–99. URL: https://onlinelibrary.wiley.com/doi/abs/10.1002/wsbm.1320. doi: 10.1002/wsbm.1320, [DOI] [PubMed] [Google Scholar]
- [67].Jansen JE, Gaffney EA, Wagg J, Coles MC, Combining Mathematical Models With Experimentation to Drive Novel Mechanistic Insights Into Macrophage Function, Frontiers in Immunology 10 (2019). URL: https://www.frontiersin.org/articles/10.3389/fimmu.2019.01283/full#F1. doi: 10.3389/fimmu.2019.01283, publisher: Frontiers. [DOI] [PMC free article] [PubMed] [Google Scholar]
- [68].Marino S, Hogue IB, Ray CJ, Kirschner DE, A methodology for performing global uncertainty and sensitivity analysis in systems biology, Journal of Theoretical Biology 254 (2008) 178–196. URL: http://www.sciencedirect.com/science/article/pii/S0022519308001896. doi: 10.1016/j.jtbi.2008.04.011. [DOI] [PMC free article] [PubMed] [Google Scholar]
- [69].Mathew S, Bartels J, Banerjee I, Vodovotz Y, Global sensitivity analysis of a mathematical model of acute inflammation identifies nonlinear dependence of cumulative tissue damage on host interleukin-6 responses, Journal of Theoretical Biology 358 (2014) 132–148. URL: https://www.sciencedirect.com/science/article/pii/S0022519314003191. doi: 10.1016/j.jtbi.2014.05.036. [DOI] [PMC free article] [PubMed] [Google Scholar]
- [70].Tanaka RJ, Ono M, Harrington HA, Skin Barrier Homeostasis in Atopic Dermatitis: Feedback Regulation of Kallikrein Activity, PLOS ONE 6 (2011) e19895. URL: http://journals.plos.org/plosone/article?id=10.1371/journal.pone.0019895. doi: 10.1371/journal.pone.0019895, publisher: Public Library of Science. [DOI] [PMC free article] [PubMed] [Google Scholar]
- [71].Wu P, Zhao H, Dynamics of an HIV Infection Model with Two Infection Routes and Evolutionary Competition between Two Viral Strains, Applied Mathematical Modelling 84 (2020) 240–264. URL: https://www.sciencedirect.com/science/article/pii/S0307904X20301748. doi: 10.1016/j.apm.2020.03.040. [DOI] [Google Scholar]
- [72].Young D, Stark J, Kirschner D, Systems biology of persistent infection: tuberculosis as a case study, Nature Reviews Microbiology 6 (2008) 520–528. URL: https://www.nature.com/articles/nrmicro1919. doi: 10.1038/nrmicro1919, number: 7 Publisher: Nature Publishing Group. [DOI] [PubMed] [Google Scholar]
- [73].Dolinay T, Himes BE, Shumyatcher M, Lawrence GG, Margulies SS, Integrated Stress Response Mediates Epithelial Injury in Mechanical Ventilation, American Journal of Respiratory Cell and Molecular Biology 57 (2017) 193–203. URL: http://www.atsjournals.org/doi/full/10.1165/rcmb.2016-0404OC. doi: 10.1165/rcmb.2016-0404OC, publisher: American Thoracic Society - AJRCMB. [DOI] [PMC free article] [PubMed] [Google Scholar]
- [74].Ware LB, Matthay MA, The Acute Respiratory Distress Syndrome, New England Journal of Medicine 342 (2000) 1334–1349. URL: 10.1056/NEJM200005043421806. doi: 10.1056/NEJM200005043421806. [DOI] [PubMed] [Google Scholar]
- [75].Crosby LM, Waters CM, Epithelial Repair Mechanisms in the Lung, American Journal of Physiology-Lung Cellular and Molecular Physiology 298 (2010) L715–L731. URL: http://www.physiology.org/doi/abs/10.1152/ajplung.00361.2009. doi: 10.1152/ajplung.00361.2009. [DOI] [PMC free article] [PubMed] [Google Scholar]
- [76].Gardner A, Borthwick LA, Fisher AJ, Lung Epithelial Wound Healing in Health and Disease, Expert Review of Respiratory Medicine 4 (2010) 647–660. URL: 10.1586/ers.10.62. doi: 10.1586/ers.10.62. [DOI] [PubMed] [Google Scholar]
- [77].Herold S, Mayer K, Lohmeyer J, Acute Lung Injury: How Macrophages Orchestrate Resolution of Inflammation and Tissue Repair, Frontiers in Immunology 2 (2011). URL: https://www.ncbi.nlm.nih.gov/pmc/articles/PMC3342347/. doi: 10.3389/fimmu.2011.00065. [DOI] [PMC free article] [PubMed] [Google Scholar]
- [78].Gordon S, Alternative Activation of Macrophages, Nature Reviews Immunology 3 (2003) 23–35. URL: http://www.nature.com/articles/nri978. doi: 10.1038/nri978. [DOI] [PubMed] [Google Scholar]
- [79].Robb CT, Regan KH, Dorward DA, Rossi AG, Key Mechanisms Governing Resolution of Lung Inflammation, Seminars in Immunopathology 38 (2016) 425–448. URL: https://link-springer-com.proxy.library.vcu.edu/article/10.1007/s00281-016-0560-6 doi: 10.1007/s00281-016-0560-6. [DOI] [PMC free article] [PubMed] [Google Scholar]
- [80].Aggarwal NR, King LS, D’Alessio FR, Diverse Macrophage Populations Mediate Acute Lung Inflammation and Resolution, American Journal of Physiology-Lung Cellular and Molecular Physiology 306 (2014) L709–L725. URL: http://www.physiology.org/doi/abs/10.1152/ajplung.00341.2013. doi: 10.1152/ajplung.00341.2013. [DOI] [PMC free article] [PubMed] [Google Scholar]
- [81].Kumar V, Sharma A, Neutrophils: Cinderella of Innate Immune System, International Immunopharmacology 10 (2010) 1325–1334. URL: http://www.sciencedirect.com/science/article/pii/S1567576910002663. doi: 10.1016/j.intimp.2010.08.012. [DOI] [PubMed] [Google Scholar]
- [82].Nathan C, Neutrophils and Immunity: Challenges and Opportunities, Nature Reviews Immunology 6 (2006) 173–182. URL: https://www.nature.com/articles/nri1785. doi: 10.1038/nri1785. [DOI] [PubMed] [Google Scholar]
- [83].Johnston LK, Rims CR, Gill SE, McGuire JK, Manicone AM, Pulmonary Macrophage Subpopulations in the Induction and Resolution of Acute Lung Injury, American Journal of Respiratory Cell and Molecular Biology (2012). URL: http://www.atsjournals.org/doi/abs/10.1165/rcmb.2012-0090OC. doi: 10.1165/rcmb.2012-0090OC. [DOI] [PMC free article] [PubMed] [Google Scholar]
- [84].Summers C, Rankin SM, Condliffe AM, Singh N, Peters AM, Chilvers ER, Neutrophil Kinetics in Health and Disease, Trends in Immunology 31 (2010) 318–324. URL: http://www.sciencedirect.com/science/article/pii/S147149061000075X. doi: 10.1016/j.it.2010.05.006. [DOI] [PMC free article] [PubMed] [Google Scholar]
- [85].Bezel P, Valaperti A, Steiner U, Scholtze D, Wieser S, Vonow-Eisenring M, Widmer A, Kowalski B, Kohler M, Franzen DP, Evaluation of cytokines in the tumor microenvironment of lung cancer using bronchoalveolar lavage fluid analysis, Cancer immunology, immunotherapy: CII (2021). doi: 10.1007/s00262-020-02798-z. [DOI] [PMC free article] [PubMed] [Google Scholar]
- [86].Valaperti A, Bezel P, Vonow-Eisenring M, Franzen D, Steiner UC, Variability of cytokine concentration in whole blood serum and bronchoalveolar lavage over time, Cytokine 123 (2019) 154768. URL: https://www.sciencedirect.com/science/article/pii/S1043466619301978. doi: 10.1016/j.cyto.2019.154768. [DOI] [PubMed] [Google Scholar]
- [87].Opal SM, DePalo VA, Anti-inflammatory cytokines, Chest 117 (2000) 1162–1172. [DOI] [PubMed] [Google Scholar]
- [88].Vlahakis NE, Schroeder MA, Limper AH, Hubmayr RD, Stretch Induces Cytokine Release by Alveolar Epithelial Cells in Vitro, American Journal of Physiology-Lung Cellular and Molecular Physiology 277 (1999) L167–L173. URL: http://www.physiology.org/doi/abs/10.1152/ajplung.1999.277.1.L167. doi: 10.1152/ajplung.1999.277.1.L167. [DOI] [PubMed] [Google Scholar]
- [89].Heusinkveld M, d. V. v. Steenwijk PJ, Goedemans R, Ramwadhdoebe TH, Gorter A, Welters MJP, Hall T. v., v. d. Burg SH, M2 Macrophages Induced by Prostaglandin E2 and IL-6 from Cervical Carcinoma Are Switched to Activated M1 Macrophages by CD4+ Th1 Cells, The Journal of Immunology 187 (2011) 1157–1165. URL: http://www.jimmunol.org/content/187/3/1157. doi: 10.4049/jimmunol.1100889. [DOI] [PubMed] [Google Scholar]
- [90].Soehnlein O, Lindbom L, Phagocyte partnership during the onset and resolution of inflammation, Nature Reviews Immunology 10 (2010) 427–439. URL: https://www.nature.com/articles/nri2779. doi: 10.1038/nri2779. [DOI] [PubMed] [Google Scholar]
- [91].Quesnel C, Nardelli L, Piednoir P, Leçon V, Marchal-Somme J, Lasocki S, Bouadma L, Philip I, Soler P, Crestani B, Dehoux M, Alveolar fibroblasts in acute lung injury: biological behaviour and clinical relevance, European Respiratory Journal 35 (2010) 1312–1321. URL: http://erj.ersjournals.com/content/35/6/1312. doi: 10.1183/09031936.00074709, publisher: European Respiratory Society Section: Original Articles: Critical care and lung injury. [DOI] [PubMed] [Google Scholar]
- [92].McKay MD, Beckman RJ, Conover WJ, Comparison of Three Methods for Selecting Values of Input Variables in the Analysis of Output from a Computer Code, Technometrics 21 (1979) 239–245. doi: 10.1080/00401706.1979.10489755. [DOI] [Google Scholar]
- [93].Kirschner DE, Matlab Functions for PRCC and eFAST, 2008. URL: http://malthus.micro.med.umich.edu/lab/usadata/.
- [94].Smith LS, Gharib SA, Frevert CW, Martin TR, Effects of Age on the Synergistic Interactions between Lipopolysaccharide and Mechanical Ventilation in Mice, American Journal of Respiratory Cell and Molecular Biology 43 (2010) 475–486. URL: https://www.atsjournals.org/doi/full/10.1165/rcmb.2009-0039OC. doi: 10.1165/rcmb.2009-0039OC, publisher: American Thoracic Society - AJRCMB. [DOI] [PMC free article] [PubMed] [Google Scholar]
- [95].Wolthuis EK, Vlaar AP, Choi G, Roelofs JJ, Juffermans NP, Schultz MJ, Mechanical ventilation using non-injurious ventilation settings causes lung injury in the absence of pre-existing lung injury in healthy mice, Critical Care 13 (2009) R1. URL: 10.1186/cc7688. doi: 10.1186/cc7688. [DOI] [PMC free article] [PubMed] [Google Scholar]
- [96].Le J, Decision Trees in R, 2018. URL: https://www.datacamp.com/community/tutorials/decision-trees-R. [Google Scholar]
- [97].Liaw A, Wiener M, Classification and Regression by randomForest, 2002. [Google Scholar]
- [98].Archer KJ, Kimes RV, Empirical characterization of random forest variable importance measures, Computational Statistics & Data Analysis 52 (2008) 2249–2260. URL: http://www.sciencedirect.com/science/article/pii/S0167947307003076. doi: 10.1016/j.csda.2007.08.015. [DOI] [Google Scholar]
- [99].Pham T, Brochard LJ, Slutsky AS, Mechanical Ventilation: State of the Art, Mayo Clinic Proceedings 92 (2017) 1382–1400. URL: http://www.sciencedirect.com/science/article/pii/S0025619617303245. doi: 10.1016/j.mayocp.2017.05.004. [DOI] [PubMed] [Google Scholar]
- [100].McKight PE, Najab J, Kruskal-Wallis Test, in: The Corsini Encyclopedia of Psychology, American Cancer Society, 2010, pp. 1–1. URL: https://onlinelibrary.wiley.com/doi/abs/10.1002/9780470479216.corpsy0491. doi: 10.1002/9780470479216.corpsy0491. [DOI] [Google Scholar]
- [101].Benjamini Y, Hochberg Y, Controlling the false discovery rate: a practical and powerful approach to multiple testing, Journal of the Royal statistical society: series B (Methodological) 57 (1995) 289–300. [Google Scholar]
- [102].Brandenberger C, Mühlfeld C, Mechanisms of lung aging, Cell and Tissue Research 367 (2017) 469–480. URL: 10.1007/s00441-016-2511-x. doi: 10.1007/s00441-016-2511-x. [DOI] [PubMed] [Google Scholar]
- [103].Cruz RS, Villarejo F, Figueroa A, Cortés-Jofré M, Gagliardi J, Navarrete M, Mortality in Critically Ill Elderly Individuals Receiving Mechanical Ventilation, Respiratory Care 64 (2019) 473–483. URL: http://rc.rcjournal.com/content/64/4/473. doi: 10.4187/respcare.06586, publisher: Respiratory Care Section: Systematic Review. [DOI] [PubMed] [Google Scholar]
- [104].Sison SM, Sivakumar GK, Caufield-Noll C, Greenough WB, Oh ES, Galiatsatos P, Mortality outcomes of patients on chronic mechanical ventilation in different care settings: A systematic review, Heliyon 7 (2021) e06230. URL: https://www.sciencedirect.com/science/article/pii/S2405844021003352. doi: 10.1016/j.heliyon.2021.e06230. [DOI] [PMC free article] [PubMed] [Google Scholar]
- [105].Rentzsch I, Santos CL, Huhle R, Ferreira JMC, Koch T, Schnabel C, Koch E, Pelosi P, Rocco PRM, d. Abreu MG, Variable stretch reduces the pro-inflammatory response of alveolar epithelial cells, PLOS ONE 12 (2017) e0182369. URL: http://journals.plos.org/plosone/article?id=10.1371/journal.pone.0182369. doi: 10.1371/journal.pone.0182369, publisher: Public Library of Science. [DOI] [PMC free article] [PubMed] [Google Scholar]
- [106].Tremblay LN, Miatto D, Hamid Q, Govindarajan A, Slutsky AS, Injurious ventilation induces widespread pulmonary epithelial expression of tumor necrosis factor- and interleukin-6messenger RNA, Critical Care Medicine 30 (2002) 1693–1700. URL: http://journals.lww.com/ccmjournal/Fulltext/2002/08000/Injurious_ventilation_induces [DOI] [PubMed] [Google Scholar]
- [107].Wilson MR, O’Dea KP, Zhang D, Shearman AD, van Rooijen N, Takata M, Role of Lung-marginated Monocytes in an In Vivo Mouse Model of Ventilator-induced Lung Injury, American Journal of Respiratory and Critical Care Medicine 179 (2009) 914–922. URL: http://www.atsjournals.org/doi/full/10.1164/rccm.200806-877OC. doi: 10.1164/rccm.200806-877OC, publisher: American Thoracic Society - AJRCCM. [DOI] [PMC free article] [PubMed] [Google Scholar]
- [108].Valentine MS, Link PA, Herbert JA, Kamga Gninzeko FJ, Schneck MB, Shankar K, Nkwocha J, Reynolds AM, Heise RL, Inflammation and Monocyte Recruitment Due to Aging and Mechanical Stretch in Alveolar Epithelium are Inhibited by the Molecular Chaperone 4-Phenylbutyrate, Cellular and Molecular Bioengineering 11 (2018) 495–508. URL: 10.1007/s12195-018-0537-8. doi: 10.1007/s12195-018-0537-8. [DOI] [PMC free article] [PubMed] [Google Scholar]
Associated Data
This section collects any data citations, data availability statements, or supplementary materials included in this article.


