

Summary
Severe acute respiratory syndrome coronavirus 2 (SARS-CoV-2), a positive single-stranded RNA virus, causes the coronavirus disease 19 pandemic. During the viral replication and transcription, the RNA-dependent RNA polymerase “jumps” along the genome template, resulting in discontinuous negative-stranded transcripts. Although the sense-mRNA architectures of SARS-CoV-2 were reported, its negative strand was unexplored. Here, we deeply sequenced both strands of RNA and found SARS-CoV-2 transcription is strongly biased to form the sense strand with variable transcription efficiency for different genes. During negative strand synthesis, numerous non-canonical fusion transcripts are also formed, driven by 3-15 nt sequence homology scattered along the genome but more prone to be inhibited by SARS-CoV-2 RNA polymerase inhibitor remdesivir. The drug also represses more of the negative than the positive strand synthesis as supported by a mathematic simulation model and experimental quantifications. Overall, this study opens new sights into SARS-CoV-2 biogenesis and may facilitate the antiviral vaccine development and drug design.
Subject areas: virology, mathematical biosciences, systems biology
Graphical abstract
Highlights
-
•
SARS-CoV-2 transcription is much less efficient for negative strand
-
•
3-15 nt sequence homology drives RdRp jumping during negative strand synthesis
-
•
Remdesivir inhibits more of negative strand and non-canonical fusion transcripts
-
•
A mathematic model built to simulate strand-biased transcription and drug effect
Virology; Mathematical biosciences; Systems biology
Introduction
Severe acute respiratory syndrome coronavirus 2 (SARS-CoV-2), an enveloped betacoronavirus of family Coronaviridae with a positive-sense, single-stranded RNA genome of ∼30 kb, causes the coronavirus disease 19 (COVID-19) pandemic with unprecedented health and socio-economic crisis (Zhou et al., 2020; Zhu et al., 2020). It has been widely spread on four continents during the past seven months, leading to more than 116 million people infected and more than 2.6 million death (as of early March, 2021, www.who.int) (Dong et al., 2020). Comparing with other diseases caused by coronaviruses, e.g. SARS-CoV and Middle East respiratory syndrome coronavirus, SARS-CoV-2 spreads more efficiently while has a lower disease case fatality ratio (CFR, estimated to be ∼2.2%) based on global confirmed cases (Dong et al., 2020; Gates, 2020). Deep elucidation of the replication and transcription mechanisms of the virus could contribute to the understanding of COVID-19 pathogenesis and hence to the hunt for efficient vaccines and medications with vital importance.
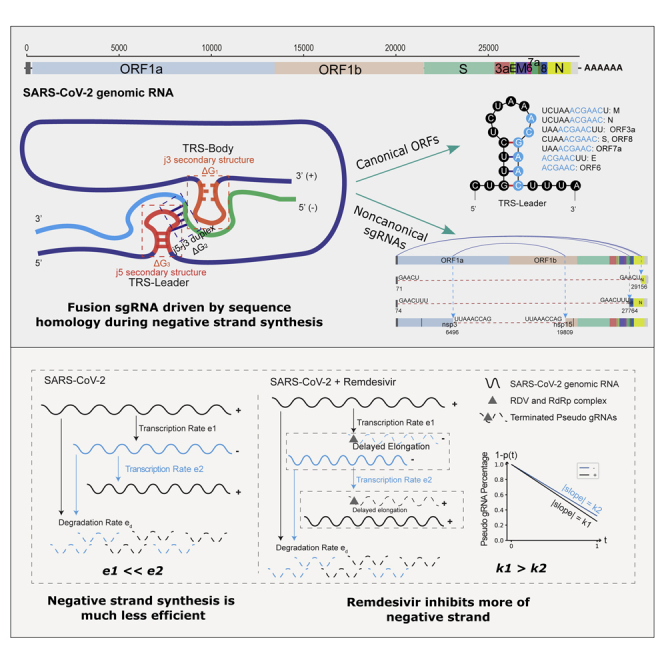
Upon the pandemic outbreak, scientists from different countries had collaboratively revealed and quickly shared the genome and transcriptome structures of the new virus (Chan et al., 2020; Davidson et al., 2020; Kim et al., 2020; Nomburg et al., 2020; Taiaroa et al., 2020; Wu et al., 2020a), as well as host transcriptome responses (Blanco-Melo et al., 2020). Similar to other coronavirus (Fehr and Perlman, 2015), SARS-CoV-2 genome encodes 14 open-reading frames (ORFs): ORF1a and ORF1b which occupy two-thirds of the genome from 5′-end, four ORFs named by the structure proteins they translated (S (spike), E (envelope), M (membrane), and N (nucleocapsid) proteins), as well as nine ORFs (ORF3a, 3b, 6, 7a, 7b, 8, 9a, 9b, 10) reported to code for accessory factors (Chan et al., 2020; Fehr and Perlman, 2015; Wu et al., 2020b). ORF1a and ORF1b are translated into 16 non-structural proteins (nsp1-nsp16) which form the replicase-transcriptase complex, including the nsp12-encoded RNA-dependent RNA polymerase (RdRp) that is essential to the virus replication. The translation of ORF1ab begins as virus genome is released into host cells. All the other ORFs, which are discontinuous transcripts fused between the common 5’ “Leader”, a ∼70nt region lies on the very beginning of SARS-CoV-2 genome, and the region of transcription starting sites of each gene body, have a different transcription and translation process. According to the prevailing model for other coronaviruses, RdRp happens to pause when it crosses a transcription-regulatory sequence (TRS) which contains a 6-nt core sequence (CS), ACGAAC, in the body (TRS-B) during the synthesis of negative strand and switches the template to the TRS in the leader (TRS-L), which results in discontinuous transcription leading to the leader-body fusion (Kim et al., 2020; Sola et al., 2015; van Marle et al., 1999; Zuniga et al., 2004). From the fused negative strand intermediates, positive strand sub-genomic mRNAs (sgmRNAs) are transcribed and further translated into structure and regulatory proteins, which are essential to the life cycle of virus and the interaction with host cells. Eight positive strand discontinuous transcripts (S, ORF3a, E, M, ORF6, 7a, 7b, 8, N) had been detected on SARS-CoV-2, and the existence of ORF10 was suspected (Davidson et al., 2020; Kim et al., 2020; Taiaroa et al., 2020). Despite of the sgmRNAs, the full-length genomic RNA is replicated simultaneously (Figure 1A).
Figure 1.

Genome structure, coverages, and statistical analysis of junctions
(A) Genome structure of SARS-CoV-2, and the schematic presentation of the syntheses of nested sgRNAs. The polymerase “jumping” happens during negative strand synthesis using genome RNA as template. The resulted fusion transcripts serve as the templates for synthesizing the sense strand sgRNA continuously.
(B) Mapping ratio of each sequenced sample. The sequencing strategy and drug treatment information are labeled. Sequencing depth was shown as y axis and the ratios of reads unmapped and mapped to virus and host were listed on the stacked bars.
(C) Genome-wide coverage of read counts from Poly(A) mRNA and rRNA-depleted RNA sequencing data. Three subplots from up to bottom are (1) the coverage of sense strand RNA from Poly(A) mRNA seq of all samples with and without RDV treatment, (2) the coverage of both sense and anti-sense strand RNAs from rRNA-depleted RNA-seq of virus-treated samples, and (3) of both virus plus RDV-treated. All biological replicates were plotted. De-duplicated coverages were scaled to log10 and shown as y axis (See also Figure S3A for down-sampling).
Of note, all the previous studies investigated only the sense strand genomic and sub-genomic transcripts of SARS-CoV-2, whereas the negative anti-sense strand RNAs have not been explored yet. It is unclear whether and to what extent the discontinuous transcriptions are formed during the negative strand synthesis of the new virus. In a recent paper, the negative strand coronaviral RNA was found functionally relevant to the activation of host innate immune responses through the cleavage of their 5′-end polyuridine (polyU) sequences mediated by highly conserved viral endoribonuclease nsp15 (Hackbart et al., 2020). Although the study was done on beta-CoV mouse hepatitis virus (MHV-A59) and the alpha-CoV porcine epidemic diarrhea virus, the nsp15 is highly conserved for all coronaviruses including SARS-CoV-2. Earlier studies also show that the negative strand RNA can form long double-stranded RNA (dsRNA) intermediates, which may act as pathogen-associated molecular patterns recognized by cytoplasmic pattern recognition receptors (PRRs) such as MDA5 to activate innate immune responses (Kang et al., 2002; Kato et al., 2006; Sethna et al., 1991). Several clinical investigations also demonstrated the tight connection of host immune responses to the pathological severity of COVID-19 patients (Braun et al., 2020; Chua et al., 2020; Schulte-Schrepping et al., 2020). Altogether, it requires for a deep investigation of the negative strand RNAs of SARS-CoV-2 that are essential for understanding its replication, transcription, and the interaction with the host.
So far, there is no officially approved chemical therapeutics to combat SARS-CoV-2 infection on clinic, except the FDA authorized emergency use of remdesivir (RDV). RDV is a phosphoramidate prodrug of a 1′-cyano-substituted adenosine nucleotide analog targeting on the viral RdRp (Agostini et al., 2018; Siegel et al., 2017). Its broad-spectrum antiviral effectiveness against SARS-CoV-2 and related coronaviruses has been supported by in vitro and in vivo models. In one recent in vitro study (Wang et al., 2020), the antiviral activity of RDV against SARS-CoV-2 in African Green Monkey kidney cells (Vero E6) was assessed by monitoring the viral copy numbers within the cells via RT-qPCR quantification. This study demonstrated an effective inhibition of RDV at IC50 of 770 nM and IC90 of 1,760 nM (with cytotoxic concentration >100 mM). In addition, works by Sheahan et al. and de Wit et al. (de Wit et al., 2020; Sheahan et al., 2020) demonstrated in vivo efficacy of RDV on related coronaviruses in terms of the inhibition of viral replication and the reduction of virus-related pathology. Recent in vitro studies using polymerase extension assays plus cryo-electron microscopy structure analyses (Gordon et al., 2020; Shannon et al., 2020; Yin et al., 2020) also revealed the active metabolite of RDV, [Remdesivir triphosphate (RTP)] is covalently incorporated into the RdRp/RNA complex and terminates the elongation of replicating chain due to the modified ribose 1′-CN group, which may account for the increased antiviral effect compared to other available nucleotide analogs for SARS-CoV-2. Such functional machinery should in principle work for both sense and anti-sense strands synthesis, an issue yet unexplored.
In this study, we performed deep analyses on both poly(A) mRNA and ribosomal RNA (rRNA) depleted total RNA in order to characterize the fine transcriptional features of both sense and anti-sense RNA strands of SARS-CoV-2. The transcriptional process of the new coronavirus appeared to be strongly biased with high efficiency for the production of sense strand. Nevertheless, during the negative strand synthesis (Figure 1A), the template shifting events due to RdRp “jumping” happen with extremely high frequency and noise, driven by different lengths of common sequences universally appearing along the genome. The transcription efficiency, as well as the contents of common sequences vary for different viral genes. Furthermore, we investigated the transcriptional inhibitory patterns of RDV and found that RDV treatment efficiently reduced the transcriptional jumping noise. In the context of strand specificity, we found that RDV clearly terminates more on the negative strand synthesis of both genome RNA (gRNA) and sub-genome RNAs (sgRNAs), a phenomenon supported by computational simulation model and experimental quantification. Our data opens new sights into the replication and of transcription process of SARS-CoV-2 and may also for a better understanding of the host responses.
Results
The SARS-CoV-2 strain originally isolated from a COVID-19 patient in Guangzhou, China (Accession numbers: MT123290) was used to infect two groups of Vero E6 cells, with and without RDV treatment. Each group was set with three biological replicates and the total RNAs were individually extracted from each sample at 24 hr post infection (24hpi) and subjected to Poly(A) RNA-enriched and rRNA-depleted library constructions before deeply sequenced on Illumina Novaseq system, respectively.
In average, we obtained around 50–125 million total reads per sample with approximately 81% mapped to SARS-CoV-2 in non-RDV-treated samples while only up to 11% in RDV-treated samples, indicating a fast replication rate of the virus strain and a strong inhibitory effect of RDV (Figure 1B). Using even unique-mappable reads, SARS-CoV-2 genome was averagely covered for over 30 thousand times in Poly(A) RNA-seq results and above 1000 times in RDV-treated samples. In rRNA-depleted RNA-seq, both positive and negative strand RNAs could be detected with obvious low coverages for negative strand reads. The lowest coverage appeared to be negative strand RNAs in RDV-treated samples with nevertheless still above 100 times. The detailed coverages along virus genome in all samples were shown on Figure 1C. Given by the extremely high coverage, Poly(A) RNA-seq data provide more accurate quantification of mature sgRNAs, allowing for a careful glance at canonical and non-canonical sgRNA distribution. In the meantime, rRNA-depleted RNA-seq reads provide us valuable information on the strand-specific RNA synthesis patterns including mature and pre-mature RNAs that were not yet investigated for SARS-CoV-2.
SARS-CoV-2 exerts high noise of transcriptional “jumping” that is more prone to remdesivir inhibition
Various discontinuous transcription events, an event due to the virus RNA polymerase “jumping” onto another region of RNA template, have been reported in previous study, including TRS-L-dependent jumping of 10 x canonical ORFs, TRS-L-dependent in-frame and out frame non-canonical, and TRSL-independent non-canonical jumping events (Kim et al., 2020). However, the information on their frequencies, stabilities, and reproducibility are still lacking. Benefit from high sequencing depth and biological replicates of our poly(A) RNA-seq data, we firstly verified the existence of non-classic transcripts among different samples. To reduce the PCR amplification redundancy likely due to the high titer of virus in the sample (81% of total RNA), we removed redundant reads and used uniquely mapped reads for following analyses. The junction-spanning reads were extracted to identify the 5′and 3′ breakage sites (defined as “junction events”) followed by counting the total junction reads covering each site.
Interestingly, we detected approximately 100 thousand types of junction events among this tiny genome in virus-treated samples but only 3.4% of total events were shared by three replicates (namely “Triple events”). However, this very small percentage of events (with the absolute number of 9701) occupied 47.5% of total nonredundant read counts (Figures 2A and 2C), among which more than half of the reads covered the TRS-L-dependent canonical ORF junctions (Figure 2D). The other 96.6% fusion events were shared by only 2 biological replicates (“Double” events, Figure 2E) or single sample (“Single” event, Figure 2F). However, their read counts occupied 52.5% (only 10.3% for “Double” events and 42.2% for “Single” events) (Figure 2A) of all nonredundant reads, nearly all of which are TRS-L-independent non-canonical junctions (Figure 2C). The pairwise correlation analyses among biological replicates demonstrated the high reproducibility of viral canonical junction reads (Figure 2A) (as well as the reads mapped to the host genome (Figure S1). The correlation of the large number of non-canonical junctions, even reproducibly occurring (“Triple” group), were generally decreased, likely due to their reduced abundances (Figure 2A). Besides, the density plots of the non-canonical junctions with different reproducibility pointed out the majority of non-canonical junctions as extremely diverse but random events (Figures S1A–S1F). Even if biologically true instead of technical noises, they would be less likely functional compared to the highly reproducible and abundant ones.
Figure 2.

SARS-CoV-2 exerts high noise of transcriptional “jumping” that is more prone to Remdesivir inhibition
(A) Venn diagram of all junction events in three replicates from Poly(A) mRNA sequencing data of SARS-CoV-2 treated samples. Junction events were defined as “#j5-#j3” positions. The barplot shows percentage of events and counts of “Triple” (overlapped by three replicates), “Double” (overlapped by two replicates), “Single” (occurred in one replicate). Paired scatterplots depicted the correlation of “Triple” events between replicates. Canonical and non-canonical event were plotted by different colors. Junction events in three replicates show pretty high coincidence.
(B) Percentage of positive strand canonical and non-canonical junctions of virus and virus remdesivir (RDV)-treated samples. Non-canonical events are categorized into different groups according to TRS-L dependency, translation potential, and the distance of jumping. RDV severely reduces the non-canonical polymerase jumping events. The error bars refer to 95% confidence intervals of SD.
(C) Reads distribution of each category of junction events among three sets (Triple, Double, and Single) (See also Figure S1).
(D–F) Genome view of the breakage sites of the most abundant discontinuous fusion events representative of each category on positive strand in the virus-treated samples (See also Figure S2 for positive strand junctions in virus and RDV-treated samples and junctions on negative strands), for the Triple events (D), Double events (E), and Single events (F). In D–F, the category pattens from up to bottom are (1) Canonical sgmRNA genes mediated by TRS-L and TRS-B; (2) TRS-L-dependent non-canonical fusion between the TRS-L and a non-canonical 3′ site in the body. (3) TRS-L-independent distal fusion. (4) TRS-L-independent local joining yielding a deletion between proximal sites. The events in blue line above the genome bar are the events in-fame with corresponding mRNA genes, whereas those underneath in red are frame-shifted. (TRSL-can, TRS-L-dependent canonical junction; TRSL-noncan-inframe, TRS-L-dependent non-canonical junction with inframe protein production; TRSL-noncan-outframe, TRS-L-dependent non-canonical junctions with out-of-frame protein production; distal inframe, distal junctions (>5,000nt) with inframe protein production; distal-outframe, distal junctions with out-of-frame protein production; proximal inframe, proximal junctions (20–5,000nt distance) with inframe protein production, proximal outframe, proximal junctions with out-of-frame protein production; TRSl-tr, TRS-L-dependent junction with truncated protein productions; TRSL-np, TRSL-ouframe; D-np, distal-outframe, D-fusion, distal inframe; P-np, proximal outframe; P-fusion, proximal inframe.)
We therefore focused only on the reproducible “Triple” events and took a close look at their fine features. The conserved TRS-L/TRS-B jointing events of ORFs dominate the “Triple” events with the highest relative abundance for N gene, followed by 7a, M, 3a, S, 8, 6, E, and 7b (Figures 2B and 2C), a similar pattern as ever reported (Davidson et al., 2020; Kim et al., 2020; Taiaroa et al., 2020). However, this does not necessarily reflect the de novo proportions of the ORF abundances in the cell nor indicates a stronger functional importance of N-gene over the others, given by the fact that RNA-seq does have systematic preference/bias in quantifying different DNA/RNA regions with diverse sequences, particularly for short regions. There was no junction detected for ORF10 in all samples, which may be due to the fact that ORF10 lacks the TRS-B CS. Since ORF10 is the last ORF to the 3′ end of the genome, covered by all the SARS-CoV-2 mRNAs, its expression cannot be excluded solely based on the absence of junction reads. Nevertheless, the previous studies (Davidson et al., 2020; Kim et al., 2020; Taiaroa et al., 2020) using direct Nanopore sequencing technique did not tracked its expression either. Together, we support the idea to reannotate the transcriptome without ORF10.
Apart from canonical sub-genome mRNA (sgmRNA) transcripts, there were large number (over 9000) of reproducible non-canonical “Triple” events also detected (Figures 2A and 2C). Notably, a small half of the reads also contained TRS-L at the 5′-spanning ends. Unlike sgmRNAs, the 3′ junction sites, on the other hand, were barely residing on the 5′-UTR of the ORF, but all from gene bodies of 1a, 1b, S, 7a, and N, in the case of frame-shifted jumping transcripts. Interestingly, the in-frame transcripts were formed only between TRS-L and two narrow regions in the body of 7a/7b and N, with the high abundance between 500–1000 reads (Figure 2D). The resulted proteins are truncated N and truncated ORF7b (Figure 4F). This cluster of TRS-L-dependent non-canonical transcripts showed similar pattern to previous study (Kim et al., 2020) even though different virus strains were analyzed. In the other big half of “Triple” junction events independent from TRS-L, most of transcripts were fused from long distance, and less than one-third were formed within a local region (Figure 2D). Interestingly, in both in-frame and out-of-frame distal fusion transcripts, the 5′- and 3′′-junction sites covered a small number of breakage “hot spots” on the virus genome. The 5′-break points were dominantly residing at 2 hotspot regions within ORF1a, followed by a spot close to the beginning of Spike gene. The 3′-break points located exclusively at far 3′-end of the viral genome before ORF7b, except one case breaking in ORF1b (Figure 2D). Note that this abundant in-fame joint mRNA between ORF1a and 1b may form a fusion protein consisting truncated nsp3 linked directly to truncated nsp15. Again, N gene is the prominent region to be broken and joined mainly to the 5′-end hot spot of the genome (Figures 2B and 2D, detailed structure of examples are presented in Figure 4F and Tables S1 and S2). The existence of junction hotspots along the virus genome implies possible sequence- and/or structure-dependent regulatory roles to guide the polymerase jumping. Detailed information of the junctions is listed in Tables S1 and S2 for all samples. The abundant and reproducible non-canonical fusion sgRNAs can exert certain biological functions based on their sequence similarity to viral mRNAs, despite of large or small deletions. A well-studied group is called defective interfering (DI) RNAs (DI-RNAs) or particles (DIPs). In both plants and animals, DI-RNAs/DIPs have shown to be able to activate immune responses and suppress virus replication cycles through for example competing for viral replication regulators, impeding the packaging, release and invasion of viruses (Pathak and Nagy, 2009; Yang et al., 2019). A very recent study using single-cell technology uncovered the role of DIPs of influenza A virus (IAV) affecting the large cell-to-cell heterogeneity in the viral replication (Kupke et al., 2020). The discontinuous RNAs that are found to appear frequently at the jumping “hotspots” in this study are certainly worthy of further functional validations. Nevertheless, we should not exclude the systematic technical artifacts originating from RNA-seq procedures, which can also be highly reproducible.
Figure 4.

Discontinuous transcription is sequence-driven and structure-relevant
(A) Description of analytic scheme of common sequence (co-sequence) shared by 5′ and -3′ junction regions (30nt). ‘nchar’ represents the number of bases in co-sequence.
(B) Common sequences and secondary structure of TRS-L for eight mRNA genes. The co-sequences of TRS-L range from 6nt to 12nt for different gene, consisting the core sequence ACGAAC (highlighted in blue) shared by all.
(C) Relationship between fused counts and length of co-sequences for TRSL-canonical mRNAs (light green) and non-canonical transcripts (dark green) for Triple, Double, and Single event groups (See also Figure S4).
(D) Schematic model of negative strand sgRNA formation within the spatial complex of RNA secondary structures. A successful synthesis of negative strand sgRNA requires (1) unwinding of the hairpin structure at TRS-Body to allow the polymerase to move through, (2) complementary-driven formation of RNA duplex between nascent negative strand and TRS-Leader template, (3) unwinding of the hairpin structure at TRS-Leader for the polymerase to complete the full transcript.
(E) Predicted duplex of the sense strand of TRSL and the anti-sense strand of TRSB, as well as the predicted secondary structure of the sense strand of TRSB, for gene M and E. The free energy (ΔG value) of the structure indicates their stability.
(F). Three examples of non-canonical in-frame fusion RNAs occurred in all three replicates. Their junction sites with co-sequences and resulted truncated proteins are also listed.
We next performed the same analyses on the virus transcriptome data under the perturbation of the most promising anti-COVID drug RDV. As aforementioned, RDV, an inhibitor of viral RdRp enzyme, significantly slowed down the virus replication rate from 81% to 11% of the total reads that can be mapped to virus genome within 24 hr. Despite of the much fewer total viral read counts achieved in RDV samples, the categories and the fine patterns of discontinuous transcripts stay the same (Figures S2A–S2C). However, the relative abundance of non-canonical junction reads was heavily reduced by RDV and in-return the percentage of each canonical ORF increased dramatically (Figures 2B, S2D, and S2E). The same reduction pattern of RDV was also observed by subsampling analyses when the mapped viral reads of all the samples were down-sampled to the same level through random reads picking (Figure S3F). One possible reason is that the non-canonical junction events are stochastic transcription errors during negative strand sgRNA synthesis, which could be of lower chance to occur when the overall transcription speed is slowed down by RDV. Since the viral RNA abundance in RDV samples is vastly less, more complicated causes could also exist in the divergent host responses in response to RDV and subsequently different viral titers, involving for example the different RNA-bind proteins. As recently being demonstrated, over 200 RBPs display differential interaction with RNA upon SINV infection, which is mainly driven by the loss of cellular mRNAs and the emergence of viral RNA (Garcia-Moreno et al., 2019). The altered RBPs are reported crucial for viral infection efficacy, some of which might be functionally more relevant to the non-canonical jumping.
In conclusion, our deep analyses on discontinuous transcripts confirmed the canonical TRS-medicated template switching as the mode of transcription for annotated SARS-CoV-2 ORFs, and also observed poor reproducibility of non-canonical junctions, which can be largely reduced by RdRp inhibitor RDV.
SARS-CoV-2 sgRNA synthesis is highly efficient but heavily strand-biased, with variable transcription efficiency for different genes
It has been formally demonstrated that the step of discontinuous transcription occurs during the synthesis of negative strand sgRNAs in coronaviruses (Sola et al., 2015; Zuniga et al., 2004) and arteriviruses (Pasternak et al., 2001; van Marle et al., 1999) by incorporating strand-specific mutations in the TRS-L and TRS-B sequences. But it has not been experimentally examined for SARS-CoV-2. Previous studies that all utilized poly(A) RNA-seq strategy had provided the first-hand information on the transcriptome architectures. However, with the absence of negative strand sequences, it was not possible to confirm the “transcriptional jumping” events along with anti-sense synthesis nor to evaluate the transcription efficiencies for each transcript. To answer these questions, we re-sequenced the total RNAs from virus infected cells with and without RDV treatment (two replicates for each condition) using rRNA-depleted RNA-seq strategy. We quantified the junction-spanning reads of rRNA-depleted RNA-seq data on positive and negative strands separately.
Overall, there are extremely more fusion event species on positive sgRNAs than on negative ones (∼40 times more in positive strand) and only 247 events appeared in both (Figure 3A (Venn diagram)), which however occupied large proportion of junction read counts (51.7% of positive and 79.2% of negative strands). This could be resulted from the fact that one copy of negative strand RNA intermediates can be repeatedly templated for the transcription of multiple copies of sense sgRNA, and thus the overall abundance of negative strands can be much lower. Nevertheless, to further demonstrate the influence of the sequencing depth, we gave a pseudo count to the missing strand for each strand-specific event and plotted the log2 scaled counts of both strands on the density scatterplot (Figure 3B). The junction events with only one negative strand count were defined as sample A, and the junction events with pseudo negative strand counts as sample B (Figure 3B). If sense strand sgRNAs are transcribed from anti-sense ones, sample B should have similar sense strand coverage distribution with sample A based on the assumption that events in A and B share the same transcription efficiency distribution. Two-sample Kolmogorov-Smirnov test was performed with the null hypothesis “sample A and B obey the same distribution” and the alternative hypothesis that “accumulative distribution function of A lies above that of B”. The p value came out to equal 1.00, which means we can accept the hypothesis with high confidence. This result illustrated the overall positive strand counts in sample B is smaller than that in sample A, so the negative strand counts of events in sample B were assumed to be smaller than one, which was too few to be sequenced. From this aspect, we conclude that the anti-sense sgRNA synthesis involves a step of template shifting and is far less efficient than sense sgRNA transcription.
Figure 3.

SARS-CoV-2 sgRNA synthesis is highly efficient but heavily strand-biased
(A) Venn diagram of positive and negative strand junction events in virus-treated sample.
(B) Density plot of the read counts of positive and negative strand junction events. Dashed rectangles defined events with one negative strand read count as ‘Sample A’, positive strand specific events (given pseudo negative strand read counts as 0.5) as ‘Sample B’.
(C) Percentage of sgRNA patterns on positive strand from rRNA-depleted RNA sequencing data.
(D) Percentage of sgRNA patterns on negative strand from rRNA-depleted RNA sequencing data (See also Figure S3) (Error bars in panel C and D refer to 95% confidence intervals of standard derivation (SD)).
(E and F) Transcription efficiency (calculated by the positive strand reads divided by the negative strand read numbers) of ORFs in non-RDV-treated and RDV-treated samples. The x axis of subplot E is the CPM of negative strand sgRNAs. Note that RDV inhibits more of the negative strand RNAs and the transcription efficiency appear to be improved for all 8 genes. Error bars in F represent SD.
We next thought to compare the strand-biased transcription levels for each canonical sgRNA and non-canonical events. The non-canonical sgRNAs were grouped into categories as discussed in the Poly(A) RNA-seq result (Figure 2A). The relative abundance of each ORF and non-canonical category within each sample was plotted as percentile for positive and negative strands, respectively (Figures 3C and 3D). The overall expression pattern of sense sgRNAs in rRNA-depleted sequencing data looks similar to Poly(A) RNA-seq with the highest expression for N gene and in the non-canonical part, for the category of “TRSL-np” (TRS-L-independent distal frame-shifted events) (Figures 2A and 3C). Interestingly, the negative strand abundance of M gene outnumbers all the other ORFs and non-canonical categories (Figure 3D), indicating variable sgRNA transcription rates for different genes. We then defined the “transcription efficiency” as the ratio of junction reads mapped on sense strand to anti-sense strand, indicating the copies of functional mRNA transcripts that can be synthesized per each intermediate negative strand RNA. Among the canonical sgRNA ORFs, S renders the highest transcription efficiency, followed by ORF8, N, E, ORF6, ORF7a, ORF3a and M (Figures 3E and 3F). Even the least efficient M can achieve ∼15 times of sense sgRNAs from one single anti-sense template in average, suggesting high producibility of SARS-CoV-2 mRNA synthesis. The transcription efficiencies with the negative strand read count for each gene were plotted in Figure 3E. Notably, the antiviral prodrug RDV seems improving the transcription efficiency of all genes (Figures 3E and 3F, further discussed in the last section).
Apart from serving as templates for mRNA synthesis, the direct function of negative strand RNAs was recently reported. In both the beta-CoV MHV-A59 and the alpha-CoV PEDV, the viral endoribonuclease (EndoU) encoded by nsp15 was found to cleave polyU sequences from 5′-polyU-containing negative-sense (PUN) RNAs. On the other hand, the catalytic-inactive EndoU resulted in the accumulation of long length of PUN RNAs, which generated stem-loop structures by hybridizing with an A/G-rich domain located within the PUN RNA or on adjacent RNAs. This stem-loop structure may be recognized as dsRNA by the PRRs of the host cell, thus stimulating a robust, MDA5-dependent interferon response (Hackbart et al., 2020). In our negative strand data, we did not observe the existence of PUN RNAs, likely because of very low read counts were mapped to both ends of the RNA transcripts, an intrinsic characteristic of rRNA-depleted library construction protocol. Interestingly, as aforementioned, a nsp3-nsp15 fusion transcript was found with significant abundance, resulting in N-terminal 62-aa truncation of the protein product (Figure 4F). Since the endoribonuclease catalytic domain was not disrupted, whether the retained EndoU renders improved or deteriorated polyU cleavage function needs further experimental evaluation, which in return could point out its relationship with host immune responses. Our first-hand sequencing data of both RNA strands can be valuable resources to pinpoint the dsRNA hybrids, which may emerge as a new mechanism for SARS-CoV-2 pathogenesis.
Discontinuous transcription is sequence-driven and structure-relevant
It is widely accepted that for coronavirus the transcription process of canonical sgRNA involves the polymerase “jumping” mediated by TRS-L and TRS-B, both of which contain several identical “CS”. CS with 6-7nt in length was thought to be the driving force to bring the 5′-end TRS-L into the close proximity of the TRS-B preceding each gene, where the CS in the leader (CS-L) can be base-paired with the nascent negative strand complementary to each CS-B (cCS-B) of the gene (Alonso et al., 2002; Zuniga et al., 2004). Same as SARS-CoV, 6-nt “ACGAAC” was computationally predicted as the conserved CS linking leader region to all the SARS-CoV-2 ORFs except ORF10. This was true when we searched the common sequences shared within the flanking region defined as 15nt up- and downstream region to the 5′ and 3′ junction sites for each junction event detected from Poly(A) sequencing data (Figure 4A). Moreover, apart from “ACGAAC”, we found TRS-L shared different length of common sequences (co-sequences) between 6 and 12nt with TRS-B of different genes (Figures 4B and 4C). For example, the co-sequences shared by TRS-leader and M is 12nt; for N and ORF3a are 11nt, respectively. This phenomenon was ever reported for SARS-CoV (Thiel et al., 2003), where the extended co-sequences for each ORF are overall consistent to our findings, except of one nucleotide difference with ORF7 (AAACGAAC) and with ORF8 (UCUAAACGAAC) of SARS-CoV.
For non-canonical sgRNAs, some of them are consistently formed in all three replicates and occupied high coverages which totally hold up to ∼50% percent reads among all “Triple” events (Figures 2B–2D). Formation of these junctions was thought to be driven by an unclear mechanism because of the absence of “ACGAAC” CS (Kim et al., 2020). To investigate this question, we searched for the co-sequences and visualized the relationship between co-sequence lengths and RNA abundances of all transcription jumping events in three groups (Triple, Double, and Single) (Figure 4C). Three abundant fusion transcripts were shown as examples with different co-sequence contents (Figure 4F). For almost all the events, there are at least 3nt co-sequences shared by the 5′ and 3′ junction sites. The length of co-sequences can be up to 15nt long with majority below 10nt, indicating the polymerase jumping occurs at the sites with sequence complementarity between sense RNA template and intermediate anti-sense RNA products, a mechanism similar to canonical sgRNA even though the large proportion of non-canonical events are randomly triggered along the compact genome. Most of them may be erroneous with no functions and eventually decayed with limited reproducibility among replicates as reflected in ‘Double’ and ‘Single’ groups of events. Also, we should not exclude them from the amplification artifacts during sequencing library construction. Nevertheless, the biological function of individual abundant and reproducible non-canonical jumping sgRNAs should not be omitted and the contribution of co-sequences are also worth careful inspection. The similar pattern of co-sequences for both canonical and non-canonical fusion transcripts were also observed for the positive strand in rRNA-depleted data with or without RDV inhibition, whereas for negative strand, the co-sequence analyses could not be convincingly fulfilled due to too few read counts (Figure S4).
There has been debates about the relationship between sgRNA abundances and TRS-L/TRS-B shared sequence contents. Some studies stated that the co-sequence length determined RNA abundance, while some argued their direct relationship for a number of coronaviruses (Thiel et al., 2003). For SARS-CoV-2, the second speculation is more proper, as we saw for example, sgRNA abundance of the conserved Triple junction events with 8nt co-sequences is larger than those with 9, 10, 11 and 12nt co-sequences (Figure 4A). Beyond the sequence length, the stability (free energy, ) of the extended duplex of TRS-L and the complement of the TRS-B (cTRS-B) (Pasternak et al., 2003; Sola et al., 2005), as well as the hairpin structures present in the TRS-L region (Nagy and Simon, 1997) were thought to be crucial regulatory factors for the synthesis of sgmRNAs. In transmissible gastroenteritis virus (TGEV), the most abundant sgmRNA, i.e. the N gene, was reported to render low value for TRS-L–TRS-B duplex formation (Moreno et al., 2008). Through secondary structure analysis of the TRS-L region from TGEV (Dufour et al., 2011) and bovine coronavirus (BCoV) (Chang et al., 1996), the CS-L is found to be exposed in the loop of a structured hairpin functionally relevant for replication and transcription (Dufour et al., 2011).
Considering the fact that the TRS-Body region must serve as the single-strand RNA template for RdRp complex to move along during the synthesis of complementary negative strand, we speculated a more complex model, that the secondary structures of CS-B in their flanking regions may also influence the sgRNA levels, apart from the hairpin structure surrounding the CS-L and the duplex between CS-L and the nascent complement of CS-B (cCS-B) (Figure 4D). For the canonical ORFs with the same TRS-L situation, we supposed the gene with stronger CS-L/cCS-B complementarity and weaker secondary structure at TRS-B junction site to have higher sgRNA abundance, since it costs less energy to unwind the TRS-B hairpin, allowing the polymerase to move on and subsequently to form a more stable CS-L/cCS-B duplex (Figure 4D). We predicted the secondary structures of TRS-L and TRS-B on positive strand, respectively, and calculated the free energy of these secondary structures and the duplex between sense strand TRS-L and anti-sense strand TRS-B. For each ORF, the total free energy ΔG was calculated by the energy of CS-L/cCS-B duplex () subtracted by those of TRS-B () and TRS-L () (Figure 4D), i.e. . According to the resulted ΔG, the eight ORFs fall into 3 categories with M, ORF8 and N genes in the group of highest stability, gene E as the most unstable one, and the other 4 genes in the middle range with minor energy difference. We also ranked the genes according to their reads number of negative strands considering that the polymerase “jumping” happening during the synthesis of negative strand instead of sense strand. Overall, the energy categories correlate with the abundance ranking except of ORF8 (Table 1). Specifically, the most abundant gene M renders the most stable 12-nt CS-L/cCS-B duplex with ΔG at −20.1 while a 4-nt hairpin loop at CS-B region with modest stability (ΔG at −2.9 kcal/mol); the least abundant gene E holds the most unstable second structure (ΔG = −9.7 kcal/mol) with only 8bp duplex whereas a relatively stable hairpin structure at CS-B region (ΔG at −3.5 kcal/mol), together resulting in the highest difficulty to fulfill the “jumping” transcription. Here we postulate a new model combining CS length and the secondary structures of both 5′- and 3′′-junctions, which could reflect the frequencies of discontinuous negative strand transcriptions for most of SARS-CoV-2 genes. However, it failed to fit with the non-classic junction events, where the abundances of jumping junctions are not concordant with the combined energy model. In our opinion, it is likely due to the high versatility of the 5′-junction locations in the genome, rather than being fixed at the narrow TRS-L region as seen for the eight sgRNA genes, which may complicate the entire spatial situation and hence lose the comparability among the non-classic jumping transcripts. Nevertheless, the possible unrevealed determinants may also exist and need further exploration.
Table 1.
Free energies of top 20 sgRNAs with the highest anti-sense strand abundance. The unit of values in clumns 3-6 is kcal/mol.
| Event | Name | G1(j5-j3-duplex) | G2(j3-secondary structure) | G3(j5-secondary structure) | G1-G2-G3 |
|---|---|---|---|---|---|
| 67-26470 | M | ΔG = −20.1 | ΔG = −2.90 | ΔG = −2.20 | −15 |
| 67-28257 | N | ΔG = −18.4 | ΔG = −4.20 | ΔG = −2.20 | −12 |
| 69-27387 | ORF7a | ΔG = −11.4 | ΔG = −0.70 | ΔG = −2.20 | −8.5 |
| 68-25383 | ORF3a | ΔG = −11.8 | ΔG = −1.00 | ΔG = −2.20 | −8.6 |
| 68-21554 | S | ΔG = −14.6 | ΔG = −3.10 | ΔG = −2.20 | −9.3 |
| 72-27043 | ORF6 | ΔG = −12.1 | ΔG = +0.20 | ΔG = −2.20 | −10.1 |
| 68-27886 | ORF8 | ΔG = −16.7 | ΔG = +0.20 | ΔG = −2.20 | −14.7 |
| 72-26239 | E | ΔG = −9.7 | ΔG = −3.50 | ΔG = −2.20 | −4 |
| 5119-17654 | ΔG = −7.8 | ΔG = −2.00 | ΔG = −10.60 | 4.8 | |
| 15696-25001 | ΔG = −8.2 | ΔG = −3.40 | ΔG = −2.70 | −2.1 | |
| 1134-1412 | ΔG = −5.8 | ΔG = −6.40 | ΔG = −5.50 | 4.9 | |
| 3171-22324 | ΔG = −13.3 | ΔG = −6.00 | ΔG = −3.60 | −3.7 | |
| 26196-26357 | ΔG = −5.5 | ΔG = −4.70 | ΔG = +0.60 | −1.4 | |
| 4397-28937 | ΔG = −17.0 | ΔG = −3.20 | ΔG = −6.20 | −7.6 | |
| 23613-23634 | ΔG = −11.3 | ΔG = −1.20 | ΔG = −3.30 | −6.8 | |
| 26782-26819 | ΔG = −12.7 | ΔG = −0.70 | ΔG = −4.00 | −8 | |
| 8413-8903 | ΔG = −4.8 | ΔG = −1.40 | ΔG = −7.20 | 3.8 | |
| 8792-28542 | ΔG = −9.0 | ΔG = −4.20 | ΔG = −3.40 | −1.4 | |
| 27266-27293 | ΔG = −8.1 | ΔG = −1.00 | ΔG = −4.20 | −2.9 | |
| 17656-22353 | ΔG = −9.3 | ΔG = −5.80 | ΔG = −2.00 | −1.5 |
Remdesivir inhibits more of negative strand RNA synthesis
Coinciding with previous studies (Eastman et al., 2020; Kim et al., 2020; Pruijssers et al., 2020), the RdRp inhibitory prodrug RDV severely inhibited replication of SARS-CoV-2. It reduced virus infection ratio from ∼81% to ∼11% of total Poly(A) RNA-seq reads mapped to virus genome (Figure 1C, Table S3), consistent with the quantified reduction of ORF1, S, E and N expressions by RT-qPCR (Figure 5E). Previous structural analyses have shown that RDV metabolized active triphosphate form RTP is covalently incorporated into the RdRp/RNA complex and terminates the replicating chain elongation (Yin et al., 2020), a functional machinery should work for both sense and anti-sense strand synthesis. Indeed, the coverage times of both strands of genome were significantly reduced (Figure 1C) as reflected by the much lower total viral reads and mapping rates (Figures 1B and 1C). At gene level, the normalized junction read counts were all heavily decreased for both strands of eight ORFs upon drug treatment, with however sharper decrease slopes for anti-sense strand (Figure 5A). The significance of the sharper decrease of anti-sense strand sgRNA was verified by Levene Test on the read counts of each sgRNA in four samples (two replicates of two experimental conditions), with the null hypothesis that they have same variances. The p values are very small (Table S4), suggesting a significant drop of negative strand counts in RDV-treated samples.
Figure 5.

Modeling the SARS-CoV-2 transcription process and RDV effect on different strands
(A) Canonical splicing counts of positive and negative strands in virus and virus RDV-treated samples. Blue and black points represent counts of negative and positive strand sgRNAs, respectively. Note that there are double y axes in subplots, where the left one is for positive strand sgRNAs and the right for negative ones. Read counts in Log2 scale (See also Figure S3G) (The error bars refer to 95% confidence intervals of SD).
(B) Description of simulation modeling. Different transcription rates were set for positive gRNAs and negative gRNAs. Degradation rates of both strands are supposed to be the same. For RDV-treated samples, drug concentration-relevant parameters were set to define the proportion of pseudo terminated nascent gRNAs on both strands. T, the function was shown as the line chart. Proportion of pseudo terminated nascent gRNAs decreases with time.
(C) Simulation results. The curve chart describes the simulated gRNA accumulation in SARS-CoV-2 infected sample.
(D) The chart shows simulation result of virus RDV-treated sample.
(E) RT-qPCR quantification of the positive strand expression level of ORF1ab, S, E, and M at different hours post viral infection with and without the RDV perturbation.
(F) RT-qPCR quantification of the positive and negative strand copies of ORF1ab, S, and N. RDV has a stronger inhibition effect on negative strand RNAs than positive ones. Error bars represent SD.
It seems RDV has different inhibition effects on sense and anti-sense sgRNAs and gRNAs. To verify this speculation, we built up an ordinary differential equation (ODE) based model to mimic the accumulation process of sense and anti-sense gRNAs in RDV-treated and non-treated samples. In this model, we set the transcription rate from sense gRNA to anti-sense gRNA as , the rate from anti-sense strand gRNA to sense gRNA as , both sense and anti-sense strand gRNA degradation rate as . Then accumulation of gRNA in unit time could be calculated by nascent gRNAs minus decayed ones (Equation 1 in the STAR Methods). For accurate simulation of entire transcription process of a gene, all the reads within the whole region of the given gene must be counted. This excluded the second ORF, i.e. S gene, and all its downstream ORFs from direct simulation due to their tiled-up non-junction reads. We therefore used the reads within the 21kb of ORF1ab region, which represents the 2/3 of the entire genome RNA (gRNA) transcription and replication, for simulating the values of , and (details can be found in STAR Methods). The simulated accumulation curves of sense and anti-sense strand gRNAs are depicted on Figure 5C.
As for the simulation for both RDV and SARS-CoV-2 treated samples, we assumed the synthesis and degradation rates of gRNA (, and ) stay the same and introduced a parameter to represent the delayed chain elongation effect of RDV, where describes the percentage of real nascent gRNA counts at time . Since RDV concentration is pretty high comparing with the nucleotide triphosphate (NTP) in cells, we assumed RdRp would be totally inhibited by RDV at the very beginning, and then inhibition effect (terminated gRNAs) would gradually decrease along with the drop of RDV concentration over time by a linear mode, so the percentage of normal nascent gRNAs would gradually increase with time in a linear mode, , where is a constant. Using the parameter , we could evaluate the amount of normal nascent and terminated gRNAs at each time-step in a RDV-dose-dependent mode. Since we observed the ratio of sense and anti-sense gRNAs changed after RDV treatment, we defined different values (possibility to generate normal gRNAs) for sense () and anti-sense () gRNA synthesis processes. Figure 5B plots the curve of , i.e. the percentage of pseudo gRNAs. Solving the ODEs (Equation 4 in STAR Methods) defined by this problem, we have , which means a smaller probability to generate normal nascent gRNAs of anti-sense gRNAs, while having a larger possibility to generate early terminated RNAs due to RDV inhibition. The simulated curves for sense and anti-sense strand gRNA abundance are portrayed on Figure 5D.
The detailed description of equations can be found in STAR Methods. The simulation results show RDV has stronger inhibition effect on the process of anti-sense gRNAs synthesis than on sense strand ones. We also performed the strand-specific RT-qPCR quantification of ORF1, N, and S expression. The result also confirmed the stronger inhibition of RDV on both continuous and discontinuous transcription of negative strand (Figure 5F).
Considering that RDV functions as adenosine analog to terminate the RdRp extension, it is possible that its inhibition effect can be biased to the RNA strand with more A. By simply calculating the A-T percentage of SARS-CoV-2 genome, we found 2% of more T than A, meaning the reverse strand synthesis requires 2% more A incorporation as RdRp substrates, a process which can be more prone to be blocked by RDV. The additional cause for the strand-biased inhibition likely resides in the higher complexity of transcription process of negative strand. Unlike the continuous transcription of positive strand, the negative strand synthesis involves multiple regulatory steps including precise base-paring and template shifting, a finely controlled process which makes the entire process more sensitive to mutagens. Whether either or both of the assumptions hold true would need separate studies with profound efforts to validate.
Since RDV fails to inhibit the SARS-CoV-2 replication completely (Figure 5D), it is worth to examine the antiviral efficacy of other nucleoside/nucleotide particularly the UTP analogs such as 2′-fluoro-2′-methyl-UTP (the active triphosphate forms of Sofosbuvir, a clinically approved anti-hepatitis C virus drug). Sofosbuvir has shown to terminate SARS-CoV-2 RdRp elongation at different level at in vitro model of polymerase extension experiments (Chien et al., 2020). Its inhibition on SARS-CoV-2 replication were also reported on Huh-2 (human hepatoma-derived) and Calu-3 (Type II pneumocyte-derived) cells (Sacramento et al., 2020), as well as human brain organoids (Mesci et al., 2020). Another recent preprint publication also reported diverse in vitro incorporation abilities of different types of nucleotide analogs into SARS-CoV-2 RdRp including 2′-C-Methyl-GTP (Lu et al., 2020). The proportion of A, T, G, C in SARS-CoV-2 genome is 29.89%, 32.11%, 19.63%, and 18.37%, respectively; therefore it would be interesting to test different effective analogs on SARS-CoV-2 infected living cells and to see whether they also exert strand-biased inhibition. Theoretically, the combination of multiple types of nucleotide analogs can be of a better use for inhibiting both sense and anti-sense strand replication of SARS-CoV-2, which nevertheless needs experimental validation.
Discussion
Taken together, we performed deep analyses of both poly(A))-RNA-enriched and rRNA-depleted transcriptome of SARS-CoV-2 that are rapidly amplifying in Vero E6 cells or significantly delayed by antiviral prodrug RDV. Our results delineated several fine RNA features of SARS-CoV-2 sense and anti-sense transcriptome, demonstrating that the new coronavirus utilizes efficient RdRp complex for fast synthesis of sgRNAs, a process with high efficiency albeit erroneous and strand-biased. Despite CS in canonical junctions, the polymerase jumping in most non-canonical junctions also tends to be driven by sequence complementarity and noisily occur along the genome. Benefiting from triplicate design in our experiment, we observed a limited number of jumping “hotspots”, the fused transcripts which are abundant and reproducible, suggesting potential biological functions of these non-canonical junctions. We are the first to narrow down the candidate non-canonical junction sets and provide a candidate sheet for biologists to find fused frames worthy of further functional validations. The length and content of sequence complementarity together with the proximal and distal spatial environments can be complex determinants for the frequency of template shifting events. Altogether may result in diverse transcription efficiency for different viral ORFs. The noisy non-canonical transcription as well as the negative strand synthesis were more prone to RDV inhibition. To guarantee the observations are not due to the much-reduced total viral reads in RDV-treated samples, we performed down-sampling for all the corresponding analyses and the results showed the same patterns (Figure S3).
A mathematical model was also built and successfully simulated the accumulation of gRNAs of both strands before and after RDV treatment. The model also revealed that RDV has stronger inhibition effect on negative strand than on positive strand, possibly due to the 2.2% more A of incorporation and/or more complex regulatory process required for negative strand synthesis. Besides SARS-CoV-2 and RDV, our mathematical model can be utilized in other contexts to investigate and compare the transcriptional kinetics and patterns among all RNA-viruses and/or under any physiological/pathological/therapeutic conditions, as long as the sequencing data of both strands are available. Data from at least two different post infection stages are mandatory, since our simulation is based on transcriptional changes along time series. The more time stages, the more accuracy the simulation can achieve. In short, our algorithm can build up a viral transcriptional kinetics model for each infected condition, which, under proper experimental design, could help to (1) uncover the host or viral regulatory factors relating to virus transcription/replication; (2) evaluate the therapeutic strategies, e.g. drugs, antibodies, and any other types of medications, targeting on virus transcription/replication. Furthermore, simulating the replication and transcription processes of two different RNA-viruses would give a hint on the differences in their proliferation mechanisms, another promising utilization of our model in the field of RNA virology.
This study opens a new view on the SARS-CoV-2 transcriptional regulation and pave the way for further investigation of functional and pathological roles of its canonical and novel transcripts. The newly revealed transcriptional behavior of SARS-CoV-2 also renders a new perspective on therapeutic drug design to combat this life-threating pandemic.
Limitations of the study
This study only involves viral infected samples at 24hpi, which results in local optimization of the parameters in our ODEs based mathematical models. If at least two more time points are added, the optimization of parameters would be more accurate to mimic the transcriptional kinetics of SARS-CoV-2 and also the inhibitory effect of RDV.
STAR★Methods
Key resources table
| REAGENT or RESOURCE | SOURCE | IDENTIFIER |
|---|---|---|
| Chemicals, peptides, and recombinant proteins | ||
| Remdesivir | MedChemExpress (Monmouth Junction, NJ) | Cat#HY-104077 |
| TRIzol | Vazyme | Cat#R401-01 |
| Critical commercial assays | ||
| RT SuperMix Reagent Kit with gDNA Eraser | Vazyme | Cat#R223-01 |
| SYBR Green Master Mix | Yeasen | Cat#11201ES03 |
| Poly(A)-mRNA sequencing library preparation kit | Yeasen | Cat#12300ES96 |
| QIAseq FastSelect RNA removal kit | QIAGEN | Cat#THS-001Z-24 |
| rRNA-depleted strand-specific RNA-seq library construction protocol | QIAGEN | Cat#180743 |
| Fetal Bovine Sera | GIBCO | Cat#10270-106 |
| DMEM | Life | Cat#C11965500BT |
| Deposited data | ||
| All RNA sequencing data | This study | GSE160668 |
| Supplemental Datasets | This study | https://doi.org/10.17632/t2x5fdr2k4.2 |
| Experimental models: Cell lines | ||
| Vero E6 cells | African Green Monkey | ATCC® CRL 1586™ |
| Oligonucleotides | ||
| NIID_2019-nCOV_N_R2 | RT primer Reverse transcribe the plus strand RNA of the N gene |
TGGCACCTGTGTAGG TCAAC |
| MERCK-S-R2 | RT primer Reverse transcribe the plus strand RNA of the S gene |
ACACTGGTAGAATTTCTG TGGTAAC |
| RT-Leader-F | RT primer Reverse transcribe the minus strand RNA of the N AND S gene |
CAAACCAACCAACTTTCGA TCTCTTGTA |
| 2019-nCoV_N3-F | RT primer Reverse transcribe the minus strand RNA of the N gene |
GGGAGCCTTGAATACA CCAAAA |
| 2019-nCoV_N2-F | QPCR primer target N gene | TTACAAACATTGG CCGCAAA |
| 2019-nCoV_N2-R | QPCR primer target N gene | GCGCGACATTCCGAAGAA |
| MERCK-S-F | QPCR primer target S gene | CAGGTATATGCGCT AGTTATCAGAC |
| MERCK-S-R | QPCR primer target S gene | CCAAGTGACATAGTGTAG GCAATG |
| nCoV_IP4-14146Rv | RT primer Reverse transcribe the plus strand RNA of the 1ab gene |
CTGGTCAAGGTTA ATATAGG |
| nCoV_IP2-12669Fw | RT primer Reverse transcribe the minus strand RNA of the 1ab gene |
ATGAGCTTAGTCCTGTTG |
| ORF1ab-F | QPCR primer target 1ab gene | CCCTGTGGGTTTTACAC TTAA |
| ORF1ab-R | QPCR primer target 1ab gene | ACGATTGTGCATCAGCTGA |
| Software and algorithms | ||
| Prism 6 software | GraphPad | |
| STAR 2.7.1a | Dobin et al., 2013 | https://github.com/alexdobin/STAR |
| Picard toolkit v2.22.6 | Broad Institute | https://broadinstitute.github.io/picard/ |
| samtools v1.9 | https://github.com/samtools/samtools/releases/ | |
| Bedtools v2.28.0 | https://github.com/arq5x/bedtools2/releases | |
| MATLAB R2021a | MathWorks | https://www.mathworks.com/downloads |
| Other | ||
| SARS-COV-2 genome isolated from a COVID-19 patient in Guangzhou, China | GenBank: MT123290.1 | https://www.ncbi.nlm.nih.gov/nuccore/MT123290.1?report=fasta |
Resource availability
Lead contact
Further information and requests for resources and reagents should be directed to and will be fulfilled by the lead contact, Yuhui Hu (huyh@sustech.edu.cn).
Materials availability
This study did not generate new unique reagents.
Data availability
The RNA-seq data has been deposited into GEO and are publicly available as of the date of publication. Accession number is GSE160668. Additional Supplemental Items are available from Mendeley Data at https://doi.org/10.17632/t2x5fdr2k4.2 .
All original codes for the data processing and analyses has been deposited at GitHub and is available at https://github.com/choyeon1993/SARS-CoV-2-transcriptome as of the date of publication.
Any additional information required to reanalyze the data reported in this paper is available from the lead contact upon request.
Experimental model and subject details
Cells, virus and antivirals
Vero E6 cells (ATCC® CRL 1586™) were grown in Dulbecco’s modified Eagle’s medium (DMEM, Gibco) supplemented with 10% fetal bovine serum (FBS, Gibco) at 37 °C in a humidified atmosphere of 5% CO2. For virus infection, cells with 90% confluency in 12-well plates, were inoculated with the SARS-CoV-2 virus at a MOI of 0.05. One hour after incubation at 37 °C, cells were washed three times with phosphate buffered saline (PBS) followed by 24-hours incubation in the fresh normal culture medium with or without Remdesivir at 10 μM of final concentration.
Remdesivir (Cat. No. HY-104077) was purchased from MedChemExpress (Monmouth Junction, NJ). The SARS-CoV-2 strains used in this research were isolated from COVID-19 patients in Guangzhou (Accession numbers: MT123290), and passaged on Vero E6. All the experiments working with contagious SARS-CoV-2 were conducted in the Biosafety Level 3 (BSL3) Laboratories of Guangzhou Customs District Technology Center.
Method details
RNA extraction and quantitative real-time PCR (RT-qPCR)
Cultured cells were washed once with PBS before adding TRIzol (Vazyme, Cat no. R401-01). Total RNA extracted according to the manufacturer’s instructions. RNA was eluted in 20 μl RNase-free water. Purified total RNAs from non-infected and SARS-CoV-2-infected Vero cells were reverse transcribed using the RT SuperMix Reagent Kit with gDNA Eraser (Vazyme, Cat no. R223-01). Briefly, 1 μg total RNA was firstly digested with gDNA eraser to remove contaminated DNA and then the first-strand cDNA was synthesized in 20 μl reaction with Oligo (dT) or forward and reverse PCR primer for negative strand and positive strand-specific reverse transcription, respectively. Finally, 2 μl ten times diluted cDNA was used as template for quantitative PCR.
RT-qPCR was performed on CFX96 Real-time PCR system (Bio-Rad) with the SYBR Green Master Mix (Yeasen, Cat no. 11201ES03). The oligonucleotides used in this study are listed in Table S5. The PCR product was cloned into pUC19 vector and used as the plasmid standard after its identity was confirmed by sequencing. A standard curve was generated by the determination of copy numbers from serially dilutions (102-108 copies) of the plasmid. PCR amplification was performed as follows: 95 oC for 5 min followed by 40 cycles consisting of 95 oC for 10 s, 60 oC for 30 s. The viral RNA copies were calculated by excel and the figures were plotted by using GraphPad Prism 6 software.
Poly(A)-mRNA and rRNA-depleted total RNA sequencing
For Poly(A)-mRNA sequencing, 1ug of total RNA was used for library preparation following the manufacturer’s instruction (Yeasen, Cat no. 12300ES96) with adaptor (Yeasen, Cat no. 12613). For rRNA-depleted RNA-seq, the cytoplasmic and mitochondrial rRNA was firstly removed using QIAseq FastSelect RNA removal kit according to the manufacturer’s instructions (QIAGEN, Cat no. THS-001Z-24) followed by the strand-specific library construction protocol according to the manufacturer’s instruction (QIAGEN, Cat no. 180743). All the libraries were deeply sequenced on Illumina Novaseq system.
Quantification and statistical analysis
Sequence alignment
The sequenced reads of Vero-E6 cell lines were aligned to the ChlSab1.1 reference genomes respectively by using STAR 2.7.1a (Dobin et al., 2013). Reference genome was downloaded from htps://www.ensembl.org/info/data/ftp/index.html. Parameters “--outSAMtype BAM SortedByCoordinate --alignEndsType EndToEnd --outReadsUnmapped Fastx” were used during mapping. Unmapped reads were output as fastq files and then aligned to SARS-COV-2 genome, which was downloaded from https://www.ncbi.nlm.nih.gov/nuccore/MT123290.1?report=fasta, by STAR. In order to detect the canonical and non-canonical junction events in SARS-COV-2, “--outSAMtype BAM SortedByCoordinate –alignEndsType EndToEnd --outFilterType BySJout --outFilterMultimapNmax 20 --alignSJoverhangMin 8 --outSJfilterOverhangMin 12 12 12 12 --outSJfilterCountUniqueMin 1 1 1 1 --outSJfilterCountTotalMin 1 1 1 1 --outSJfilterDistToOtherSJmin 0 0 0 0 --outFilterMismatchNmax 999 --outFilterMismatchNoverReadLmax 0.04 --scoreGapNoncan -4 --scoreGapATAC -4 --chimOutType WithinBAM HardClip --chimScoreJunctionNonGTAG 0 --alignSJstitchMismatchNmax -1 -1 -1 -1 --alignIntronMin 20 --alignIntronMax 1000000 --alignMatesGapMax 1000000 --limitBAMsortRAM 2070672449” was used.
SARS-COV-2 coverage calculation
In order to remove the PCR duplicates effect on SARS-COV-2 coverage quantification, we firstly used Picard toolkit v2.22.6 (“Picard Toolkit.” 2019) with option “MarkDuplicates” to mark the duplicated reads in sorted bam file that mapped to virus genome, then we used samtools v1.9 (Li et al., 2009) with option “-F 1024” to remove the duplicated reads. Bedtools v2.28.0 (Quinlan, 2014) with option “genomecov -strand +/-” was used to calculate coverage of reads mapped to both sense and anti-sense strand genome for rRNA-depleted sequencing. Option “genomecov” was used for Poly(A)-mRNA sequencing. Log10(median) of each 10nt binned coverage of all rRNA-depleted and Poly(A)-RNA samples was plotted on Figure 1C
Canonical and non-canonical junctions quantification of SARS-COV-2
For both rRNA-depleted and Poly(A) mRNA sequencing samples, we divided the junction events by the categories defined by (Kim et al., 2020), which depends on the position of 5’ and 3’ sites of junction.
We calculated the percentage of canonical junctions of eight gene bodies (S, ORF3a, E, M, ORF7a, ORF7b, ORF8 and N) and six non-canonical junction patterns of each sample by dividing their junction event counts by the total junction event counts of each sample, respectively.
Co-sequence of 5’ and 3’ splicing sites
In order to investigate the sequence characteristics of fusions events, we defined a target region as 30nt window centered at the 5’ and 3’ junction sites, which contains the nucleotides 15nt upstream and 15nt downstream to the 5’ and 3’ junctions (Described as Figure 3A). For each junction event, sliding windows of the sub-sequence of 30nt to 3nt within the 3’-target region were matched to the 5’-target region iteratively until a perfect match was found. Then the co-sequences (common sequences) between the 5’ and 3’ junction sites were recorded as the sub-sequence with the largest length. If the co-sequence length is smaller than 3nt, it would be recorded as zero.
Free energy calculation
We supposed the sgRNA abundance to be related with free energies of the complex containing TRS-L and TRS-B. During the synthesis of negative strand sgRNAs, the secondary structures (free energy ) of TRS-B would unwind firstly to serve as the sense template strand for RdRp complex to move on, until it passed through the common sequences. The nascent anti-sense strand that carries the complement of common sequences (cCS) would then “jump” to the TRS-L region to form a duplex (free energy ) due to sequence complementarity. Simultaneously, the secondary structure in the leader region of the sense strand (free energy ) would also unwind to be a template, allowing the polymerase complex to work through the entire leader region (Figure 4D). It’s intuitive to think that to form a stable duplex between nascent TRS-B (anti-sense) and sense TRS-L, it should offset the energy needed to unwind both hairpins on TRS-B and TRS-L regions of the sense strand template. Such that we defined the free energy of the complex among the three processes as . The less stable TRR-B/TRS-L hybrid () plus more stable hairpin structures at sense TRS-B and TRS-L (smaller and ), would result in larger free energy , indicating an overall less probability to go through the entire “jumping” event, and vice versa. The free energies were calculated using Mfold web server (http://www.unafold.org/mfold/applications/rna-folding-form.php) (Zuker, 2003) with default parameters (temperature is fixed at 37°C, Ionic conditions: 1M NaCl, no divalent ions, the percent suboptimality number: 5, upper bound on the number of computed foldings: 50, the maximum interior/bulge loop size: 30, the maximum asymmetry of an interior/bulge loop: 30, maximum distance between paired bases: no limit.).
Pseudo counts for SARS-COV-2 discontinuous junctions
In the density plot (Figure 4B) of sense and anti-sense discontinuous events, we set pseudo counts for the events that are failed to be detected in either sense or anti-sense sgRNAs. We set pseudo count as 0.5 for the missing anti-sense strand junctions, so that the log2(count) equals -1, separating with the junctions with one anti-sense strand count. Similarly, the pseudo count of 0.25 was set for the missing sense strand junctions.
SARS-COV-2 transcription efficiency calculation
Due to the leader-to-body fusion of SARS-COV-2, the amount of sense and anti-sense sub-genomic RNAs could be determined by the detected junction events in rRNA-depleted RNA Sequencing data.
As is speculated that the discontinuous transcription happens at the formation of anti-sense sgRNAs and the sense sgRNAs are all transcribed from anti-sense sgRNAs, we defined the transcription efficiency as the ratio between sense and anti-sense sgRNA junction event counts detected from rRNA-depleted sequencing data. Read counts were firstly normalized as Count Per Million (CPM) before the efficiency was calculated.
Remdesivir inhibits more of negative strand RNA synthesis
In Figure 5A, sense and anti-sense junction events of virus-treated samples and virus plus RDV-treated samples were categorized into two groups. The counts of the replicates were normalized as CPM (Count Per Million) and plotted by a python package ‘seaborn’. To test the significance of difference between sense and anti-sense transcription level between the two groups, the Levene test were applied. However, Levene test can only test the abstract variance difference omitting the trend (e.g. ORF6). A Pearson test was cooperated.
Simulation of transcription rate
In order to understand the effect of RDV on SARS-CoV-2 replication and transcription, we built up a differential equation-based model to simulate genome RNA (gRNA) replication processes. In this model, we defined the transcription rate from sense gRNA to anti-sense gRNA as , the rate from anti-sense strand gRNA to sense gRNA as , both sense and anti-sense strand gRNA degradation efficiency as . We defined the amount of sense and anti-sense gRNAs at time point as and respectively. Then the variation of their amount in unit time could be quantified by nascent gRNAs minus degraded ones. Formally, it could be described as Equation (1).
| (Equation 1) |
To simplify the model, we assumed that the transcription rates, , and , are independent of time, and assigned constant values to them as , and , respectively. Such that the equations could be simplified as the following initial problem:
| (Equation 2) |
This equation group has an analytical solution:
| (Equation 3) |
where and are the characteristic roots of second order differential equation of . , , and are constants which should be estimated from known observations. Besides the initial condition given in Equation 2, the amount of sense and anti-sense gRNAs at end time point T (24h) could be approximated by a boost-strapping of read coverages of bases on ORF1 from rRNA-depleted sequencing, where and . Knowing these two conditions, it’s difficult to calculate the parameters exactly, and we therefore used an iteration approach to optimize the parameters in the least-squares sense instead. Functions ‘optimproblem’, ‘solve’ and ‘ode45’ in Matlab were utilized to do parameters optimization. Considering the ‘solve’ function estimates parameters depends on the given initial values for a non-linear problem, we randomly initialized the parameters and iterated for 100 times to find an optimal estimation. We finally got estimated values for and , which are 0.0280, 7.3998 and 0.0029 respectively, with the initial values 1.1900, 4.9836, 9.5974 input to function ‘solve’. ‘ode15s’ was used to solve values of and . However, we noted that the parameters could be locally optimized, and due to limited observations, the estimation could be slightly different if researchers would like to repeat with different random initialization of parameters.
As for replication and transcription simulation of virus in RDV and SARS-CoV-2 treated Vero cell, we assumed the synthesis and degradation rates of gRNA (, and ) stay the same and introduced a parameter to represent the delayed chain elongation effect of RDV, where represents the percentage of real nascent gRNA counts at time after removing pseudo ones delayed by RDV. Since RDV concentration is pretty high comparing with the NTP in cells, we assumed RdRp would be totally inhibited by RDV at the very beginning, and then inhibition effect would drop down with the decrease of RDV concentration along time by a linear mode, so the percentage of normal nascent gRNAs would gradually increase with time in a linear mode, , where is a constant. Since we observed the ratio of sense and anti-sense gRNAs changed after RDV treatment, we defined different values for sense (k1) and anti-sense () gRNA synthesis processes. was used as a rescaling for amount of two types gRNAs at time . The simulation model for RDV-treated samples could be written as Equation 4,
| (Equation 4) |
where , represent percentage of normal gRNAs compensating pseudo gRNAs terminated by RDV in nascent sense and anti-sense gRNAs respectively. We assumed , and stayed the same with model described in Equation 2. Values of and were estimated in similar approaches by using ‘ode45’ and solving defined optimization problem in the least-squares sense for the initial condition and observed condition at 24h, where the reads coverages of sense and anti-sense are and . Finally, and were estimated to be 0.1466 and 0.0349, when their initial values were set as 0.3736 and 0.2217, which means nascent anti-sense gRNAs have a larger possibility to generate early terminated RNAs that are inhibited by RDV. This result coincides with the A-T proportion of sense and anti-sense gRNAs, that is anti-sense gRNA has more As than sense gRNA, meaning more targets for RDV to locate.
Acknowledgments
We thank Wei Chen and Ziwei Dai at Southern University of Science and Technology (SUSTech) for inspiring discussions, suggestions and comments for the whole project (Wei Chen) and for the simulation model during manuscript revision (Ziwei Dai). Computational resource and experimental facilities were supported by the Center for Computational Science and Engineering and the Core Research Facilities at SUSTech. We thank Martin Vingron at Max-Planck-Institute for Molecular Genetics for offering server resources during our manuscript revision. This work was supported by the Shenzhen Key Laboratory of Gene Regulation and Systems Biology (Grant No. ZDSYS20200811144002008) (Y.H.), the Shenzhen Science and Technology Program (Grant No. KQTD20180411143432337) (Y.H.), the National Natural Science Foundation of China (Grant No. 81773881) (Y.H.), the National Key Research and Development Program of China (2018YFC1200100) (J.Z.), National Science and Technology Major Project (2018ZX10301403) (J.Z.), the emergency grants for prevention and control of SARS-CoV-2 of Ministry of Science and Technology of Guangdong province (2020A111128008, 2020B1111320003, and 2020B1111330001) (J.Z.).
Author contributions
Y.H and J.Z. conceived the project. Y.Z. performed the RNA-seq related analyses and mathematical modeling. Y.H. and Y.Z. interpreted the data and wrote the manuscript with input from all authors. J.S. performed the virus treatment experiments and inactivated the virus. Y.L. and Z.L. constructed the sequencing libraries. Y.L. and Y.X. designed and performed the RT-qPCR and data analysis. R.F. assisted in the data processing.
Declaration of interests
The authors declare no competing interests.
Published: August 20, 2021
Footnotes
Supplemental information can be found online at https://doi.org/10.1016/j.isci.2021.102857.
Contributor Information
Jincun Zhao, Email: zhaojincun@gird.cn.
Yuhui Hu, Email: huyh@sustech.edu.cn.
Supplemental information
References
- Agostini M.L., Andres E.L., Sims A.C., Graham R.L., Sheahan T.P., Lu X., Smith E.C., Case J.B., Feng J.Y., Jordan R. Coronavirus susceptibility to the Antiviral remdesivir (GS-5734) is mediated by the viral polymerase and the proofreading exoribonuclease. mBio. 2018;9 doi: 10.1128/mBio.00221-18. e00221-00218. [DOI] [PMC free article] [PubMed] [Google Scholar]
- Alonso S., Izeta A., Sola I., Enjuanes L. Transcription regulatory sequences and mRNA expression levels in the coronavirus transmissible gastroenteritis virus. J. Virol. 2002;76:1293–1308. doi: 10.1128/JVI.76.3.1293-1308.2002. [DOI] [PMC free article] [PubMed] [Google Scholar]
- Blanco-Melo D., Nilsson-Payant B.E., Liu W.-C., Uhl S., Hoagland D., Møller R., Jordan T.X., Oishi K., Panis M., Sachs D. Imbalanced host response to SARS-CoV-2 drives development of COVID-19. Cell. 2020;181:1036–1045.e9. doi: 10.1016/j.cell.2020.04.026. [DOI] [PMC free article] [PubMed] [Google Scholar]
- Braun J., Loyal L., Frentsch M., Wendisch D., Georg P., Kurth F., Hippenstiel S., Dingeldey M., Kruse B., Fauchere F. SARS-CoV-2-reactive T cells in healthy donors and patients with COVID-19. Nature. 2020;587:270–274. doi: 10.1038/s41586-020-2598-9. [DOI] [PubMed] [Google Scholar]
- Chan J.F., Kok K.H., Zhu Z., Chu H., To K.K., Yuan S., Yuen K.Y. Genomic characterization of the 2019 novel human-pathogenic coronavirus isolated from a patient with atypical pneumonia after visiting Wuhan. Emerg. Microbes Infect. 2020;9:221–236. doi: 10.1080/22221751.2020.1719902. [DOI] [PMC free article] [PubMed] [Google Scholar]
- Chang R.Y., Krishnan R., Brian D.A. The UCUAAAC promoter motif is not required for high-frequency leader recombination in bovine coronavirus defective interfering RNA. J. Virol. 1996;70:2720–2729. doi: 10.1128/jvi.70.5.2720-2729.1996. [DOI] [PMC free article] [PubMed] [Google Scholar]
- Chien M., Anderson T.K., Jockusch S., Tao C., Li X., Kumar S., Russo J.J., Kirchdoerfer R.N., Ju J. Nucleotide analogues as inhibitors of SARS-CoV-2 polymerase, a Key drug target for COVID-19. J. Proteome Res. 2020 doi: 10.1021/acs.jproteome.0c00392. [DOI] [PMC free article] [PubMed] [Google Scholar]
- Chua R.L., Lukassen S., Trump S., Hennig B.P., Wendisch D., Pott F., Debnath O., Thürmann L., Kurth F., Völker M.T. COVID-19 severity correlates with airway epithelium–immune cell interactions identified by single-cell analysis. Nat. Biotechnol. 2020;38:970–979. doi: 10.1038/s41587-020-0602-4. [DOI] [PubMed] [Google Scholar]
- Davidson A.D., Williamson M.K., Lewis S., Shoemark D., Carroll M.W., Heesom K.J., Zambon M., Ellis J., Lewis P.A., Hiscox J.A. Characterisation of the transcriptome and proteome of SARS-CoV-2 reveals a cell passage induced in-frame deletion of the furin-like cleavage site from the spike glycoprotein. Genome Med. 2020;12:68. doi: 10.1186/s13073-020-00763-0. [DOI] [PMC free article] [PubMed] [Google Scholar]
- de Wit E., Feldmann F., Cronin J., Jordan R., Okumura A., Thomas T., Scott D., Cihlar T., Feldmann H. Prophylactic and therapeutic remdesivir (GS-5734) treatment in the rhesus macaque model of MERS-CoV infection. Proc. Natl. Acad. Sci. U S A. 2020;117:6771–6776. doi: 10.1073/pnas.1922083117. [DOI] [PMC free article] [PubMed] [Google Scholar]
- Dobin A., Davis C.A., Schlesinger F., Drenkow J., Zaleski C., Jha S., Batut P., Chaisson M., Gingeras T.R. STAR: ultrafast universal RNA-seq aligner. Bioinformatics (Oxford, England) 2013;29:15–21. doi: 10.1093/bioinformatics/bts635. [DOI] [PMC free article] [PubMed] [Google Scholar]
- Dong E., Du H., Gardner L. An interactive web-based dashboard to track COVID-19 in real time. Lancet Infect. Dis. 2020;20:533–534. doi: 10.1016/S1473-3099(20)30120-1. [DOI] [PMC free article] [PubMed] [Google Scholar]
- Dufour D., Mateos-Gomez P.A., Enjuanes L., Gallego J., Sola I. Structure and functional relevance of a transcription-regulating sequence involved in coronavirus discontinuous RNA synthesis. J. Virol. 2011;85:4963–4973. doi: 10.1128/JVI.02317-10. [DOI] [PMC free article] [PubMed] [Google Scholar]
- Eastman R.T., Roth J.S., Brimacombe K.R., Simeonov A., Shen M., Patnaik S., Hall M.D. Remdesivir: a review of its discovery and development leading to emergency use authorization for treatment of COVID-19. ACS Cent. Sci. 2020;6:672–683. doi: 10.1021/acscentsci.0c00489. [DOI] [PMC free article] [PubMed] [Google Scholar]
- Fehr A.R., Perlman S. Coronaviruses: an overview of their replication and pathogenesis. Methods Mol. Biol. 2015;1282:1–23. doi: 10.1007/978-1-4939-2438-7_1. [DOI] [PMC free article] [PubMed] [Google Scholar]
- Garcia-Moreno M., Noerenberg M., Ni S., Järvelin A.I., González-Almela E., Lenz C.E., Bach-Pages M., Cox V., Avolio R., Davis T. System-wide profiling of rna-binding proteins uncovers Key regulators of virus infection. Mol. Cell. 2019;74:196–211.e11. doi: 10.1016/j.molcel.2019.01.017. [DOI] [PMC free article] [PubMed] [Google Scholar]
- Gates B. Responding to Covid-19 — a once-in-a-century pandemic? New Engl. J. Med. 2020;382:1677–1679. doi: 10.1056/NEJMp2003762. [DOI] [PubMed] [Google Scholar]
- Gordon C.J., Tchesnokov E.P., Woolner E., Perry J.K., Feng J.Y., Porter D.P., Gotte M. Remdesivir is a direct-acting antiviral that inhibits RNA-dependent RNA polymerase from severe acute respiratory syndrome coronavirus 2 with high potency. J. Biol. Chem. 2020;295:6785–6797. doi: 10.1074/jbc.RA120.013679. [DOI] [PMC free article] [PubMed] [Google Scholar]
- Hackbart M., Deng X., Baker S.C. Coronavirus endoribonuclease targets viral polyuridine sequences to evade activating host sensors. Proc. Natl. Acad. Sci. 2020;117:8094–8103. doi: 10.1073/pnas.1921485117. [DOI] [PMC free article] [PubMed] [Google Scholar]
- Kang D.-c., Gopalkrishnan R.V., Wu Q., Jankowsky E., Pyle A.M., Fisher P.B. mda-5: an interferon-inducible putative RNA helicase with double-stranded RNA-dependent ATPase activity and melanoma growth-suppressive properties. Proc. Natl. Acad. Sci. 2002;99:637–642. doi: 10.1073/pnas.022637199. [DOI] [PMC free article] [PubMed] [Google Scholar]
- Kato H., Takeuchi O., Sato S., Yoneyama M., Yamamoto M., Matsui K., Uematsu S., Jung A., Kawai T., Ishii K.J. Differential roles of MDA5 and RIG-I helicases in the recognition of RNA viruses. Nature. 2006;441:101–105. doi: 10.1038/nature04734. [DOI] [PubMed] [Google Scholar]
- Kim D., Lee J.Y., Yang J.S., Kim J.W., Kim V.N., Chang H. The architecture of SARS-CoV-2 transcriptome. Cell. 2020;181:914–921 e910. doi: 10.1016/j.cell.2020.04.011. [DOI] [PMC free article] [PubMed] [Google Scholar]
- Kupke S.Y., Ly L.-H., Börno S.T., Ruff A., Timmermann B., Vingron M., Haas S., Reichl U. Single-cell analysis uncovers a vast diversity in intracellular viral defective interfering RNA content affecting the large cell-to-cell heterogeneity in influenza A virus replication. Viruses. 2020;12:71. doi: 10.3390/v12010071. [DOI] [PMC free article] [PubMed] [Google Scholar]
- Li H., Handsaker B., Wysoker A., Fennell T., Ruan J., Homer N., Marth G., Abecasis G., Durbin R., Genome Project Data Processing S. The sequence alignment/map format and SAMtools. Bioinformatics (Oxford, England) 2009;25:2078–2079. doi: 10.1093/bioinformatics/btp352. [DOI] [PMC free article] [PubMed] [Google Scholar]
- Lu G., Zhang X., Zheng W., Sun J., Hua L., Xu L., Chu X.-j., Ding S., Xiong W. Development of a simple in vitro assay to identify and evaluate nucleotide analogs against SARS-CoV-2 RNA-dependent RNA polymerase. bioRxiv. 2020 doi: 10.1128/AAC.01508-20. 2020.2007.2016.205799. [DOI] [PMC free article] [PubMed] [Google Scholar]
- Mesci P., Macia A., Saleh A., Martin-Sancho L., Yin X., Snethlage C., Avansini S., Chanda S.K., Muotri A. Sofosbuvir protects human brain organoids against SARS-CoV-2. bioRxiv. 2020 2020.2005.2030.125856. [Google Scholar]
- Moreno J.L., Zúñiga S., Enjuanes L., Sola I. Identification of a coronavirus transcription enhancer. J. Virol. 2008;82:3882–3893. doi: 10.1128/JVI.02622-07. [DOI] [PMC free article] [PubMed] [Google Scholar]
- Nagy P.D., Simon A.E. New insights into the mechanisms of RNA recombination. Virology. 1997;235:1–9. doi: 10.1006/viro.1997.8681. [DOI] [PubMed] [Google Scholar]
- Nomburg J., Meyerson M., DeCaprio J.A. Noncanonical junctions in subgenomic RNAs of SARS-CoV-2 lead to variant open reading frames. bioRxiv. 2020 2020.2004.2028.066951. [Google Scholar]
- Pasternak A.O., van den Born E., Spaan W.J., Snijder E.J. Sequence requirements for RNA strand transfer during nidovirus discontinuous subgenomic RNA synthesis. EMBO J. 2001;20:7220–7228. doi: 10.1093/emboj/20.24.7220. [DOI] [PMC free article] [PubMed] [Google Scholar]
- Pasternak A.O., van den Born E., Spaan W.J.M., Snijder E.J. The stability of the duplex between sense and antisense transcription-regulating sequences is a crucial factor in arterivirus subgenomic mRNA synthesis. J. Virol. 2003;77:1175–1183. doi: 10.1128/JVI.77.2.1175-1183.2003. [DOI] [PMC free article] [PubMed] [Google Scholar]
- Pathak K.B., Nagy P.D. Defective interfering RNAs: foes of viruses and friends of virologists. Viruses. 2009;1:895–919. doi: 10.3390/v1030895. [DOI] [PMC free article] [PubMed] [Google Scholar]
- Pruijssers A.J., George A.S., Schafer A., Leist S.R., Gralinksi L.E., Dinnon K.H., 3rd, Yount B.L., Agostini M.L., Stevens L.J., Chappell J.D. Remdesivir inhibits SARS-CoV-2 in human lung cells and chimeric SARS-CoV expressing the SARS-CoV-2 RNA polymerase in mice. Cell Rep. 2020;32:107940. doi: 10.1016/j.celrep.2020.107940. [DOI] [PMC free article] [PubMed] [Google Scholar]
- Quinlan A.R. BEDTools: the Swiss-army tool for genome feature analysis. Curr. Protoc. Bioinformatics. 2014;47:11.12.11–11.12.34. doi: 10.1002/0471250953.bi1112s47. [DOI] [PMC free article] [PubMed] [Google Scholar]
- Sacramento C.Q., Fintelman-Rodrigues N., Temerozo J.R., da Silva Gomes Dias S., Ferreira A.C., Mattos M., Pão C.R.R., de Freitas C.S., Soares V.C., Bozza F.A. The in vitro antiviral activity of the anti-hepatitis C virus (HCV) vvSARS-CoV-2. bioRxiv. 2020 2020.2006.2015.153411. [Google Scholar]
- Schulte-Schrepping J., Reusch N., Paclik D., Baßler K., Schlickeiser S., Zhang B., Krämer B., Krammer T., Brumhard S., Bonaguro L. Severe COVID-19 is marked by a dysregulated myeloid cell compartment. Cell. 2020;182:1419–1440.e23. doi: 10.1016/j.cell.2020.08.001. [DOI] [PMC free article] [PubMed] [Google Scholar]
- Sethna P.B., Hofmann M.A., Brian D.A. Minus-strand copies of replicating coronavirus mRNAs contain antileaders. J. Virol. 1991;65:320–325. doi: 10.1128/jvi.65.1.320-325.1991. [DOI] [PMC free article] [PubMed] [Google Scholar]
- Shannon A., Le N.T., Selisko B., Eydoux C., Alvarez K., Guillemot J.C., Decroly E., Peersen O., Ferron F., Canard B. Remdesivir and SARS-CoV-2: structural requirements at both nsp12 RdRp and nsp14 Exonuclease active-sites. Antivir. Res. 2020;178:104793. doi: 10.1016/j.antiviral.2020.104793. [DOI] [PMC free article] [PubMed] [Google Scholar]
- Sheahan T.P., Sims A.C., Leist S.R., Schafer A., Won J., Brown A.J., Montgomery S.A., Hogg A., Babusis D., Clarke M.O. Comparative therapeutic efficacy of remdesivir and combination lopinavir, ritonavir, and interferon beta against MERS-CoV. Nat. Commun. 2020;11:222. doi: 10.1038/s41467-019-13940-6. [DOI] [PMC free article] [PubMed] [Google Scholar]
- Siegel D., Hui H.C., Doerffler E., Clarke M.O., Chun K., Zhang L., Neville S., Carra E., Lew W., Ross B. Discovery and synthesis of a phosphoramidate prodrug of a Pyrrolo[2,1-f][triazin-4-amino] adenine C-nucleoside (GS-5734) for the treatment of ebola and emerging viruses. J. Med. Chem. 2017;60:1648–1661. doi: 10.1021/acs.jmedchem.6b01594. [DOI] [PubMed] [Google Scholar]
- Sola I., Almazan F., Zuniga S., Enjuanes L. Continuous and discontinuous RNA synthesis in coronaviruses. Annu. Rev. Virol. 2015;2:265–288. doi: 10.1146/annurev-virology-100114-055218. [DOI] [PMC free article] [PubMed] [Google Scholar]
- Sola I., Moreno J.L., Zúñiga S., Alonso S., Enjuanes L. Role of nucleotides immediately flanking the transcription-regulating sequence core in coronavirus subgenomic mRNA synthesis. J. Virol. 2005;79:2506–2516. doi: 10.1128/JVI.79.4.2506-2516.2005. [DOI] [PMC free article] [PubMed] [Google Scholar]
- Taiaroa G., Rawlinson D., Featherstone L., Pitt M., Caly L., Druce J., Purcell D., Harty L., Tran T., Roberts J. Direct RNA sequencing and early evolution of SARS-CoV-2. bioRxiv. 2020 2020.2003.2005.976167. [Google Scholar]
- Thiel V., Ivanov K.A., Putics Á., Hertzig T., Schelle B., Bayer S., Weißbrich B., Snijder E.J., Rabenau H., Doerr H.W. Mechanisms and enzymes involved in SARS coronavirus genome expression. J. Gen. Virol. 2003;84:2305–2315. doi: 10.1099/vir.0.19424-0. [DOI] [PubMed] [Google Scholar]
- van Marle G., Dobbe J.C., Gultyaev A.P., Luytjes W., Spaan W.J., Snijder E.J. Arterivirus discontinuous mRNA transcription is guided by base pairing between sense and antisense transcription-regulating sequences. Proc. Natl. Acad. Sci. United States America. 1999;96:12056–12061. doi: 10.1073/pnas.96.21.12056. [DOI] [PMC free article] [PubMed] [Google Scholar]
- Wang M., Cao R., Zhang L., Yang X., Liu J., Xu M., Shi Z., Hu Z., Zhong W., Xiao G. Remdesivir and chloroquine effectively inhibit the recently emerged novel coronavirus (2019-nCoV) in vitro. Cell Res. 2020;30:269–271. doi: 10.1038/s41422-020-0282-0. [DOI] [PMC free article] [PubMed] [Google Scholar]
- Wu F., Zhao S., Yu B., Chen Y.-M., Wang W., Song Z.-G., Hu Y., Tao Z.-W., Tian J.-H., Pei Y.-Y. A new coronavirus associated with human respiratory disease in China. Nature. 2020;579:265–269. doi: 10.1038/s41586-020-2008-3. [DOI] [PMC free article] [PubMed] [Google Scholar]
- Wu F., Zhao S., Yu B., Chen Y.M., Wang W., Song Z.G., Hu Y., Tao Z.W., Tian J.H., Pei Y.Y. A new coronavirus associated with human respiratory disease in China. Nature. 2020;579:265–269. doi: 10.1038/s41586-020-2008-3. [DOI] [PMC free article] [PubMed] [Google Scholar]
- Yang Y., Lyu T., Zhou R., He X., Ye K., Xie Q., Zhu L., Chen T., Shen C., Wu Q. The antiviral and antitumor effects of defective interfering particles/genomes and their mechanisms. Front Microbiol. 2019;10:1852. doi: 10.3389/fmicb.2019.01852. [DOI] [PMC free article] [PubMed] [Google Scholar]
- Yin W., Mao C., Luan X., Shen D.-D., Shen Q., Su H., Wang X., Zhou F., Zhao W., Gao M. Structural basis for inhibition of the RNA-dependent RNA polymerase from SARS-CoV-2 by remdesivir. Science. 2020;368:1499–1504. doi: 10.1126/science.abc1560. [DOI] [PMC free article] [PubMed] [Google Scholar]
- Zhou P., Yang X.L., Wang X.G., Hu B., Zhang L., Zhang W., Si H.R., Zhu Y., Li B., Huang C.L. A pneumonia outbreak associated with a new coronavirus of probable bat origin. Nature. 2020;579:270–273. doi: 10.1038/s41586-020-2012-7. [DOI] [PMC free article] [PubMed] [Google Scholar]
- Zhu N., Zhang D., Wang W., Li X., Yang B., Song J., Zhao X., Huang B., Shi W., Lu R. A novel coronavirus from patients with pneumonia in China, 2019. N. Engl. J. Med. 2020;382:727–733. doi: 10.1056/NEJMoa2001017. [DOI] [PMC free article] [PubMed] [Google Scholar]
- Zuker M. Mfold web server for nucleic acid folding and hybridization prediction. Nucleic Acids Res. 2003;31:3406–3415. doi: 10.1093/nar/gkg595. [DOI] [PMC free article] [PubMed] [Google Scholar]
- Zuniga S., Sola I., Alonso S., Enjuanes L. Sequence motifs involved in the regulation of discontinuous coronavirus subgenomic RNA synthesis. J. Virol. 2004;78:980–994. doi: 10.1128/JVI.78.2.980-994.2004. [DOI] [PMC free article] [PubMed] [Google Scholar]
Associated Data
This section collects any data citations, data availability statements, or supplementary materials included in this article.
Supplementary Materials
Data Availability Statement
The RNA-seq data has been deposited into GEO and are publicly available as of the date of publication. Accession number is GSE160668. Additional Supplemental Items are available from Mendeley Data at https://doi.org/10.17632/t2x5fdr2k4.2 .
All original codes for the data processing and analyses has been deposited at GitHub and is available at https://github.com/choyeon1993/SARS-CoV-2-transcriptome as of the date of publication.
Any additional information required to reanalyze the data reported in this paper is available from the lead contact upon request.