

Key Points
Question
Did treatment of opioid use disorder (OUD) among Medicaid enrollees change from 2014 to 2018?
Findings
In this exploratory serial cross-sectional study using data from 1 024 301 Medicaid enrollees in 11 states, the prevalence of medication treatment for OUD increased from 47.8% (138 918 of 290 638 enrollees with OUD) in 2014 to 57.1% (301 499 of 527 983) in 2018. There was substantial variation across and within states in any use and continuity (for 180 days) of medications for OUD by age, race/ethnicity, eligibility group, behavioral health comorbidity, and rural vs urban residence.
Meaning
From 2014 through 2018, use of medications for opioid use disorder increased among Medicaid enrollees in 11 US states, but the pattern in the other states is not known.
Abstract
Importance
There is limited information about trends in the treatment of opioid use disorder (OUD) among Medicaid enrollees.
Objective
To examine the use of medications for OUD and potential indicators of quality of care in multiple states.
Design, Setting, and Participants
Exploratory serial cross-sectional study of 1 024 301 Medicaid enrollees in 11 states aged 12 through 64 years (not eligible for Medicare) with International Classification of Diseases, Ninth Revision (ICD-9 or ICD-10) codes for OUD from 2014 through 2018. Each state used generalized estimating equations to estimate associations between enrollee characteristics and outcome measure prevalence, subsequently pooled to generate global estimates using random effects meta-analyses.
Exposures
Calendar year, demographic characteristics, eligibility groups, and comorbidities.
Main Outcomes and Measures
Use of medications for OUD (buprenorphine, methadone, or naltrexone); potential indicators of good quality (OUD medication continuity for 180 days, behavioral health counseling, urine drug tests); potential indicators of poor quality (prescribing of opioid analgesics and benzodiazepines).
Results
In 2018, 41.7% of Medicaid enrollees with OUD were aged 21 through 34 years, 51.2% were female, 76.1% were non-Hispanic White, 50.7% were eligible through Medicaid expansion, and 50.6% had other substance use disorders. Prevalence of OUD increased in these 11 states from 3.3% (290 628 of 8 737 082) in 2014 to 5.0% (527 983 of 10 585 790) in 2018. The pooled prevalence of enrollees with OUD receiving medication treatment increased from 47.8% in 2014 (range across states, 35.3% to 74.5%) to 57.1% in 2018 (range, 45.7% to 71.7%). The overall prevalence of enrollees receiving 180 days of continuous medications for OUD did not significantly change from the 2014-2015 to 2017-2018 periods (−0.01 prevalence difference, 95% CI, −0.03 to 0.02) with state variability in trend (90% prediction interval, −0.08 to 0.06). Non-Hispanic Black enrollees had lower OUD medication use than White enrollees (prevalence ratio [PR], 0.72; 95% CI, 0.64 to 0.81; P < .001; 90% prediction interval, 0.52 to 1.00). Pregnant women had higher use of OUD medications (PR, 1.18; 95% CI, 1.11-1.25; P < .001; 90% prediction interval, 1.01-1.38) and medication continuity (PR, 1.14; 95% CI, 1.10-1.17, P < .001; 90% prediction interval, 1.06-1.22) than did other eligibility groups.
Conclusions and Relevance
Among US Medicaid enrollees in 11 states, the prevalence of medication use for treatment of opioid use disorder increased from 2014 through 2018. The pattern in other states requires further research.
This exploratory study examines changes in quality of care and use of medications to treat opioid use disorder from 2014 through 2018 among Medicaid patients in 11 states.
Introduction
Rising US opioid overdose deaths underscore the need for improved opioid use disorder (OUD) treatment.1 Medicaid is the largest financing source in the US for OUD treatment,2 covering 38% of persons with OUD and more in states that expanded Medicaid under the Affordable Care Act (ACA).3 State Medicaid programs have made multiple policy changes to improve use of medications for OUD including adding coverage for methadone, loosening prior authorization restrictions for buprenorphine,4 and funding programs to improve care coordination and boost initiation of medications for OUD in emergency departments.5
Recent reports indicate increased use of medications for OUD in the US with larger increases in Medicaid than among patients who are commercially insured.6,7,8 Less is known about whether increased use of medications for OUD was accompanied by changes in care patterns associated with improved outcomes. For example, there is little recent evidence on changes in the duration of medication treatment, in services frequently used in conjunction with medications for OUD such as counseling and urine drug tests, or in coprescribing of other medications such as benzodiazepines and opioids that may pose risks.
Medicaid data may inform these patterns of care yet there are no recent, large-scale studies of Medicaid due to a lack of data. The purpose of this exploratory study was to examine temporal changes and subgroup differences in use of medications for OUD and in potential indicators of quality of OUD treatment using Medicaid data from 2014 through 2018 from a sample of 11 states.
Methods
Data Sources
We obtained data from 11 states (Delaware, Kentucky, Maryland, Maine, Michigan, North Carolina, Ohio, Pennyslvania, Virginia, West Virginia, and Wisconsin) participating in the Medicaid Outcomes Distributed Research Network (MODRN).9 These states accounted for 16.3 million (22%) Medicaid enrollees and included 6 of 10 states ranking highest in overdose deaths.10 Universities in these 11 states obtained claims and enrollment data for a census of enrollees directly from their state’s Medicaid agency. Each university received an exempt determination from their institutional review board for this study, and, as such, did not require participant consent. Following previously validated approaches,11 MODRN developed a common data model with uniform structure and data elements to which each participating university converted its Medicaid data. A data coordinating center distributed an identical statistical software code to each university to apply to its state’s Medicaid data. Each university returned aggregate results to the data coordinating center for statistical analyses. This approach enabled standardized Medicaid data analyses across states.
Study Population
We included all full-benefit Medicaid enrollees aged 12 through 64 years ever enrolled in Medicaid (and not dually eligible for Medicare) in 1 of the 11 states from January 1, 2014, through December, 31, 2018 (Table). We identified enrollees with OUD diagnoses (using International Classification of Diseases, Ninth Revision [ICD-9] codes 304.0x, 305.5x and ICD-10 codes F11.xxx) recorded during an inpatient stay or a visit to an outpatient facility or office following the National Quality Forum (NQF)12 approach.
Table. Characteristics of Medicaid Enrollees With Opioid Use Disorder.
| No. (%) | |||||
|---|---|---|---|---|---|
| 2014 | 2015 | 2016 | 2017 | 2018 | |
| Total, No.a | 8 737 082 | 10 032 720 | 10 437 883 | 10 599 340 | 10 585 790 |
| Total with OUD, No. | 290 628 | 385 012 | 462 586 | 506 429 | 527 983 |
| With OUD, % | 3.3 | 3.8 | 4.4 | 4.8 | 5.0 |
| Age, y | |||||
| 12-20 | 8921 (3.1) | 9930 (2.6) | 10 229 (2.2) | 9319 (1.8) | 8070 (1.5) |
| 21-34 | 141 074 (48.5) | 183 174 (47.6) | 210 981 (45.6) | 221 593 (43.8) | 220 198 (41.7) |
| 35-44 | 68 912 (23.7) | 95 630 (24.8) | 120 522 (26.1) | 139 766 (27.6) | 155 131 (29.4) |
| 45-54 | 47 490 (16.3) | 62 997 (16.4) | 77 703 (16.8) | 85 465 (16.9) | 89 317 (16.9) |
| 55-64 | 24 231 (8.3) | 33 281 (8.6) | 43 151 (9.3) | 50 286 (9.9) | 55 267 (10.5) |
| Sex | |||||
| Female | 156 862 (54.0) | 202 433 (52.6) | 240 409 (52.0) | 260 500 (51.4) | 270 489 (51.2) |
| Male | 133 765 (46.0) | 182 579 (47.4) | 222 177 (48.0) | 245 929 (48.6) | 257 494 (48.8) |
| Race/ethnicity | |||||
| Non-Hispanic White | 220 709 (75.9) | 293 380 (76.2) | 351 510 (76.0) | 385 197 (76.1) | 402 043 (76.1) |
| Non-Hispanic Black | 42 452 (14.6) | 52 835 (13.7) | 64 587 (14.0) | 70 723 (14.0) | 73 096 (13.8) |
| Hispanic | 7701 (2.6) | 10 310 (2.7) | 13 019 (2.8) | 14 244 (2.8) | 15 388 (2.9) |
| Other/unknownb | 19 766 (6.8) | 28 487 (7.4) | 33 470 (7.2) | 36 265 (7.2) | 37 456 (7.1) |
| Eligibility group | |||||
| Nondisabled adults | 112 267 (38.6) | 105 764 (27.5) | 117 878 (25.5) | 126 364 (25.0) | 130 298 (24.7) |
| Expansion adultsc | 79 313 (27.3) | 166 489 (43.2) | 219 792 (47.5) | 252 786 (49.9) | 267 783 (50.7) |
| Disabled adults | 71 045 (24.4) | 80 282 (20.9) | 85 759 (18.5) | 87 963 (17.4) | 92 170 (17.5) |
| Pregnant women | 19 155 (6.6) | 22 539 (5.9) | 29 016 (6.3) | 30 175 (6.0) | 29 731 (5.6) |
| Youth | 8848 (3.0) | 9938 (2.6) | 10 141 (2.2) | 9141 (1.8) | 8001 (1.5) |
| Any other substance use disorderd | 147 245 (50.7) | 200 830 (52.2) | 230 570 (49.8) | 253 464 (50.0) | 267 417 (50.6) |
| Any mental health conditiond | 182 727 (62.9) | 241 825 (62.8) | 288 552 (62.4) | 315 463 (62.3) | 330 995 (62.7) |
| Location of residence | 289 515 | 383 801 | 461 330 | 505 155 | 526 730 |
| Urban | 218 757 (75.6) | 286 055 (74.5) | 342 801 (74.3) | 374 247 (74.1) | 387 053 (73.5) |
| Rural | 70 758 (24.4) | 97 746 (25.5) | 118 529 (25.7) | 130 908 (25.9) | 139 677 (26.5) |
Abbreviation: OUD, opioid use disorder.
Study includes all full-benefit, nondual eligible Medicaid enrollees aged 12 through 64 years with any enrollment in the calendar year in the 11 state Medicaid programs.
Other includes Native Hawaiian, Pacific Islander, American Indian, Alaska Native, and Asian.
Expansion adults are enrollees newly eligible under the Affordable Care Act in a Medicaid expansion adopted during the study period.
Mental health conditions and other substance use disorders were defined using any claim with 1 or more International Classification of Diseases, Ninth Revision (ICD-9) or ICD-10 diagnosis codes listed in eTable 2 in Supplement 1.
Outcomes
For each person-year of data for enrollees with OUD, we constructed an indicator of receipt of any medications for OUD during the same calendar year as an OUD diagnosis, regardless of timing of treatment relative to diagnosis. To measure use of buprenorphine, buprenorphine-naloxone, and naltrexone, we used prescription fills captured in retail pharmacy claims and/or procedure codes for medication administration in office-based settings or in licensed opioid treatment facilities (eAppendix 1 in Supplement 1). We measured methadone using procedure codes recorded in opioid treatment facilities. We did not include pharmacy claims for methadone, which were for pain and not OUD treatment.
Among those receiving medications for OUD, we constructed several indicators potentially related to quality of care. Few validated measures of OUD treatment quality exist13 and what constitutes standard of care is subject to debate.14 We included a NQF measure of continuity of medications for OUD12 and several measures used in prior studies.15,16 We restricted the denominator for these measures to beneficiaries continuously enrolled in Medicaid for 180 or more days after the index medication claim. NQF’s measure indicates whether individuals have at least 1 period of 180 days of continuous OUD medications with no more than a 7-day gap during a 2-year analytic period.12 We determined days with OUD medications using prescription fill dates and days’ supply from pharmacy claims, and service begin and end dates for office- or facility-based administration of buprenorphine or facility-based dispensing of methadone. For injectable naltrexone, we determined treatment days assuming a standard 28-day supply. eAppendix 2 in Supplement 1 provides details on treatment of overlapping days supply and changes in treatment modality. We created 2 dichotomous indicators for whether patients had 1 or more claim for any urine drug test, and 1 or more claim for behavioral health counseling (eg, alcohol or drug counseling, individual psychotherapy) (eAppendices 3 and 4 in Supplement 1). Using pharmacy claims, we created 2 indicators of use of other controlled substances that are associated with increased risk of overdose,17 including whether individuals receiving medications for OUD filled prescriptions for any opioid analgesics not used for treatment of OUD or for any benzodiazepines (eAppendices 5 and 6 in Supplement 1).16
Covariates
We constructed indicators for demographic and other characteristics of enrollees diagnosed with OUD including age (12-20, 21-34, 35-44, 45-54, and 55-64 years); sex (male/female); and race/ethnicity (non-Hispanic White, non-Hispanic Black, Hispanic, and other racial/ethnic group). Medicaid enrollees reported racial/ethnic identity during the enrollment process based on fixed categories. We included these indicators due to prior evidence of racial/ethnic disparities in OUD treatment.18,19 We included an indicator of rural or urban residence, defined from residence zip codes using rural urban commuting area codes.20 We created 5 standardized, mutually exclusive eligibility groups on a person-year basis: (1) pregnant women, (2) youth, (3) adults with disability-related Medicaid eligibility, (4) adults newly eligible under the ACA Medicaid expansion (hereafter, expansion), and (5) traditionally eligible nondisabled adults (state eligibility thresholds for these groups are in eTable 1 in Supplement 1). We included indicators for any mental health condition and any non-OUD substance use disorder diagnosis in the calendar year (eTable 2 in Supplement 1).
Analyses
In this exploratory study, we reported unadjusted changes in medications for OUD by state and overall by pooling data for all 11 states. We compared changes in the 5 potential indicators of quality of care from the 2014-2015 to 2017-2018 calendar year periods. We used χ2 tests for state-level changes in prevalence and random effects meta-analysis using metafor package (2.4-0) in R (3.6.2) to generate 95% CIs and 90% prediction intervals, the estimation and interpretation of which is described below and in eAppendix 7 in Supplement 1.
We used a 2-stage procedure to assess mean population differences in the likelihood of 2 outcomes by enrollee characteristics: (1) receipt of any medications for OUD and (2) receipt of continuous medications for OUD for 180 days. First, we used log-binomial models to separately model adjusted prevalence of each outcome in each state. Because some enrollees had multiple episodes of OUD treatment, we used generalized estimating equations (GEE)21 with an autoregressive working correlation structure to account for the dependency across multiple observations per individual. Models adjusted for length of Medicaid enrollment (in months), and expansion and traditionally eligible, nondisabled adults groups were combined for statistical analyses. We excluded a small number of enrollees (<0.5%), whose urban or rural residence could not be obtained, from the analyses. We limited analyses of OUD medication continuity to individuals initiating medications for OUD who were continuously enrolled in Medicaid for 180 or more days after their index medication claim. Based on a uniform model specification, each state conducted individual-level analyses using the SAS version 9.4 (SAS Institute Inc) with the GENMOD procedure to estimate adjusted prevalence ratios (PRs).
Second, we conducted random effects meta-analyses to pool the 11 state-specific estimates of individual parameters into global estimates adopting methods validated in similar settings.22,23 We estimated global mean effects by averaging the individual model estimates from states weighted by the inverse of their variances, accounting for differences in population size. Using the Hartung-Knapp-Sidik-Jonkman method, we estimated between-state variances due to potential heterogeneity across states to construct valid confidence intervals.24,25 We used between-state variability (τ2), I2, and the Cochran Q statistic to measure and test the statistical significance of between-state heterogeneity in our estimates. We reported 2-sided P values associated with the significance of the mean (ie, global) effects across states and their corresponding 95% CIs, using a significance threshold of .05. To overcome the limitations of the above-mentioned measures of heterogeneity in random effects meta-analyses (eg, 95% CIs are highly dependent on the number of states contributing estimates), we also reported 90% prediction intervals.26 Prediction intervals convey state-to-state variability, denoting the range within which prevalence ratios would fall for 90% of states if a different sample of states were drawn. We described the calculation of the prediction interval in eAppendix 7 in Supplement 1. Full results from meta-analyses were reported in eTable 3 and eTable 4 in Supplement 1. We completed meta-analyses in R (3.6.2) using package metafor (2.4-0). Per the terms of state agreements, states-level results were deidentified for presentation.
We conducted additional unadjusted exploratory analyses to assess trends by population subgroup and treatment modality and examined the sensitivity of our findings to measurement specifications. First, because diagnosis codes for OUD have limited sensitivity in claims data, 27,28 we constructed an alternative measure for use of medications for OUD regardless of OUD diagnosis. Second, to explore the association between Medicaid expansion and changes in OUD treatment, we stratified outcomes by traditionally eligible vs expansion enrollees. Third, we reported trends in use of specific medications (buprenorphine, naltrexone, methadone).
Results
Characteristics of Study Population
This study included 1 024 301 enrollees diagnosed with OUD in 11 state Medicaid programs. The prevalence of OUD diagnosis among nondual Medicaid enrollees aged 12 through 64 years in these 11 states increased from 3.3% (290 628 of 8 737 082) in 2014 to 5.0% (527 983 of 10 585 790) in 2018 (Table). Among enrollees with OUD, the share of those aged 35 years or older grew over the study period (48.3% to 56.8%). Females made up 51.2% to 54.0%, depending on the year, and non-Hispanic White enrollees accounted for 75.9% to 76.2% of those with OUD. Pregnant women made up 5.6% to 6.6% of enrollees with OUD, depending on the year. The share of enrollees with OUD enrolled in Medicaid due to the ACA expansion grew from 27.3% in 2014 to 50.7% in 2018. Enrollees in rural areas made up 24.4% to 26.5% of those with OUD. Between 49.8% and 52.2% of enrollees with OUD, depending on the year, had diagnoses of other substance use disorders, and 62.3% to 62.9% had diagnosed mental health conditions.
Medications for OUD
The number of Medicaid enrollees in these 11 states receiving medications for OUD increased from 138 918 in 2014 to 301 499 in 2018 (Figure 1). Even with the increase in the prevalence of OUD among Medicaid enrollees in these states, the overall share of enrollees with OUD receiving medication treatment increased from 47.8% to 57.1%, albeit with substantial variation across states. The overall increase in medications for OUD was driven by increases in use of buprenorphine and naltrexone; the share of enrollees diagnosed with OUD receiving methadone decreased (eFigure 1 in Supplement 1). Newly eligible expansion enrollees accounted for a majority of Medicaid enrollees receiving medications for OUD in 2018 (51.3% [15 903 of 301 499]) (eFigure 2 in Supplement). Sensitivity analyses indicated that trends in use of medications for OUD were similar when the numerator was not limited to those with an OUD diagnosis (eFigure 3 in Supplement 1).
Figure 1. Unadjusted Percent of Enrollees Diagnosed With Opioid Use Disorder (OUD) Who Received Any Medications for OUD, 2014-2018.

States included are Delaware, Kentucky, Maine, Maryland, Michigan, North Carolina, Ohio, Pennsylvania, Virginia, West Virginia, and Wisconsin. Medications for OUD are defined as using pharmacy and medical claims for US Food and Drug Administration–approved medications for OUD including buprenorphine, methadone, and naltrexone. The denominator includes full-benefit Medicaid enrollees aged 12 through 64 years diagnosed with OUD in the calendar year. Unadjusted state-level trends in medications for OUD shown separately. Combined prevalence of medications for OUD were obtained by summing the numerators and denominators across 11 states.
Potential Indicators of Quality of Care
There were several changes in potential quality of care indicators from the 2014-2015 to 2017-2018 periods (Figure 2). In the 11 states, the overall percent of enrollees receiving 180 days of continuous medications for OUD did not significantly change during the period (−0.01 prevalence difference, 95% CI, −0.03 to 0.02) with variability in trend by state (90% prediction interval, −0.08 to 0.06). Receipt of at least 1 urine drug test among enrollees using medications for OUD increased (prevalence difference, 0.02; 95% CI, 0.00 to 0.04; 90% prediction interval, −0.04 to 0.08). There was marked variability across states in the level and trend in use of behavioral health counseling for those receiving medications for OUD. All 11 states experienced decreases in use of opioid analgesics and benzodiazepines among those receiving medications for OUD, although the magnitude of the reduction varied by state (Figure 3).
Figure 2. Unadjusted Changes in Potential Indicators of Good Quality of Care for Enrollees Receiving Medications for Opioid Use Disorder (OUD), 2014-2015 to 2017-2018.

See figure 1 for included states. Denominators for all measures include enrollees diagnosed with OUD who initiated medications for OUD (with buprenorphine, methadone, or naltrexone) who had at least 6 months of continuous enrollment in Medicaid after their index claim for medications for OUD. Two-year timeframes shown for all measures. State-level prevalence (data points) and prevalence differences are displayed (error bars). Random effects meta-analyses were used to estimate global prevalence differences for each measure across the 11 states, along with 95% CIs (diamond) and 90% prediction intervals (error bars). Prediction intervals denote the range within which prevalence differences would fall for 90% of US states were a different set of states to be drawn. Prediction intervals estimate the between-state variability of the true prevalence differences of state populations.
Figure 3. Unadjusted Changes in Potential Indicators of Poor Quality of Care for Enrollees Receiving Medications for Opioid Use Disorder (OUD), 2014-2015 to 2017-2018.
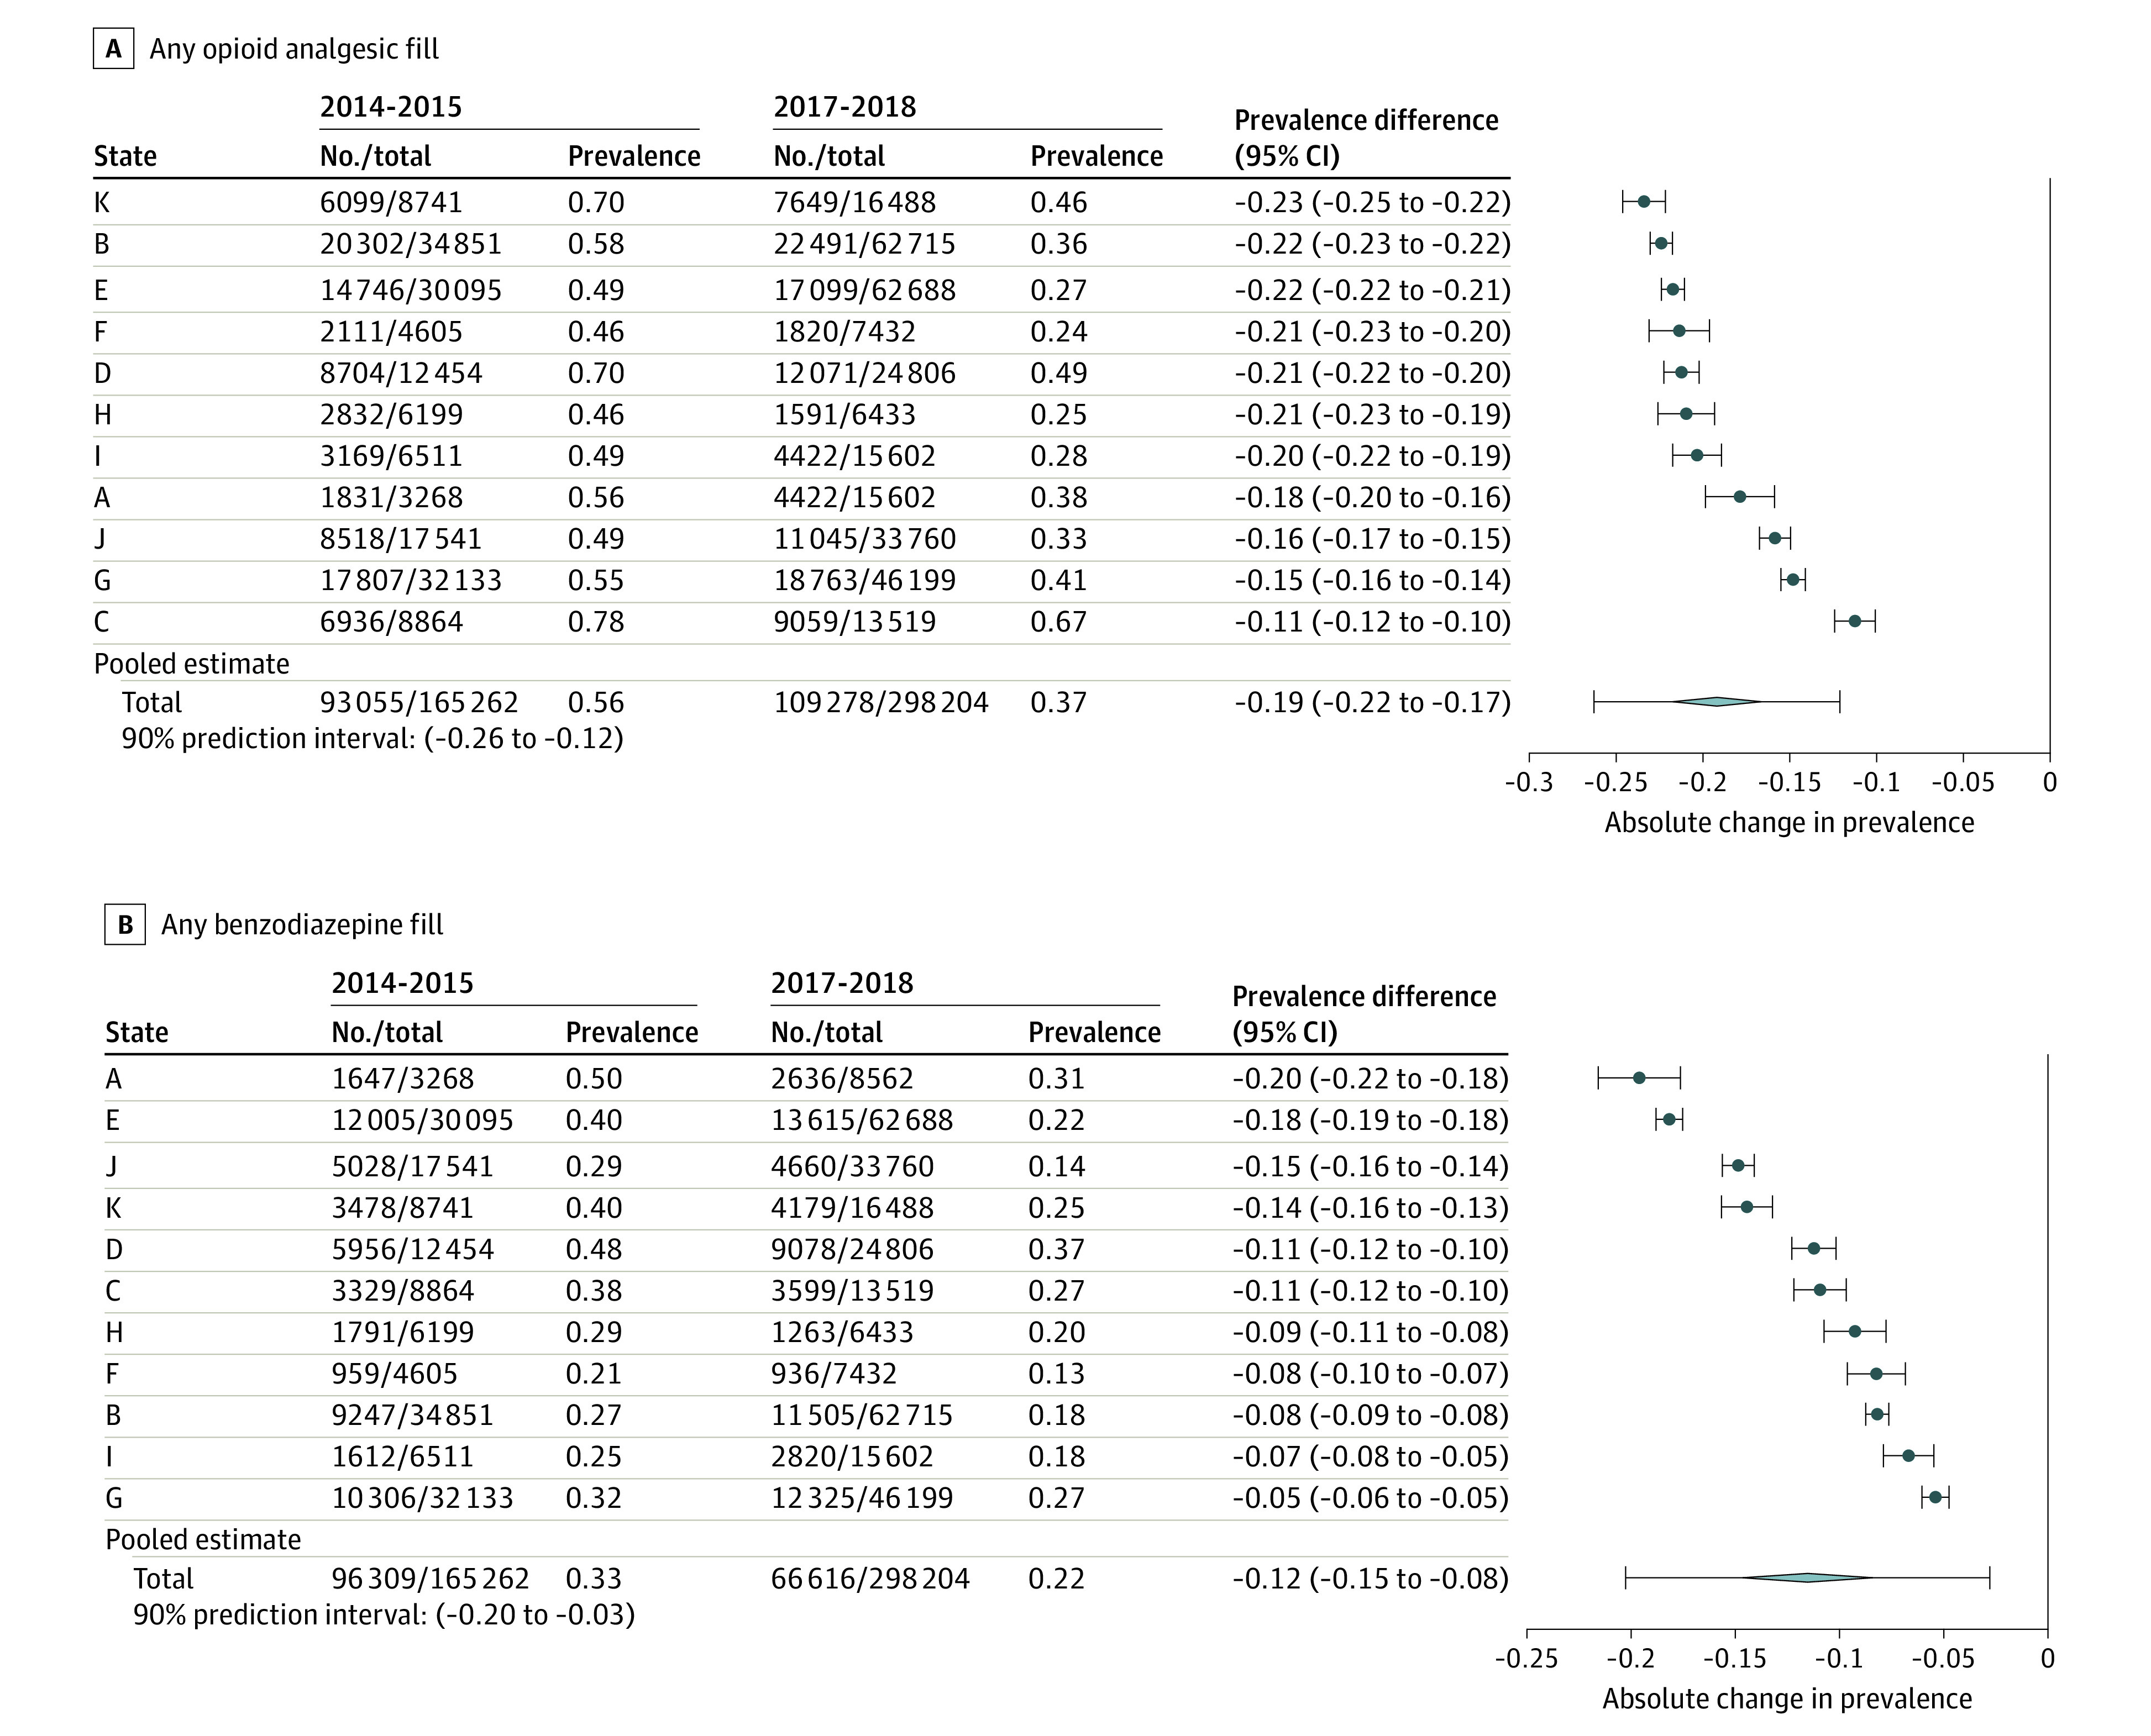
See Figure 1 for included states. Denominators for all measures include enrollees diagnosed with OUD who initiated medications for OUD (with buprenorphine, methadone, or naltrexone) who had at least 6 months of continuous enrollment in Medicaid after their index claim for medications for OUD. Two-year timeframes shown for all measures. State-level prevalence (data points) and prevalence differences (error bars) are displayed. Random effects meta-analyses were used to estimate global prevalence differences for each measure across the 11 states, along with 95% CIs (diamond) and 90% prediction intervals (error bars). Prediction intervals denote the range within which prevalence differences would fall for 90% of US states were a different set of states to be drawn. Prediction intervals estimate the between-state variability of the true prevalence differences of state populations.
Enrollee Characteristics Associated With Receipt of Medications for OUD
Figure 4 shows the results from random effects meta-analysis for receiving any medications for OUD. Cochran Q tests were significant (P < .05) for all model coefficients, with I2 ranging from 75.1 to 99.8, indicating heterogeneity in estimated prevalence ratios across states (full results are in eTable 3 in Supplement 1). There were significant differences in use of medications for OUD based on age. Non-Hispanic Black enrollees with OUD had lower use of medications for OUD than did White enrollees (global PR, 0.72; 95% CI, 0.64-0.81; P < .001; 90% prediction interval, 0.52-1.00). Compared with nondisabled adults, disabled enrollees were less likely to use medications for OUD (global PR, 0.91; 95% CI, 0.86-0.97; P = .008; 90% prediction interval, 0.77-1.08), whereas pregnant women had greater use of medications for OUD (global PR, 1.18; 95% CI, 1.11-1.25; P < .001; 90% prediction interval, 1.01-1.38). There were no statistically significant differences between enrollees with rural vs urban residence (global PR, 1.00; 95% CI, 0.95-1.05; P = .99; 90% prediction interval, 0.87-1.15). Enrollees with mental health conditions had lower use of medications for OUD (global PR, 0.98; 95% CI, 0.97-1.00; P = .04; 90% prediction interval, 0.95-1.03).
Figure 4. Random Effects Meta-analysis Estimates for Receiving Any Medications for OUD Adjusted for Enrollee Characteristics.

See Figure 1 legend for included states. Numbers correspond to person-year observations in each subgroup. Adjusted prevalence ratios (log scale) were estimated from random effects meta-analysis. Data points and error bars represent the global prevalence ratios and 95% CIs of the global prevalence ratios across states. The lightly shaded bars represent 90% prediction intervals, which denote the range within which prevalence ratios would fall for 90% of states were a different set of states to be drawn. The prediction intervals estimate the between-state variability of the true prevalence ratios of the state populations.
aOther includes Native Hawaiian, Pacific Islander, American Indian, Alaska Native, and Asian.
bExpansion adults are enrollees newly eligible under the Affordable Care Act in a Medicaid expansion adopted in 2014 and 2015.
Enrollee Characteristics Associated With Continuity of Medications for OUD for 180 Days
Figure 5 shows the results from random effects meta-analysis for medication continuity. Cochran Q tests were significant (P < .05), with I2 ranging from 55.3 to 99.2, for all model coefficients except for the 12 through 20 age range, indicating heterogeneity across states (eTable 4 in Supplement 1). There were significant differences by age in medication continuity for 180 days. Males were less likely than females to have continuity (PR, 0.96; 95% CI, 0.95-0.98; P < .001, 90% prediction interval, 0.92-1.01). Non-Hispanic Black enrollees were less likely to have continuity (PR, 0.89; 95% CI, 0.84-0.95; P = .002, 90% prediction interval, 0.76-1.05). Compared with other Medicaid-eligible adults, pregnant women were more likely to have OUD medication continuity (PR, 1.14; 95% CI, 1.10-1.17; P < .001, 90% prediction interval, 1.06-1.22). Both comorbid other substance use disorders and mental health conditions were associated with lower OUD medication continuity (PR, 0.93; 95% CI, 0.91-0.95; P < .001; 90% prediction interval, 0.88-0.98 and PR, 0.97; 95% CI, 0.96-0.98; P < .001; 90% prediction interval, 0.94-1.01; respectively).
Figure 5. Random Effects Meta-analysis Estimates for Continuity of Medications for OUD for 180 Days Adjusted for Enrollee Characteristics.

See Figure 1 legend for the included states. Numbers correspond to person-period observations, where a period can be up to 2 years long, in each subgroup. Adjusted prevalence ratios (log scale) were estimated from random effects meta-analysis. Data markers and error bars represent the global prevalence ratios and 95% CIs of the global prevalence ratios across states. The lightly shaded bars correspond to the 90% prediction intervals that denote the range within which prevalence ratios would fall for 90% of states were a different set of states to be drawn. The prediction intervals estimate the between-state variability of the true prevalence ratios of the state populations.
aOther includes Native Hawaiian, Pacific Islander, American Indian, Alaska Native, and Asian.
bExpansion adults are enrollees newly eligible under the Affordable Care Act in a Medicaid expansion adopted in 2014 and 2015.
Discussion
Drawing on data from 11 state Medicaid programs participating in a distributed research network, this study reported substantial improvements in use of medications for OUD from 2014 to 2018. Yet there were important gaps in treatment along with substantial variability across states.
Several factors may explain increased use of medications for OUD in these 11 states. Some states broadened coverage of and loosened restrictions on medications for OUD.4 Increased rates of treatment may reflect states’ use of federal funds to enhance treatment capacity.29 Reduced stigma may have contributed to increased treatment.30 Improved understanding of factors driving increased use of medications for OUD is crucial to closing remaining treatment gaps. In these 11 states in 2018, 43% of Medicaid enrollees diagnosed with OUD did not receive medication treatment, results that are consistent with those reported from other data sources31 with the advantage of more timely data. Whether state-level variability in use of medications for OUD was due to differences in policy requires further study.
The sizeable increase observed in the number of Medicaid enrollees with OUD may have been due in part to the ACA expanding Medicaid coverage. Eight of 11 states expanded Medicaid during the study period, 2 others expanded after 2018 (with retroactive eligibility to mid-2018 for 1 state), and a third adopted a non-ACA expansion. By 2018, 50.7% of enrollees with OUD in these 11 states were eligible via ACA Medicaid expansion. These findings build on prior work32,33 pointing to the importance of the ACA for increasing access to care for low-income persons with OUD.
Validated quality measures for medications for OUD are lacking, and treatment guidelines may issue conflicting recommendations on optimal components of medication treatment for OUD.34,35,36 Although this study reported higher rates of continuity of medications for OUD than in prior claims-based studies,15,19 in the 2017-2018 period, overall only 56.0% of enrollees in these 11 states received 180 days of medications for OUD with variation across states. Among Medicaid enrollees receiving medications for OUD, there was an increase in behavioral health counseling and reductions in prescription opioid and benzodiazepine fills, indicators routinely tracked by some Medicaid programs and reported in prior studies.15,16 Recent evidence should inform development and validation of new quality indicators for medication treatment of OUD with the strongest likelihood of improving outcomes.14
Several enrollee characteristics were associated with treatment with OUD medications in Medicaid. The prediction intervals for some of these estimated associations point to substantial state to state variability in these subgroup differences. Non-Hispanic Black enrollees had substantially lower rates of any medications for OUD compared with White enrollees. These racial disparities in OUD treatment have been reported by other studies18,37 and warrant focused attention by health systems and policy makers.38 Urban-rural differences in medications for OUD were inconsistent across states. Although prior studies documented lower access in rural areas to clinicians delivering medications for OUD,39 higher rates of treatment in rural areas in some states may have reflected greater availability of these services.40 Higher rates of initiation and continuity of medications for OUD among pregnant women relative to other eligibility groups may have been due to increased health system contact and prenatal screening for substance use disorders.
Limitations
This exploratory study has several limitations. First, OUD diagnosis codes in claims have limited sensitivity and specificity.27,28 This study may have underestimated the prevalence of OUD if diagnoses were only coded when individuals were in active treatment. Alternatively, to the extent that clinicians applied an OUD diagnosis to patients with chronic opioid use who did not meet diagnostic criteria for OUD, this study may have overestimated prevalence. Sensitivity analyses support the conclusion that use of OUD medications increased, even if true rates of treatment are challenging to measure in claims. Second, claims contain limited or no information on illness severity or patient preferences that may confound some of the observed associations. Third, study data did not capture OUD treatment not paid for by Medicaid. Two of the 11 states did not cover methadone in Medicaid during the study period, possibly resulting in an underestimate of treatment rates in those states. Fourth, the supply of clinicians and facilities delivering medications for OUD may explain much of the observed variation; however, a full examination of clinician supply was beyond the scope of this study. Fifth, the 11 states in this analysis are geographically concentrated, include many with high overdose death rates, and were more likely to have expanded Medicaid under the ACA. Thus, study findings may not generalize to other state Medicaid programs. Sixth, this study used data from 2014 through 2018 and given the dynamic nature of the opioid use epidemic and the influence of the COVID-19 pandemic on opioid use and availability of OUD treatment, it is uncertain whether and how the findings from this study are applicable in 2021.
Conclusions
Among US Medicaid enrollees in 11 states, the prevalence of medication use for treatment of opioid use disorder increased from 2014 through 2018. The pattern in the other states requires further research.
eAppendix 1. Medications for opioid use disorder (OUD) measure
eAppendix 2. Continuity of medications for OUD measure
eAppendix 3. Urine drug tests for enrollees with medications for OUD
eAppendix 4. Behavioral health counseling for enrollees with medications for OUD
eAppendix 5. Any opioid fills among enrollees with medications for OUD
eAppendix 6. Any benzodiazepine fill among enrollees with medications for OUD
eTable 1. Income eligibility thresholds for eligibility groups, by state
eTable 2. International classification of diseases (ICD) 9 and 10 diagnosis codes used to define behavioral health comorbidities
eAppendix 7. Calculation of the prediction interval
eFigure 1. Percent of Medicaid enrollees diagnosed with OUD with any use of buprenorphine, methadone or naltrexone, 2014-2018 in 11 states
eFigure 2. Percent of enrollees diagnosed with OUD who receive any medications for opioid use disorder, by traditionally eligible and Expansion group, 2014-2018
eFigure 3. Number of Medicaid enrollees with medications for OUD among those with an OUD diagnosis and among all Medicaid enrollees regardless of diagnosis
eTable 3. Results from random effect meta-analysis for the outcome receiving any medications for OUD
eTable 4. Results from random effect meta-analysis for the outcome continuity of medications for OUD
eReferences
Nonauthor Collaborators. Medicaid Outcomes Distributed Research Network (MODRN).
References
- 1.Larochelle MR, Bernson D, Land T, et al. Medication for opioid use disorder after nonfatal opioid overdose and association with mortality: a cohort study. Ann Intern Med. 2018;169(3):137-145. doi: 10.7326/M17-3107 [DOI] [PMC free article] [PubMed] [Google Scholar]
- 2.Kaiser Family Foundation . Medicaid’s role in addressing the opioid epidemic. Published 2018. Accessed May 14, 2018. https://www.kff.org/infographic/medicaids-role-in-addressing-opioid-epidemic/
- 3.McCarty D, Gu Y, McIlveen JW, Lind BK. Medicaid expansion and treatment for opioid use disorders in Oregon: an interrupted time-series analysis. Addict Sci Clin Pract. 2019;14(1):31. doi: 10.1186/s13722-019-0160-6 [DOI] [PMC free article] [PubMed] [Google Scholar]
- 4.Report to Congress: utilization management of medication-assisted treatment in Medicaid. Medicaid and CHIP Payment and Access Commission. October 2019. Accessed June 13, 2021. https://www.macpac.gov/publication/report-to-congress-utilization-management-of-medication-assisted-treatment-in-medicaid/
- 5.Barnes AJ, Cunningham PJ, Saxe-Walker L, et al. Hospital use declines after implementation of Virginia Medicaid’s addiction and recovery treatment services. Health Aff (Millwood). 2020;39(2):238-246. doi: 10.1377/hlthaff.2019.00525 [DOI] [PubMed] [Google Scholar]
- 6.Shen K, Barrette E, Dafny LS. Treatment of opioid use disorder among commercially insured US adults, 2008-17. Health Aff (Millwood). 2020;39(6):993-1001. doi: 10.1377/hlthaff.2019.01041 [DOI] [PubMed] [Google Scholar]
- 7.Clemans-Cope L, Lynch V, Winiski E, Epstein M. State variation in Medicaid prescriptions for opioid use disorder from 2011 to 2018. Urban Institute. Published August 2019. Accessed June 13, 2021. https://www.urban.org/research/publication/state-variation-medicaid-prescriptions-opioid-use-disorder-2011-2018
- 8.Roberts AW, Saloner B, Dusetzina SB. Buprenorphine use and spending for opioid use disorder treatment: trends from 2003 to 2015. Psychiatr Serv. 2018;69(7):832-835. doi: 10.1176/appi.ps.201700315 [DOI] [PMC free article] [PubMed] [Google Scholar]
- 9.Academy Health . Medicaid Outcomes Distributed Research Network (MODRN). Accessed June 20, 2020.https://www.academyhealth.org/MODRN
- 10.Centers for Disease Control and Prevention . 2018. drug overdose death rates. Last reviewed March 22, 2021. Accessed June 20, 2020. https://www.cdc.gov/drugoverdose/data/statedeaths/drug-overdose-death-2018.html
- 11.Toh S, Platt R, Steiner JF, Brown JS. Comparative-effectiveness research in distributed health data networks. Clin Pharmacol Ther. 2011;90(6):883-887. doi: 10.1038/clpt.2011.236 [DOI] [PubMed] [Google Scholar]
- 12.National Quality Forum . Continuity of pharmacotherapy for opioid use disorder (OUD)–national quality strategy domain: effective clinical care–meaningful measure area: prevention and treatment of opioid and substance use disorders. Published 2019. Accessed July 21, 2020. https://qpp.cms.gov/docs/QPP_quality_measure_specifications/CQM-Measures/2019_Measure_468_MIPSCQM.pdf
- 13.National Quality Forum . Opioids and opioid use disorder: quality measurement priorities. Published February 2020. Accessed July 21, 2020. https://www.qualityforum.org/Publications/2020/02/Opioids_and_Opioid_Use_Disorder__Quality_Measurement_Priorities.aspx
- 14.Martin SA, Chiodo LM, Bosse JD, Wilson A. The next stage of buprenorphine care for opioid use disorder. Ann Intern Med. 2018;169(9):628-635. doi: 10.7326/M18-1652 [DOI] [PubMed] [Google Scholar]
- 15.Watkins KE, Paddock SM, Hudson TJ, et al. Association between process measures and mortality in individuals with opioid use disorders. Drug Alcohol Depend. 2017;177:307-314. doi: 10.1016/j.drugalcdep.2017.03.033 [DOI] [PMC free article] [PubMed] [Google Scholar]
- 16.Gordon AJ, Lo-Ciganic WH, Cochran G, et al. Patterns and quality of buprenorphine opioid agonist treatment in a large Medicaid program. J Addict Med. 2015;9(6):470-477. doi: 10.1097/ADM.0000000000000164 [DOI] [PubMed] [Google Scholar]
- 17.Park TW, Larochelle MR, Saitz R, Wang N, Bernson D, Walley AY. Associations between prescribed benzodiazepines, overdose death and buprenorphine discontinuation among people receiving buprenorphine. Addiction. 2020;115(5):924-932. doi: 10.1111/add.14886 [DOI] [PMC free article] [PubMed] [Google Scholar]
- 18.Neighbors CJ, Choi S, Healy S, Yerneni R, Sun T, Shapoval L. Age related medication for addiction treatment (MAT) use for opioid use disorder among Medicaid-insured patients in New York. Subst Abuse Treat Prev Policy. 2019;14(1):28. doi: 10.1186/s13011-019-0215-4 [DOI] [PMC free article] [PubMed] [Google Scholar]
- 19.Samples H, Williams AR, Olfson M, Crystal S. Risk factors for discontinuation of buprenorphine treatment for opioid use disorders in a multi-state sample of Medicaid enrollees. J Subst Abuse Treat. 2018;95:9-17. doi: 10.1016/j.jsat.2018.09.001 [DOI] [PMC free article] [PubMed] [Google Scholar]
- 20.Economic Research Service, US Department of Agriculture . Rural urban commuting area codes. Published 2019. Accessed August 5, 2020. https://www.ers.usda.gov/data-products/rural-urban-commuting-area-codes/
- 21.Liang K, Zeger S. Longitudinal data analysis using generalized linear models. Biometrika. 1986;73:13-22. doi: 10.1093/biomet/73.1.13 [DOI] [Google Scholar]
- 22.Toh S, Gagne JJ, Rassen JA, Fireman BH, Kulldorff M, Brown JS. Confounding adjustment in comparative effectiveness research conducted within distributed research networks. Med Care. 2013;51(8)(suppl 3):S4-S10. doi: 10.1097/MLR.0b013e31829b1bb1 [DOI] [PubMed] [Google Scholar]
- 23.Toh S, Shetterly S, Powers JD, Arterburn D. Privacy-preserving analytic methods for multisite comparative effectiveness and patient-centered outcomes research. Med Care. 2014;52(7):664-668. doi: 10.1097/MLR.0000000000000147 [DOI] [PubMed] [Google Scholar]
- 24.Deeks JJ, Higgins JP, Altman DG; Cochrane Statistical Methods Group . Analysing data and undertaking meta-analyses. In: Green S, ed. Cochrane Handbook for Systematic Reviews of Interventions. Wiley Blackwell. 2019:241-284. doi: 10.1002/9781119536604.ch10 [DOI] [Google Scholar]
- 25.IntHout J, Ioannidis JP, Borm GF. The Hartung-Knapp-Sidik-Jonkman method for random effects meta-analysis is straightforward and considerably outperforms the standard DerSimonian-Laird method. BMC Med Res Methodol. 2014;14(1):25. doi: 10.1186/1471-2288-14-25 [DOI] [PMC free article] [PubMed] [Google Scholar]
- 26.Borenstein M, Hedges LV, Higgins JPT, Rothstein HR. A basic introduction to fixed-effect and random-effects models for meta-analysis. Res Synth Methods. 2010;1(2):97-111. doi: 10.1002/jrsm.12 [DOI] [PubMed] [Google Scholar]
- 27.Carrell DS, Albertson-Junkans L, Ramaprasan A, et al. Measuring problem prescription opioid use among patients receiving long-term opioid analgesic treatment: development and evaluation of an algorithm for use in EHR and claims data. J Drug Assess. 2020;9(1):97-105. doi: 10.1080/21556660.2020.1750419 [DOI] [PMC free article] [PubMed] [Google Scholar]
- 28.Howell BA, Abel EA, Park D, Edmond SN, Leisch LJ, Becker WC. Validity of incident opioid use disorder (OUD)diagnoses in administrative data: a chart verification study. J Gen Intern Med. 2021;36(5):1264-1270. doi: 10.1007/s11606-020-06339-3 [DOI] [PMC free article] [PubMed] [Google Scholar]
- 29.Bipartisan Policy Center . Tracking federal funding to combat the opioid crisis. Published 2019. Accessed June 13, 2021. https://bipartisanpolicy.org/wp-content/uploads/2019/03/Tracking-Federal-Funding-to-Combat-the-Opioid-Crisis.pdf
- 30.Cunningham P, Woodcock C, Clark M, et al. Expanding access to addiction treatment services through Section 1115 waivers for substance use disorders: experiences from Virginia and Maryland. AcademyHealth. Published April 2020. Accessed June 13, 2021. https://www.academyhealth.org/sites/default/files/expandingaccesstoaddictiontreatmentthrough1115waivers_april2020.pdf
- 31.Azar A II. US Department of Health and Human Services. Report to Congress, T-MSIS substance use disorder (SUD) data book, treatment of SUD in Medicaid, 2017. Published October 24, 2019. Accessed August 25, 2020. https://www.medicaid.gov/medicaid/data-and-systems/downloads/macbis/sud-data-book.pdf
- 32.Cher BAY, Morden NE, Meara E. Medicaid expansion and prescription trends: opioids, addiction therapies, and other drugs. Med Care. 2019;57(3):208-212. doi: 10.1097/MLR.0000000000001054 [DOI] [PMC free article] [PubMed] [Google Scholar]
- 33.Wen H, Hockenberry JM, Borders TF, Druss BG. Impact of Medicaid expansion on Medicaid-covered utilization of buprenorphine for opioid use disorder treatment. Med Care. 2017;55(4):336-341. doi: 10.1097/MLR.0000000000000703 [DOI] [PubMed] [Google Scholar]
- 34.American Society of Addiction Medicine . The ASAM national practice guideline for the treatment of opioid use disorder 2020 focused update. Adopted by the board of directors December 18, 2019. Accessed June 13, 2021. https://www.asam.org/docs/default-source/quality-science/npg-jam-supplement.pdf
- 35.Department of Veterans Affairs, Department of Defense . VA/DoD clinical practice guideline for the management of substance. Published 2015. Accessed June 13, 2021. https://www.healthquality.va.gov/guidelines/mh/sud/
- 36.Substance Abuse and Mental Health Services Administration . Medications for Opioid Use Disorder: Treatment Improvement Protocol (TIP 63). Substance Abuse and Mental Health Services Administration; 2020. [Google Scholar]
- 37.Cole ES, DiDomenico E, Cochran G, et al. The role of primary care in improving access to medication-assisted treatment for rural Medicaid enrollees with opioid use disorder. J Gen Intern Med. 2019;34(6):936-943. doi: 10.1007/s11606-019-04943-6 [DOI] [PMC free article] [PubMed] [Google Scholar]
- 38.Hansen H, Siegel C, Wanderling J, DiRocco D. Buprenorphine and methadone treatment for opioid dependence by income, ethnicity and race of neighborhoods in New York City. Drug Alcohol Depend. 2016;164:14-21. doi: 10.1016/j.drugalcdep.2016.03.028 [DOI] [PMC free article] [PubMed] [Google Scholar]
- 39.Andrilla CHA, Moore TE, Patterson DG, Larson EH. Geographic distribution of providers with a DEA waiver to prescribe buprenorphine for the treatment of opioid use disorder: a 5-year update. J Rural Health. 2019;35(1):108-112. doi: 10.1111/jrh.12307 [DOI] [PubMed] [Google Scholar]
- 40.Stein BD, Pacula RL, Gordon AJ, et al. Where is buprenorphine dispensed to treat opioid use disorders? the role of private offices, opioid treatment programs, and substance abuse treatment facilities in urban and rural counties. Milbank Q. 2015;93(3):561-583. doi: 10.1111/1468-0009.12137 [DOI] [PMC free article] [PubMed] [Google Scholar]
Associated Data
This section collects any data citations, data availability statements, or supplementary materials included in this article.
Supplementary Materials
eAppendix 1. Medications for opioid use disorder (OUD) measure
eAppendix 2. Continuity of medications for OUD measure
eAppendix 3. Urine drug tests for enrollees with medications for OUD
eAppendix 4. Behavioral health counseling for enrollees with medications for OUD
eAppendix 5. Any opioid fills among enrollees with medications for OUD
eAppendix 6. Any benzodiazepine fill among enrollees with medications for OUD
eTable 1. Income eligibility thresholds for eligibility groups, by state
eTable 2. International classification of diseases (ICD) 9 and 10 diagnosis codes used to define behavioral health comorbidities
eAppendix 7. Calculation of the prediction interval
eFigure 1. Percent of Medicaid enrollees diagnosed with OUD with any use of buprenorphine, methadone or naltrexone, 2014-2018 in 11 states
eFigure 2. Percent of enrollees diagnosed with OUD who receive any medications for opioid use disorder, by traditionally eligible and Expansion group, 2014-2018
eFigure 3. Number of Medicaid enrollees with medications for OUD among those with an OUD diagnosis and among all Medicaid enrollees regardless of diagnosis
eTable 3. Results from random effect meta-analysis for the outcome receiving any medications for OUD
eTable 4. Results from random effect meta-analysis for the outcome continuity of medications for OUD
eReferences
Nonauthor Collaborators. Medicaid Outcomes Distributed Research Network (MODRN).