Abstract
Introduction
Improving the healthcare system is a major public health challenge. Collaborative learning health systems (CLHS) ‐ network organizations that allow all healthcare stakeholders to collaborate at scale ‐ are a promising response. However, we know little about CLHS mechanisms of actions, nor how to optimize CLHS performance. Agent‐based models (ABM) have been used to study a variety of complex systems. We translate the conceptual underpinnings of a CLHS to a computational model and demonstrate initial computational and face validity.
Methods
CLHSs are organized to allow stakeholders (patients and families, clinicians, researchers) to collaborate, at scale, in the production and distribution of information, knowledge, and know‐how for improvement. We build up a CLHS ABM from a population of patient‐ and doctor‐agents, assign them characteristics, and set them into interaction, resulting in engagement, information, and knowledge to facilitate optimal treatment selection. To assess computational and face validity, we vary a single parameter ‐ the degree to which patients influence other patients ‐ and trace its effects on patient engagement, shared knowledge, and outcomes.
Results
The CLHS ABM, developed in Python and using the open‐source modeling framework Mesa, is delivered as a web application. The model is simulated on a cloud server and the user interface is a web browser using Python and Plotly Dash. Holding all other parameters steady, when patient influence increases, the overall patient population activation increases, leading to an increase in shared knowledge, and higher median patient outcomes.
Conclusions
We present the first theoretically‐derived computational model of CLHSs, demonstrating initial computational and face validity. These preliminary results suggest that modeling CLHSs using an ABM is feasible and potentially valid. A well‐developed and validated computational model of the health system may have profound effects on understanding mechanisms of action, potential intervention targets, and ultimately translation to improved outcomes.
Keywords: agent‐based model, behavior modeling, complex systems, complexity, computer simulation, model, system science
1. INTRODUCTION
Improving the healthcare system is arguably one of the most pressing public health challenges of our time. The current healthcare system is unreliable, 1 , 2 error‐prone 3 , 4 , 5 and costly. 6 , 7 Improving it could save hundreds of thousands of lives and billions of dollars. As a remedy, the National Academies put forth the idea of a “Learning Healthcare System,” (LHS) 8 which could be broadened to a “Learning Health System” by including other determinants of health besides the healthcare system. 9 In an LHS, patients, clinicians, and researchers work together to choose care based on best evidence, and to drive discovery and learning as a natural outgrowth of every clinical encounter to ensure innovation, quality and value at the point of care. Translating data to knowledge, knowledge to performance, and performance to data is sometimes referred to as The Learning Cycle. 10 Until recently, however, such a model has remained mostly aspirational.
Collaborative learning health systems (CLHSs) ‐ network organizations that allow all healthcare stakeholders to collaborate at scale ‐ are a potential pathway to transforming the healthcare system toward an LHS. CLHSs are enduring communities of patients/families, clinicians, researchers, and improvers aligned around a common goal and organized in such a way as to facilitate multistakeholder collaboration at scale. Several examples have shown remarkable outcomes improvement across a diverse set of conditions; cutting serious safety events by 50%, 11 hypoplastic left heart syndrome mortality by 40%, 12 elective preterm delivery by 75%, 13 and increasing by 26% the proportion of children with inflammatory bowel disease in remission. 14 However, there are major gaps in our knowledge: We know little about the mechanisms by which CLHSs achieve these outcomes, the best strategies for designing new CLHSs and optimizing CLHS performance, and how widely and under what conditions CLHSs might thrive. There is a critical need for a model learning health system to interrogate CLHS mechanisms of action and drive theory‐derived hypothesis generation. Without this, further improving CLHS effectiveness and scaling to meaningfully change the healthcare system will be inefficient and dependent entirely upon experimental learning.
Computational models have yielded useful insights into complex human systems. 15 Different methodologies are available for modeling time‐varying social systems, including system dynamics and agent‐based approaches. 16 Agent‐based models (ABMs) explicitly include agents (individuals) that interact with one another according to rules and relations in a defined environment, whereas system dynamics models average over variable agent‐agent interactions. 17
In an ABM, the internal states of agents can be allowed to vary over time in response to internal deliberations and external forces, allowing simulation of different social and learning phenomena. These features combine to enable the study of emergent collective behavior. ABMs are therefore well suited to simulate CLHSs by defining agents (eg, patients, healthcare providers) and allowing them to interact with and learn from one another according to rules based on their respective goals (eg, achieve remission, improve quality of life) and constraints are given by the environment (eg, policies and technologies regarding information sharing).
The particular advantages of ABM 18 vs other modeling approaches derive from its flexibility and ability to handle the challenges of heterogeneity (eg, differences in patient illness severity, clinician attitudes, or agent experience), spatial structure (eg, practice panels in which multiple patients are cared for in a single practice, social networks, or access to care), and adaptation (eg, how interactions between and among patients and physicians can influence subsequent attitudes, behaviors, treatment choices, and symptoms). Further, ABMs can model these across multiple levels of scale. Agents can be modeled at different levels of scale, for example, “patient” or “hospital” agents, and mechanisms can be considered at different levels (an individual's health outcome may be modeled as a function of their own behavior, the behavior of clinicians, and/or the behavior of practice or network of practices).
Theory‐ and data‐driven computational models of human and complex systems have yielded useful insights into agency problems (such as free‐riding and shirking) in open innovation communities, 19 the epidemiology of the infectious disease, 20 , 21 and the spread of human behavior such as smoking 22 and cooperation. 23 How potential drivers of CLHS performance combine to produce observed results is not completely understood. Nor is it known how to optimize CLHSs to achieve the most desirable results in the shortest time possible. As in other fields, simulating a “model” CLHS via computational models may produce important insights into such questions. Here, we describe the conceptual underpinnings of a CLHS ABM and how these are translated into a model, and demonstrate initial computational and face validity.
2. METHODS
2.1. Conceptual model
CLHSs are effective in part because they are organized in such a way as to allow stakeholders (patients and families, clinicians, researchers) to collaborate, at scale, in the production and distribution of information, knowledge, and know‐how for improvement. 7 An “actor‐oriented architecture” (AOA) 7 describes organizational characteristics that facilitate such collaboration, including having (a) sufficient numbers of actors with the values and skills to self‐organize; (b) a commons where actors create and share resources; and (c) processes, protocols, and structures that make it easier to form functional teams. The AOA has been used to explain collaborative communities across a variety of industries and the military. 7 It is thought that CLHSs achieve collaboration at scale by implementing the AOA 24 and we have shown previously that one CLHS has executed interventions consistent with the AOA. 25
Predicated on the idea that outcomes for a given population are maximized by matching each individual patient to the best treatment(s), 26 , 27 we assert that well‐functioning CLHSs improve the patient‐treatment matching process and its implementation. Our ABM is designed to investigate this matching process at the level of the clinical encounter and how a CLHS can facilitate this matching process. The model is meant to be used for learning, not point prediction: It is structured so that the parts of the model and their interactions are apparent and modifiable, thereby supporting critical thinking and hypothesis building regarding the operation of CLHSs. Stakeholders can set parameters and starting conditions and compare model outputs under different conditions.
The model is built around a core module representing factors that determine patient‐treatment matching (both the initial match and its iterative improvement). This module is informed by Wagner's Chronic Care Model, 28 which focuses on six areas (self‐management support, delivery system design, decision support, clinical information systems, organization of health care, and community) in order to foster productive interactions between informed, activated patients and prepared, proactive clinical teams. It is also informed by Fjeldstad's Actor‐Oriented Architecture (AOA), which describes an organization design that facilitates large‐scale multiparty collaboration. Both theories foreground the importance of people's active engagement, as well as the social nature of healthcare. These theories are instantiated in CLHSs as change concepts and represented in the preliminary conceptual model as parameters (Table 1). Condition‐specific modules (in this study, the condition is IBD) represent the impact of patient‐treatment matching on patient‐level outcomes. Output from the core module is represented as “knowledge” for matching patients to treatments, which serves as an input into the condition‐specific module. Using this modular approach, general lessons about the functioning of CLHSs can be translated into condition‐specific outcome curves.
TABLE 1.
Theoretical elements of CLHSs, CLHS change concepts, and representations of change concepts in the preliminary model
| Theoretical elements | CLHS change concept | Representation in preliminary model |
|---|---|---|
| Chronic Care Model | Implement all six aspects of the Chronic Care Model | Amount of data brought to clinical encounter, rules about how much information is produced, periodicity of encounters, implementation of treatment package |
| AOA ‐ Sufficient numbers of actors with the values and skills to self‐organize | Leadership to align all participants around a shared goal and to build a culture of generosity and collaboration | Rules for agent state changes (eg, becomes more active at x time‐steps, patient becomes less active if interacting with less active clinician). Rate of shared information brought to clinical encounter. Spread of activation via social network |
| AOA ‐ A commons where actors create and share resources | Platforms for creating and sharing common resources | Rate of information created that is shareable |
| Rate of shareable information that is shared | ||
| AOA ‐ Processes, protocols and structures that make it easier to form functional teams | Network governance policies that facilitate sharing, | Information spread via clinician social network |
| AOA ‐ Processes, protocols and structures that make it easier to form functional teams | Quality Improvement as a common framework and method used by all for learning and improving | Rate at which information is implemented into treatment |
| AOA ‐ Processes, protocols and structures that make it easier to form functional teams | Data registries that support clinical care, improvement, and research | Amount of shareable data available |
Note: Theoretical elements include the Chronic care model and the actor‐oriented architecture. CLHS change concepts have been shown to be common across existing CLHSs. 4 The representation of these in the preliminary model can be manipulated by stakeholders, and outcomes across different initial settings can be compared.
Wagner's conceptual model of chronic care suggests that best outcomes arise from shared decision making within productive interactions between prepared, proactive clinical teams and informed, activated patients; in other words, interactions characterized by co‐production of good care. 29 Accordingly, our model is built up from iterative interactions between patient and clinician agents. In the model, patient and clinician agents meet and, based on available data (patient, clinician, and treatment attributes), determine an initial patient‐treatment match. Patient agents are described based on their clinical phenotype and their state of being informed and activated. Hartley et al, for example, have developed a measurement architecture to characterize “engagement” within CLHSs including how engagement varies over time. 30 Clinician agents are described based on the degree to which they are prepared and proactive. Patient agents are linked many‐to‐one with clinician agents to simulate a clinical practice; patients and clinicians may also interact with others through social network connections. Patient and clinician agents interact repeatedly, bringing information to the clinical encounter. The productivity of the clinical encounter is based on the agents' states and the match between their states (eg, an active patient and encouraging clinician create more information, whereas an active agent and reluctant clinician may not). Higher levels of knowledge correspond to a higher probability of matching the patient (based on phenotype and previous response to treatments) to appropriate treatments. The goodness of this match is not, a priori, known; the agents have to interact again and evaluate treatment impact. We define information as observation of the degree to which a given treatment(s) improves outcomes for a given patient (eg, phenotype X combined with treatment Y yields outcome Z). Based on this information, agents can decide whether to continue with the current treatment or change to another.
Information (about what works, for whom) can continue to reside only with the patient‐clinician dyad, or it could spread. Simulating spread, based on our experience with CLHSs, is done by allowing some of the knowledge generated at each clinical encounter to be shared with the rest of the network, where it is accessed by other agents who in turn may opt to act on that knowledge. We define the level of knowledge as the prevalence of information in a population (eg, patients, clinicians, patient/clinician dyads). In the model, the degree to which information becomes knowledge depends on the functioning of the network. Per the Actor‐Oriented Architecture, network functioning depends on the presence of sufficient actors with the will and capability to self‐organize, a “commons” where actors can create and share resources, and ways to facilitate multi‐actor collaboration. In the model, parameters for actors include the number of each type of actor, initial characteristics (eg, patient phenotype, the degree to which patients are informed and activated and clinicians are prepared and proactive), the rules under which these characteristics change (eg, patients become more active when exposed to an in‐person or online peer network 31 , 32 , 33 or when interacting with a prepared, proactive clinician; similarly, clinicians can become more prepared and proactive when exposed to peers through, for example peer‐to‐peer 34 , 35 , 36 collaboration), and the initial network structure among and between clinicians and patients (eg, patients are linked many‐to‐one to clinicians to simulate a patient panel). Parameters for the commons include how much information is available, the rate at which information generated at the point of care is captured, and the rate at which captured information is sharable. Parameters for facilitating collaboration include those governing how often patients and clinicians interact, the rules for determining how and how much information is produced at each clinical interaction (eg, an active patient and encouraging clinician create more information, whereas an active patient and reluctant clinician may not), the rate at which information is spread across patient‐patient and clinician‐clinician networks, and the rate at which information is reliably implemented into the chosen patient‐treatment match. Translation of knowledge into outcomes is tailored to specific conditions and populations, based on published evidence of treatment effects, as well as the heterogeneity of the effects, and on consultation with clinical and patient subject‐matter experts. The stochastic model, for each combination of the generic core parameters, is run multiple times to generate an “outcomes curve” an with associated confidence interval.
2.2. Model structure and relationships
Developing a simulation model is best performed as an iterative process. 37 , 38 , 39 The modeler creates a structural diagram of the model elements and their relationships, how they are hypothesized to interact. The diagram is an abstraction of the intended model, with many details not shown. The model elements and interactions are then encoded in a simulation language, making explicit those elided details. The process of encoding in a simulation language is itself a learning process, typically resulting in changes to the abstract diagram, as mistakes in the initial diagram become clear. Once corrected, the model is simulated, and the results are examined. The simulation also results in learning, typically with further corrections both to the model and to the structural diagram. Often there are many such iterations, until the desired structure and behavior are captured. Figure 1 illustrates the learning cycles of iterative simulation model construction.
FIGURE 1.
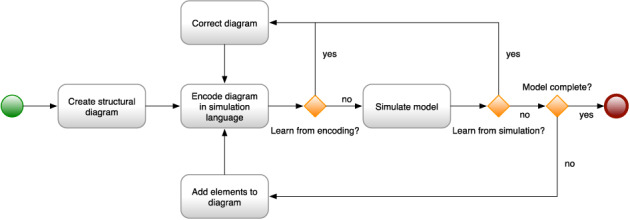
The process of developing a simulation model
The structural diagram is a useful artifact of the modeling process, useful for communicating about the model. The structural diagram is employed to communicate between the modeler and subject matter experts who may not know the arcane details of the simulation language in which the model is encoded. They can reason about the model and its behavior solely at the level of the structural diagram. The structural diagram is also used to communicate with other people interested in the model elements and how it works.
Figure 2 is the structural diagram for our CLHS model, showing model elements: agents, variables, relationships, stocks, and parameters. Figure 2 can be read by tracing through the diagram, model element by model element, and understanding how each model elements is influenced by other model elements, as follows (terms introduced in bold):
FIGURE 2.
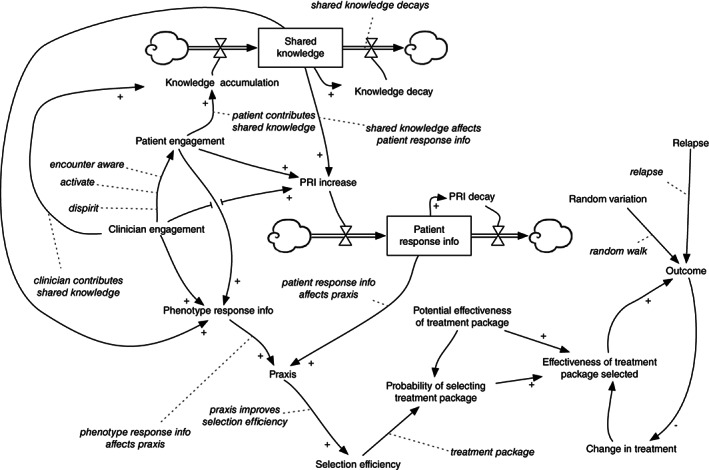
CLHS ABM representation of the entire set of agents, relationships, stocks, and parameters
Agents in the model include patients and physicians. Each patient has an Outcome variable, a measure of the patient's medical condition that varies over time, on a scale between 0.0 (worst health) and 1.0 (good health). (Median outcome—across all patients in a CLHS—is shown in Figure 4). When simulated, Outcome for each patient varies a bit randomly from week to week, sometimes dropping, for example, by 0.02, sometimes climbing, for example, by 0.01, per the Random Variation variable for each patient. The outcome for a patient is also subject to occasional relapse (Relapse), in which Outcome suddenly declines dramatically, for example, by 0.5.
FIGURE 4.
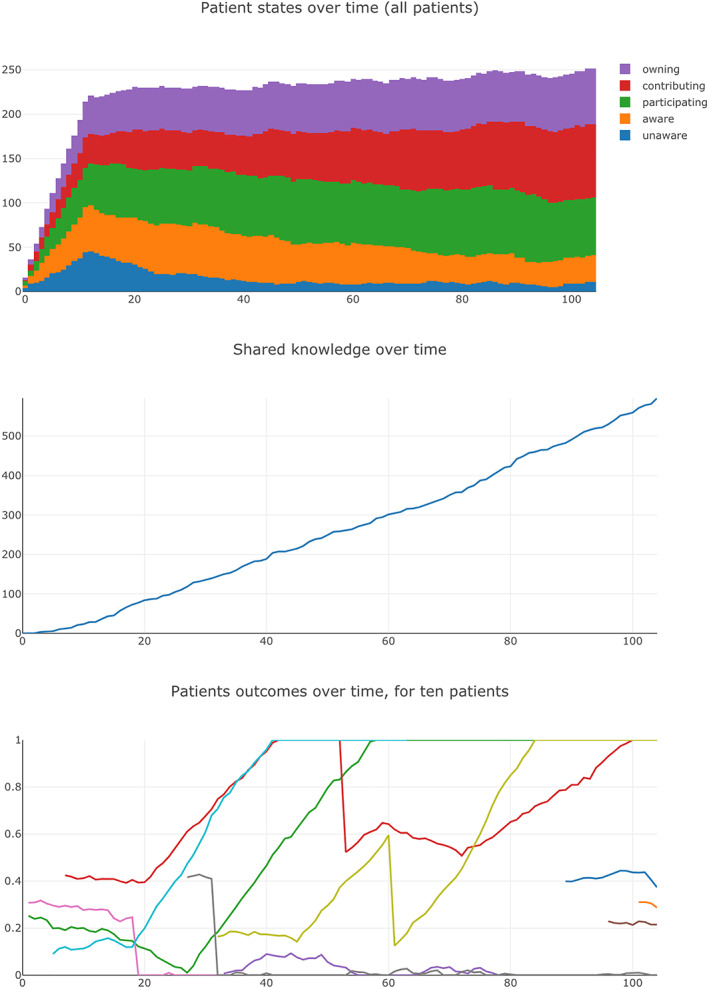
Screenshots of selected CLHS ABM output
Outcome is affected by Effectiveness of Treatment Package Selected, another variable for each patient. For a particular patient and a particular treatment package, the effectiveness may be positive to some degree (a good match between patient needs and resources provided)—improving Outcome each week (all things being equal)—or it may be negative to some degree (a poor match)—making Outcome worse each week. Periodically, the patient's clinician will examine her perception of Outcome (for that patient) and if Outcome does not appear to be sufficiently improving, may change the patient to a different treatment package (Change in Treatment), one she thinks will be more effective for the patient. Of course she may be mistaken, and the newly selected treatment package may also lead to a decline in Outcome.
Each patient has a phenotype, which determines Effectiveness of Treatment Package Selected. All patients with the same phenotype who are treated with the same package have the same effectiveness, a simplifying assumption. Each treatment package has a Potential Effectiveness of Treatment Package, a statistical distribution across the phenotypes.
For each patient and treatment package, there is a probability of the patient's clinician selecting that treatment package: Probability of Selecting Treatment Package. The probability depends on the effectiveness of the treatment package for that patient's phenotype, and also depends on the clinician's ability to select an effective treatment for that patient: her Selection Efficiency. A clinician with high Selection Efficiency (for a particular patient) is likely to select an effective treatment package for that patient. A clinician with lower Selection Efficiency is less likely to select an effective treatment. With a low enough Selection Efficiency, the clinician is no better than random in her selection (Note that even random selection may ultimately improve a patient's outcome, either because a selection was lucky or because an unlucky selection results in reduced outcomes that are ultimately noticed by the clinician, and she tries another treatment package.).
Selection Efficiency of a particular clinician for a particular patient is determined by Praxis, her knowledge, and skill for that patient. Praxis is affected by two independent influences: her knowledge of how different phenotypes respond to different treatments (Phenotype Response Information) and her knowledge of how that particular patient is responding to his current treatment (Patient Response Information [PRI]).
PRI (for a particular patient) changes week to week, increasing when PRI Increase is greater than PRI Decay, decreasing when PRI Decay is greater than PRI Increase. PRI Decay occurs each week as the information ages, and is forgotten or no longer relevant. PRI Increase is affected by Patient Engagement in the CLHS; for example, an engaged patient may carefully record his daily response to the treatment in a journal, and share that journal with his clinician. PRI Increase is affected by Clinician Engagement in the CLHS, for example, a disengaged clinician may not be interested in examining her patient's carefully collected journal. PRI Increase is also affected by Shared Knowledge (Figure 4), the amount of knowledge about the medical condition shared among all participants in the CLHS. For example, a patient may learn how to record his daily response to his treatment from a video created by another patient.
Like Patient Response Information for a particular patient, Shared Knowledge for the whole CLHS also changes week to week, increasing when Knowledge Accumulation is greater than Knowledge Decay, decreasing when Knowledge Decay is greater than Knowledge Accumulation. Knowledge Decay occurs gradually each week, as knowledge loses relevance, is lost or misplaced, and becomes difficult to access due to changes in the access technology. Knowledge Accumulation is affected by Patient Engagement. For example, an engaged patient may create a video about how he measures and records his treatment responses in a journal, and share that video with other patients in the CLHS. Clinician Engagement also affects Knowledge Accumulation, for example, a clinician may share her experiences of a particular treatment package with other clinicians in the CLHS.
Phenotype Response Information—a clinician's knowledge of how various patient phenotypes responds to different treatments—is affected by Clinician Engagement, her engagement in the CLHS to learn from her experiences. It is affected by Patient Engagement: the clinician is more likely to learn about the effect of a treatment from an engaged patient. Phenotype Response Information is also affected by Shared Knowledge; for example, the clinician may learn about how a treatment affects phenotypes from the knowledge shared by other clinicians.
Both Clinician Engagement and Patient Engagement change over time, as a participant becomes more or less engaged in the CLHS (see Figure 4). Furthermore, the engagement level of a clinician can affect that of her patients: for example, if a patient sees that his clinician is not engaged with the CLHS, he may become less engaged.
Thus, the model has many parameters that can be manipulated, but the model itself can be investigated systematically by focusing on one or a small number of parameters, performing multiple runs of the model, aggregating the results as necessary, and tracing the influence of these parameters on the outputs of interest.
2.3. Model implementation
The ABM model is developed in Python and utilizes the open source agent‐based modeling framework Mesa. 40 Patients and clinicians are modeled as individual agents, with behaviors relevant for their roles. For example, each patient has a phenotype defined by response potential to various treatment packages, and a time‐varying outcome. The ABM is delivered as a web application, with the model simulated on a cloud server, and the model user interface presented in a web browser. As a web application, the ABM is accessible to anyone anywhere, as long as they have the right security credentials. The user interface is developed in Python, using the open source web application framework Plotly Dash. 41
Figure 3 is a screenshot of part of the user interface for the ABM. Each question listed in Figure 3A has several parameters. For example, “Patients influence other patients?” has a set of parameters, shown in Figure 3B, including the number of patients other patients influence and the annual probability of influence. Similarly, “Patients contribute to shared knowledge?” and “Clinicians contribute to shared knowledge?” have parameters associated with the periodicity and amount of knowledge contributed by patients at difference levels of engagement (Figure 3C).
FIGURE 3.
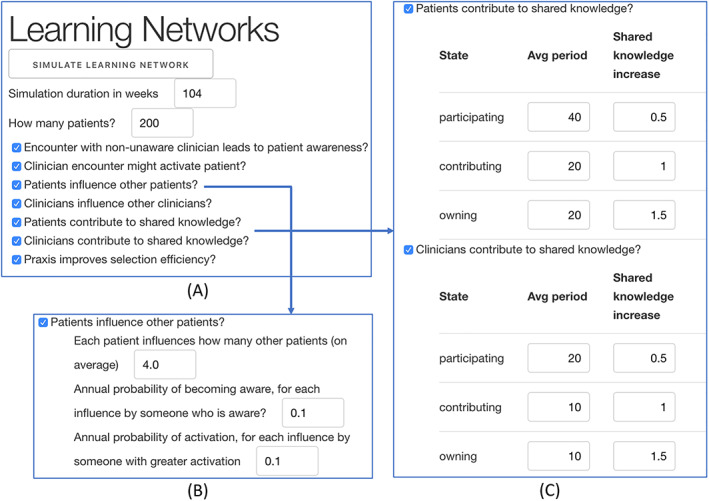
Selected screen shots of CLHS ABM user interface
Figure 4 is a screenshot of selected outputs for an individual run. In this case, a count of patient states over time (top), shared knowledge over time (middle), and median patient outcome over time (bottom).
The model currently features a spartan user interface, sufficient to support experimentation by the modeling team, but without the features or the user experience design needed for use by other CLHS practitioners. We plan to create a feature‐rich, easy‐to‐use user interface for the model, and host it such that CLHS leaders outside our organization can use it.
2.4. Approach
Recall that part of our theory suggests that patients may influence other patients to be more engaged (“Patient Population Activation”) and, similarly, that clinicians may influence other clinicians to be more engaged. Increased engagement is thought to increase shared knowledge, leading to better matching between phenotype and treatment and, thus, better outcomes. In the case of patients, this can be summarized in the logical statement (S1):
S1: Patient Influence ➔ Patient Population Activation ➔ Knowledge ➔ Outcomes.
Note that a similar logical statement could be made for clinician influence, clinician population activation, and knowledge and outcomes. As a first step toward assessing model validity, we varied a single parameter ‐ “patient influence,” that is, how many other patients each patient can influence to a higher level of engagement per year. Outputs of interest include patient population activation (the overall level of patient engagement in the CLHS), Shared Knowledge and median patient outcome (range: 0‐1).
As shown in Figure 3B, the default setting for patient influence is 4 (Each patient has a 1 in 10 probability of influencing four patients per year to a higher level of engagement). To test the effect of patient influence, we divided this default setting by whole numbers 1 through 10 (orange dots) and multiplied it by whole numbers 2 through 22 (blue dots), running the model at each setting and recording Patient Population Activation, Shared Knowledge, and Outcome for each run. In order to achieve reproducible results, we fixed the random number seed and set the cohort of patients (n = 200) to be closed (all patients enter the simulation at once and none leave due to aging out or getting better) during the course of the simulation. Figures 5, 6, 7 below show the intermediate results for each run for each step in logical statement S1 above.
FIGURE 5.
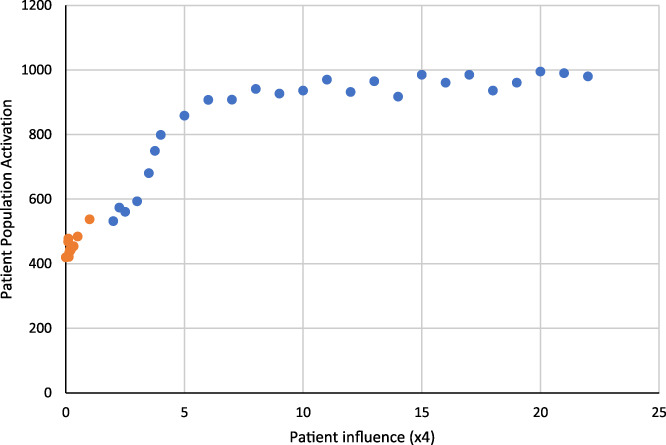
Patient population activation as a function of patient influence
FIGURE 6.
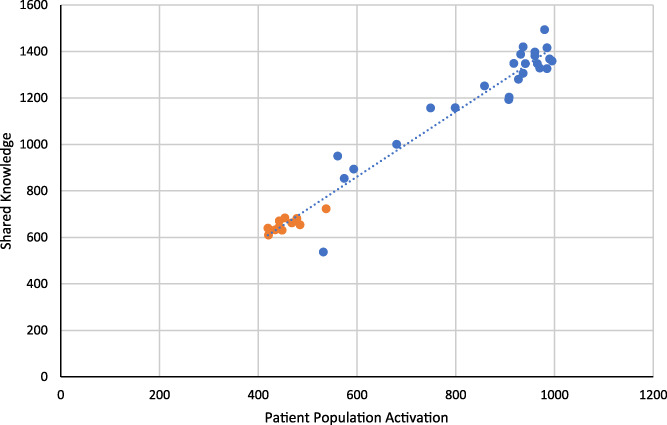
Shared knowledge as a function of patient population activation
FIGURE 7.
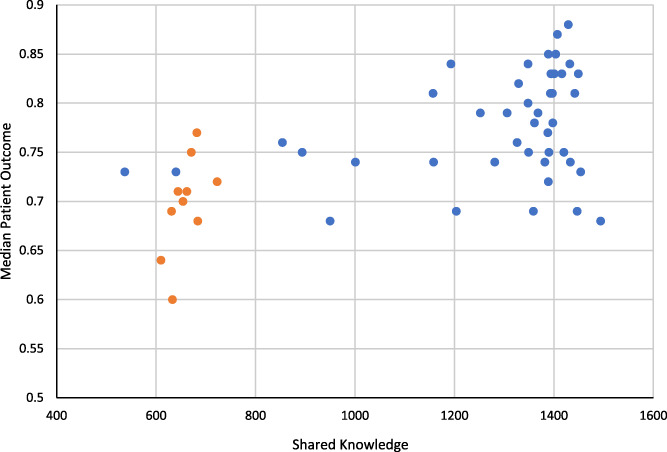
Median patient outcome as a function of shared knowledge
3. RESULTS
Patient Influence ➔ Patient Population Activation: Figure 5 shows the effect of patient influence on patient population activation. As the number of patients influenced per patient per year increases (holding all other parameters steady) in each model run, the overall patient population activation increases. It plateaus at about 7 (each patient influences 28 other patients per year) because all patient agents are maximally engaged. This association between patient influence and patient population activation, as well as a saturation effect of influence, is consistent with the theory and implementation of the model, thus supporting validity for the link between patient influence and patient population activation (the first link) in logical statement, S1.
Patient Population Activation ➔ Knowledge: Figure 6 shows the follow‐on effect of patient population activation on shared knowledge. As the patient population is increasingly engaged, the amount of shared knowledge increases. This shows that changing patient influence affects not only patient population activation, but also knowledge. Again, this is consistent with the theory and implementation of the model, thus supporting validity for the second link in logical statement, S1.
Knowledge ➔ Outcomes: Figure 7 shows median patient outcomes as a function of shared knowledge. As can be seen, there is a cluster of orange dots (patient influence default divided) and blue dots (patient influence default multiplied). Figure 8 shows these two groups of runs in a box and whisker plot ‐ decreasing patient influence, compared to increasing patient influence, is associated with lower median patient outcomes in the model. Figure 7 provides validation of the last link in the logical statement, and Figure 8 summarizes the effect of changing patient influence on the outcome.
FIGURE 8.
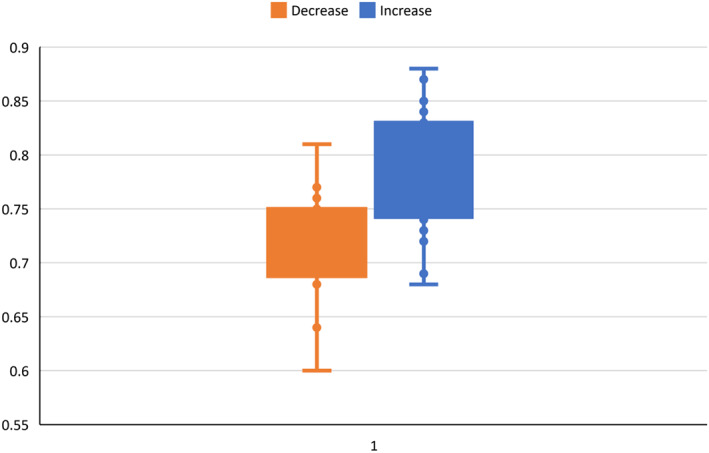
Box and whisker plot for median patient outcome; decreased and increased patient influence
Varying clinician influence in the same manner leads to substantively equivalent results on clinician population activation, knowledge, and outcomes (results not shown).
4. DISCUSSION
We have developed a CLHS agent‐based model from evidence‐based theories and have demonstrated its initial computational and face validity. To develop the CLHS ABM, we translated the theory of CLHSs into a computer‐coded set of artificial agents and programmed them to interact based on a specified set of rules. We demonstrated initial computational and face validity by tracing the effect of changes in a single parameter, in this case, how many other patients each patient influences to become more engaged, on subsequent parameters, in this case patient population activation, shared knowledge, and median patient outcome.
We structured the ABM so that individual parameters, or sets of parameters, could be systematically varied, thus enabling structured exploration of various possible CLHS future states. This is important because prospective trials of specific CLHS interventions (eg, facilitate information sharing, increase the number of active patients) on CLHS outcomes are unwieldy, time‐consuming, and costly. Much like a “mouse model” in basic clinical research is used to explore potential mechanisms of action and likely therapeutic targets for individual clinical conditions, so too can a computational model be used to understand how CLHSs work and how we might increase their effectiveness and efficiency. Moreover, the process of modeling is an exercise in clarifying one's theory. It forces researchers to think mechanistically about how various actors interact with one another, how to measure concepts such as “information” or “sharing,” and how changes in one part of the system might affect others. As Nobel Laureate Sir Ronald Ross wrote more than 100 years ago in the context of infectious disease epidemiology, “the mathematical method of treatment is really nothing but the application of careful reasoning to the problems at issue.” 42 Prochaska and DiClemente's transtheoretical model 43 and Damschroder's consolidated framework for implementation research (CFIR) 44 are both robust theories for change at individual and organizational levels. A model such as this could supplement and further explore theories such as these by simulating changes suggested by such models.
From a practical perspective, a CLHS ABM could, for example, provide insights to guide annual strategic planning. CLHSs typically undergo annual strategic planning to decide on high priority areas for improvement. Many use a network maturity grid 45 to self‐assess the maturity of processes that undergird CLHS change concepts. By reviewing these ratings holistically, CLHS leaders can identify particular processes and targets for those processes (eg, “Within the Quality Improvement domain, we intend to advance process maturity in ‘Quality Improvement Reports’ from our current state of ‘QI reports generated manually’ to ‘QI reports are produced automatically’” or “Within the Governance and Management domain, we intend to advance process maturity in ‘Accessibility to knowledge and tools’ from ‘A commons is available, but with no active curation, limited sharing’ to ‘Commons is accessible, with some curation, and some sharing’”). Without a computational model, estimates of the impact of this, or any, improvement is based on experience or intuition. A CLHS ABM could simulate the potential effects of these changes and lead to more effective planning and execution.
Traditional or typical models of learning emphasizes pedagogy and didacticism, but a modeling activity suggests a different way of learning. Moreover, the notion of coproduction 29 that is the center of this model suggests implications for both clinician and patient education, including developing different skills, expectations, and habits.
This is, to our knowledge, the first theoretically based causal modeling investigation into the functional basis and operation of CLHSs. However, it, like all models, is a simplification of reality and so has weaknesses. The degree to which the model is acceptable and face valid to a broad range of stakeholders is not known. It almost certainly does not incorporate important parameters, nor does it represent phenomena with sufficient detail. Iteration with scientific and subject matter experts (including patients, families, and clinicians) to further refine the model would help to establish acceptability and face validity and ensure important parameters are represented in sufficient detail. Empirical calibration (the extent to which the inputs match the real world) is required, and empirical validation (comparison of the model and real world outputs) is unknown. In addition, it will be necessary to establish the model's construct validity by, for example, running virtual experiments to formally compare output when important parameters are varied and determining whether the results accord with theory‐based predictions. Finally, evaluation of the degree to which the model is, in fact, useful in strategic planning or design, as above, will be essential. Nevertheless, a CLHS computational model is a key theory‐building and hypothesis‐generating tool, allowing much greater insight into the possible mechanisms of action for CLHSs. With further development and validation, it can become a valuable resource for the wider scientific community to pursue previously infeasible studies to improve and scale CLHSs.
CONFLICT OF INTEREST
Michael Seid is an inventor of intellectual property licensed by CCHMC to Hive Networks, Inc., a for‐profit company that provides software and services to support CLHSs.
ACKNOWLEDGMENT
We are grateful to our colleagues who provided feedback and revisions to the manuscript.
Seid M, Bridgeland D, Bridgeland A, Hartley DM. A collaborative learning health system agent‐based model: Computational and face validity. Learn Health Sys. 2021;5:e10261. 10.1002/lrh2.10261
REFERENCES
- 1. McGlynn EA, Asch SM, Adams J, et al. The quality of health care delivered to adults in the United States. N Engl J Med. 2003;348(26):2635‐2645. [DOI] [PubMed] [Google Scholar]
- 2. Mangione‐Smith R, DeCristofaro AH, Setodji CM, et al. The quality of ambulatory care delivered to children in the United States. N Engl J Med. 2007;357(15):1515‐1523. [DOI] [PubMed] [Google Scholar]
- 3. Kohn LT, Corrigan JM, Donaldson MS, eds. To Err Is Human: Building a Safer Health System. Washington, DC: National Academy Press; 1999. [PubMed] [Google Scholar]
- 4. Leape LL. Error in medicine. JAMA. 1994;272(23):1851‐1857. [PubMed] [Google Scholar]
- 5. Makary MA, Daniel M. Medical error‐the third leading cause of death in the US. BMJ. 2016;353:i2139. [DOI] [PubMed] [Google Scholar]
- 6. Squires D, Anderson C. U.S. health care from a global perspective: spending, use of services, prices, and health in 13 countries. Issue Brief (Commonw Fund). 2015;15:1‐15. [PubMed] [Google Scholar]
- 7. Orszag PR, Ellis P, eds. The challenge of rising health care costs–a view from the congressional budget office. N Engl J Med. 2007;357(18):1793‐1795. [DOI] [PubMed] [Google Scholar]
- 8. Institute of Medicine Roundtable on Evidence‐Based Medicine . In: Olsen LA, Aisner D, JM MG, eds. The Learning Healthcare System: Workshop Summary. Washington, DC: National Academies Press; 2007. [PubMed] [Google Scholar]
- 9. Sheikh A. From learning healthcare systems to learning health systems. Learn Health Syst. 2020;4(3):e10216. [DOI] [PMC free article] [PubMed] [Google Scholar]
- 10. Friedman CP, Flynn AJ. Computable knowledge: an imperative for learning health systems. Learn Health Syst. 2019;3(4):e10203. [DOI] [PMC free article] [PubMed] [Google Scholar]
- 11. Muething SE, Goudie A, Schoettker PJ, et al. Quality improvement initiative to reduce serious safety events and improve patient safety culture. Pediatrics. 2012;130(2):e423‐431. [DOI] [PMC free article] [PubMed] [Google Scholar]
- 12. Anderson JB, Beekman RH III, Kugler JD, et al. Improvement in Interstage survival in a National Pediatric Cardiology Learning Network. Circ Cardiovasc Qual Outcomes. 2015;8(4):428‐436. [DOI] [PubMed] [Google Scholar]
- 13. Kaplan HC, Mangeot C, Sherman SN, et al. Dissemination of a quality improvement intervention to reduce early term elective deliveries and improve birth registry accuracy at scale in Ohio. Implementation Sci. 2015;10(1):A2. [Google Scholar]
- 14. Crandall WV, Margolis PA, Kappelman MD, et al. Improved outcomes in a quality improvement collaborative for pediatric inflammatory bowel disease. Pediatrics. 2012;129(4):e1030‐1041. [DOI] [PMC free article] [PubMed] [Google Scholar]
- 15. National Research Council . Behavioral Modeling and Simulation: From Individuals to Societies. Washington, DC: The National Academies Press; 2008. [Google Scholar]
- 16. Cioffi‐Revilla C. Computational social sciences. WIRES: Comput Stat. 2010;2(3):259‐271. [Google Scholar]
- 17. Miller J, Page S. Complex Adaptive Systems: an Introduction to Computational Models of Social Life. Princeton, NJ: Princeton University Press; 2007. [Google Scholar]
- 18. Hammond R. Considerations and best practices in agent‐based modeling to inform policy. In: Wallace R, Geller A, Ogawa V, eds. Assessing the Use of Agent‐Based Models for Tobacco Regulation. Washington, DC: National Academies Press; 2015. [PubMed] [Google Scholar]
- 19. Levine SS, Prietula MJ. Open collaboration for innovation: principles and performance. Organ Sci. 2014;25(5):1414‐1433. [Google Scholar]
- 20. Smith DL, Perkins TA, Reiner RC, et al. Recasting the theory of mosquito‐borne pathogen transmission dynamics and control. Trans R Soc Trop Med Hyg. 2014;108(4):185‐197. [DOI] [PMC free article] [PubMed] [Google Scholar]
- 21. Barker CM, Niu TC, Reisen WK, Hartley DM. Data‐driven modeling to assess receptivity for Rift Valley fever virus. PLoS Negl Trop Dis. 2013;7(11):e2515. [DOI] [PMC free article] [PubMed] [Google Scholar]
- 22. Committee on the Assessment of Agent‐Based Models to Inform Tobacco Product Regulation; Board on Population Health and Public Health Practice . Assessing the Use of Agent‐Based Models for Tobacco Requlation. Washington, DC: National Academies Press; 2015. [PubMed] [Google Scholar]
- 23. Fowler JH, Christakis NA. Cooperative behavior cascades in human social networks. Proc Natl Acad Sci U S A. 2010;107(12):5334‐5338. [DOI] [PMC free article] [PubMed] [Google Scholar]
- 24. Britto M, Fuller S, Kaplan HC, et al. Using a networked organizational architecture to support the development of learning healthcare systems. BMJ Qual Saf. 2018;27(11):937–946. [DOI] [PMC free article] [PubMed] [Google Scholar]
- 25. Seid M, Hartley D, Dellal G, Myers S, Margolis P. Organizing for collaboration: an actor‐oriented architecture in ImproveCareNow. Learn Health Syst. 2020;4:e10205. [DOI] [PMC free article] [PubMed] [Google Scholar]
- 26. Sackett D. Evidence‐based medicine. Lancet. 1995;346(8983):1171‐1172. [PubMed] [Google Scholar]
- 27. Rosenberg W, Donald A. Evidence based medicine: an approach to clinical problem‐solving. BMJ. 1995;310(6987):1122‐1126. [DOI] [PMC free article] [PubMed] [Google Scholar]
- 28. Wagner EH, Austin BT, Davis C, Hindmarsh M, Schaefer J, Bonomi A. Improving chronic illness care: translating evidence into action. Health Aff. 2001;20(6):64‐78. [DOI] [PubMed] [Google Scholar]
- 29. Batalden M, Batalden P, Margolis P, et al. Coproduction of healthcare service. BMJ Qual Saf. 2016;25(7):509‐517. [DOI] [PMC free article] [PubMed] [Google Scholar]
- 30. Hartley D, Keck C, Havens M, Margolis P, Seid M. Measuring engagement in a collaborative learning health system: the case of ImproveCareNow. Learn Health Syst. 2020;e10225. [DOI] [PMC free article] [PubMed] [Google Scholar]
- 31. Fox S. After Dr Google: peer‐to‐peer health care. Pediatrics. 2013;131(Suppl 4):S224‐225. [DOI] [PubMed] [Google Scholar]
- 32. Fox S. The Social Life of Health Information. Washington, DC: Pew Research Center; 2011. [Google Scholar]
- 33. Katz MS, Staley AC, Attai DJA. History of #BCSM and insights for patient‐centered online interaction and engagement. J Patient Cent Res Rev. 2020;7(4):304‐312. [DOI] [PMC free article] [PubMed] [Google Scholar]
- 34. Edwards PB, Rea JB, Oermann MH, et al. Effect of peer‐to‐peer nurse‐physician collaboration on attitudes toward the nurse‐physician relationship. J Nurses Prof Dev. 2017;33(1):13‐18. [DOI] [PubMed] [Google Scholar]
- 35. Kaplan HC, Provost LP, Froehle CM, Margolis PA. The model for understanding success in quality (MUSIQ): building a theory of context in healthcare quality improvement. BMJ Qual Saf. 2012;21(1):13‐20. [DOI] [PubMed] [Google Scholar]
- 36. Li J, Hinami K, Hansen LO, Maynard G, Budnitz T, Williams MV. The physician mentored implementation model: a promising quality improvement framework for health care change. Acad Med. 2015;90(3):303‐310. [DOI] [PubMed] [Google Scholar]
- 37. Sterman J. Business Dynamics. Boston, MA: Irwin/McGraw‐Hill c2000; 2010. [Google Scholar]
- 38. Wilensky U, Rand W. An Introduction to Agent‐based Modeling: Modeling Natural, Social, and Engineered Complex Systems with NetLogo. Cambridge, MA: MIT Press; 2015. [Google Scholar]
- 39. Bridgeland DM, Zahavi R. Business Modeling: A Practical Guide to Realizing Business Value. Burlington, MA: Morgan Kaufmann; 2008. [Google Scholar]
- 40. Kazil J, Masad D, Crooks A. Utilizing python for agent‐based modeling: the Mesa framework. Paper presented at: social, cultural, and behavioral modeling: 13th international conference SBP‐BRIMS2020; Washington, DC.
- 41. Plotly Technologies Inc . Collaborative data science 2015; https://plot.ly. Accessed July 5, 2020.
- 42. Ross R. The Prevention of Malaria. 2nd ed. London, England: John Murray; 1911. [Google Scholar]
- 43. Prochaska JJ, DiClemente CC. The transtheoretical approach. In: Norcross JC, Goldfied MR, eds. Handbook of Psychotherapy Integration. Oxford: Oxford University Press; 2005:147‐171. [Google Scholar]
- 44. Damschroder LJ, Lowery JC. Evaluation of a large‐scale weight management program using the consolidated framework for implementation research (CFIR). Implement Sci. 2013;8:51. [DOI] [PMC free article] [PubMed] [Google Scholar]
- 45. Lannon C, Schuler CL, Seid M, et al. A maturity grid assessment tool for learning networks. Learn Health Syst. 2020;e10232. 10.1002/lrh2.10232. [DOI] [PMC free article] [PubMed] [Google Scholar]


